


Languages
Pages
Legal

PT. (PERSERO) PELABUHAN INDONESIA III JL. TANJUNG PERAK TIMUR 610, SURABAYA 60165

REPORT OF ENVIRONMENTAL IMPACT STATEMENT 1-1
Environmental Impact Assessment – Tanjung Perak Port Development in Lamong Bay
1.1. Background
Tanjung Perak Port is definitely the second largest port in Indonesia and
extremely potential to support the traffic of goods from and to the Eastern
territory of Indonesia. Due to the getting increasing activities in Tanjung Perak
Port, PT. (Persero) Pelabuhan Indonesia III plans to develop facilities in
Tanjung Perak Port. In the mean time, the area required for such port
development is obviously limited. Accordingly, it is planned to develop the
port facilities in Lamong Bay.
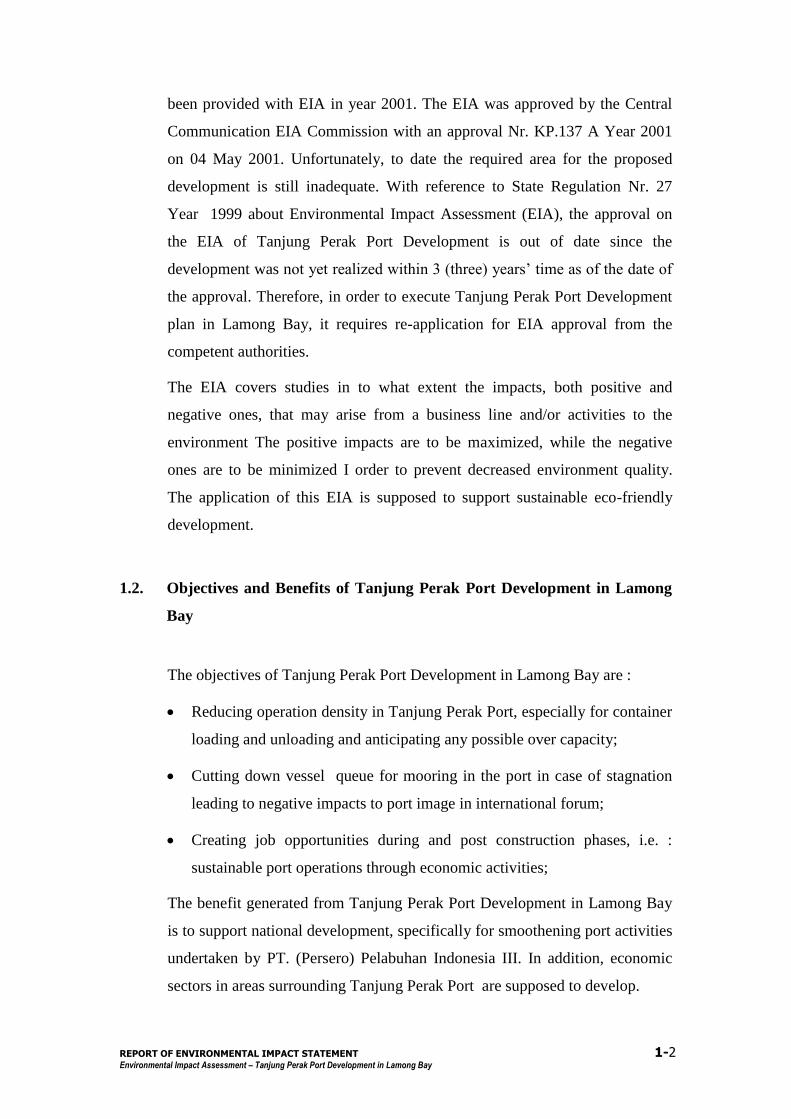
Tanjung Perak Port development in Lamong Bay is exclusively for container
terminal construction for anticipating the getting increasing container
transportation activities due to global market demands.
With reference to the Regulation of State Minister of Environment Nr. 11 Year
2006 about Business Line and/or Activities to be provided with Environment
Impact Assessment (EIA), the Tanjung Perak Port Development in Lamong
Bay is to be provided with EIA. In view of the aforementioned, in attempt to
develop Tanjung Perak Port in Lamong Bay, it is provided with EIA that has
REPORT OF ENVIRONMENTAL IMPACT STATEMENT 1-2
Environmental Impact Assessment – Tanjung Perak Port Development in Lamong Bay
been provided with EIA in year 2001. The EIA was approved by the Central
Communication EIA Commission with an approval Nr. KP.137 A Year 2001
on 04 May 2001. Unfortunately, to date the required area for the proposed
development is still inadequate. With reference to State Regulation Nr. 27
Year 1999 about Environmental Impact Assessment (EIA), the approval on
the EIA of Tanjung Perak Port Development is out of date since the
development was not yet realized within 3 (three) years‟ time as of the date of
the approval. Therefore, in order to execute Tanjung Perak Port Development
plan in Lamong Bay, it requires re-application for EIA approval from the
competent authorities.
The EIA covers studies in to what extent the impacts, both positive and
negative ones, that may arise from a business line and/or activities to the
environment The positive impacts are to be maximized, while the negative
ones are to be minimized I order to prevent decreased environment quality.
The application of this EIA is supposed to support sustainable eco-friendly
development.
1.2. Objectives and Benefits of Tanjung Perak Port Development in Lamong
Bay
The objectives of Tanjung Perak Port Development in Lamong Bay are :
Reducing operation density in Tanjung Perak Port, especially for container
loading and unloading and anticipating any possible over capacity;
Cutting down vessel queue for mooring in the port in case of stagnation
leading to negative impacts to port image in international forum;
Creating job opportunities during and post construction phases, i.e. :
sustainable port operations through economic activities;
The benefit generated from Tanjung Perak Port Development in Lamong Bay
is to support national development, specifically for smoothening port activities
undertaken by PT. (Persero) Pelabuhan Indonesia III. In addition, economic
sectors in areas surrounding Tanjung Perak Port are supposed to develop.
REPORT OF ENVIRONMENTAL IMPACT STATEMENT 1-3
Environmental Impact Assessment – Tanjung Perak Port Development in Lamong Bay
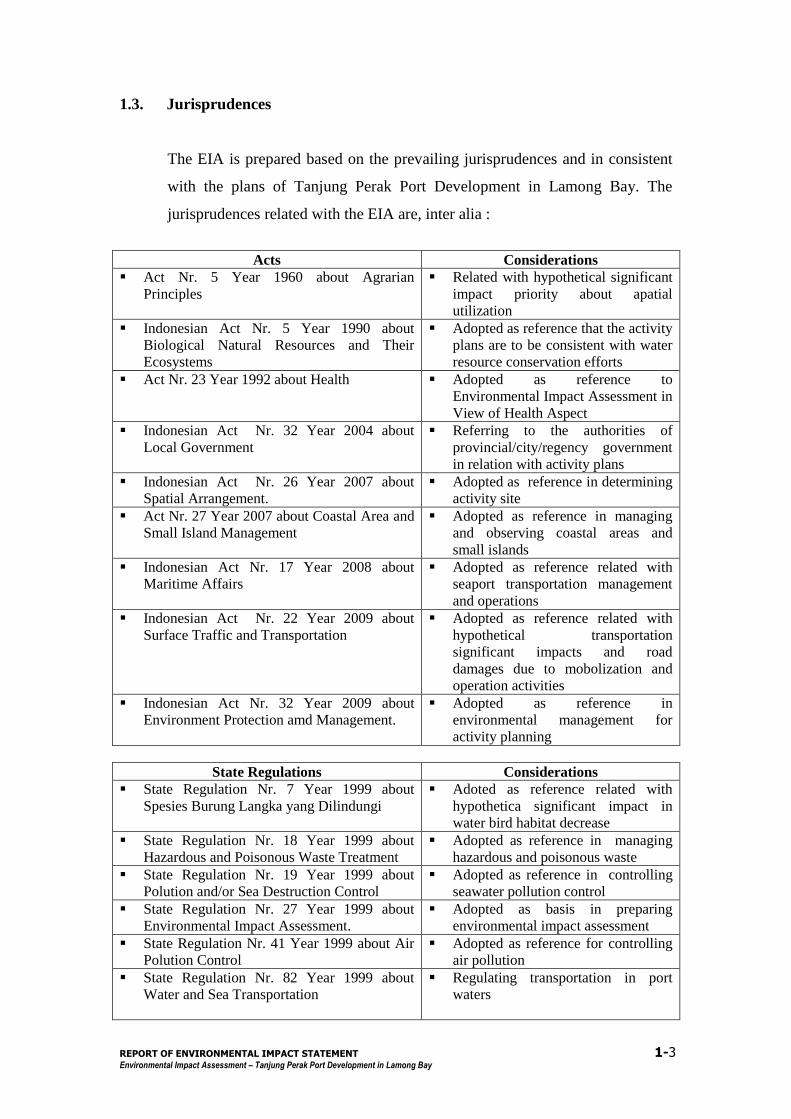
1.3. Jurisprudences
The EIA is prepared based on the prevailing jurisprudences and in consistent
with the plans of Tanjung Perak Port Development in Lamong Bay. The
jurisprudences related with the EIA are, inter alia :
Acts Considerations
Act Nr. 5 Year 1960 about Agrarian
Principles
Related with hypothetical significant
impact priority about apatial
utilization
Indonesian Act Nr. 5 Year 1990 about
Biological Natural Resources and Their
Ecosystems
Adopted as reference that the activity
plans are to be consistent with water
resource conservation efforts
Act Nr. 23 Year 1992 about Health Adopted as reference to
Environmental Impact Assessment in
View of Health Aspect
Indonesian Act Nr. 32 Year 2004 about
Local Government
Referring to the authorities of
provincial/city/regency government
in relation with activity plans
Indonesian Act Nr. 26 Year 2007 about
Spatial Arrangement.
Adopted as reference in determining
activity site
Act Nr. 27 Year 2007 about Coastal Area and
Small Island Management
Adopted as reference in managing
and observing coastal areas and
small islands
Indonesian Act Nr. 17 Year 2008 about
Maritime Affairs
Adopted as reference related with
seaport transportation management
and operations
Indonesian Act Nr. 22 Year 2009 about
Surface Traffic and Transportation
Adopted as reference related with
hypothetical transportation
significant impacts and road
damages due to mobolization and
operation activities
Indonesian Act Nr. 32 Year 2009 about
Environment Protection amd Management.
Adopted as reference in
environmental management for
activity planning
State Regulations Considerations
State Regulation Nr. 7 Year 1999 about
Spesies Burung Langka yang Dilindungi
Adoted as reference related with
hypothetica significant impact in
water bird habitat decrease
State Regulation Nr. 18 Year 1999 about
Hazardous and Poisonous Waste Treatment
Adopted as reference in managing
hazardous and poisonous waste
State Regulation Nr. 19 Year 1999 about
Polution and/or Sea Destruction Control
Adopted as reference in controlling
seawater pollution control
State Regulation Nr. 27 Year 1999 about
Environmental Impact Assessment.
Adopted as basis in preparing
environmental impact assessment
State Regulation Nr. 41 Year 1999 about Air
Polution Control
Adopted as reference for controlling
air pollution
State Regulation Nr. 82 Year 1999 about
Water and Sea Transportation
Regulating transportation in port
waters
REPORT OF ENVIRONMENTAL IMPACT STATEMENT 1-4
Environmental Impact Assessment – Tanjung Perak Port Development in Lamong Bay
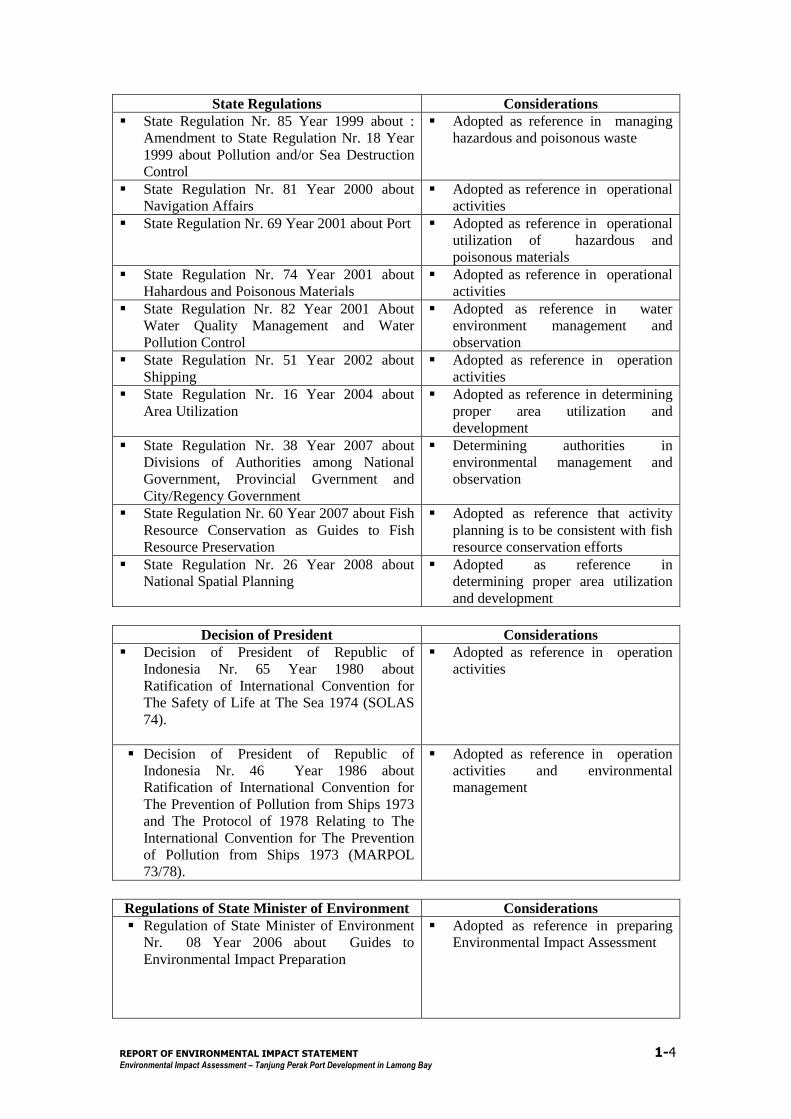
State Regulations Considerations
State Regulation Nr. 85 Year 1999 about :
Amendment to State Regulation Nr. 18 Year
1999 about Pollution and/or Sea Destruction
Control
Adopted as reference in managing
hazardous and poisonous waste
State Regulation Nr. 81 Year 2000 about
Navigation Affairs
Adopted as reference in operational
activities
State Regulation Nr. 69 Year 2001 about Port Adopted as reference in operational
utilization of hazardous and
poisonous materials
State Regulation Nr. 74 Year 2001 about
Hahardous and Poisonous Materials
Adopted as reference in operational
activities
State Regulation Nr. 82 Year 2001 About
Water Quality Management and Water
Pollution Control
Adopted as reference in water
environment management and
observation
State Regulation Nr. 51 Year 2002 about
Shipping
Adopted as reference in operation
activities
State Regulation Nr. 16 Year 2004 about
Area Utilization
Adopted as reference in determining
proper area utilization and
development
State Regulation Nr. 38 Year 2007 about
Divisions of Authorities among National
Government, Provincial Gvernment and
City/Regency Government
Determining authorities in
environmental management and
observation
State Regulation Nr. 60 Year 2007 about Fish
Resource Conservation as Guides to Fish
Resource Preservation
Adopted as reference that activity
planning is to be consistent with fish
resource conservation efforts
State Regulation Nr. 26 Year 2008 about
National Spatial Planning
Adopted as reference in
determining proper area utilization
and development
Decision of President Considerations
Decision of President of Republic of
Indonesia Nr. 65 Year 1980 about
Ratification of International Convention for
The Safety of Life at The Sea 1974 (SOLAS
74).
Adopted as reference in operation
activities
Decision of President of Republic of
Indonesia Nr. 46 Year 1986 about
Ratification of International Convention for
The Prevention of Pollution from Ships 1973
and The Protocol of 1978 Relating to The
International Convention for The Prevention
of Pollution from Ships 1973 (MARPOL
73/78).
Adopted as reference in operation
activities and environmental
management
Regulations of State Minister of Environment Considerations
Regulation of State Minister of Environment
Nr. 08 Year 2006 about Guides to
Environmental Impact Preparation
Adopted as reference in preparing
Environmental Impact Assessment
REPORT OF ENVIRONMENTAL IMPACT STATEMENT 1-5
Environmental Impact Assessment – Tanjung Perak Port Development in Lamong Bay
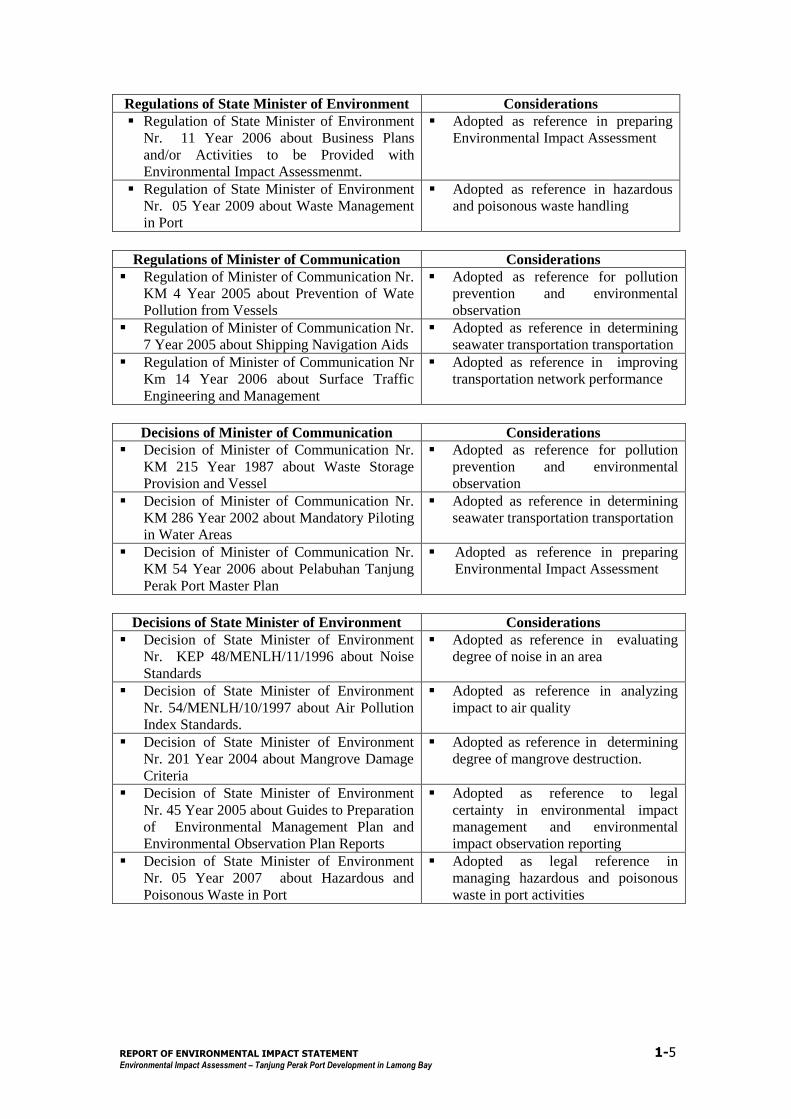
Regulations of State Minister of Environment Considerations
Regulation of State Minister of Environment
Nr. 11 Year 2006 about Business Plans
and/or Activities to be Provided with
Environmental Impact Assessmenmt.
Adopted as reference in preparing
Environmental Impact Assessment
Regulation of State Minister of Environment
Nr. 05 Year 2009 about Waste Management
in Port
Adopted as reference in hazardous
and poisonous waste handling
Regulations of Minister of Communication Considerations
Regulation of Minister of Communication Nr.
KM 4 Year 2005 about Prevention of Wate
Pollution from Vessels
Adopted as reference for pollution
prevention and environmental
observation
Regulation of Minister of Communication Nr.
7 Year 2005 about Shipping Navigation Aids
Adopted as reference in determining
seawater transportation transportation
Regulation of Minister of Communication Nr
Km 14 Year 2006 about Surface Traffic
Engineering and Management
Adopted as reference in improving
transportation network performance
Decisions of Minister of Communication Considerations
Decision of Minister of Communication Nr.
KM 215 Year 1987 about Waste Storage
Provision and Vessel
Adopted as reference for pollution
prevention and environmental
observation
Decision of Minister of Communication Nr.
KM 286 Year 2002 about Mandatory Piloting
in Water Areas
Adopted as reference in determining
seawater transportation transportation
Decision of Minister of Communication Nr.
KM 54 Year 2006 about Pelabuhan Tanjung
Perak Port Master Plan
Adopted as reference in preparing
Environmental Impact Assessment
Decisions of State Minister of Environment Considerations
Decision of State Minister of Environment
Nr. KEP 48/MENLH/11/1996 about Noise
Standards
Adopted as reference in evaluating
degree of noise in an area
Decision of State Minister of Environment
Nr. 54/MENLH/10/1997 about Air Pollution
Index Standards.
Adopted as reference in analyzing
impact to air quality
Decision of State Minister of Environment
Nr. 201 Year 2004 about Mangrove Damage
Criteria
Adopted as reference in determining
degree of mangrove destruction.
Decision of State Minister of Environment
Nr. 45 Year 2005 about Guides to Preparation
of Environmental Management Plan and
Environmental Observation Plan Reports
Adopted as reference to legal
certainty in environmental impact
management and environmental
impact observation reporting
Decision of State Minister of Environment
Nr. 05 Year 2007 about Hazardous and
Poisonous Waste in Port
Adopted as legal reference in
managing hazardous and poisonous
waste in port activities
REPORT OF ENVIRONMENTAL IMPACT STATEMENT 1-6
Environmental Impact Assessment – Tanjung Perak Port Development in Lamong Bay
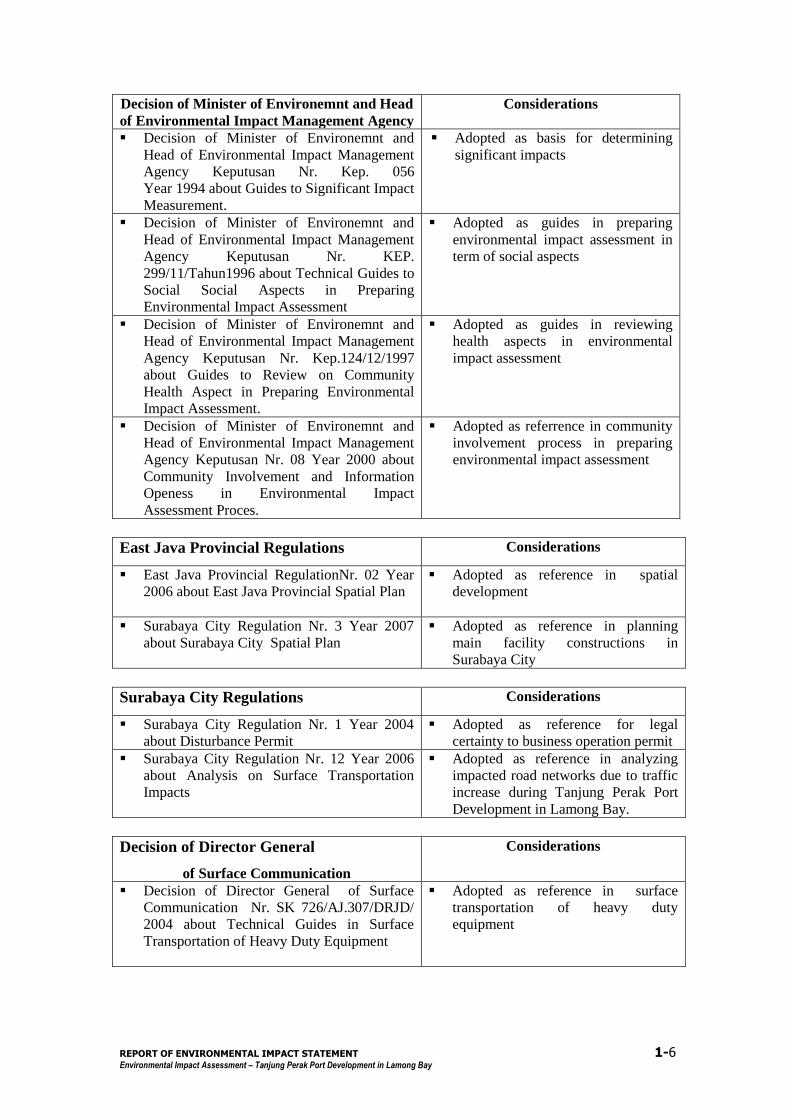
Decision of Minister of Environemnt and Head
of Environmental Impact Management Agency
Considerations
Decision of Minister of Environemnt and
Head of Environmental Impact Management
Agency Keputusan Nr. Kep. 056
Year 1994 about Guides to Significant Impact
Measurement.
Adopted as basis for determining
significant impacts
Decision of Minister of Environemnt and
Head of Environmental Impact Management
Agency Keputusan Nr. KEP.
299/11/Tahun1996 about Technical Guides to
Social Social Aspects in Preparing
Environmental Impact Assessment
Adopted as guides in preparing
environmental impact assessment in
term of social aspects
Decision of Minister of Environemnt and
Head of Environmental Impact Management
Agency Keputusan Nr. Kep.124/12/1997
about Guides to Review on Community
Health Aspect in Preparing Environmental
Impact Assessment.
Adopted as guides in reviewing
health aspects in environmental
impact assessment
Decision of Minister of Environemnt and
Head of Environmental Impact Management
Agency Keputusan Nr. 08 Year 2000 about
Community Involvement and Information
Openess in Environmental Impact
Assessment Proces.
Adopted as referrence in community
involvement process in preparing
environmental impact assessment
East Java Provincial Regulations Considerations
East Java Provincial RegulationNr. 02 Year
2006 about East Java Provincial Spatial Plan
Adopted as reference in spatial
development
Surabaya City Regulation Nr. 3 Year 2007
about Surabaya City Spatial Plan
Adopted as reference in planning
main facility constructions in
Surabaya City
Surabaya City Regulations Considerations
Surabaya City Regulation Nr. 1 Year 2004
about Disturbance Permit
Adopted as reference for legal
certainty to business operation permit
Surabaya City Regulation Nr. 12 Year 2006
about Analysis on Surface Transportation
Impacts
Adopted as reference in analyzing
impacted road networks due to traffic
increase during Tanjung Perak Port
Development in Lamong Bay.
Decision of Director General
of Surface Communication
Considerations
Decision of Director General of Surface
Communication Nr. SK 726/AJ.307/DRJD/
2004 about Technical Guides in Surface
Transportation of Heavy Duty Equipment
Adopted as reference in surface
transportation of heavy duty
equipment
REPORT OF ENVIRONMENTAL IMPACT STATEMENT 1-7
Environmental Impact Assessment – Tanjung Perak Port Development in Lamong Bay
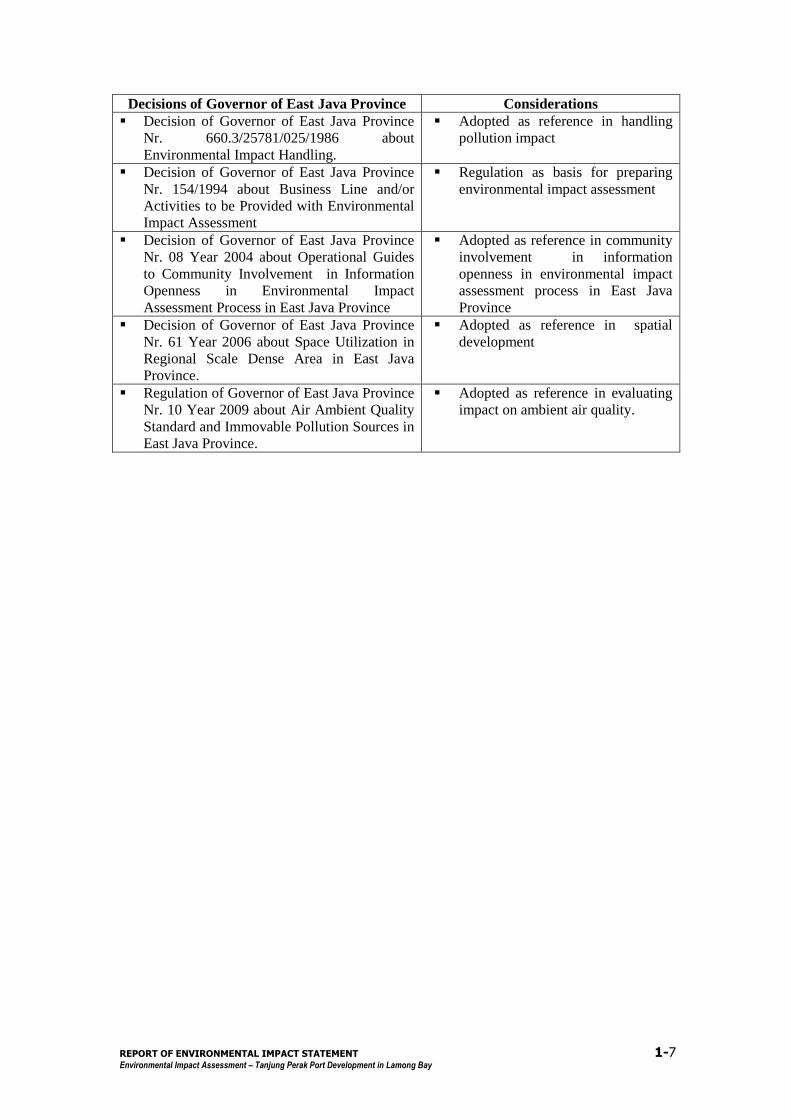
Decisions of Governor of East Java Province Considerations
Decision of Governor of East Java Province
Nr. 660.3/25781/025/1986 about
Environmental Impact Handling.
Adopted as reference in handling
pollution impact
Decision of Governor of East Java Province
Nr. 154/1994 about Business Line and/or
Activities to be Provided with Environmental
Impact Assessment
Regulation as basis for preparing
environmental impact assessment
Decision of Governor of East Java Province
Nr. 08 Year 2004 about Operational Guides
to Community Involvement in Information
Openness in Environmental Impact
Assessment Process in East Java Province
Adopted as reference in community
involvement in information
openness in environmental impact
assessment process in East Java
Province
Decision of Governor of East Java Province
Nr. 61 Year 2006 about Space Utilization in
Regional Scale Dense Area in East Java
Province.
Adopted as reference in spatial
development
Regulation of Governor of East Java Province
Nr. 10 Year 2009 about Air Ambient Quality
Standard and Immovable Pollution Sources in
East Java Province.
Adopted as reference in evaluating
impact on ambient air quality.
REPORT OF ENVIRONMENTAL IMPACT STATEMENT 2-1
Environmental Impact Assessment – Tanjung Perak Port Development in Lamong Bay
G2
2.1. Identities of Initiator and Inevironmental Impact Statement Author
2.1.1. Initiator
Name : Director of Marketing and Business Development
PT. (Persero) Pelabuhan Indonesia III
Address : Jl. Perak Timur No. 610 – Surabaya (60165)
Telephone : (031) 3298631 though (031) 3298637
Person in Charge : Robert H. Sianipar
Initiator : PT. (Persero) Pelabuhan Indonesia III
2.1.2. Environmental Impact Statement Author
Name : PT. Konindo Timur Utama & PT. ITS Kemitraan - JO
Address : PT. Konindo Timur Utama
Jl. Perum YKP Rungkut Lor IIB-1 Surabaya (60293)
PT. ITS Kemitraan
Graha ITS Lt.2 Jl. Raya ITS Surabaya
Telephone : (031) 8710838
REPORT OF ENVIRONMENTAL IMPACT STATEMENT 2-2
Environmental Impact Assessment – Tanjung Perak Port Development in Lamong Bay
Person in Charge : Rahmat Yuli Artono
Address : PT. Konindo Timur Utama
Jl. Perum YKP Rungkut Lor II B-1 Surabaya (60293)
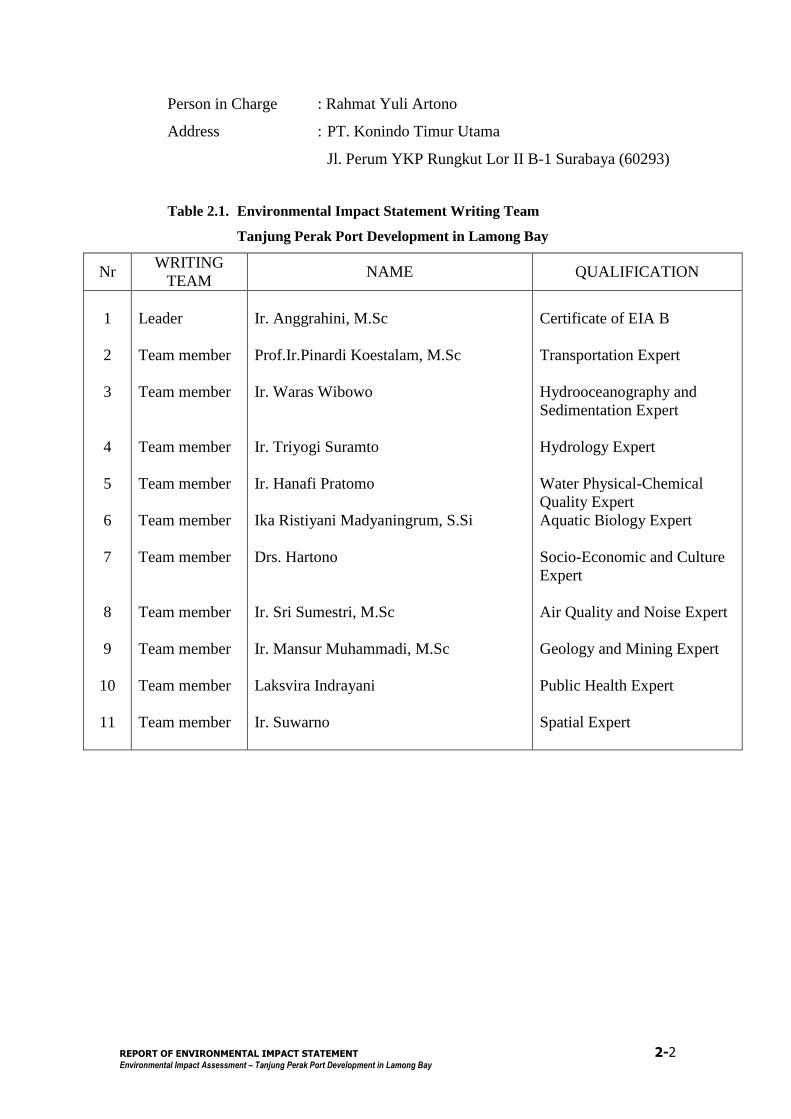
Table 2.1. Environmental Impact Statement Writing Team
Tanjung Perak Port Development in Lamong Bay
Nr WRITING
TEAM NAME QUALIFICATION
1
2
3
4
5
6
7
8
9
10
11
Leader
Team member
Team member
Team member
Team member
Team member
Team member
Team member
Team member
Team member
Team member
Ir. Anggrahini, M.Sc
Prof.Ir.Pinardi Koestalam, M.Sc
Ir. Waras Wibowo
Ir. Triyogi Suramto
Ir. Hanafi Pratomo
Ika Ristiyani Madyaningrum, S.Si
Drs. Hartono
Ir. Sri Sumestri, M.Sc
Ir. Mansur Muhammadi, M.Sc
Laksvira Indrayani
Ir. Suwarno
Certificate of EIA B
Transportation Expert
Hydrooceanography and
Sedimentation Expert
Hydrology Expert
Water Physical-Chemical
Quality Expert
Aquatic Biology Expert
Socio-Economic and Culture
Expert
Air Quality and Noise Expert
Geology and Mining Expert
Public Health Expert
Spatial Expert
REPORT OF ENVIRONMENTAL IMPACT STATEMENT 2-3
Environmental Impact Assessment – Tanjung Perak Port Development in Lamong Bay
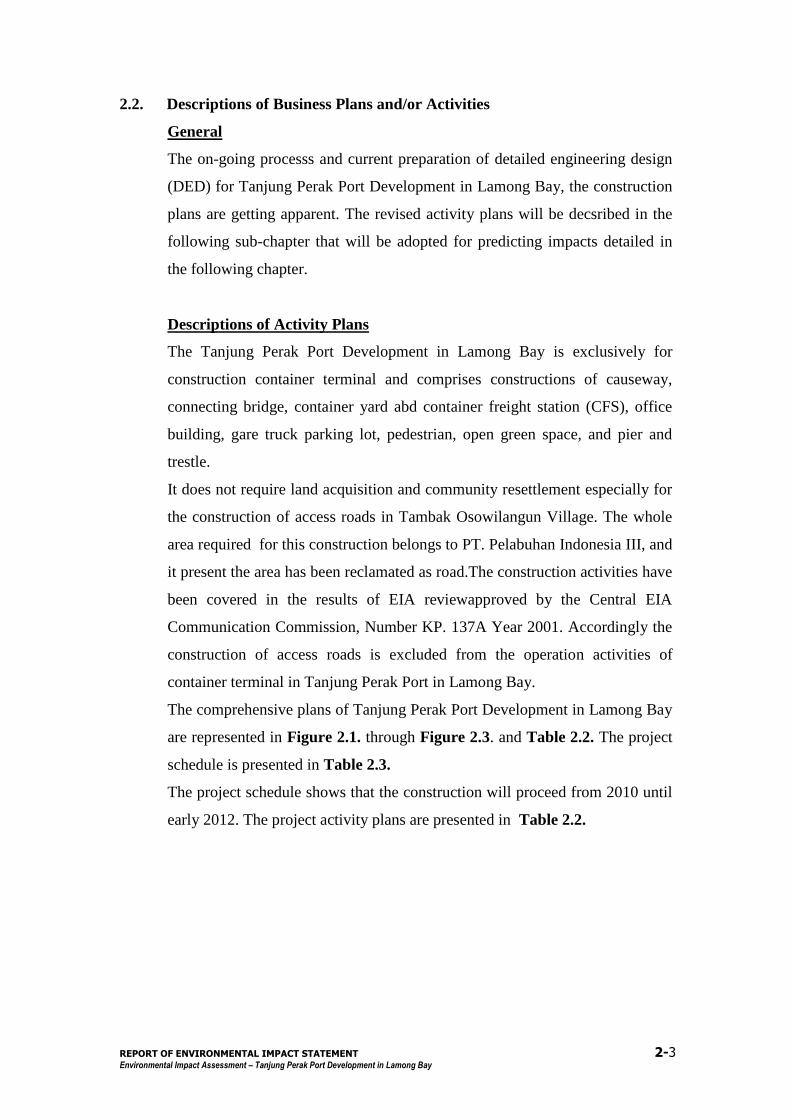
2.2. Descriptions of Business Plans and/or Activities
General
The on-going processs and current preparation of detailed engineering design
(DED) for Tanjung Perak Port Development in Lamong Bay, the construction
plans are getting apparent. The revised activity plans will be decsribed in the
following sub-chapter that will be adopted for predicting impacts detailed in
the following chapter.
Descriptions of Activity Plans
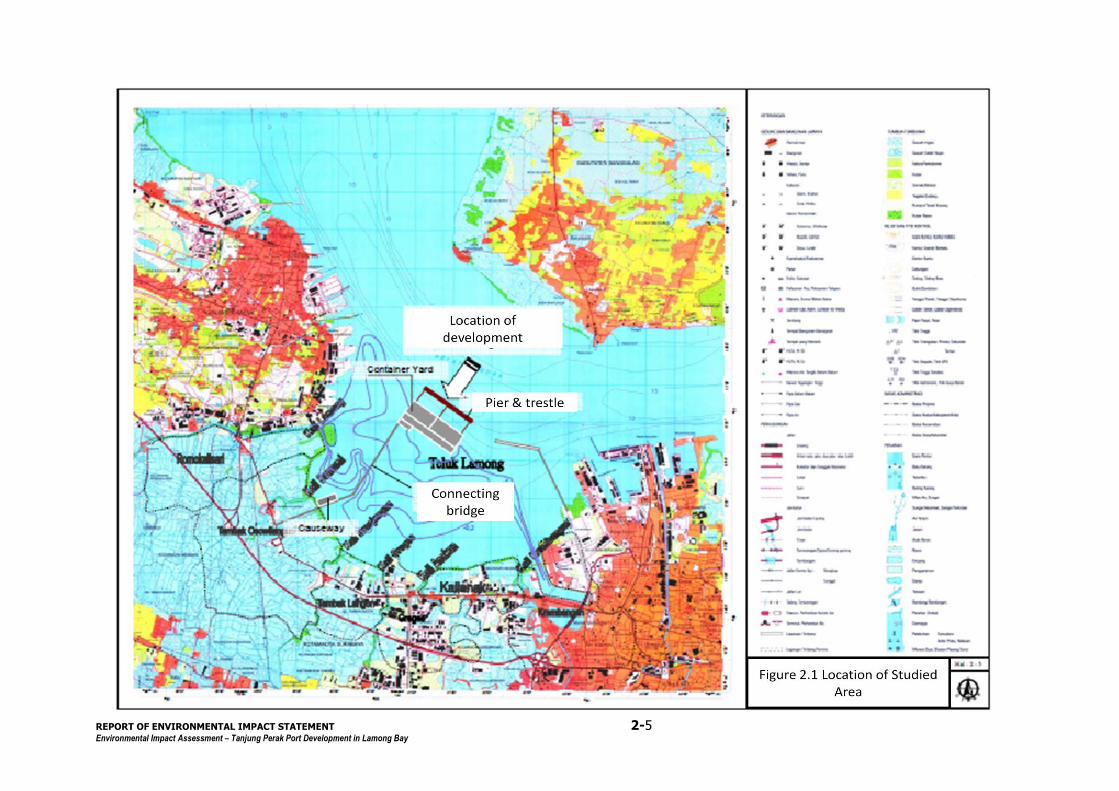
The Tanjung Perak Port Development in Lamong Bay is exclusively for
construction container terminal and comprises constructions of causeway,
connecting bridge, container yard abd container freight station (CFS), office
building, gare truck parking lot, pedestrian, open green space, and pier and
trestle.
It does not require land acquisition and community resettlement especially for
the construction of access roads in Tambak Osowilangun Village. The whole
area required for this construction belongs to PT. Pelabuhan Indonesia III, and
it present the area has been reclamated as road.The construction activities have
been covered in the results of EIA reviewapproved by the Central EIA
Communication Commission, Number KP. 137A Year 2001. Accordingly the
construction of access roads is excluded from the operation activities of
container terminal in Tanjung Perak Port in Lamong Bay.
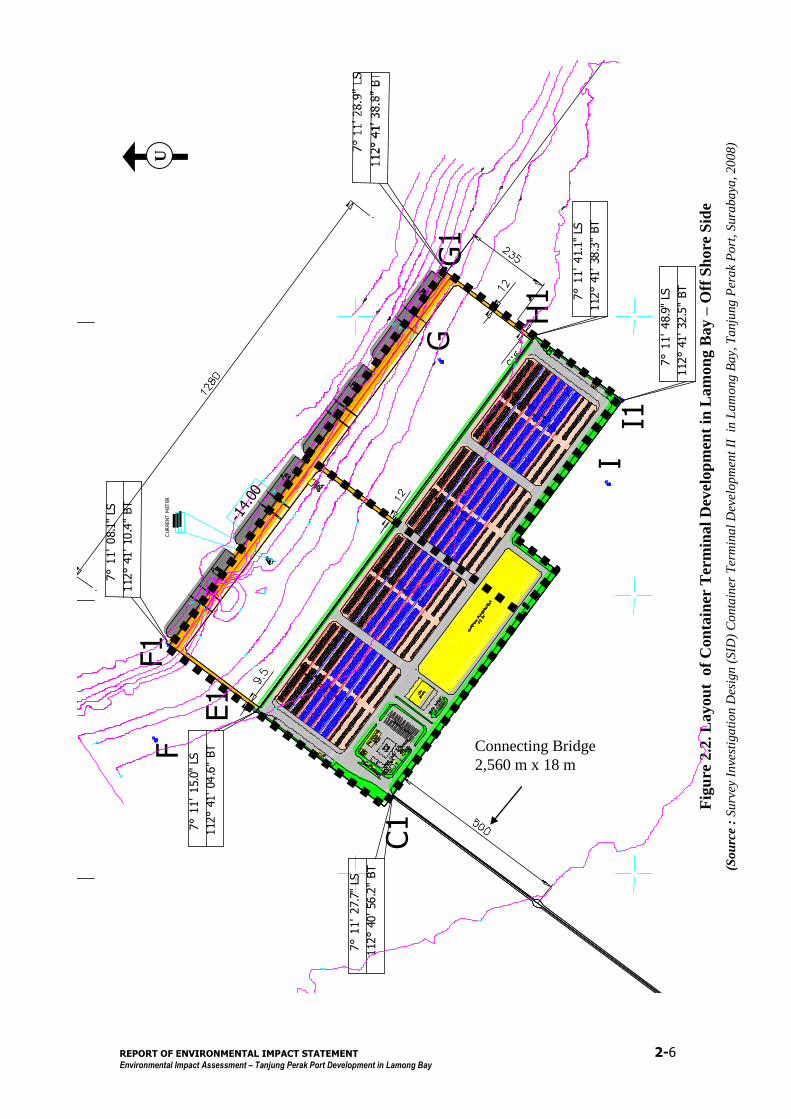
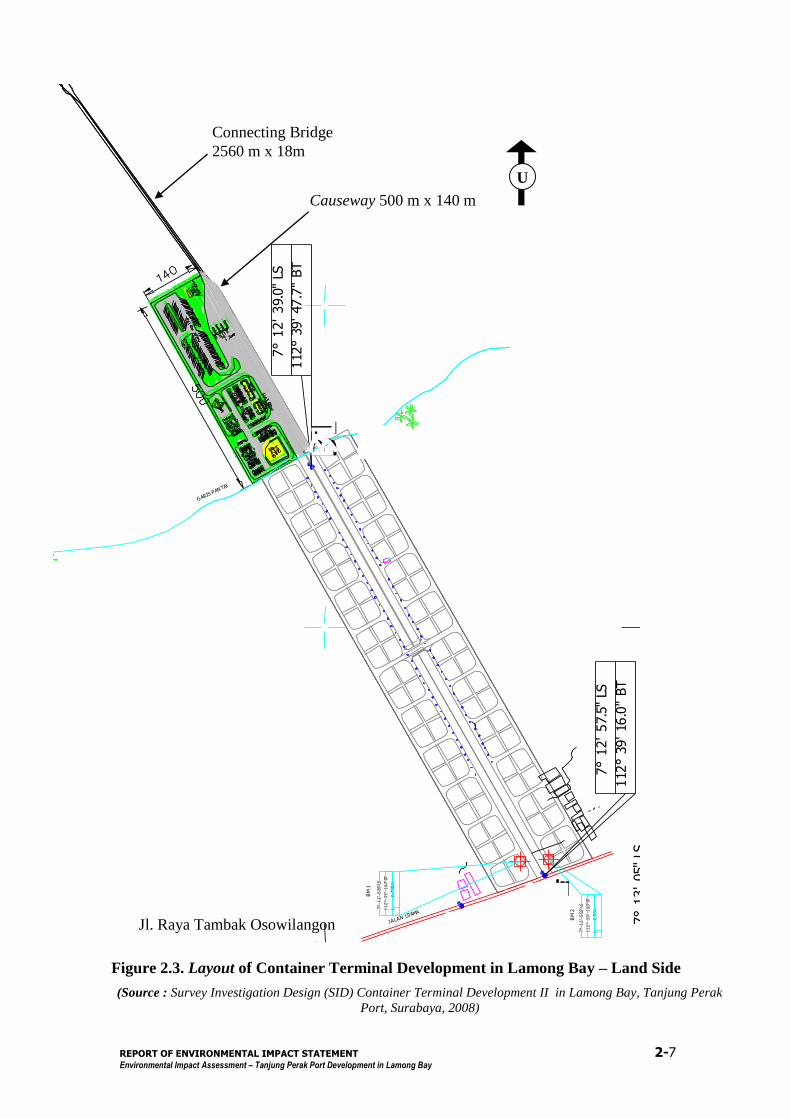
The comprehensive plans of Tanjung Perak Port Development in Lamong Bay
are represented in Figure 2.1. through Figure 2.3. and Table 2.2. The project
schedule is presented in Table 2.3.
The project schedule shows that the construction will proceed from 2010 until
early 2012. The project activity plans are presented in Table 2.2.
REPORT OF ENVIRONMENTAL IMPACT STATEMENT 2-4
Environmental Impact Assessment – Tanjung Perak Port Development in Lamong Bay
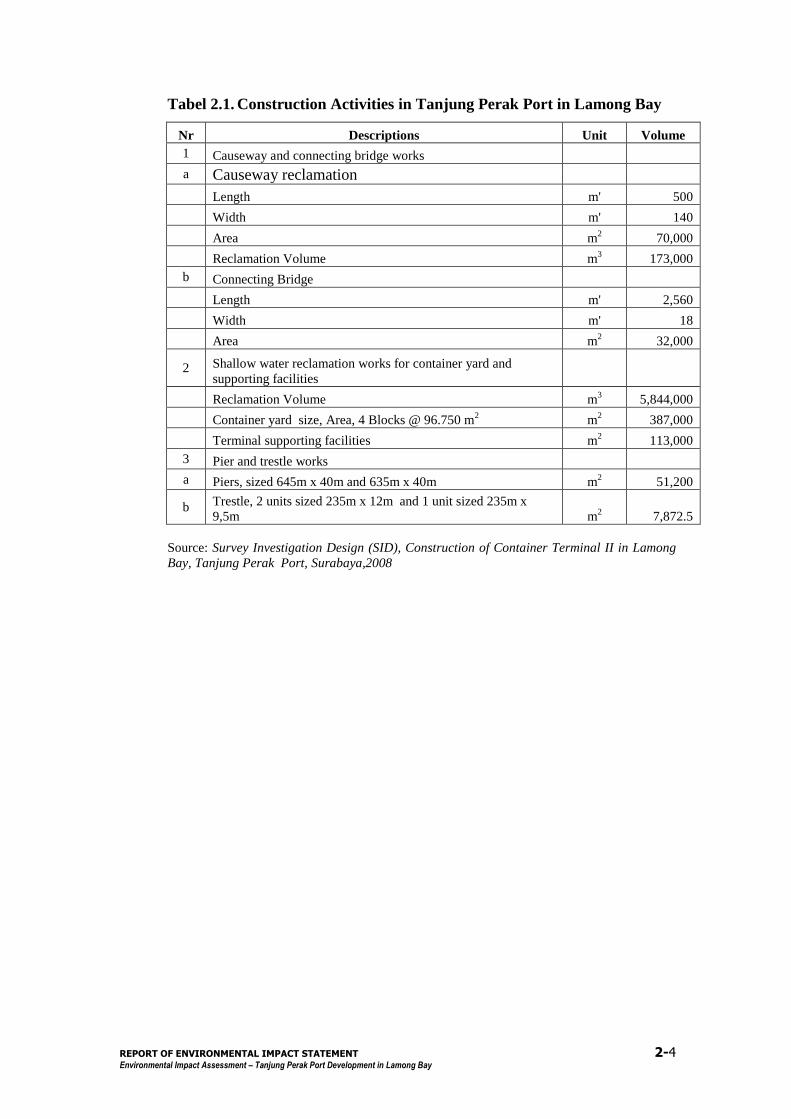
Tabel 2.1. Construction Activities in Tanjung Perak Port in Lamong Bay
Nr Descriptions Unit Volume
1 Causeway and connecting bridge works
a Causeway reclamation
Length m' 500
Width m' 140
Area m2 70,000
Reclamation Volume m3 173,000
b Connecting Bridge
Length m' 2,560
Width m' 18
Area m2 32,000
2 Shallow water reclamation works for container yard and
supporting facilities
Reclamation Volume m3 5,844,000
Container yard size, Area, 4 Blocks @ 96.750 m2 m
2 387,000
Terminal supporting facilities m2 113,000
3 Pier and trestle works
a Piers, sized 645m x 40m and 635m x 40m m2 51,200
b Trestle, 2 units sized 235m x 12m and 1 unit sized 235m x
9,5m m2 7,872.5
Source: Survey Investigation Design (SID), Construction of Container Terminal II in Lamong
Bay, Tanjung Perak Port, Surabaya,2008
REPORT OF ENVIRONMENTAL IMPACT STATEMENT 2-5
Environmental Impact Assessment – Tanjung Perak Port Development in Lamong Bay
REPORT OF ENVIRONMENTAL IMPACT STATEMENT 2-6
Environmental Impact Assessment – Tanjung Perak Port Development in Lamong Bay
Fig
ure
2.2
. L
ayou
t o
f C
on
tain
er T
erm
inal
Dev
elo
pm
ent
in L
am
on
g B
ay –
Off
Sh
ore
Sid
e
(So
urc
e :
Su
rvey
In
vest
iga
tio
n D
esig
n (
SID
) C
on
tain
er T
erm
ina
l D
evel
op
men
t II
in
La
mon
g B
ay,
Ta
nju
ng
Per
ak
Po
rt, S
ura
ba
ya,
20
08
)
U
Connecting Bridge
2,560 m x 18 m
H
40' 50''
41' 15''
41' 40''
42' 05''
7° 1
1' 08.1
" LS
112°
41' 10.4
" BT
F
G
-14.
00
G1
F1
CUR
RENT
MET
ER
I
C1
E1
7° 1
1' 15.0
" LS
112°
41' 04.6
" BT
7° 1
1' 27.7
" LS
112°
40' 56.2
" BT
H1
I1
7° 1
1' 41.1
" LS
112°
41' 38.3
" BT
7° 1
1' 48.9
" LS
112°
41' 32.5
" BT
REPORT OF ENVIRONMENTAL IMPACT STATEMENT 2-7
Environmental Impact Assessment – Tanjung Perak Port Development in Lamong Bay
112° 39' 10'' BT
7° 1
3' 05''
LS
12'4
0''
39' 35''
9202000
z2.7
98 m
BM
2
BM
1
G ARIS PAN
TAI
JALAN UTAMA
7° 1
2'
53.6"
LS
112° 3
9'
16.4"
BT
z2.9
3 m
7° 1
2'
55.6"
LS
112° 3
9'
16.5"
BT
B
A
E
A1
B1
7° 1
2' 39.0
" LS
112°
39' 47.7
" BT
7° 1
2' 57.5
" LS
112°
39' 16.0
" BT
Figure 2.3. Layout of Container Terminal Development in Lamong Bay – Land Side
(Source : Survey Investigation Design (SID) Container Terminal Development II in Lamong Bay, Tanjung Perak
Port, Surabaya, 2008)
Causeway 500 m x 140 m
Connecting Bridge
2560 m x 18m
Jl. Raya Tambak Osowilangon
U

REPORT OF ENVIRONMENTAL IMPACT STATEMENT 2-8
Environmental Impact Assessment – Tanjung Perak Port Development in Lamong Bay
Table 2.2. Project Activity Plan - Tanjung Perak Port Development in
Lamong Bay
Nr Descriptions 2007 2008 2009 2010 2011 2012 2013
Project Preparation
1 Preparation of Survey, Investigation and Design (SID) and Environmental Impact Assessment
2 Project arragement and Licenses perijinan
Construction
1 Cuaseway and Connecting Bridge Construction Works
2 Shallow Water Reclamation and Container Yard Construction
3 Pier Structure and Trestle Construction
4 CFS, office Building, Gate Construction and Workshop etcs
Source: Survey Investigation Design (SID) Container Terminal Development II in Lamong Bay,
Tanjung Perak Port, Surabaya, 2008
Project Implementation : Studied Pre-Construction Phase, Construction
Phase and Operation Phase
In the project implementation, generally there are activities predicted to brig
impacts during the planning, construction and operation of the project. The
activities can be classified into pre-construction activities, preconstruction
activities and operationactivities. Prior to the Environmental Impact
Assessment preparation, there had been public consultancies on 16 January
2008 (Asemrowo Sub-diustrict), 18 January 2008 (Benowo Sub-district), 21
January 2008 (Krembangan Sub-district) and publication in Republika
Newspaper on 15 December 2007.
The details of the activities in each of the phases are further described as
follows:
A. Pre-construction
Sosialization
The socialization of the project plans is supposed to expose the
project to the public and explain the environmental management
and observation measures to be taken in the line with the project
plan implementation. The socialization is addressed to the peopke
dwelling surrounding the project site and predicted to be impacted
REPORT OF ENVIRONMENTAL IMPACT STATEMENT 2-9
Environmental Impact Assessment – Tanjung Perak Port Development in Lamong Bay
by the activities. The socialization covers the whole project activity
plans for the container terminal development in Lamong Bay.
The socialization activities are arranged as follows :
1. Approaching the fisherman public figures or fisherman
societies;
2. Collecting the public complaints and expectations in relation
with the project activities and communicate them to the
management and relevant government authorities;
3. Holding regular meetings with the community, PT. Pelabuhan
Indonesia III and relevant local government
4. Socializing the project activities plans to the community and
fishermen concerning the activities possibly affecting their
activities (such as : reclamation, pier strcture construction, etc.)
The issues to be discussed in the socialization cover the following
topics :
1. Activity plans on area preparation, reclamation for constructing
road/causeway, transportation of material and equipment and
bridge structure;
2. Activities to manage the negative impacts predicted to arise
from the project;
3. Needs of labors during both construction and operation phases;
4. Notification about locations to be set free from fisherman
activities;
5. Compensation that may be grantable (For instance : public
facilities).
B. Construction Phase
Construction Preparation
Labor Mobilization and Demobilization : Local and Migrant
Labors
Labor mobilization will be conducted in accordance with the need.
The project will need about 100 comprising : 80 skilled workers
REPORT OF ENVIRONMENTAL IMPACT STATEMENT 2-10
Environmental Impact Assessment – Tanjung Perak Port Development in Lamong Bay
and 20 non-skilled workers. The hiring will be prioritized for the
local people in accordance with the required qualifications. They
will be hired during construction phse only on contract basis.
Material and Equipment Mobilization and Demobilization
Material and equipment mobilization and demobilization for
preparing the construction of connecting bridge, pier structure and
trestle are highly potential to bring negative impacts to the traffic
on the roads accessed by the material and equipment transporting
trucks. The addition of heavy trucks operated for material and
equipment mobilization in the container terminal development in
Lamong Bay will be about 10 – 15 units of trucks per day. For
transporting the material and equipment to the project site, the
operated trucks will access the Toll Road and Jalan Tambak
Osowilangon until reaching the project site.
The works will adopt cast in situ construction method. The
reinforcing metal bards will be directly brought and set on site,
while the concrete mortar will be prepared by ready mix trucks.
The piles are made of steel . The materials for contructing the
connecting bridge , pier structure and trestle will be transported by
pontoon once a week.
Basecamp Construction.
The labors working and staying in the basecamp will be hired by
the project contractor. The basecamp is constructed on access road.
At present, it is close to Jalan Raya Tambak Osowilangon. The
basecamp is provided with public ashing, bathing and toilet
facilities.
REPORT OF ENVIRONMENTAL IMPACT STATEMENT 2-11
Environmental Impact Assessment – Tanjung Perak Port Development in Lamong Bay
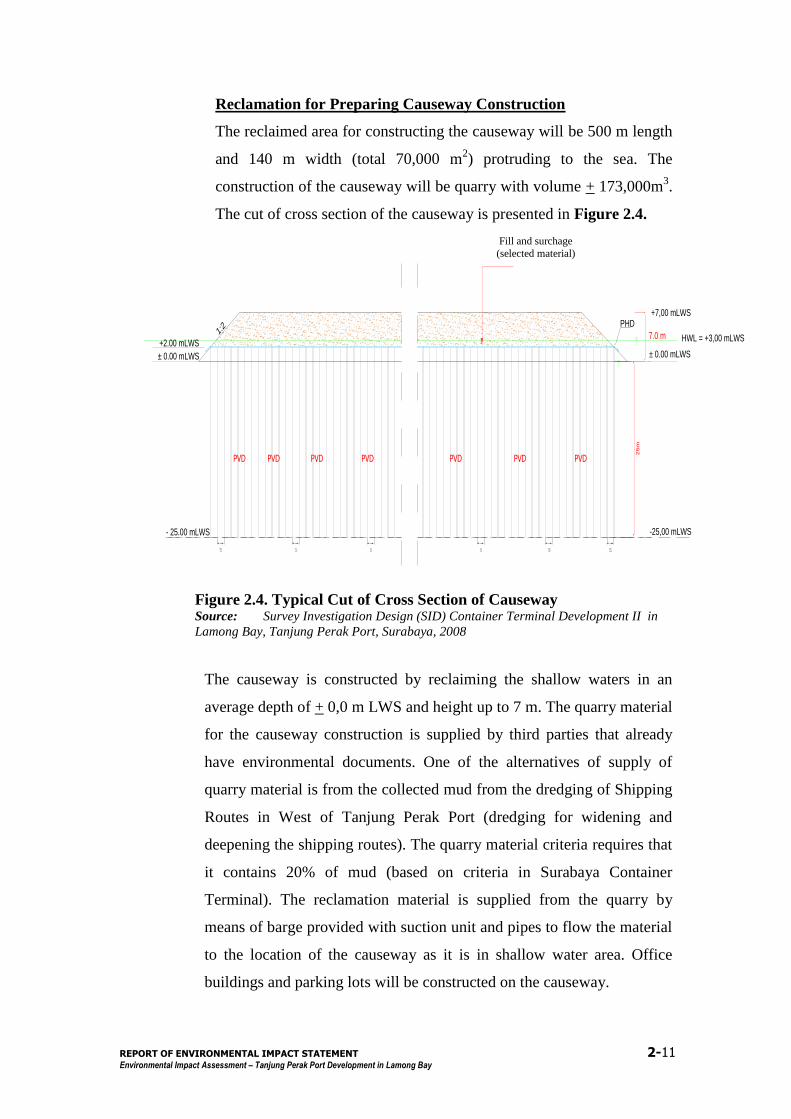
Reclamation for Preparing Causeway Construction
The reclaimed area for constructing the causeway will be 500 m length
and 140 m width (total 70,000 m2) protruding to the sea. The
construction of the causeway will be quarry with volume + 173,000m3.
The cut of cross section of the causeway is presented in Figure 2.4.
Figure 2.4. Typical Cut of Cross Section of Causeway Source: Survey Investigation Design (SID) Container Terminal Development II in
Lamong Bay, Tanjung Perak Port, Surabaya, 2008
The causeway is constructed by reclaiming the shallow waters in an
average depth of + 0,0 m LWS and height up to 7 m. The quarry material
for the causeway construction is supplied by third parties that already
have environmental documents. One of the alternatives of supply of
quarry material is from the collected mud from the dredging of Shipping
Routes in West of Tanjung Perak Port (dredging for widening and
deepening the shipping routes). The quarry material criteria requires that
it contains 20% of mud (based on criteria in Surabaya Container
Terminal). The reclamation material is supplied from the quarry by
means of barge provided with suction unit and pipes to flow the material
to the location of the causeway as it is in shallow water area. Office
buildings and parking lots will be constructed on the causeway.
PVDPVD PVD PVD PVD PVD PVD
7.0 m HWL = +3,00 mLWS
+7,00 mLWS
± 0.00 mLWS
1:2
-25,00 mLWS- 25.00 mLWS
TIMBUNAN & SURCHARGE
(selected material)
± 0.00 mLWS
+2.00 mLWS
PHD
25m
Fill and surchage
(selected material)
REPORT OF ENVIRONMENTAL IMPACT STATEMENT 2-12
Environmental Impact Assessment – Tanjung Perak Port Development in Lamong Bay
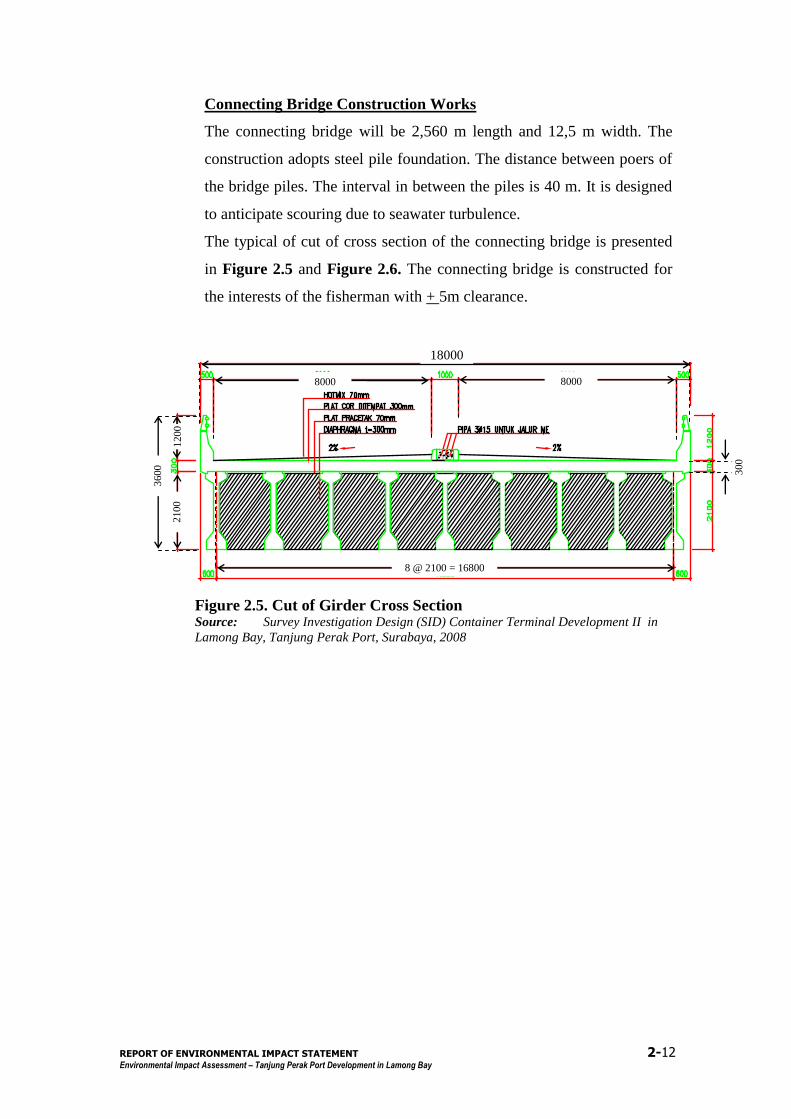
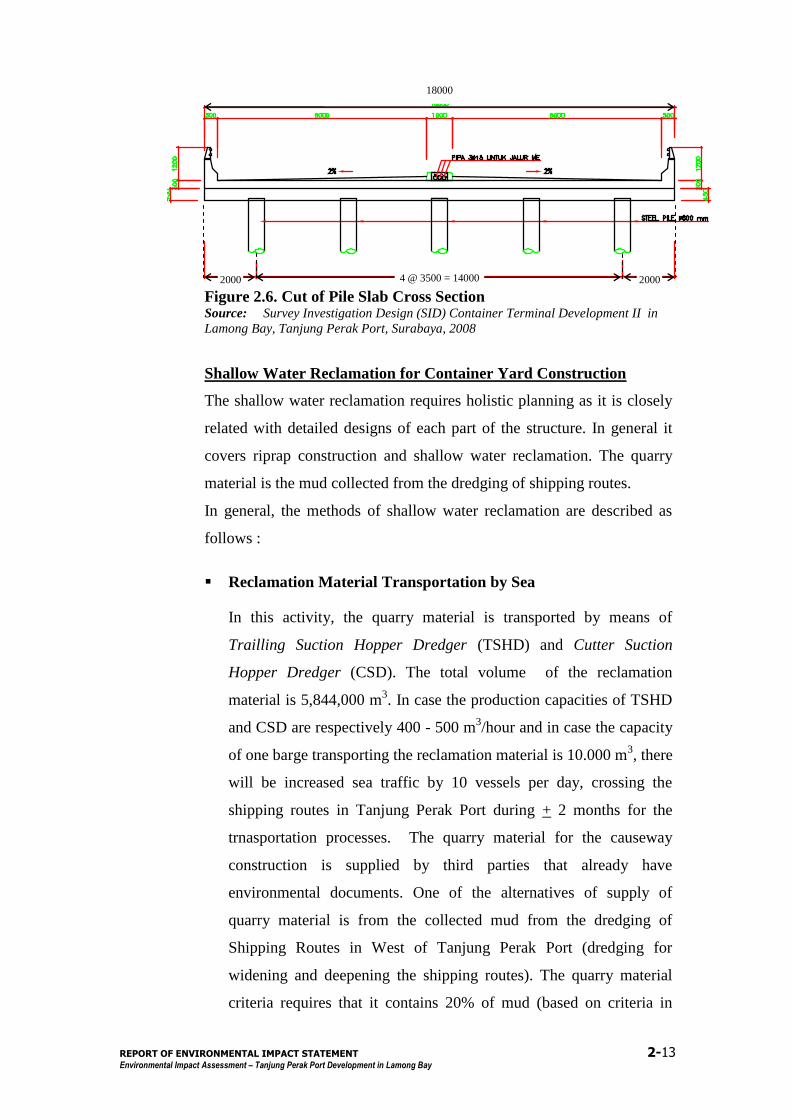
Connecting Bridge Construction Works
The connecting bridge will be 2,560 m length and 12,5 m width. The
construction adopts steel pile foundation. The distance between poers of
the bridge piles. The interval in between the piles is 40 m. It is designed
to anticipate scouring due to seawater turbulence.
The typical of cut of cross section of the connecting bridge is presented
in Figure 2.5 and Figure 2.6. The connecting bridge is constructed for
the interests of the fisherman with + 5m clearance.
Figure 2.5. Cut of Girder Cross Section Source: Survey Investigation Design (SID) Container Terminal Development II in
Lamong Bay, Tanjung Perak Port, Surabaya, 2008
18000
8000 8000
8 @ 2100 = 16800
2100
1200
3600
300
REPORT OF ENVIRONMENTAL IMPACT STATEMENT 2-13
Environmental Impact Assessment – Tanjung Perak Port Development in Lamong Bay
Figure 2.6. Cut of Pile Slab Cross Section Source: Survey Investigation Design (SID) Container Terminal Development II in
Lamong Bay, Tanjung Perak Port, Surabaya, 2008
Shallow Water Reclamation for Container Yard Construction
The shallow water reclamation requires holistic planning as it is closely
related with detailed designs of each part of the structure. In general it
covers riprap construction and shallow water reclamation. The quarry
material is the mud collected from the dredging of shipping routes.
In general, the methods of shallow water reclamation are described as
follows :
Reclamation Material Transportation by Sea
In this activity, the quarry material is transported by means of
Trailling Suction Hopper Dredger (TSHD) and Cutter Suction
Hopper Dredger (CSD). The total volume of the reclamation
material is 5,844,000 m3. In case the production capacities of TSHD
and CSD are respectively 400 - 500 m3/hour and in case the capacity
of one barge transporting the reclamation material is 10.000 m3, there
will be increased sea traffic by 10 vessels per day, crossing the
shipping routes in Tanjung Perak Port during + 2 months for the
trnasportation processes. The quarry material for the causeway
construction is supplied by third parties that already have
environmental documents. One of the alternatives of supply of
quarry material is from the collected mud from the dredging of
Shipping Routes in West of Tanjung Perak Port (dredging for
widening and deepening the shipping routes). The quarry material
criteria requires that it contains 20% of mud (based on criteria in
18000
4 @ 3500 = 14000 2000 2000
REPORT OF ENVIRONMENTAL IMPACT STATEMENT 2-14
Environmental Impact Assessment – Tanjung Perak Port Development in Lamong Bay
Surabaya Container Terminal). The reclamation material is supplied
from the quarry by means of barge provided with suction unit and
pipes to flow the material to the location of the causeway as it is in
shallow water area.
Area Preparation and Compaction
It is a process of compaction of the reclamation in to an area ready
for constructions.
The works comprise :
a) Preparation Works
It covers the gains of licences required for the area to be
reclaimed, equipment mobilization, installation of signs and
border poles of the reclaimed shallow waters.
b) Geotextile Installation (made of synthetic materials for soil
strengthening). In order that the reclamation construction is
stable, it requires geotextile installation in layers. The thickness
of each layer is to conform with the needs.
c) Embankment Construction
The embankment is constructed with rocks supplied by third
parties. The volume of the rocks is + 25,000 m3 to be transported
by 10- 15 trucks per day each with loading capacity + 10 m3.
The trucks operated have to first pass emmission test. Next, the
rocks are arranged along the borders of shallo watersto be
reclaimed in order to prevent quarry material overflow out of the
set borders.
d) Soil Monitoring Instrument
It is required to monitor the reclamation volume, settlement and
sliding, especially during the process of embankment
construction. The instruments to be used for monitoring cover :
Settlement plate
Inclinometer
Piezomete
REPORT OF ENVIRONMENTAL IMPACT STATEMENT 2-15
Environmental Impact Assessment – Tanjung Perak Port Development in Lamong Bay
e) Shallow Water Reclamation Works
The reclamation is processed by pouring the quarry materials
into the reclaimed area steadily until it reches the expected
elevation. Next, the reclamation is leveled and compacted.
f) Vertical Drain and Horizontal Drain Installations
The vertical drain is for accelerating the draining. It is settled
on the ground by means of piling equipment provided with
special tools.In order to be able to accelerate the drain of water
of of the reclamation area, it requires horizontal dran (sand).
g) Compaction Works
The compaction requires vibrator rollers. The number of
required lanes depends on the permitted compaction
requirements.
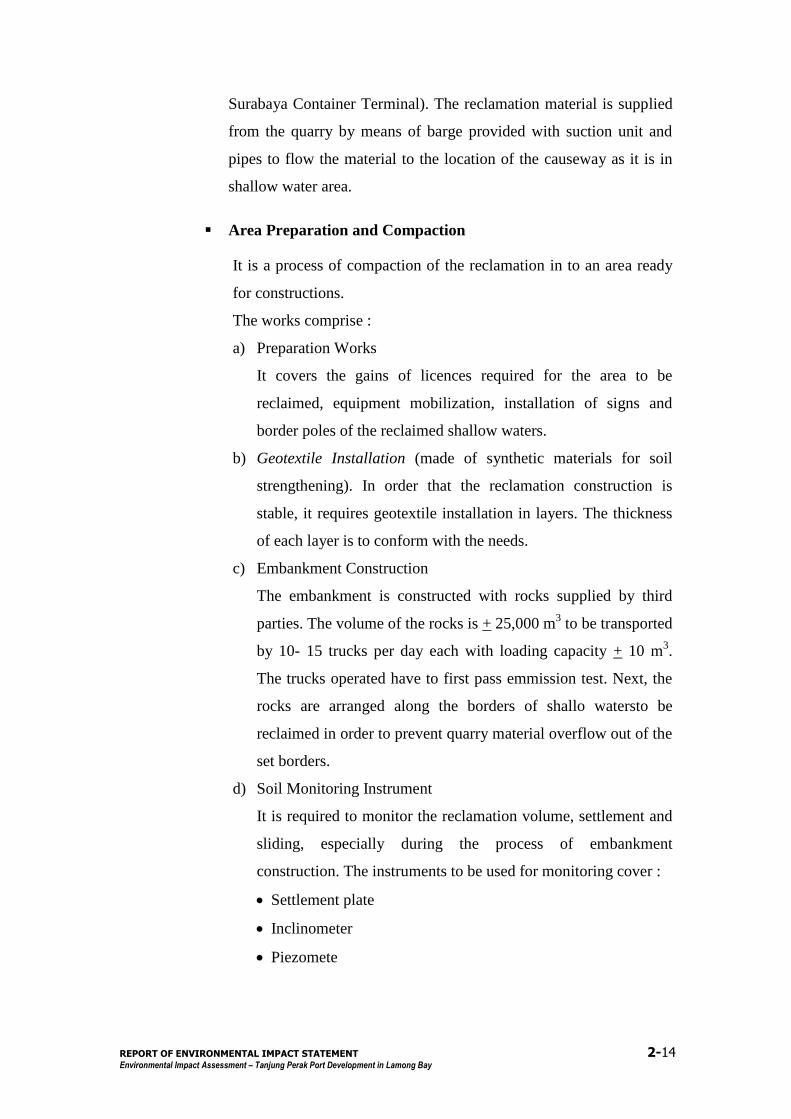
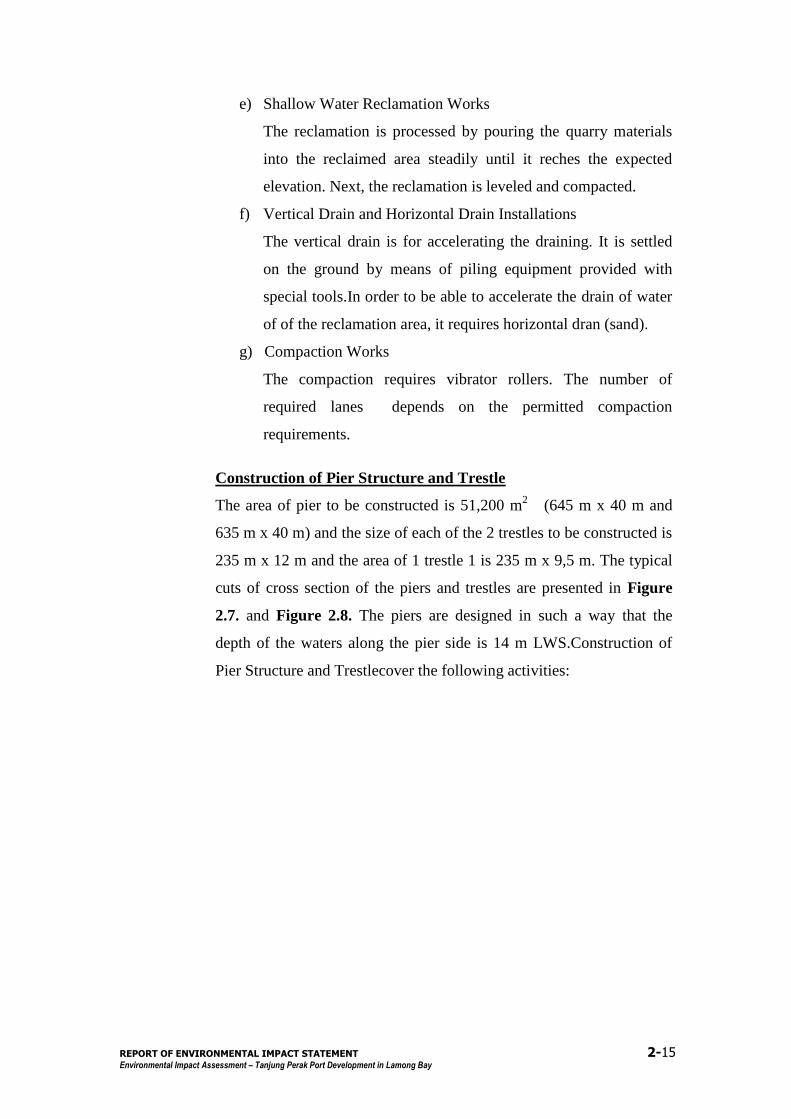
Construction of Pier Structure and Trestle
The area of pier to be constructed is 51,200 m2 (645 m x 40 m and
635 m x 40 m) and the size of each of the 2 trestles to be constructed is
235 m x 12 m and the area of 1 trestle 1 is 235 m x 9,5 m. The typical
cuts of cross section of the piers and trestles are presented in Figure
2.7. and Figure 2.8. The piers are designed in such a way that the
depth of the waters along the pier side is 14 m LWS.Construction of
Pier Structure and Trestlecover the following activities:
REPORT OF ENVIRONMENTAL IMPACT STATEMENT 2-16
Environmental Impact Assessment – Tanjung Perak Port Development in Lamong Bay
Figure 2.7. Cut of Pier Cross Section
Source: Survey Investigation Design (SID) Container Terminal Development II in
Lamong Bay, Tanjung Perak Port, Surabaya, 2008
Figure 2.8. Cut of Trestle Cross Section
Source: Survey Investigation Design (SID) Container Terminal Development II in
Lamong Bay, Tanjung Perak Port, Surabaya, 2008
REPORT OF ENVIRONMENTAL IMPACT STATEMENT 2-17
Environmental Impact Assessment – Tanjung Perak Port Development in Lamong Bay
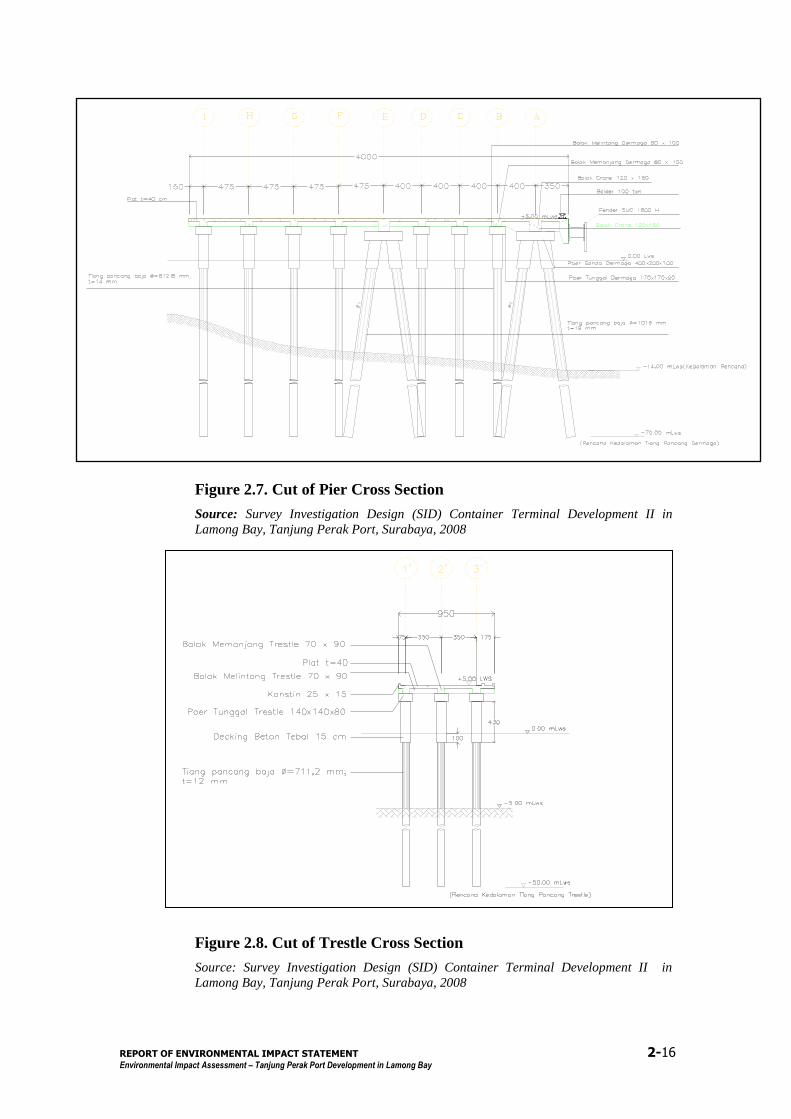
Pier Structure and Trestle Construction
The piers are constructed on pile foundation. The piles are planted
by means of pontoon on the sea (Figure 2.9.). Next, it is followed
with preparation of poer reinforcement and casting (on the top of
the structure to tie some piles), and preparation of girder
reinforcement and pier floor. Then, they are casted with ready mix
concrete. The casting in situ is predicted to decrease the seawater
quality due to concrete spills.
Figure 2.9. Pile Planting on Sea
Source: Survey Investigation Design (SID) Container Terminal Development II in
Lamong Bay, Tanjung Perak Port, Surabaya, 2008
Construction of Terminal Supporting Facilities
(Container Yard Hardening, Gate, CFS, Chasis Parking)
The constructionof terminal supporting facilities covers :
Container Yard Hardening
The typical hardened construction of the container yard is
presented in Figure 2.10.
Tiang Pancang
Darat Laut
Ponton Pancang
On Shore Off Shore
Pile Shore
Pontoon
REPORT OF ENVIRONMENTAL IMPACT STATEMENT 2-18
Environmental Impact Assessment – Tanjung Perak Port Development in Lamong Bay
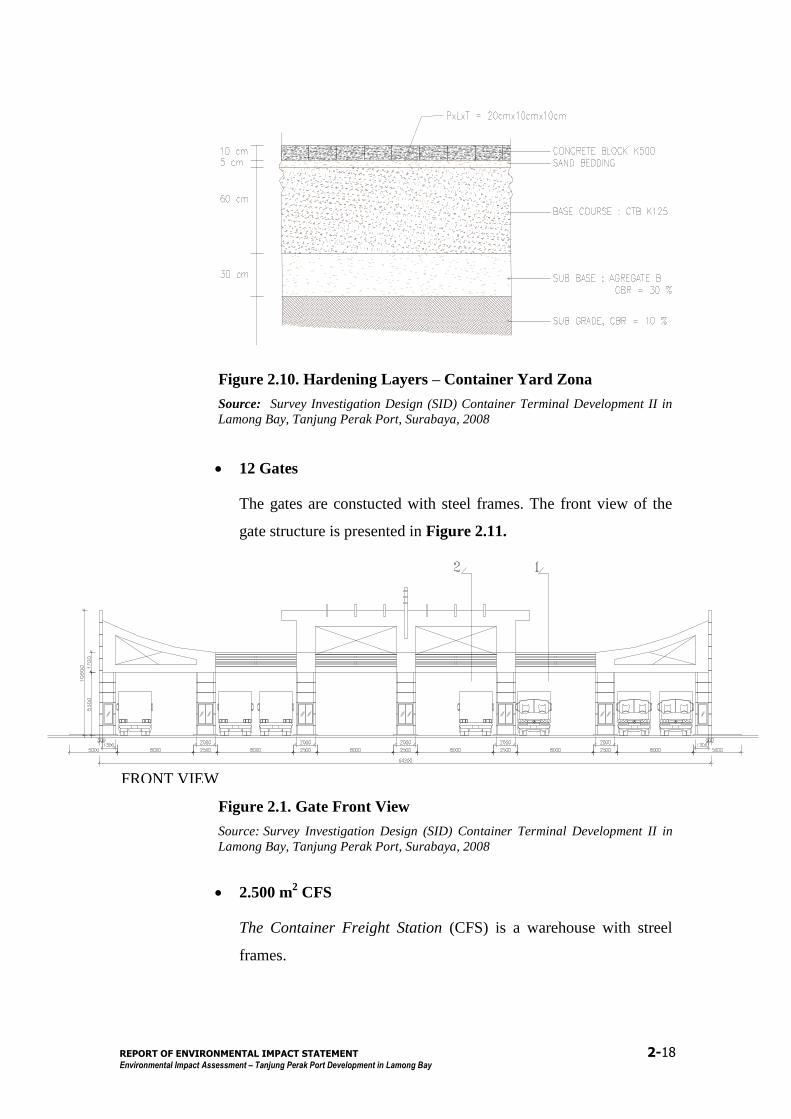
Figure 2.10. Hardening Layers – Container Yard Zona
Source: Survey Investigation Design (SID) Container Terminal Development II in
Lamong Bay, Tanjung Perak Port, Surabaya, 2008
12 Gates
The gates are constucted with steel frames. The front view of the
gate structure is presented in Figure 2.11.
Figure 2.1. Gate Front View
Source: Survey Investigation Design (SID) Container Terminal Development II in
Lamong Bay, Tanjung Perak Port, Surabaya, 2008
2.500 m2 CFS
The Container Freight Station (CFS) is a warehouse with streel
frames.
FRONT VIEW
REPORT OF ENVIRONMENTAL IMPACT STATEMENT 2-19
Environmental Impact Assessment – Tanjung Perak Port Development in Lamong Bay
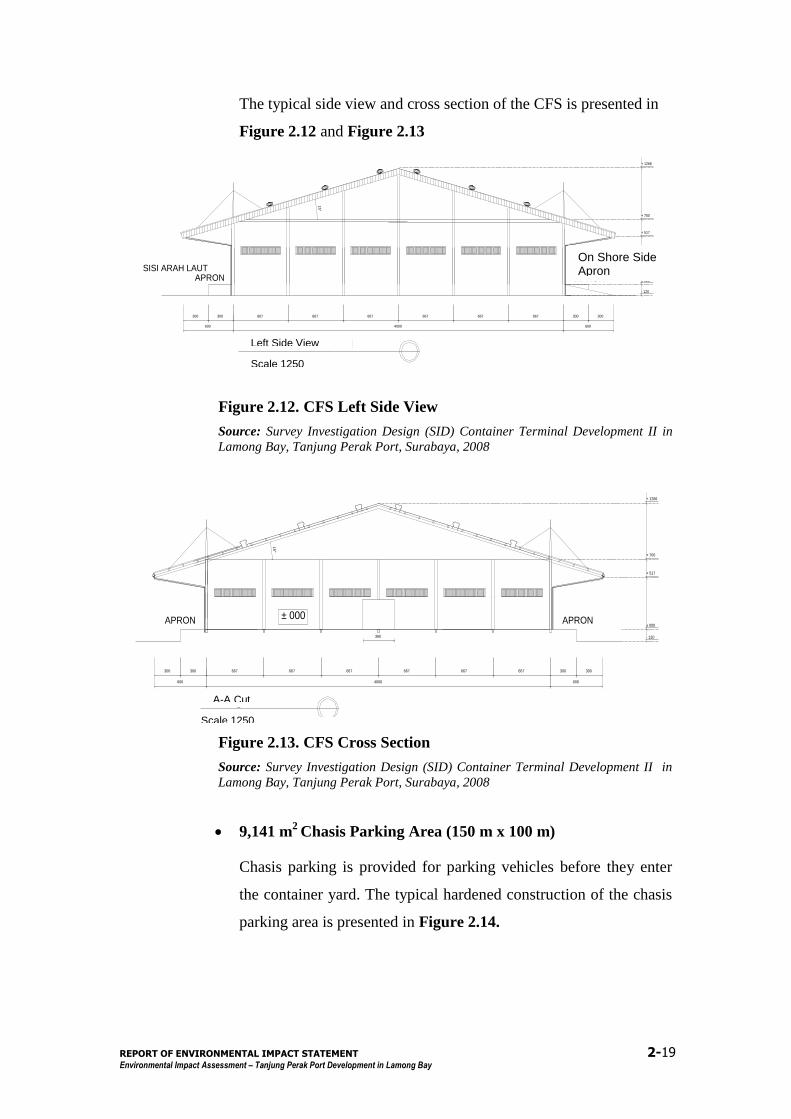
The typical side view and cross section of the CFS is presented in
Figure 2.12 and Figure 2.13
Figure 2.12. CFS Left Side View
Source: Survey Investigation Design (SID) Container Terminal Development II in
Lamong Bay, Tanjung Perak Port, Surabaya, 2008
Figure 2.13. CFS Cross Section
Source: Survey Investigation Design (SID) Container Terminal Development II in
Lamong Bay, Tanjung Perak Port, Surabaya, 2008
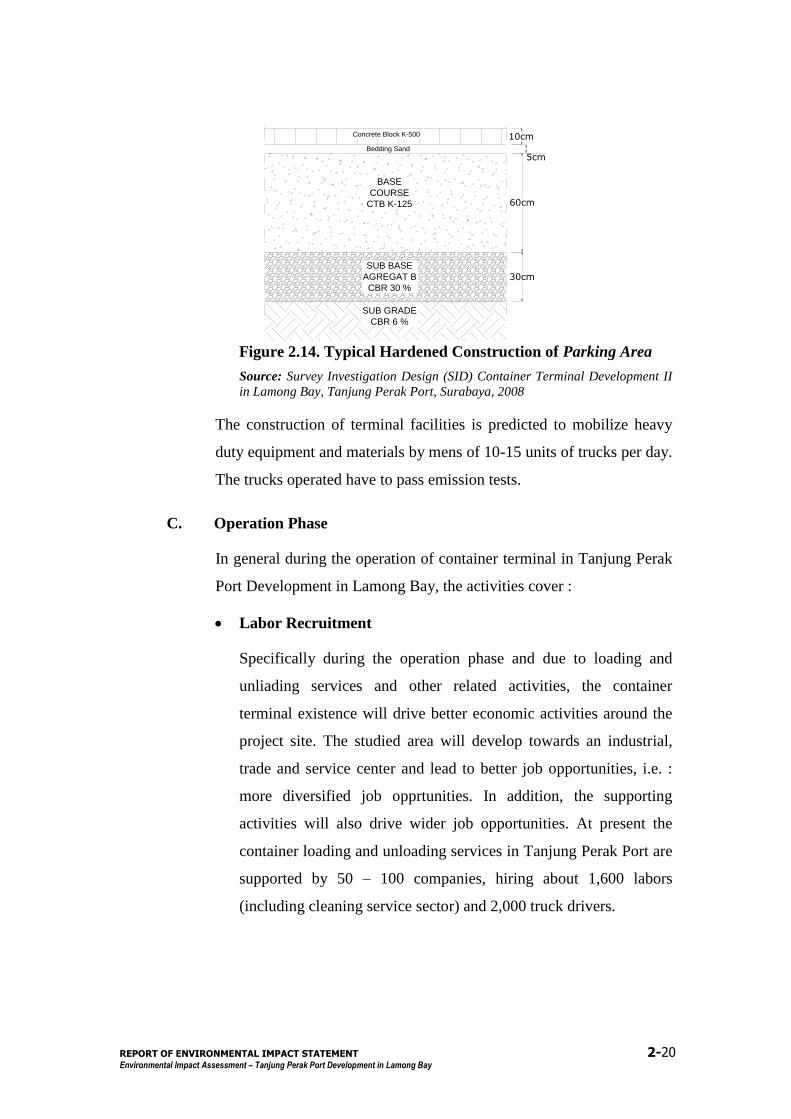
9,141 m2
Chasis Parking Area (150 m x 100 m)
Chasis parking is provided for parking vehicles before they enter
the container yard. The typical hardened construction of the chasis
parking area is presented in Figure 2.14.
Tampak Samping KiriSkala 1:250
667667 667667 667667
4000
± 000
+ 700
+ 1266
- 120
SISI ARAH LAUT SISI ARAH DARATAPRON APRON
300 300300300
+ 517
600600
15°
Potongan A-ASkala 1:250
± 000
+ 700
+ 1266
667667 667667 667667
4000
300
- 120
APRON
360
300300300
15°
APRON ± 000
+ 517
600600
On Shore Side Apron
Left Side View
A-A Cut
Scale 1250
Scale 1250
REPORT OF ENVIRONMENTAL IMPACT STATEMENT 2-20
Environmental Impact Assessment – Tanjung Perak Port Development in Lamong Bay
Figure 2.14. Typical Hardened Construction of Parking Area
Source: Survey Investigation Design (SID) Container Terminal Development II
in Lamong Bay, Tanjung Perak Port, Surabaya, 2008
The construction of terminal facilities is predicted to mobilize heavy
duty equipment and materials by mens of 10-15 units of trucks per day.
The trucks operated have to pass emission tests.
C. Operation Phase
In general during the operation of container terminal in Tanjung Perak
Port Development in Lamong Bay, the activities cover :
Labor Recruitment
Specifically during the operation phase and due to loading and
unliading services and other related activities, the container
terminal existence will drive better economic activities around the
project site. The studied area will develop towards an industrial,
trade and service center and lead to better job opportunities, i.e. :
more diversified job opprtunities. In addition, the supporting
activities will also drive wider job opportunities. At present the
container loading and unloading services in Tanjung Perak Port are
supported by 50 – 100 companies, hiring about 1,600 labors
(including cleaning service sector) and 2,000 truck drivers.
Concrete Block K-500
Bedding Sand
BASE
COURSE
CTB K-125
SUB GRADE
CBR 6 %
10cm
5cm
60cm
SUB BASE
AGREGAT B
CBR 30 %
30cm
REPORT OF ENVIRONMENTAL IMPACT STATEMENT 2-21
Environmental Impact Assessment – Tanjung Perak Port Development in Lamong Bay
Container Loading and Unloading
The operation of container terminal in Lamong Bay will entail
container loading and unloading activities.
In the loading and unloading activities, commonly the containers
are to first transit in the container yard before being transported to
vessels for loading operations or to trucks for unloading operations.
The container terminal capacity is 1,6 million TEU‟s per year, and
it is estimated that there will be increase of vessel accesses by +
530 vessels per year or + 2 vessels per day. Tanjung Perak Port
Development is supposed to anticipate container loading and
unloading up to year 2030. Next, it will be developed by
constructing a new port in Tanjung Bulu Pandan, Bangkalan,
Madura (Results of Study by JICA 2007, The Greater Surabaya
Metropolitan Port).
Container Terminal Operation
The containerterminal operations cover the operations of container
yard, gates and other supporting facilities , such as : Container
Freight Station (CFS), office building, gate and truck parking lots.
Distribution of Containers
As a center of distribution of goods, it will turn into a center of
cargo containers in East Java Province. As a center of distribution,
it will be much accessed by incoming and outgoing semi trailer
trucks, especially transporting cargo containers. The traffic volume
on the highways in the studied area accessing Jl. Tambak
Osowilangon - Jalan Romokalisari – Romokalisari Toll Road Gate,
will be + 60 trucks per day or + 8 trucks per hour. At present Jl.
Romokalisari is already provided with 4 lanes 2 ways with road
median in the middle of the highway (4/2 D) and Jl. Tambak
Osowilangun has already provided with 6 lanes 2 (6/2 D) with
road median in the middle of the highway. Accordingly, it will not
affect the average road performance significantly, i.e. : 0.8.
REPORT OF ENVIRONMENTAL IMPACT STATEMENT 2-22
Environmental Impact Assessment – Tanjung Perak Port Development in Lamong Bay
Ballast Water Supply and Oil Spill
The ballast water is commonly filled after the vessels have
completed unloading operations to balance the vessels. Such
operations seldom take place in Tanjung Perak Port since, mostly,
vessels having completed unloading operations, they will be
straigtly loaded. Therefore, in general ballast water filling
practically is not required. The oil usually spills during ballast
water draining. The process ballast water draining is to adopt
reception facility (RF). The container terminal in Lamong Bay
share the same RF available in Tanjung Perak Port in Nilam Barat.
Waste Treatment in Tanjung Perak Development in Lamong Bay
The waste treatment in container terminal in Lamong Bay utilizes
the same waste treatment plant already available in Tanjung Perak
Port. The treated wastes cover :
Solid Waste
The treatment of solid wastes in the container terminal will utilize
the same waste treatment plant already available in Tanjung Perak
Port. The rubbish from the container terminal will be transported to
and dumped in Benowo Landfill, so will the rubbish collected from
the pools or pier waters. (See Annex of Working Plan and
Technical Requirements for Transportation of Rubbish Collected
from the Port to Benowo Landfill)
Liquid Waste and Dangerous and Hazardous Waste
The liquid waste and dangerous and hazaordous wasstes from the
container terminal will be treated in the same Reception Facility
9RF) available in Tanjung Perak Port in Nilam Barat. Pursuant to
Annex IVMARPOL 73/78 Regulation 10, the port administrator or
management is to provide RF in accordance with the vessel needs.
The operation of RF is to refer to the relevant local regulations. In
Indonesia, the RF operation procedures are provided in the
REPORT OF ENVIRONMENTAL IMPACT STATEMENT 2-23
Environmental Impact Assessment – Tanjung Perak Port Development in Lamong Bay
Regulation of the Minister of Environment Number 05 Year 2009
about Waste Treatment in Ports (annexed thereto). The RF
activities cover collection and storage of dangerous and hazardous
wastes, and waste treament facilities, such as oil separator, Waste
Water Treatment Plant (WWTP) and residual landfill (such as :
incenerator). The RF operation is not yet optimum as it has not yet
been legally protected by Sea and Coast Security Guard (KPLP) by
means of a regulation obliging each vessel to utilize the RF,
especially for handling used oil or dangerous and hazardous
wastes). The RF Operation Permit is presented in Annex 3.
Port Security Management
The port security in the container terminal in Lamong Bay will be
managed under the same standards as the ones applied in Tanjung
Perak Port. Tanjung Perak Port management has applied the
international standards to manage the port security and facilities
under International Ship and Port Facility Security (ISPS Code)
since 1 July 2004, and they periodically provide security trainings
to be attended by the relevant security officers. The trainings
provided in consistence with the ISPS Code involves KP3 Tanjung
Perak, Indonesian Army Officers, Indonesian Navy Officers,
Tanjung Perak Port Security Unit, PT Pelindo, Fire Extinguishers
and companies operating in the port.
Tanjung Perak Port that serves foreign vessels, is strictly to follow
the international security procedures as set forth in the ISPS Code.
In order to be able to well support the port security and facility, it
requires trainings. In the mean time, to assure better services and
sense of security, as of 01 July 2004 all ports, especially the ones
serving foreign vessels is to apply the ISPS Code. The consistant
application of ISPS Code in Tanjung Perak Port, is initialized by
preparing the required human resources and physical supports in
the port, such as : Close Circuit Television (CCTV), street lights
and fences.
REPORT OF ENVIRONMENTAL IMPACT STATEMENT 2-24
Environmental Impact Assessment – Tanjung Perak Port Development in Lamong Bay
2.3. Alternatives Studied in Environmental Impact Statement
In this Environmental Impact Assessment, there is no alternatives of location
as the determination of location for the port development is based on the
results of previous studies, inter alia : Technical and Environmental Review
on Shipping Routes, Seminetation and Phase of Reclamation in Coastal
Area in Madura Strait Year 2000, by Public Service Center (LPM) of ITS in
collaboration with Marine Engineering Study Program of ITB, concluding that
Lamong Bay is one of the feasible alternatives for port development in Madura
Strait, in addition to port development in the estuary of South Mireng River,
Gresik. The results of the review concluded that in view of technical aspects
the area is simply fair, yet in view of environmental aspects it is feasible
todevelop.
The degree of importance, initial environmental condition and environmental
evaluation during the study are arranged as follows :
• Degree of Importance:
- Referring to Surabaya City Master Plan, the area is suitable for
industrial and warehousing purposes;
- The mangrove ecosystem conservation in Surabaya City is preferred to
be in the East part of Surabaya (Wonorejo area), exactly in the estuary
of Wonokromo River and its surrounding.
• Initial Environmental Condition:
- Most of the mangrove ecosystems are found in Gresik Regency and
Bangkalan Regency, especially in Manyar Sub-district, Bungah Sub-
district, Sedayu Sub-district, Ujung Pangkah Sub-district dan Kamal
Sub-district with percentage range 45%-60% (categorized good), while
in Surabaya City, the percentage is <40% (categorized bad-fair).
- The noise degree, seawater quality, space utilization, spatial plans,
coastal birds, runoff, salinity and coastal sediment are perceived fair.
• Environmental Evaluation :
- The environmental components mostly affected by the activities of port
development in Lamong Bay is the tranquility of social life.
- In addition, the air quality will be impacted by the project activities.
It is perceived to be feasible for development.
REPORT OF ENVIRONMENTAL IMPACT STATEMENT 2-25
Environmental Impact Assessment – Tanjung Perak Port Development in Lamong Bay
2.4. Relationship Between Business and/or Activity Plans and Other Activities
Surrounding the Project Site
Tanjung Perak Port
Tanjung Perak Port is geographically located in 112º 43‟ 22” East Longitude
and 7º 11‟ 54” South Latitude, excatly in Madura Strait., North Part of
Surabaya City. As the second largest port in Indonesia, after Tanjung Priok
Port in Jakarta , it plays definitely strategic roles and function, i.e. : as a
support to smoothen the sea transportation trafficand driver of economic
growth, specifically in East Java Province, and generally in East Indonesia. In
addition, it also serves as a center for both international and domestic trading
activities and a transhipment port. The roles and function are obviously
dominant and mutually supporting.
Geographically, the position of East Java Province is relatively central to the
territory of Republic of Indonesia, where the second largest port in Indonesia
is located in. The port accommodate both import-export and inter-insular
trading activities. In view of economy, East Java Province plays important
roles in the Indonesian economy, as industries have been developing in the
province since 19th century. Accordingly, based on the concepts of Indonesian
National Transportation System, concerning hierachy of sea, air and surface
transportation networks comprising Facility Networks and Service Networks,
Tanjung Perak Ports is classified to be Main Port.
Tanjung Perak Port is under the administration of PT. Pelabuhan Indonesia III
and the borders of Administration Authority of Tanjung Perak Port , Surabaya
have been set forth based on Collective Decision of Minister of Home Affairs
and Minister of Communication Number 93 Year 1981 and Number
KM.110/AL.106/Phb-81 dated 29 April 1981, and the borders of the Working
Environment of Tanjung Perak Port is in consistant with the Master Plan
prepared by the City Government of Surabaya. With reference to the borders,
the administrative area of Tanjung Perak Port is totally 524.3 Ha, while the
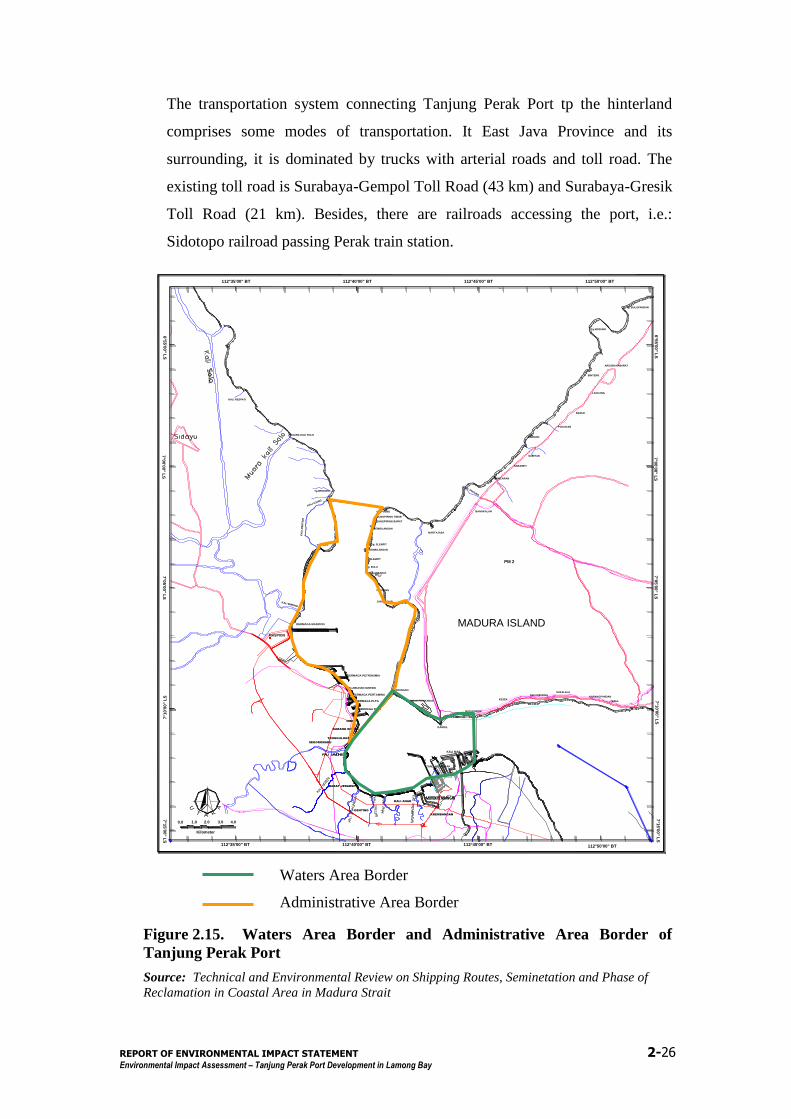
waters area of Tanjung Perak Port is 1,634.03 Ha. Basically, the
administrative area is in the waters area of Tanjung Perak Port (See Figure
2.15.).
REPORT OF ENVIRONMENTAL IMPACT STATEMENT 2-26
Environmental Impact Assessment – Tanjung Perak Port Development in Lamong Bay
The transportation system connecting Tanjung Perak Port tp the hinterland
comprises some modes of transportation. It East Java Province and its
surrounding, it is dominated by trucks with arterial roads and toll road. The
existing toll road is Surabaya-Gempol Toll Road (43 km) and Surabaya-Gresik
Toll Road (21 km). Besides, there are railroads accessing the port, i.e.:
Sidotopo railroad passing Perak train station.
Figure 2.15. Waters Area Border and Administrative Area Border of
Tanjung Perak Port
Source: Technical and Environmental Review on Shipping Routes, Seminetation and Phase of
Reclamation in Coastal Area in Madura Strait
6°5
5'0
0" L
S
6°5
5'0
0" L
S
7°1
5'0
0" L
S
112°50'00" BT112°35'00" BT
112°50'00" BT112°35'00" BT
DERMAGA PETROKIMIA
DERMAGA PLTU
PELABUHAN GRESIK
DERMAGA PERTAMINA
DERMAGA PLTG
INDRO
KARANG KIRING
TENGGULUNAN
KREMBANGAN
KALI ANAK
GENTING
BABAT JERAWAT
SEGOROMADU
KAMAL
KALI MAS
TANJUNG PERAK
P. MADURA
U
TA R
A
TAMBAK PERIKANAN
TANJUNGAN
JUNGANYAR
DAKIRING
BULUHBARAT
Tg. BULU
SLEMPIT
SEMBILANGAN
Ug. SLEMPIT
SEMBILANGAN
JUNGPIRING BARAT
JUNGPIRING TIMUR
Ug. PIRING
MARTAJASA
BANGKALAN
S. PUCUNG
BANCARAN
SABANEH
SABIYAN
GEBANG
POCOGAN
BARUK
LANCANG
BINTENG
AROSBAYABARAT
Tg.MODUNG
Tg. BULUPANDAN
BATUPORON
KESEK
SEKARBUNGUSUKALELA
KARANGPANDAN
TEBUL
KALI MIRENG
Tg.SAWO
KA
LI M
ER
TA
NI
KALI UJUNG
Tg.WEDORO
KA
LI S
OL
O
MUARA KALI SOLO
KALI RESPATI
PM 2
DERMAGA MASPION
112°40'00" BT 112°45'00" BT
7°0
0'0
0" L
S7
°05'0
0" L
S7
°10'0
0" L
S7
°15'0
0" L
S
0.0
Kilometer
1.0 2.0 3.0 4.0
MASPION
7°0
5'0
0" L
S7
°00'0
0" L
S
7°1
0'0
0"
LS
112°40'00" BT 112°45'00" BT
Waters Area Border
Administrative Area Border
MADURA ISLAND
REPORT OF ENVIRONMENTAL IMPACT STATEMENT 2-27
Environmental Impact Assessment – Tanjung Perak Port Development in Lamong Bay
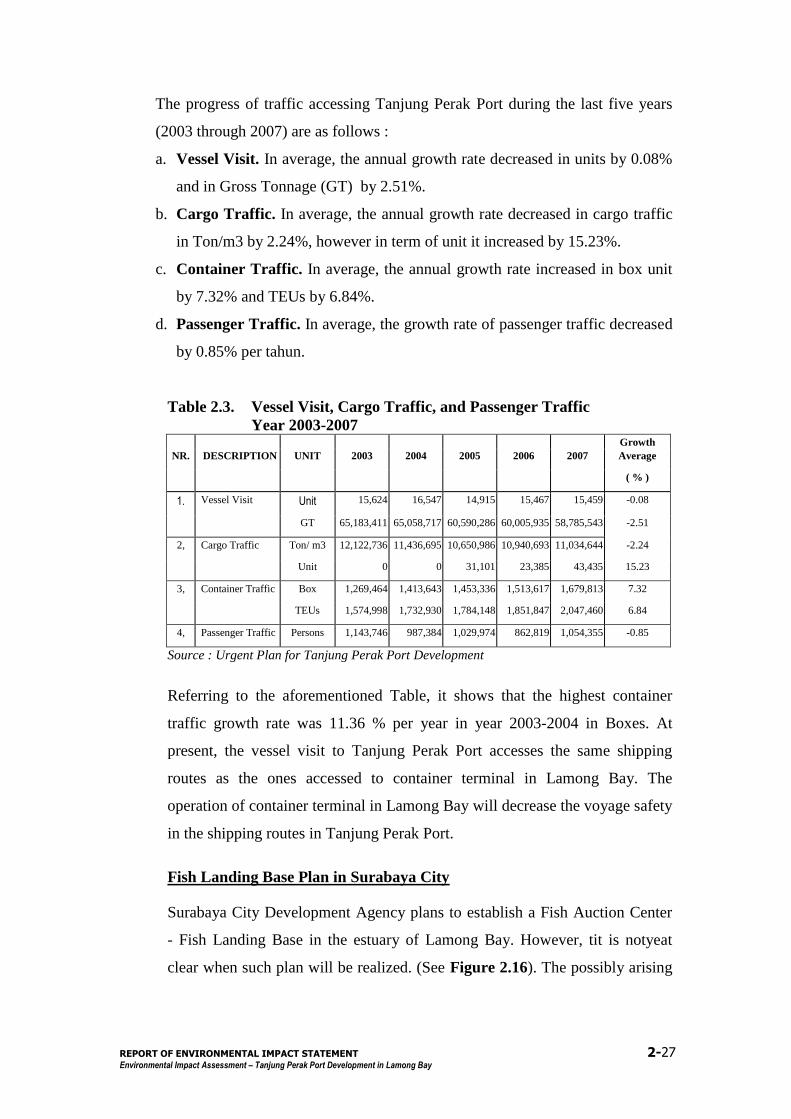
The progress of traffic accessing Tanjung Perak Port during the last five years
(2003 through 2007) are as follows :
a. Vessel Visit. In average, the annual growth rate decreased in units by 0.08%
and in Gross Tonnage (GT) by 2.51%.
b. Cargo Traffic. In average, the annual growth rate decreased in cargo traffic
in Ton/m3 by 2.24%, however in term of unit it increased by 15.23%.
c. Container Traffic. In average, the annual growth rate increased in box unit
by 7.32% and TEUs by 6.84%.
d. Passenger Traffic. In average, the growth rate of passenger traffic decreased
by 0.85% per tahun.
Table 2.3. Vessel Visit, Cargo Traffic, and Passenger Traffic
Year 2003-2007
Growth
NR. DESCRIPTION UNIT 2003 2004 2005 2006 2007 Average
( % )
1. Vessel Visit Unit 15,624 16,547 14,915 15,467 15,459 -0.08
GT 65,183,411 65,058,717 60,590,286 60,005,935 58,785,543 -2.51
2, Cargo Traffic Ton/ m3 12,122,736 11,436,695 10,650,986 10,940,693 11,034,644 -2.24
Unit 0 0 31,101 23,385 43,435 15.23
3, Container Traffic Box 1,269,464 1,413,643 1,453,336 1,513,617 1,679,813 7.32
TEUs 1,574,998 1,732,930 1,784,148 1,851,847 2,047,460 6.84
4, Passenger Traffic Persons 1,143,746 987,384 1,029,974 862,819 1,054,355 -0.85
Source : Urgent Plan for Tanjung Perak Port Development
Referring to the aforementioned Table, it shows that the highest container
traffic growth rate was 11.36 % per year in year 2003-2004 in Boxes. At
present, the vessel visit to Tanjung Perak Port accesses the same shipping
routes as the ones accessed to container terminal in Lamong Bay. The
operation of container terminal in Lamong Bay will decrease the voyage safety
in the shipping routes in Tanjung Perak Port.
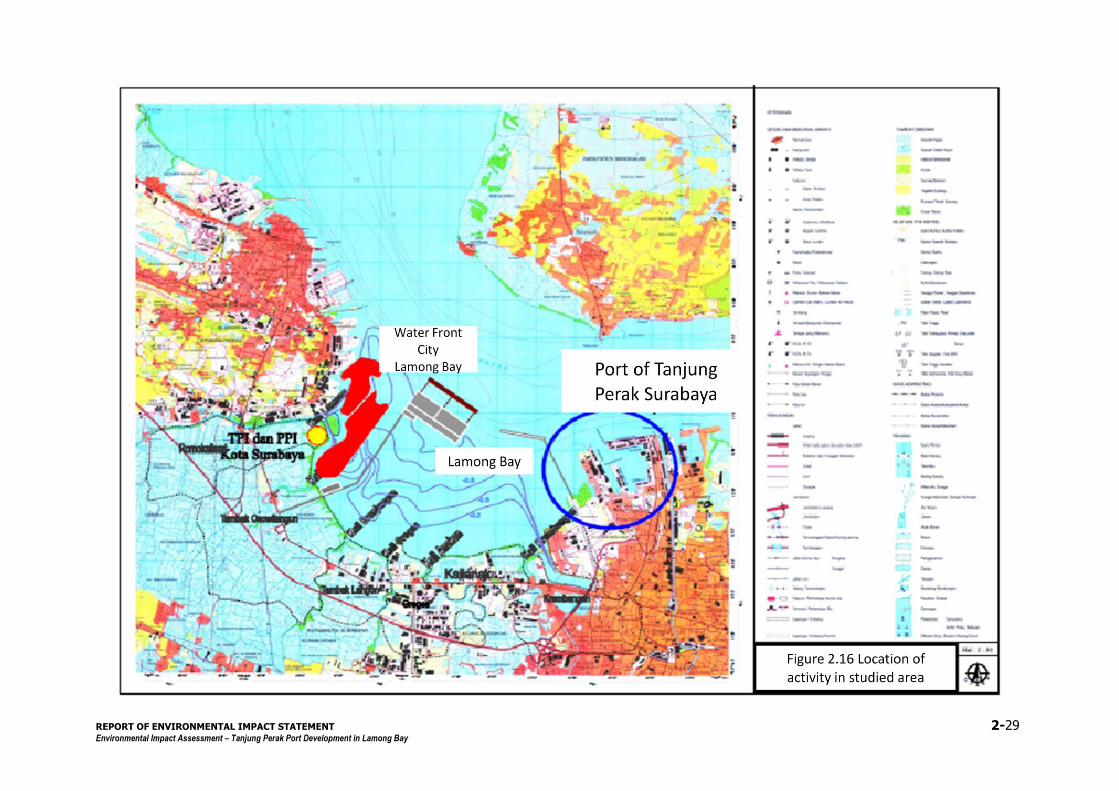
Fish Landing Base Plan in Surabaya City
Surabaya City Development Agency plans to establish a Fish Auction Center
- Fish Landing Base in the estuary of Lamong Bay. However, tit is notyeat
clear when such plan will be realized. (See Figure 2.16). The possibly arising
REPORT OF ENVIRONMENTAL IMPACT STATEMENT 2-28
Environmental Impact Assessment – Tanjung Perak Port Development in Lamong Bay
impact will be increase of traditional fisherman boat traffic loading the
existing shipping routes in the West Part of Madura Strait.
Waterfront City Plan in Lamong Bay
Based on the information collected from the East Java Province
Environmental Agency, it is planned to establish a Waterfront City close to
Lamong Bay by a private entity. It is supposed to be a water tourist attraction
center. Theproject will be realized by reclaiming parts of Lamong Bay to
establish 2 (two) artificial islands, each with a total area of 116 Ha and 84 Ha
(See Sitemap in Figure 2.16).
The locations of the reclamation area are in two administrative territory of
Regency Government og Gresik (116 Ha) and City Government of Surabaya
(84 Ha). The project will possibly increase the surface elevation of backwater
in the estuary of Lamong River due to high tide.
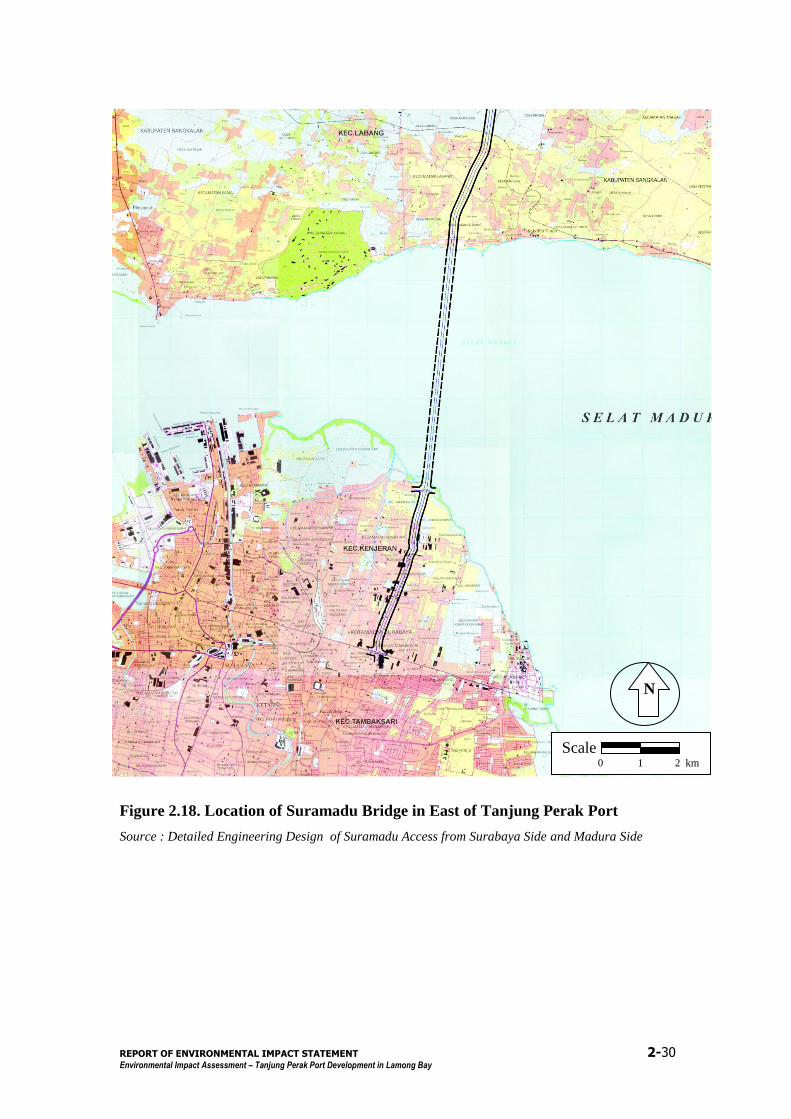
Suramadu Bridge
Suramadu Bridge is in the East of Tanjung Perak Port and relatively remote
from the studied area. The East shipping routes at present are not the ones for
vessels about to tether in Tanjung Perak Port or Container Terminal in
Lamong Bay, since the contour of the routes is too shallow for vessels to
access. The location of Suramadu Bridge is presented in Figure 2.17.
Since the location is pretty away (+ 15 km) from the project site, and it is not
in the shipping routes to the port, it does not affect Tanjung Perak Port
Development in Lamong Bay.
Indonesian Navy Arsenal in Batu Poron - Madura
In Batu Poron, Bangkalan, Madura, there is an Indonesian Navy Arsenal. The
project will not affect the arsenal as its location is relatively remote from the
project site.
REPORT OF ENVIRONMENTAL IMPACT STATEMENT 2-29
Environmental Impact Assessment – Tanjung Perak Port Development in Lamong Bay
REPORT OF ENVIRONMENTAL IMPACT STATEMENT 2-30
Environmental Impact Assessment – Tanjung Perak Port Development in Lamong Bay
Figure 2.18. Location of Suramadu Bridge in East of Tanjung Perak Port
Source : Detailed Engineering Design of Suramadu Access from Surabaya Side and Madura Side
Batas TapakN
Scale 0 1 2 km

REPORT OF ENVIRONMENTAL IMPACT STATEMENT 3-1
Environmental Impact Assessment – Tanjung Perak Port Development in Lamong Bay
3.1. General
This sub-chapter contains brief descriptions about the environment in the
planned site of business and/or activities. The environmental descriptions
details the data relevant or related to the possible impacts due to the business
and/or activity plans. The descriptions are based on secondary data and results
of direct field measuremet (Year 2008).
The reviews on the environmental descriptions are elaborated in terms of some
environmental perspectives: geophysical-chemical components, hydrology and
hydro-oceanography, biology socio-economic and cultural aspects, public
health and transportation.
3.2. Geo-Physical and Chemical Components
3.2.1. Climatic Aspects
The condition of climates in Lamong Bay and its surroundingcan be identified
with referece to the measurement data collected in Tanjung Perak Port.The
measurements cover rainfall, temperature, humidity, wind direction and wind
speed as well as sunlight. The climatic conditions and measurement data in
Tanjung Perak Meteorology Station 1 Surabaya during the last 10 years are
presented in graphs in Figure 3.1 though Figure 3.2.
REPORT OF ENVIRONMENTAL IMPACT STATEMENT 3-2
Environmental Impact Assessment – Tanjung Perak Port Development in Lamong Bay
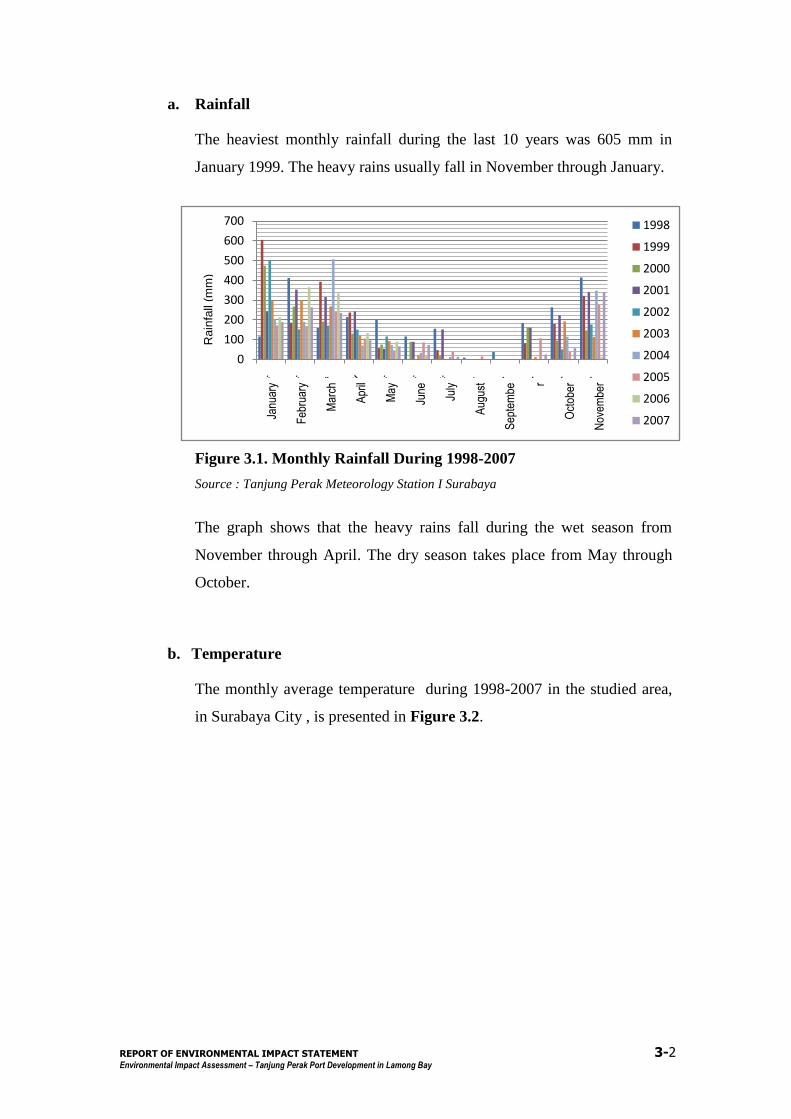
a. Rainfall
The heaviest monthly rainfall during the last 10 years was 605 mm in
January 1999. The heavy rains usually fall in November through January.
Figure 3.1. Monthly Rainfall During 1998-2007
Source : Tanjung Perak Meteorology Station I Surabaya
The graph shows that the heavy rains fall during the wet season from
November through April. The dry season takes place from May through
October.
b. Temperature
The monthly average temperature during 1998-2007 in the studied area,
in Surabaya City , is presented in Figure 3.2.
0
100
200
300
400
500
600
700C
ura
h H
uja
n (
mm
)
1998
1999
2000
2001
2002
2003
2004
2005
2006
2007Janu
ary
Feb
ruar
y
Mar
ch
Apr
il
May
June
July
Aug
ust
Sep
tem
be
r
Oct
ober
Nov
embe
r
Dec
embe
r
Ra
infa
ll (m
m)

REPORT OF ENVIRONMENTAL IMPACT STATEMENT 3-3
Environmental Impact Assessment – Tanjung Perak Port Development in Lamong Bay
Figure 3.2. Monthly Average Temperature during 1998-2007
Source : Tanjung Perak Meteorology Station I Surabaya
The monthly average highest temperature was in November 2006, i.e.
30.6oC, while the monthly average lowest one was in January 2001,
i.e.: 26.9oC.
c. Wind Speed and Direction
The wind speed and directions as observed by Tanjung Perak
Meteorology Station I Surabaya during 1998 – 2007 are presented in
Table 3.1.
Table 3.1. Wind Speed and Directions as Observed by Tanjung Perak
Meteorology Station I during 1998 – 2007
1998 1999 2000 2001
MOST WIND MAX. WIND MOST WIND MAX. WIND MOST WIND MAX. WIND MOST WIND MAX. WIND
DIR SPD DIR SPD DIR SPD DIR SPD DIR SPD DIR SPD DIR SPD DIR SPD
W 4 S 20 W 4 W 4 W 5 NW 20 W 5 NW 20
W 3 NW 13 W 3 W 3 W 6 W 17 W 6 NW 17
E 3 E 24 E 3 E 3 W 5 W 30 W 5 NW 30
E 4 E 16 E 4 E 4 W 4 S 20 W 4 S 20
E 5 E 20 E 5 E 5 E 4 S 15 E 4 S 15
E 4 E 20 E 4 E 4 E 4 E 20 E 4 E 20
E 5 NE 18 E 5 E 5 E 5 E 22 E 5 E 22
E 6 E 20 E 6 E 6 E 6 E 22 E 6 E 22
E 6 E 20 E 6 E 6 E 7 E 22 E 7 E 22
E 4 E 20 E 4 E 4 E 3 SE 20 E 3 SE 20
W 5 NW 18 W 5 W 5 W 4 NW 20 W 4 NW 20
W 5 NW 24 W 5 W 5 W 6 W 24 W 6 NW 24
25
26
27
28
29
30
31
Suh
u (
oC
)
1998
1999
2000
2001
2002
2003
2004
2005
2006
2007
Janu
ary
Feb
ruar
y
Mar
ch
Apr
il
May
June
July
Aug
ust
Sep
tem
ber
Oct
ober
Nov
embe
r
Dec
embe
r
Te
mpe
ratu
re (
ºC)
REPORT OF ENVIRONMENTAL IMPACT STATEMENT 3-4
Environmental Impact Assessment – Tanjung Perak Port Development in Lamong Bay
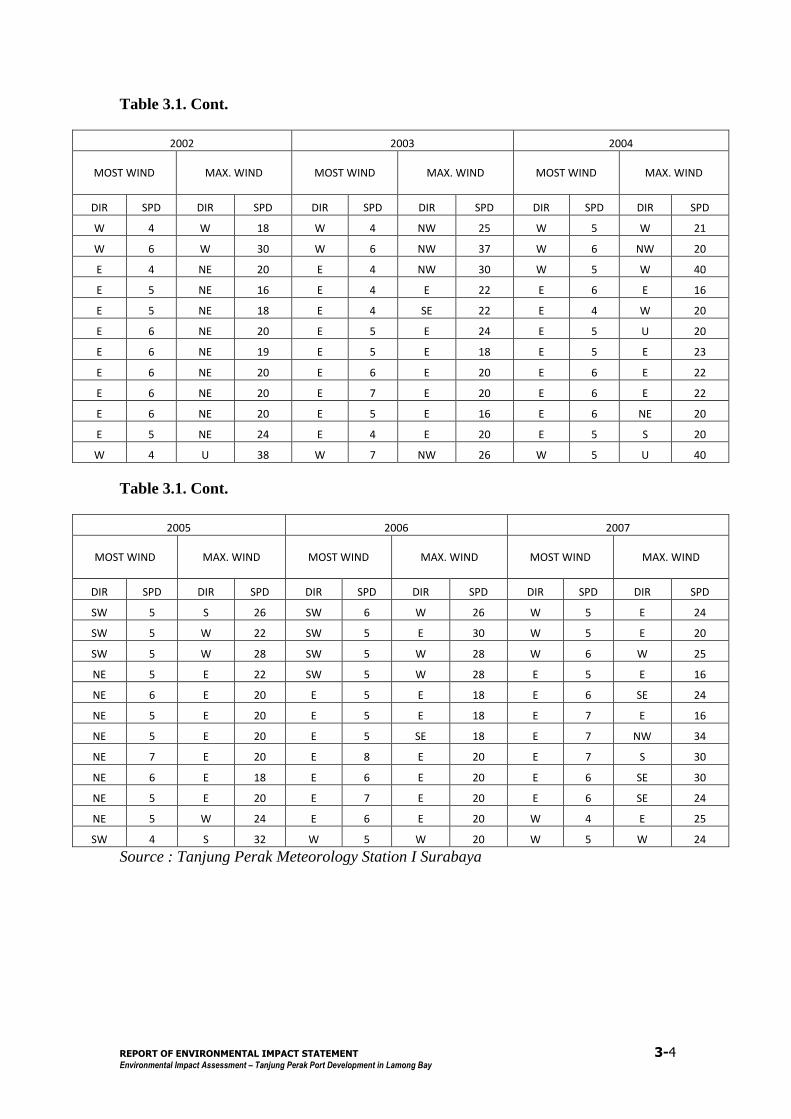
Table 3.1. Cont.
2002 2003 2004
MOST WIND MAX. WIND MOST WIND MAX. WIND MOST WIND MAX. WIND
DIR SPD DIR SPD DIR SPD DIR SPD DIR SPD DIR SPD
W 4 W 18 W 4 NW 25 W 5 W 21
W 6 W 30 W 6 NW 37 W 6 NW 20
E 4 NE 20 E 4 NW 30 W 5 W 40
E 5 NE 16 E 4 E 22 E 6 E 16
E 5 NE 18 E 4 SE 22 E 4 W 20
E 6 NE 20 E 5 E 24 E 5 U 20
E 6 NE 19 E 5 E 18 E 5 E 23
E 6 NE 20 E 6 E 20 E 6 E 22
E 6 NE 20 E 7 E 20 E 6 E 22
E 6 NE 20 E 5 E 16 E 6 NE 20
E 5 NE 24 E 4 E 20 E 5 S 20
W 4 U 38 W 7 NW 26 W 5 U 40
Table 3.1. Cont.
2005 2006 2007
MOST WIND MAX. WIND MOST WIND MAX. WIND MOST WIND MAX. WIND
DIR SPD DIR SPD DIR SPD DIR SPD DIR SPD DIR SPD
SW 5 S 26 SW 6 W 26 W 5 E 24
SW 5 W 22 SW 5 E 30 W 5 E 20
SW 5 W 28 SW 5 W 28 W 6 W 25
NE 5 E 22 SW 5 W 28 E 5 E 16
NE 6 E 20 E 5 E 18 E 6 SE 24
NE 5 E 20 E 5 E 18 E 7 E 16
NE 5 E 20 E 5 SE 18 E 7 NW 34
NE 7 E 20 E 8 E 20 E 7 S 30
NE 6 E 18 E 6 E 20 E 6 SE 30
NE 5 E 20 E 7 E 20 E 6 SE 24
NE 5 W 24 E 6 E 20 W 4 E 25
SW 4 S 32 W 5 W 20 W 5 W 24
Source : Tanjung Perak Meteorology Station I Surabaya
REPORT OF ENVIRONMENTAL IMPACT STATEMENT 3-5
Environmental Impact Assessment – Tanjung Perak Port Development in Lamong Bay
With reference to the aforementioned data, it shows that the wind direction is
dominantly W-E, with averge maximum speed of 20 knot and average speed 5
knot.
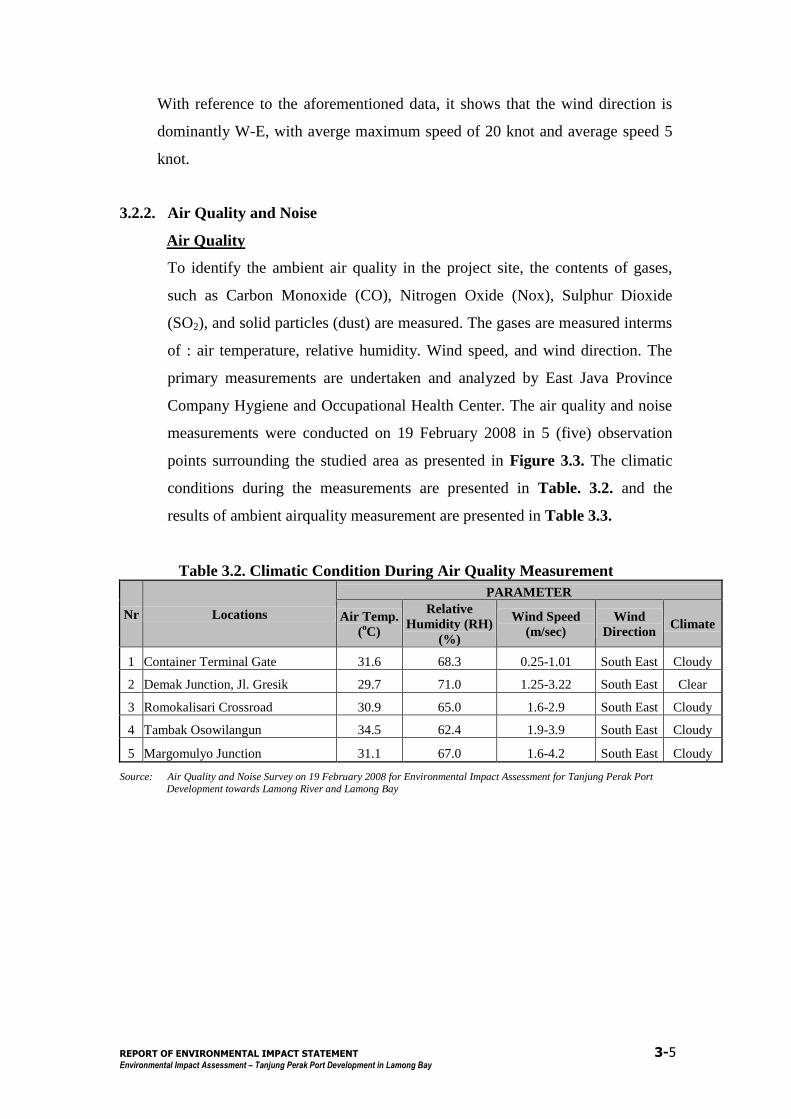
3.2.2. Air Quality and Noise
Air Quality
To identify the ambient air quality in the project site, the contents of gases,
such as Carbon Monoxide (CO), Nitrogen Oxide (Nox), Sulphur Dioxide
(SO2), and solid particles (dust) are measured. The gases are measured interms
of : air temperature, relative humidity. Wind speed, and wind direction. The
primary measurements are undertaken and analyzed by East Java Province
Company Hygiene and Occupational Health Center. The air quality and noise
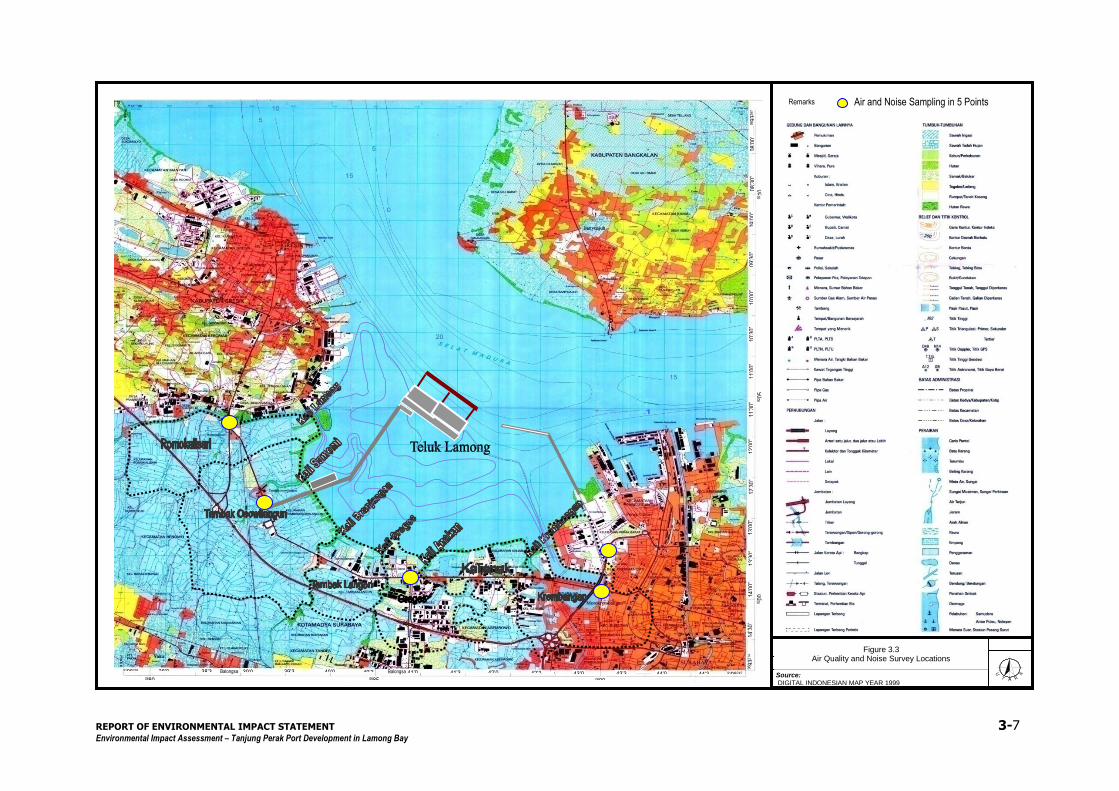
measurements were conducted on 19 February 2008 in 5 (five) observation
points surrounding the studied area as presented in Figure 3.3. The climatic
conditions during the measurements are presented in Table. 3.2. and the
results of ambient airquality measurement are presented in Table 3.3.
Table 3.2. Climatic Condition During Air Quality Measurement
Nr Locations
PARAMETER
Air Temp.
(oC)
Relative
Humidity (RH)
(%)
Wind Speed
(m/sec)
Wind
Direction Climate
1 Container Terminal Gate 31.6 68.3 0.25-1.01 South East Cloudy
2 Demak Junction, Jl. Gresik 29.7 71.0 1.25-3.22 South East Clear
3 Romokalisari Crossroad 30.9 65.0 1.6-2.9 South East Cloudy
4 Tambak Osowilangun 34.5 62.4 1.9-3.9 South East Cloudy
5 Margomulyo Junction 31.1 67.0 1.6-4.2 South East Cloudy
Source: Air Quality and Noise Survey on 19 February 2008 for Environmental Impact Assessment for Tanjung Perak Port Development towards Lamong River and Lamong Bay
REPORT OF ENVIRONMENTAL IMPACT STATEMENT 3-6
Environmental Impact Assessment – Tanjung Perak Port Development in Lamong Bay
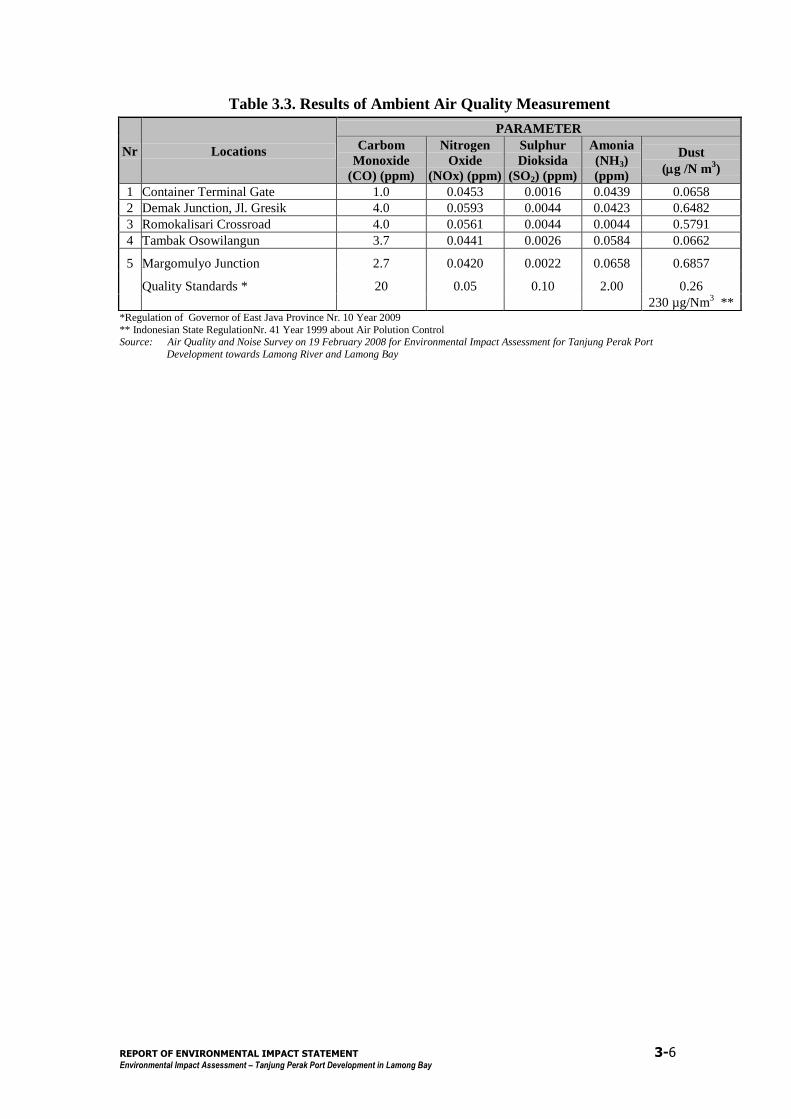
Table 3.3. Results of Ambient Air Quality Measurement
*Regulation of Governor of East Java Province Nr. 10 Year 2009
** Indonesian State RegulationNr. 41 Year 1999 about Air Polution Control Source: Air Quality and Noise Survey on 19 February 2008 for Environmental Impact Assessment for Tanjung Perak Port
Development towards Lamong River and Lamong Bay
Nr Locations
PARAMETER
Carbom
Monoxide
(CO) (ppm)
Nitrogen
Oxide
(NOx) (ppm)
Sulphur
Dioksida
(SO2) (ppm)
Amonia
(NH3)
(ppm)
Dust
(g /N m3)
1 Container Terminal Gate 1.0 0.0453 0.0016 0.0439 0.0658
2 Demak Junction, Jl. Gresik 4.0 0.0593 0.0044 0.0423 0.6482
3 Romokalisari Crossroad 4.0 0.0561 0.0044 0.0044 0.5791
4 Tambak Osowilangun 3.7 0.0441 0.0026 0.0584 0.0662
5 Margomulyo Junction 2.7 0.0420 0.0022 0.0658 0.6857
Quality Standards * 20 0.05 0.10 2.00 0.26
230 µg/Nm3
**
REPORT OF ENVIRONMENTAL IMPACT STATEMENT 3-7
Environmental Impact Assessment – Tanjung Perak Port Development in Lamong Bay
Source: DIGITAL INDONESIAN MAP YEAR 1999 BATHYMETRI MUARA KALI LAMONG TAHUN 2008
1 0 1 2k
m
SKALA
U
TA R
A
14’3
0”
14’0
0”
9200
13’3
0”
13’0
0”
12’3
0”
12’0
0”
11’3
0”
11’0
0”
9205
10’3
0”
10’0
0”
09’3
0”
09’0
0”
08’3
0”
9210
08
’00”
06
932
67
mT
44’00”
44’30”
9198242 mU
9198293 mU
38’00”
38’30” 0680
Balongsari
3,5 km
39’00”
39’30”
40’00”
40’30” 0685
Balongsa
ri 1 km
41’00”
41’30”
42’00”
42’30”
43’00” 0690
43’30”
0693
214
mT
Remarks : Air and Noise Sampling in 5 Points
-1 -
0,8 -
0,2
-0,6
10
Figure 3.3 Air Quality and Noise Survey Locations
REPORT OF ENVIRONMENTAL IMPACT STATEMENT 3-8
Environmental Impact Assessment – Tanjung Perak Port Development in Lamong Bay
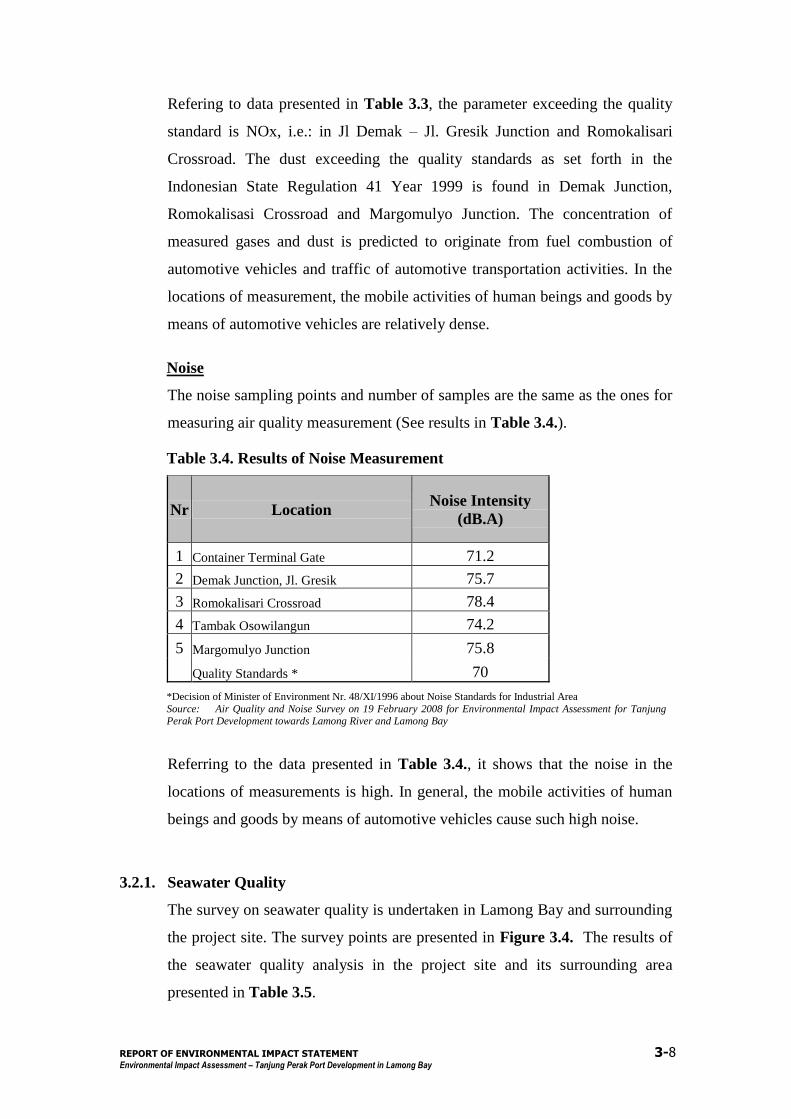
Refering to data presented in Table 3.3, the parameter exceeding the quality
standard is NOx, i.e.: in Jl Demak – Jl. Gresik Junction and Romokalisari
Crossroad. The dust exceeding the quality standards as set forth in the
Indonesian State Regulation 41 Year 1999 is found in Demak Junction,
Romokalisasi Crossroad and Margomulyo Junction. The concentration of
measured gases and dust is predicted to originate from fuel combustion of
automotive vehicles and traffic of automotive transportation activities. In the
locations of measurement, the mobile activities of human beings and goods by
means of automotive vehicles are relatively dense.
Noise
The noise sampling points and number of samples are the same as the ones for
measuring air quality measurement (See results in Table 3.4.).
Table 3.4. Results of Noise Measurement
Nr Location Noise Intensity
(dB.A)
1 Container Terminal Gate 71.2
2 Demak Junction, Jl. Gresik 75.7
3 Romokalisari Crossroad 78.4
4 Tambak Osowilangun 74.2
5 Margomulyo Junction 75.8
Quality Standards * 70
*Decision of Minister of Environment Nr. 48/XI/1996 about Noise Standards for Industrial Area
Source: Air Quality and Noise Survey on 19 February 2008 for Environmental Impact Assessment for Tanjung Perak Port Development towards Lamong River and Lamong Bay
Referring to the data presented in Table 3.4., it shows that the noise in the
locations of measurements is high. In general, the mobile activities of human
beings and goods by means of automotive vehicles cause such high noise.
3.2.1. Seawater Quality
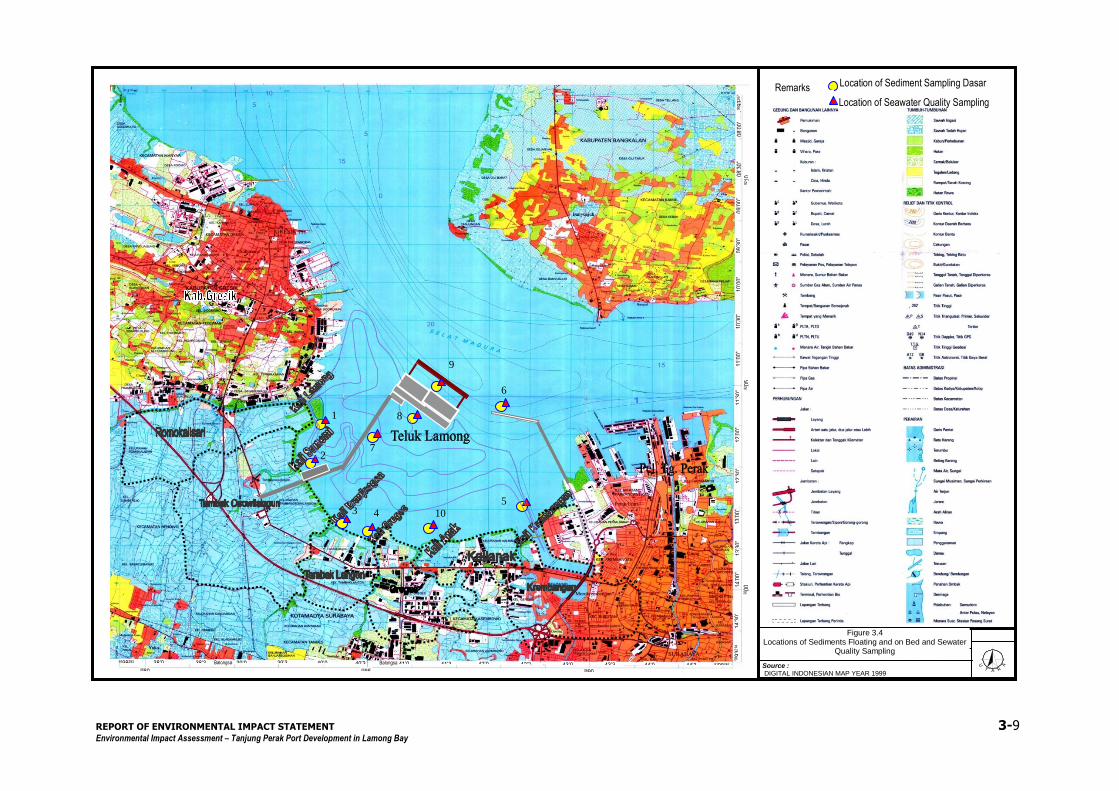
The survey on seawater quality is undertaken in Lamong Bay and surrounding
the project site. The survey points are presented in Figure 3.4. The results of
the seawater quality analysis in the project site and its surrounding area
presented in Table 3.5.
REPORT OF ENVIRONMENTAL IMPACT STATEMENT 3-9
Environmental Impact Assessment – Tanjung Perak Port Development in Lamong Bay
U
TA R
A
Source : DIGITAL INDONESIAN MAP YEAR 1999 HASIL PENGUKURAN BATHYMETRI MUARA KALI LAMONG TAHUN 2008
1 0 1 2k
m
SKALA
14’3
0”
14’0
0”
9200
13’3
0”
13’0
0”
12’3
0”
12’0
0”
11’3
0”
11’0
0”
9205
10’3
0”
10’0
0”
09’3
0”
09’0
0”
08’3
0”
9210
08
’00”
06
932
67
mT
44’00”
44’30”
9198242 mU
9198293 mU
38’00”
38’30” 0680
Balongsari
3,5 km
39’00”
39’30”
40’00”
40’30” 0685
Balongsa
ri 1 km
41’00”
41’30”
42’00”
42’30”
43’00” 0690
43’30”
0693
214
m
T
Remarks : Location of Sediment Sampling Dasar dan Layang
: Location of Seawater Quality Sampling
-1 -
0,8 -
0,2
-0,6
10
Figure 3.4 Locations of Sediments Floating and on Bed and Sewater
Quality Sampling
1
2
3 4 10
5
6
9
8
7

REPORT OF ENVIRONMENTAL IMPACT STATEMENT 3-10
Environmental Impact Assessment – Tanjung Perak Port Development in Lamong Bay
Table 3.5. Seawater Quality in Studied Area
Table 3.5. Cont.
SURVEY
LOCATIONS DESCRIPTIONS
1 Estuary of Lamong River
2 Estuary of Sememi River
3 Estuary of Branjangan River
4 Estuary of Greges River
5 Estuary of Krembangan River
6 Sea, Close toTrestle, Tanjung Perak
7 Sea, Close to Connecting Bridge
8 Sea, Close to Container Yard
9 Sea, Close to Container Yard
10 Estuary of Kalianak River
PARAMETER UNITDetection
Limit
RESULT
LOCATION - 1
RESULT
LOCATION - 2
RESULT
LOCATION - 3
RESULT
LOCATION - 4
RESULT
LOCATION - 5
Physical :
Clarity **) m 0.1 NA NA NA NA NA
Odour - - Odorless Odorless Odorless Odorless Odorless
Total Suspended Solid mg/l 1 83.0 17.0 20.0 14.0 13.0
Rubbish **) - - ) Nihil ) Nihil ) Nihil ) Nihil ) Nihil
Temperatur **) C 0.1 ) 27.3 ) 27.4 ) 27.3 ) 27.3 ) 27.3
Oil Layer **) - - ) Nihil ) Nihil ) Nihil ) Nihil ) Nihil
Chemical :
pH **) - 0.01 ) 7.75 ) 7.69 ) 7.86 ) 8.23 ) 8.23
Salinity as NaCl ‰ 0.1 29.4 28.5 26.4 27.4 27.8
Total Ammoniac (NH3-N) mg/l 0.01 nd nd nd nd nd
Sulfide (H2S) mg/l 0.01 nd nd nd nd nd
Total Hidrocarbon mg/l - NA NA NA NA NA
Total Phenolic Compound mg/l 0.001 nd nd nd nd nd
Total PCB (Polychlor Bifenyl) mg/l 0.001 nd nd nd nd nd
Surfactans Anionic as MBAS mg/l 0.03 nd nd nd nd nd
Oil and Grease mg/l 0.2 nd nd nd nd nd
TBT (TributylTin) mg Sn/L - NA NA NA NA NA
Dissolved Metals :
Mercury (Hg) mg/l 0.001 nd nd nd nd nd
Cadmium (Cd) mg/l 0.004 nd nd nd nd nd
Copper (Cu) mg/l 0.004 nd nd nd nd nd
Lead (Pb) mg/l 0.007 nd nd nd nd nd
Zinc (Zn) mg/l 0.01 nd nd nd nd nd
Biology :
Total Coliform MPN/100 ml 2 9 240 900 240 nd
PARAMETERRESULT
LOCATION - 6
RESULT
LOCATION - 7
RESULT
LOCATION - 8
RESULT
LOCATION - 9
RESULT
LOCATION - 10
QUALITY
STANDARD *)Test Method
Physical :
Clarity **) NA NA NA NA NA > 3 Visual
Odour Odorless Odorless Odorless Odorless Odorless Odorless 2105-B #)
Total Suspended Solid 25.0 11.0 10.0 17.0 24.0 80 2540-D
Rubbish **) ) Nihil ) Nihil ) Nihil ) Nihil ) Nihil Nihil Visual
Temperatur **) ) 27.3 ) 27.3 ) 27.2 ) 27.2 ) 27.3 Natural 2550-B
Oil Layer **) ) Nihil ) Nihil ) Nihil ) Nihil ) Nihil Nihil Visual
Chemical :
pH **) ) 7.87 ) 8.05 ) 7.98 ) 8.08 ) 8.31 6.5 - 8.5 4500-H+-B #)
Salinity as NaCl 28.5 32.2 32.1 31.9 25.5 Natural 2520-B #)
Total Ammoniac (NH3-N) nd nd nd nd nd 0.3 4500-NH3-F #)
Sulfide (H2S) nd nd nd nd nd 0.03 4500-S2-B #)
Total Hidrocarbon NA NA NA NA NA 1 -
Total Phenolic Compound nd nd nd nd nd 0.002 5530-C #)
Total PCB (Polychlor Bifenyl) nd nd nd nd nd 0.01 US EPA 608
Surfactans Anionic as MBAS nd nd nd nd nd 1 5540-C #)
Oil and Grease nd nd nd nd nd 5 5520-B #)
TBT (TributylTin) NA NA NA NA NA 0.01 -
Dissolved Metals :
Mercury (Hg) nd nd nd nd nd 0.003 3114-C #)
Cadmium (Cd) nd nd nd nd nd 0.01 3111-B #)
Copper (Cu) nd nd nd nd nd 0.05 3111-B #)
Lead (Pb) nd nd nd nd nd 0.05 3111-B #)
Zinc (Zn) nd nd nd nd nd 0.1 3111-B #)
Biology :
Total Coliform 6 nd nd nd 9 1000 SM, 20 Ed, 1998
*) Kep. MNLH No. 51/2004, Standard Quality of Sea Water for The Marine Port (Attachment I)
**) Should be measured on site
) Results on Laboratory
NA = Not Application
nd = Not detected
Analysis of PCB carried out by Sucofindo Cibitung Laboratory
#) Standard Methods 21th Edition 2005 Mod. 212/36.30/000104/05/2008/0001045051Rtn/Upt
Source : Seawater Quality Survey , Juni 2008
REPORT OF ENVIRONMENTAL IMPACT STATEMENT 3-11
Environmental Impact Assessment – Tanjung Perak Port Development in Lamong Bay
Based on the data presented in Table 3.5., it is found that, when compared to
the standards set forth in Decisison of Minister of Environment Nr. 51/2004,
the seawater quality is described as follows :
The seawater physical quality based on the result of measurement on
parameter of suspended solid, there is 1 location the quality of whicj
exceeds the standard quality, i.e. : waters in Lamong River (Location Nr.
1).
The seawater chemical quality measured in 10 measurement locations I
sin general satisfy the seawater quality standards in port area. Seaa
locations in Figure 3.4.
Referring to the aforementioned descriptions, it is conclusive that the
seawater in the studied area and its surrounding satisfy the quality standards
for port area.
The quite number of suspended solid in the studied area , especially the one
in Location 1 or in front of the estuary of Lamong River is due to the
sediment in Lamong River. It contains mud drawn by the river water and
accumulated in the estuary.
3.2.2. Borlog and Soil Stratigraph
Based on the results of “Study on Technical and Environmental Reviews on
Shipping Routes, Sedimentation and Reclamation in Coastal Area in Madura
Strait”, in the waters area of Lamong River with seabed depth –2.00 m LWS.
Averagely in 13 m thickness from the seabed, the soil layers are dominated
with clay and very soft silt with N-SPT value ranging 0 through 4. (See Figure
3.5).
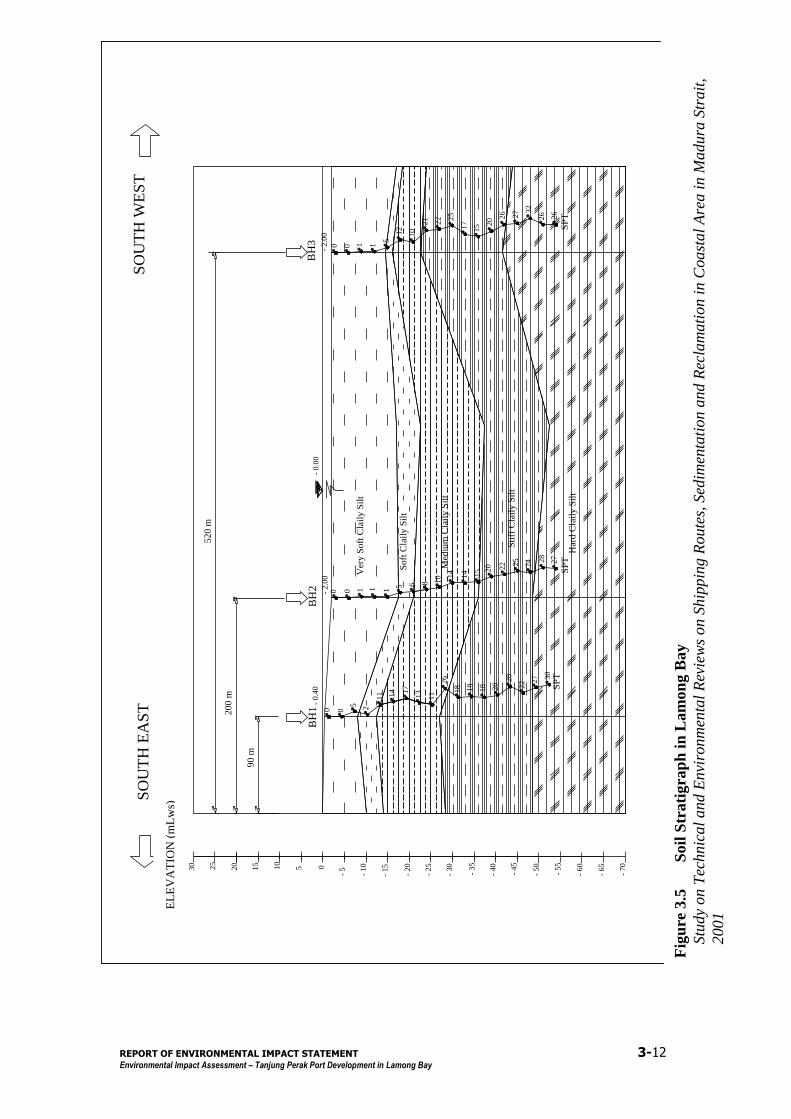
REPORT OF ENVIRONMENTAL IMPACT STATEMENT 3-12
Environmental Impact Assessment – Tanjung Perak Port Development in Lamong Bay
Su
mb
er
:
Ha
sil
Su
rve
y P
en
ye
lid
ikan
Tan
ah
Pekerj
aan
Kajia
n T
ekn
is d
an
Lin
gk
un
ga
n T
erh
ad
ap
Alu
r
Pe
lay
ara
n,
Se
dim
en
tas
i d
an
Tah
ap
an
Rekla
masi
di
Pe
sis
ir S
ela
t M
ad
ura
LA
PO
RA
N A
KH
IR
TU A
RA
KE
TE
RA
NG
AN
:
Ha
lam
an
: I
V -
22
Le
mb
ag
a P
en
elitia
n (L
EM
LIT
) - IT
S
PT
. (P
erse
ro
) P
ela
bu
ha
n In
do
ne
sia
III
PE
KE
RJA
AN
:
ST
UD
I A
NA
LIS
IS M
EN
GE
NA
I D
AM
PA
K L
ING
KU
NG
AN
PE
NG
EM
BA
NG
AN
PE
LA
BU
HA
N
TA
NJU
NG
PE
RA
K K
E A
RA
H M
UA
RA
KA
LI L
AM
ON
G D
AN
TE
LU
K L
AM
ON
G
Ga
mb
ar
:
Str
ati
gra
fi T
an
ah
di
Lo
ka
si
Stu
di
TU A
RA
No
me
r G
am
ba
r :
4.4
KE
TE
RA
NG
AN
:P
T. (P
erse
ro
) P
ela
bu
ha
n In
do
ne
sia
III
0 0
5 2
11 14 17
13
11
26
18 19 20
18
28
22 2
7 30
0 10 1
8 10 1
4
14 15 2
0 22 25
24 2728
1
5 6
0 0 1 1
5
12
10
21 22 25
17
15 2
0 26 27 3
2
26 26
30
- 60
Ver
y S
oft
Cla
ily S
ilt
Soft
Cla
ily S
ilt
Har
d C
lail
y S
ilt
Med
ium
Cla
ily S
ilt
Sti
ff C
lail
y S
ilt
- 2.0
0-
2.0
0-
0.4
0
EL
EV
AS
I (
mL
WS
)
TE
NG
GA
RA
BA
RA
T L
AU
T
- 65
- 7025
20
15 10
5 0
- 50
- 45
- 40
- 35
- 30
- 25
- 20
- 15
- 10
- 5
- 55
BH
1B
H2
BH
3-
0.0
0
200 m
520 m
90 m
SP
TS
PT
SP
T
Fig
ure
3.5
S
oil
Str
ati
gra
ph
in
Lam
on
g B
ay
Stu
dy
on T
echnic
al
and E
nvi
ronm
enta
l R
evie
ws
on S
hip
pin
g R
oute
s, S
edim
enta
tion a
nd
Rec
lam
ati
on i
n C
oast
al
Are
a i
n M
adura
Str
ait
,
2001
SO
UT
H E
AS
T
EL
EV
AT
ION
(m
Lw
s)
SO
UT
H W
ES
T
REPORT OF ENVIRONMENTAL IMPACT STATEMENT 3-13
Environmental Impact Assessment – Tanjung Perak Port Development in Lamong Bay
3.3. Hydrology and Hydro-oceanography Components
3.3.1. Hydrology Aspects
Watershed
In the studied area there are rivers draining into Lamong Bay. They are
Lamong River, Krembangan River, Anak River, Greges River, Branjangan
River and Sememi River. They mainly serve as area drainages. The river
waterflows originate from the surrounding areas and household liquid wastes.
These rivers drain into Gunungsari Drainage System as they are connected to
Gunungsari Primary Drainage. Gunungsari Primary Drainage used to be
irrigation network that changed into drainage due to the change of drainage
areas in the farms into dwelling and industrial areas.
The characteristics of the small rivers resemble the ones of Lamong River.
Accordingly, the results of analysis on Lamong River apply to those small
rivers.
The initial descriptions of the rivers and watersheds are as follows :
a. Lamong River
Lamong River watershed is in the administrative territories of Surabaya
City, Resik Regency and Lamongan Regency. The water spring of
Lamong River is is Kendeng Mountain located in Lamongan Regency,
while its upstream through downstream serve as the borders between
Surabaya City and Gresik Regency.
The area of Lamong River watershed is 714.46 km2, with 7 tributaries.
The upstream area comprises teak forests, settlement area, and dry farms.
In the middle it is occupied for settlement area and dry farms. The
downstream area is occupied for settlement area, fishponds and industrial
area along the river banks.
The length of Lamong River is ± 83.70 km. The meanders are located in
Jono Village, Cerme Sub-district. The water width of the river channels
in the measured area (from the estuary through ± 20 km towards
upstream) greatly vary. In the upstream, it is ± 20 m with flood plain
depth ± 5m. In the middle, it is ± 70 m with flood plain depth ± 2,50 m.
REPORT OF ENVIRONMENTAL IMPACT STATEMENT 3-14
Environmental Impact Assessment – Tanjung Perak Port Development in Lamong Bay
In the downstream, it is less wide, i.e. : ± 60 m, with flood plain depth
2,50 m.
The main problems are Lamong River are flood and sedimentation, as it
is the final drainage to some parts of Gresik Regency, Lamongan
Regency and the areas surrounding the river. Floods in Lamong River
watershed always present in wet season every year. Based on the
Detailed Designs and Environmental Impact Assessment concerning
Lamong River in Gresik Regency, 2005, the largest floods or the highest
puddles were in January and March 2004. The puddled areas in Gresik
Regency covered Cerme Sub-district and Duduk Sampeyan Sub-district,
Cermenlerek Village Gorekan Kidul Village with puddle height ± 1,5
mand puddled ± 600 Ha farm and settlement area as presented in Figure
3.6.
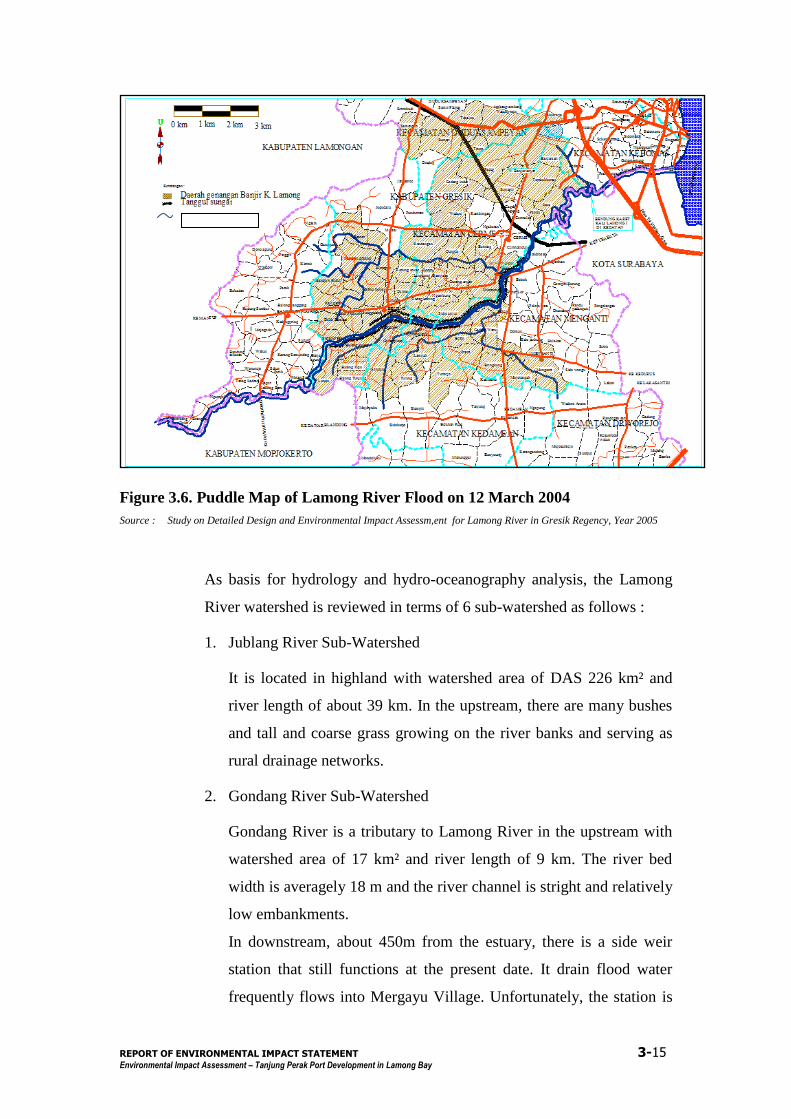
REPORT OF ENVIRONMENTAL IMPACT STATEMENT 3-15
Environmental Impact Assessment – Tanjung Perak Port Development in Lamong Bay
Figure 3.6. Puddle Map of Lamong River Flood on 12 March 2004
Source : Study on Detailed Design and Environmental Impact Assessm,ent for Lamong River in Gresik Regency, Year 2005
As basis for hydrology and hydro-oceanography analysis, the Lamong
River watershed is reviewed in terms of 6 sub-watershed as follows :
1. Jublang River Sub-Watershed
It is located in highland with watershed area of DAS 226 km² and
river length of about 39 km. In the upstream, there are many bushes
and tall and coarse grass growing on the river banks and serving as
rural drainage networks.
2. Gondang River Sub-Watershed
Gondang River is a tributary to Lamong River in the upstream with
watershed area of 17 km² and river length of 9 km. The river bed
width is averagely 18 m and the river channel is stright and relatively
low embankments.
In downstream, about 450m from the estuary, there is a side weir
station that still functions at the present date. It drain flood water
frequently flows into Mergayu Village. Unfortunately, the station is
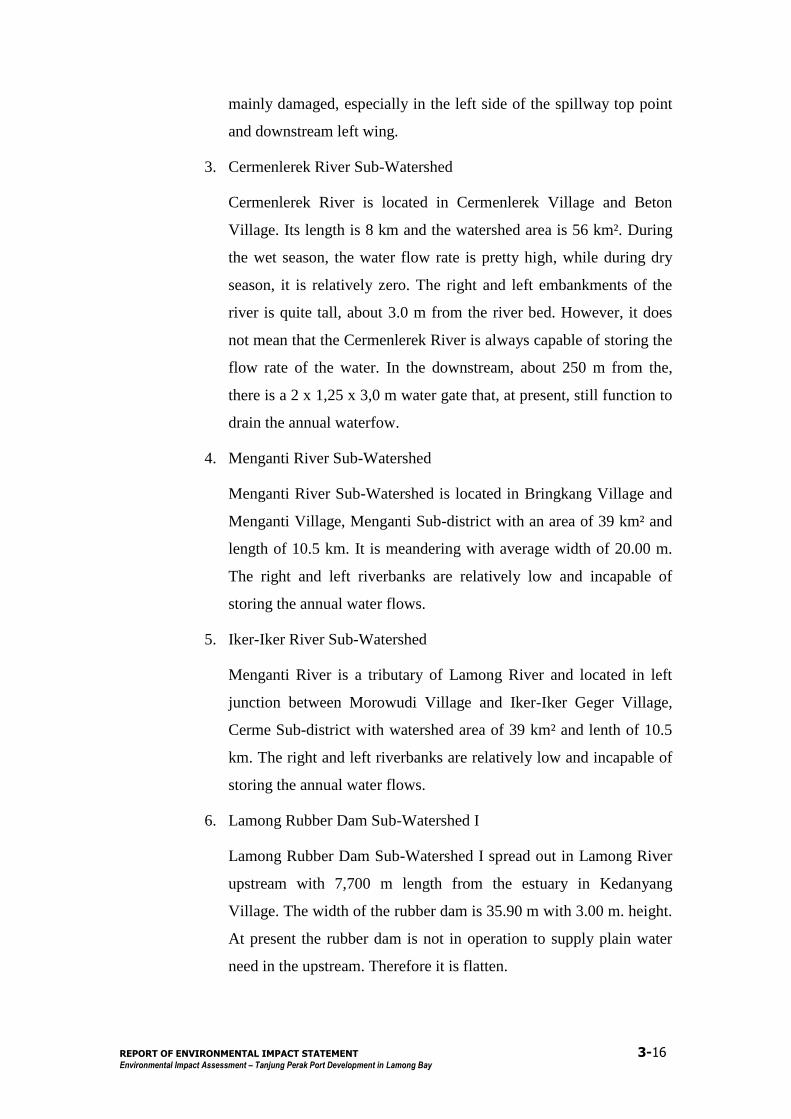
REPORT OF ENVIRONMENTAL IMPACT STATEMENT 3-16
Environmental Impact Assessment – Tanjung Perak Port Development in Lamong Bay
mainly damaged, especially in the left side of the spillway top point
and downstream left wing.
3. Cermenlerek River Sub-Watershed
Cermenlerek River is located in Cermenlerek Village and Beton
Village. Its length is 8 km and the watershed area is 56 km². During
the wet season, the water flow rate is pretty high, while during dry
season, it is relatively zero. The right and left embankments of the
river is quite tall, about 3.0 m from the river bed. However, it does
not mean that the Cermenlerek River is always capable of storing the
flow rate of the water. In the downstream, about 250 m from the,
there is a 2 x 1,25 x 3,0 m water gate that, at present, still function to
drain the annual waterfow.
4. Menganti River Sub-Watershed
Menganti River Sub-Watershed is located in Bringkang Village and
Menganti Village, Menganti Sub-district with an area of 39 km² and
length of 10.5 km. It is meandering with average width of 20.00 m.
The right and left riverbanks are relatively low and incapable of
storing the annual water flows.
5. Iker-Iker River Sub-Watershed
Menganti River is a tributary of Lamong River and located in left
junction between Morowudi Village and Iker-Iker Geger Village,
Cerme Sub-district with watershed area of 39 km² and lenth of 10.5
km. The right and left riverbanks are relatively low and incapable of
storing the annual water flows.
6. Lamong Rubber Dam Sub-Watershed I
Lamong Rubber Dam Sub-Watershed I spread out in Lamong River
upstream with 7,700 m length from the estuary in Kedanyang
Village. The width of the rubber dam is 35.90 m with 3.00 m. height.
At present the rubber dam is not in operation to supply plain water
need in the upstream. Therefore it is flatten.
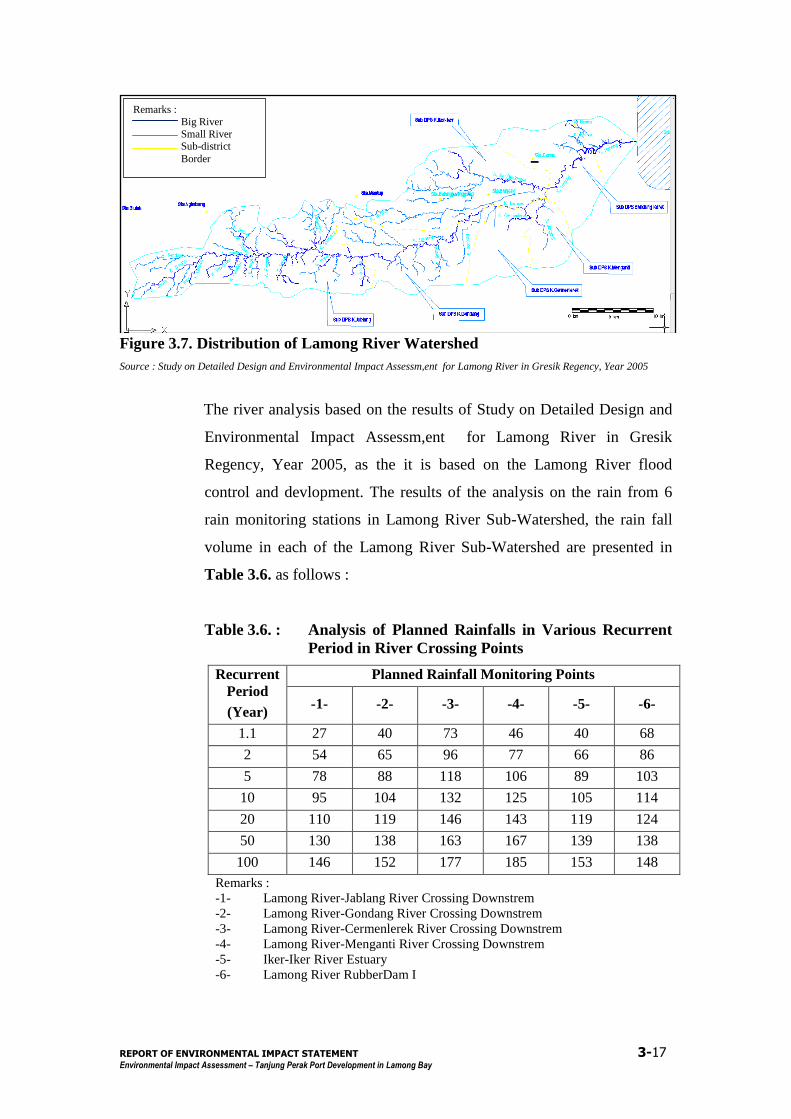
REPORT OF ENVIRONMENTAL IMPACT STATEMENT 3-17
Environmental Impact Assessment – Tanjung Perak Port Development in Lamong Bay
Figure 3.7. Distribution of Lamong River Watershed
Source : Study on Detailed Design and Environmental Impact Assessm,ent for Lamong River in Gresik Regency, Year 2005
The river analysis based on the results of Study on Detailed Design and
Environmental Impact Assessm,ent for Lamong River in Gresik
Regency, Year 2005, as the it is based on the Lamong River flood
control and devlopment. The results of the analysis on the rain from 6
rain monitoring stations in Lamong River Sub-Watershed, the rain fall
volume in each of the Lamong River Sub-Watershed are presented in
Table 3.6. as follows :
Table 3.6. : Analysis of Planned Rainfalls in Various Recurrent
Period in River Crossing Points
Recurrent
Period
(Year)
Planned Rainfall Monitoring Points
-1- -2- -3- -4- -5- -6-
1.1 27 40 73 46 40 68
2 54 65 96 77 66 86
5 78 88 118 106 89 103
10 95 104 132 125 105 114
20 110 119 146 143 119 124
50 130 138 163 167 139 138
100 146 152 177 185 153 148
Remarks :
-1- Lamong River-Jablang River Crossing Downstrem
-2- Lamong River-Gondang River Crossing Downstrem
-3- Lamong River-Cermenlerek River Crossing Downstrem
-4- Lamong River-Menganti River Crossing Downstrem
-5- Iker-Iker River Estuary
-6- Lamong River RubberDam I
Remarks :
Big River
Small River Sub-district
Border
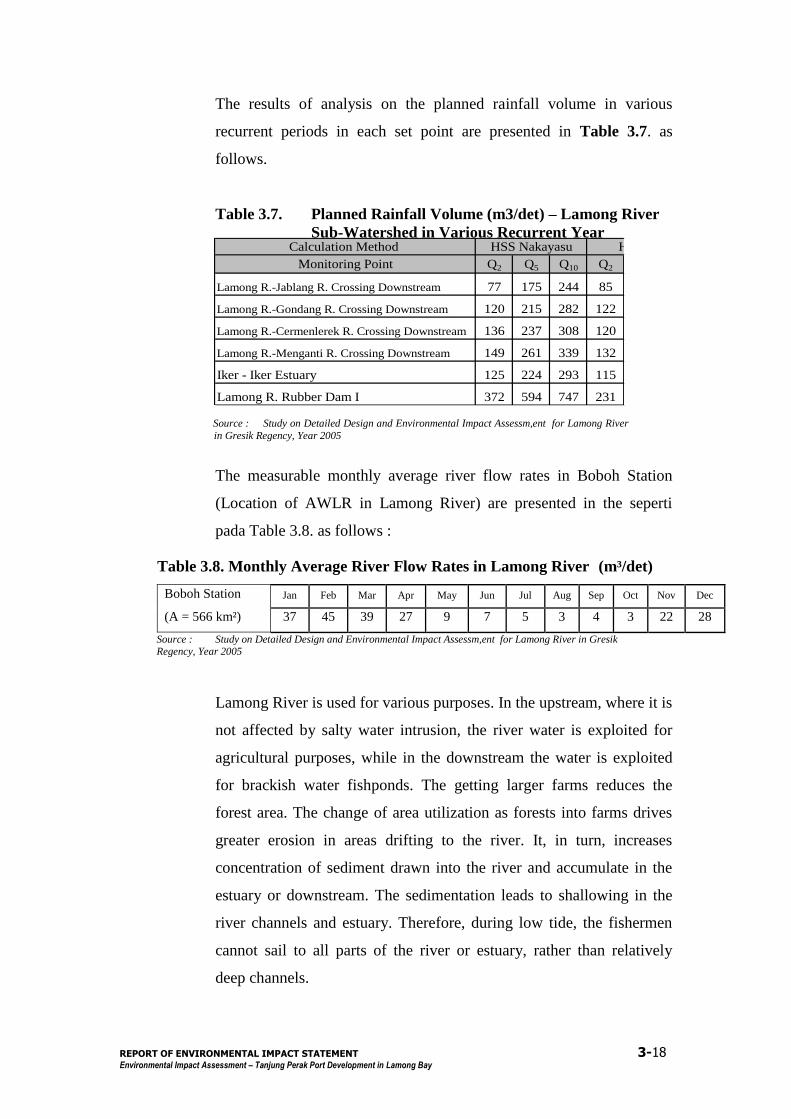
REPORT OF ENVIRONMENTAL IMPACT STATEMENT 3-18
Environmental Impact Assessment – Tanjung Perak Port Development in Lamong Bay
The results of analysis on the planned rainfall volume in various
recurrent periods in each set point are presented in Table 3.7. as
follows.
Table 3.7. Planned Rainfall Volume (m3/det) – Lamong River
Sub-Watershed in Various Recurrent Year
Source : Study on Detailed Design and Environmental Impact Assessm,ent for Lamong River
in Gresik Regency, Year 2005
The measurable monthly average river flow rates in Boboh Station
(Location of AWLR in Lamong River) are presented in the seperti
pada Table 3.8. as follows :
Table 3.8. Monthly Average River Flow Rates in Lamong River (m³/det)
Boboh Station
(A = 566 km²)
Jan Feb Mar Apr May Jun Jul Aug Sep Oct Nov Dec
37 45 39 27 9 7 5 3 4 3 22 28
Source : Study on Detailed Design and Environmental Impact Assessm,ent for Lamong River in Gresik Regency, Year 2005
Lamong River is used for various purposes. In the upstream, where it is
not affected by salty water intrusion, the river water is exploited for
agricultural purposes, while in the downstream the water is exploited
for brackish water fishponds. The getting larger farms reduces the
forest area. The change of area utilization as forests into farms drives
greater erosion in areas drifting to the river. It, in turn, increases
concentration of sediment drawn into the river and accumulate in the
estuary or downstream. The sedimentation leads to shallowing in the
river channels and estuary. Therefore, during low tide, the fishermen
cannot sail to all parts of the river or estuary, rather than relatively
deep channels.
Calculation Method
Monitoring Point Q2 Q5 Q10 Q2
Lamong R.-Jablang R. Crossing Downstream 77 175 244 85
Lamong R.-Gondang R. Crossing Downstream 120 215 282 122
Lamong R.-Cermenlerek R. Crossing Downstream 136 237 308 120
Lamong R.-Menganti R. Crossing Downstream 149 261 339 132
Iker - Iker Estuary 125 224 293 115
Lamong R. Rubber Dam I 372 594 747 231
(m3/det)
HSS Nakayasu HEC - 1

REPORT OF ENVIRONMENTAL IMPACT STATEMENT 3-19
Environmental Impact Assessment – Tanjung Perak Port Development in Lamong Bay
The area utilized for fishponds in the Lamong River watershed is
relativelt large. Although, there have been conversions of findponds
into industrial estates, the number of inlets of fishponds up to Jono
Village are still significant
The seawater flows (backwater) drain salty water into the river surface
and make the river water brackish and contain higher salinity
compared to the one from fresh water draining into the Lamong River
watershed. The local people use the salty water to fill their fishponds
to breed fish and shrimps and produce salts.
Lamong River is also used as a traffic facility among the fishermen
residing in Pojok Village, Tenapes Village and Jono Village.
The data of the cross section of the river resulted from the previous
study, from the estuary through 20 km towards the upstream are
presented below.
Figure 3.8. Some Cross Sections of Lamong River
Source : Study on Detailed Design and Environmental Impact Assessm,ent for Lamong River in Gresik
Regency, Year 2005
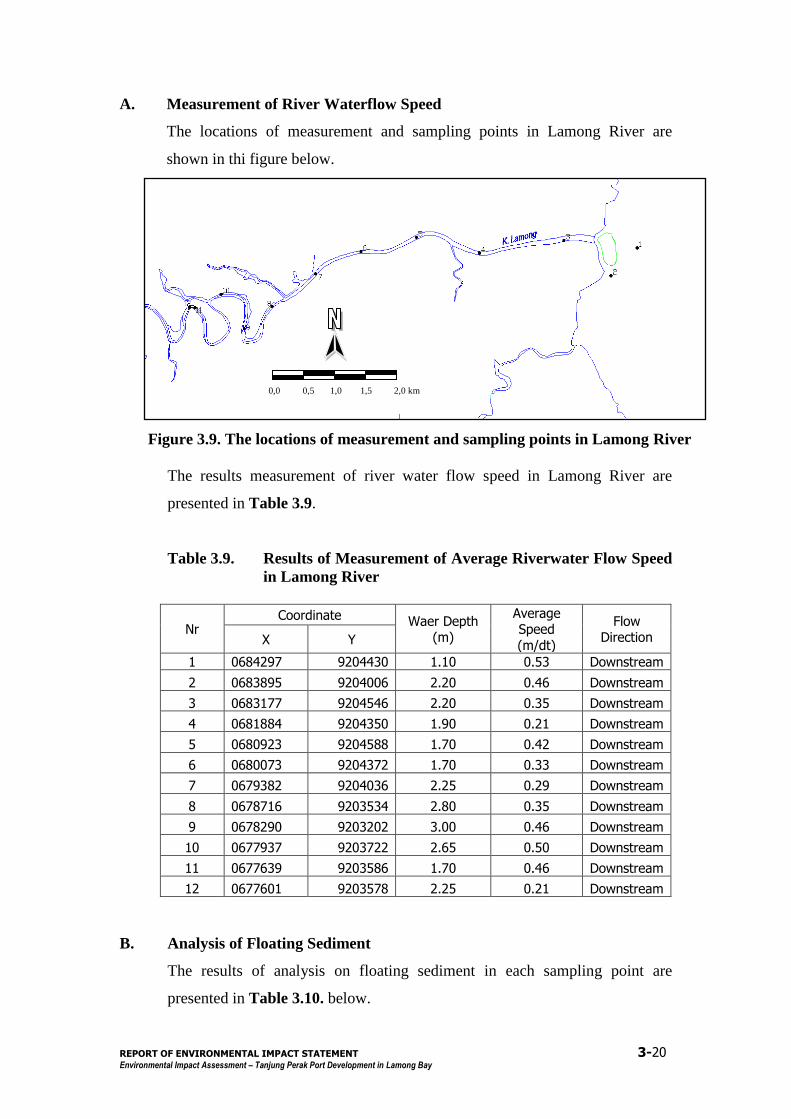
REPORT OF ENVIRONMENTAL IMPACT STATEMENT 3-20
Environmental Impact Assessment – Tanjung Perak Port Development in Lamong Bay
A. Measurement of River Waterflow Speed
The locations of measurement and sampling points in Lamong River are
shown in thi figure below.
Figure 3.9. The locations of measurement and sampling points in Lamong River
The results measurement of river water flow speed in Lamong River are
presented in Table 3.9.
Table 3.9. Results of Measurement of Average Riverwater Flow Speed
in Lamong River
Nr Coordinate Waer Depth
(m)
Average Speed
(m/dt)
Flow Direction X Y
1 0684297 9204430 1.10 0.53 Downstream
2 0683895 9204006 2.20 0.46 Downstream
3 0683177 9204546 2.20 0.35 Downstream
4 0681884 9204350 1.90 0.21 Downstream
5 0680923 9204588 1.70 0.42 Downstream
6 0680073 9204372 1.70 0.33 Downstream
7 0679382 9204036 2.25 0.29 Downstream
8 0678716 9203534 2.80 0.35 Downstream
9 0678290 9203202 3.00 0.46 Downstream
10 0677937 9203722 2.65 0.50 Downstream
11 0677639 9203586 1.70 0.46 Downstream
12 0677601 9203578 2.25 0.21 Downstream
B. Analysis of Floating Sediment
The results of analysis on floating sediment in each sampling point are
presented in Table 3.10. below.
0,0 0,5 1,0 1,5 2,0 km
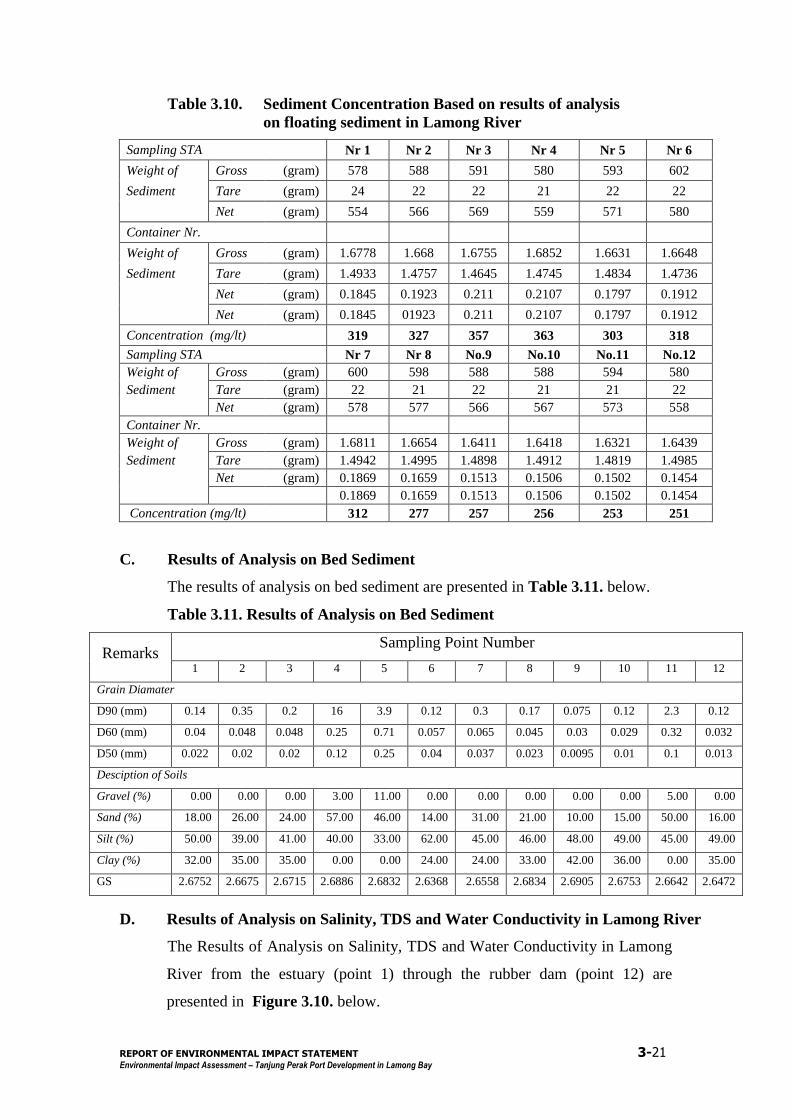
REPORT OF ENVIRONMENTAL IMPACT STATEMENT 3-21
Environmental Impact Assessment – Tanjung Perak Port Development in Lamong Bay
Table 3.10. Sediment Concentration Based on results of analysis
on floating sediment in Lamong River
Sampling STA Nr 1 Nr 2 Nr 3 Nr 4 Nr 5 Nr 6
Weight of Gross (gram) 578 588 591 580 593 602
Sediment Tare (gram) 24 22 22 21 22 22
Net (gram) 554 566 569 559 571 580
Container Nr.
Weight of Gross (gram) 1.6778 1.668 1.6755 1.6852 1.6631 1.6648
Sediment Tare (gram) 1.4933 1.4757 1.4645 1.4745 1.4834 1.4736
Net (gram) 0.1845 0.1923 0.211 0.2107 0.1797 0.1912
Net (gram) 0.1845 01923 0.211 0.2107 0.1797 0.1912
Concentration (mg/lt) 319 327 357 363 303 318
Sampling STA Nr 7 Nr 8 No.9 No.10 No.11 No.12
Weight of Gross (gram) 600 598 588 588 594 580
Sediment Tare (gram) 22 21 22 21 21 22
Net (gram) 578 577 566 567 573 558
Container Nr.
Weight of Gross (gram) 1.6811 1.6654 1.6411 1.6418 1.6321 1.6439
Sediment Tare (gram) 1.4942 1.4995 1.4898 1.4912 1.4819 1.4985
Net (gram) 0.1869 0.1659 0.1513 0.1506 0.1502 0.1454
0.1869 0.1659 0.1513 0.1506 0.1502 0.1454
Concentration (mg/lt) 312 277 257 256 253 251
C. Results of Analysis on Bed Sediment
The results of analysis on bed sediment are presented in Table 3.11. below.
Table 3.11. Results of Analysis on Bed Sediment
Remarks Sampling Point Number
1 2 3 4 5 6 7 8 9 10 11 12
Grain Diamater
D90 (mm) 0.14 0.35 0.2 16 3.9 0.12 0.3 0.17 0.075 0.12 2.3 0.12
D60 (mm) 0.04 0.048 0.048 0.25 0.71 0.057 0.065 0.045 0.03 0.029 0.32 0.032
D50 (mm) 0.022 0.02 0.02 0.12 0.25 0.04 0.037 0.023 0.0095 0.01 0.1 0.013
Desciption of Soils
Gravel (%) 0.00 0.00 0.00 3.00 11.00 0.00 0.00 0.00 0.00 0.00 5.00 0.00
Sand (%) 18.00 26.00 24.00 57.00 46.00 14.00 31.00 21.00 10.00 15.00 50.00 16.00
Silt (%) 50.00 39.00 41.00 40.00 33.00 62.00 45.00 46.00 48.00 49.00 45.00 49.00
Clay (%) 32.00 35.00 35.00 0.00 0.00 24.00 24.00 33.00 42.00 36.00 0.00 35.00
GS 2.6752 2.6675 2.6715 2.6886 2.6832 2.6368 2.6558 2.6834 2.6905 2.6753 2.6642 2.6472
D. Results of Analysis on Salinity, TDS and Water Conductivity in Lamong River
The Results of Analysis on Salinity, TDS and Water Conductivity in Lamong
River from the estuary (point 1) through the rubber dam (point 12) are
presented in Figure 3.10. below.
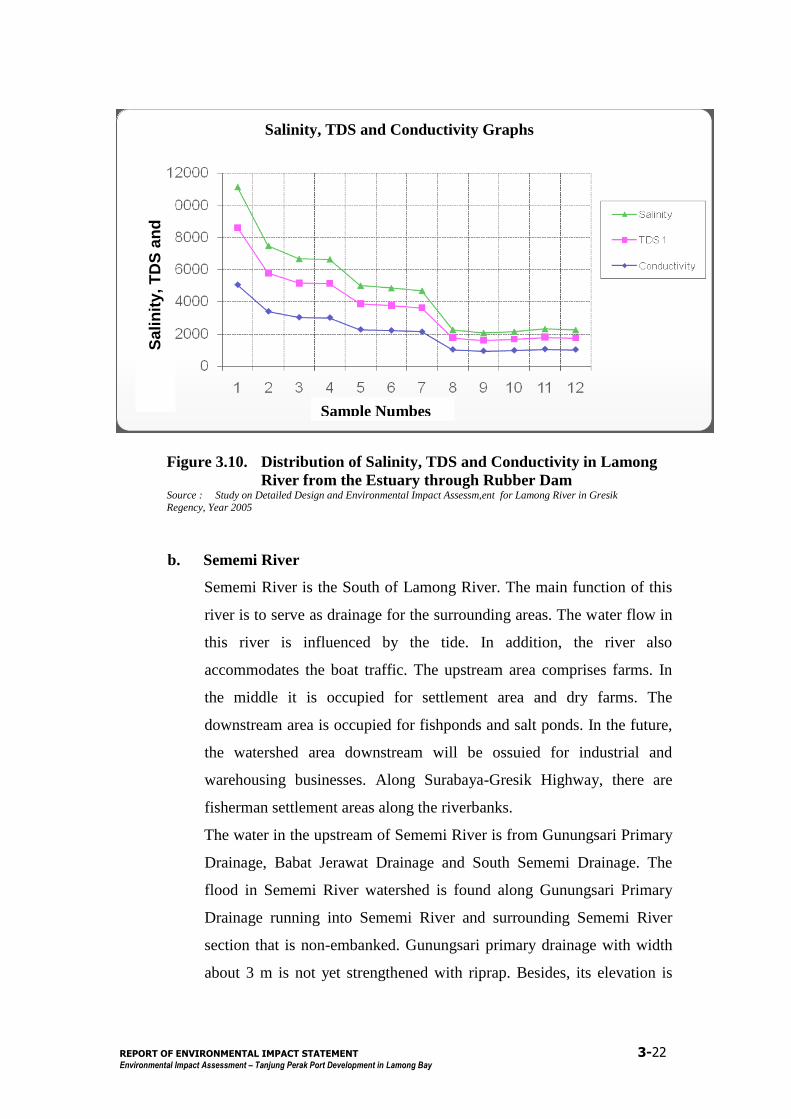
REPORT OF ENVIRONMENTAL IMPACT STATEMENT 3-22
Environmental Impact Assessment – Tanjung Perak Port Development in Lamong Bay
Figure 3.10. Distribution of Salinity, TDS and Conductivity in Lamong
River from the Estuary through Rubber Dam Source : Study on Detailed Design and Environmental Impact Assessm,ent for Lamong River in Gresik
Regency, Year 2005
b. Sememi River
Sememi River is the South of Lamong River. The main function of this
river is to serve as drainage for the surrounding areas. The water flow in
this river is influenced by the tide. In addition, the river also
accommodates the boat traffic. The upstream area comprises farms. In
the middle it is occupied for settlement area and dry farms. The
downstream area is occupied for fishponds and salt ponds. In the future,
the watershed area downstream will be ossuied for industrial and
warehousing businesses. Along Surabaya-Gresik Highway, there are
fisherman settlement areas along the riverbanks.
The water in the upstream of Sememi River is from Gunungsari Primary
Drainage, Babat Jerawat Drainage and South Sememi Drainage. The
flood in Sememi River watershed is found along Gunungsari Primary
Drainage running into Sememi River and surrounding Sememi River
section that is non-embanked. Gunungsari primary drainage with width
about 3 m is not yet strengthened with riprap. Besides, its elevation is
Salinity, TDS and Conductivity Graphs
Sample Numbes
Sa
lin
ity,
TD
S a
nd
Co
nd
ucti
vit
y
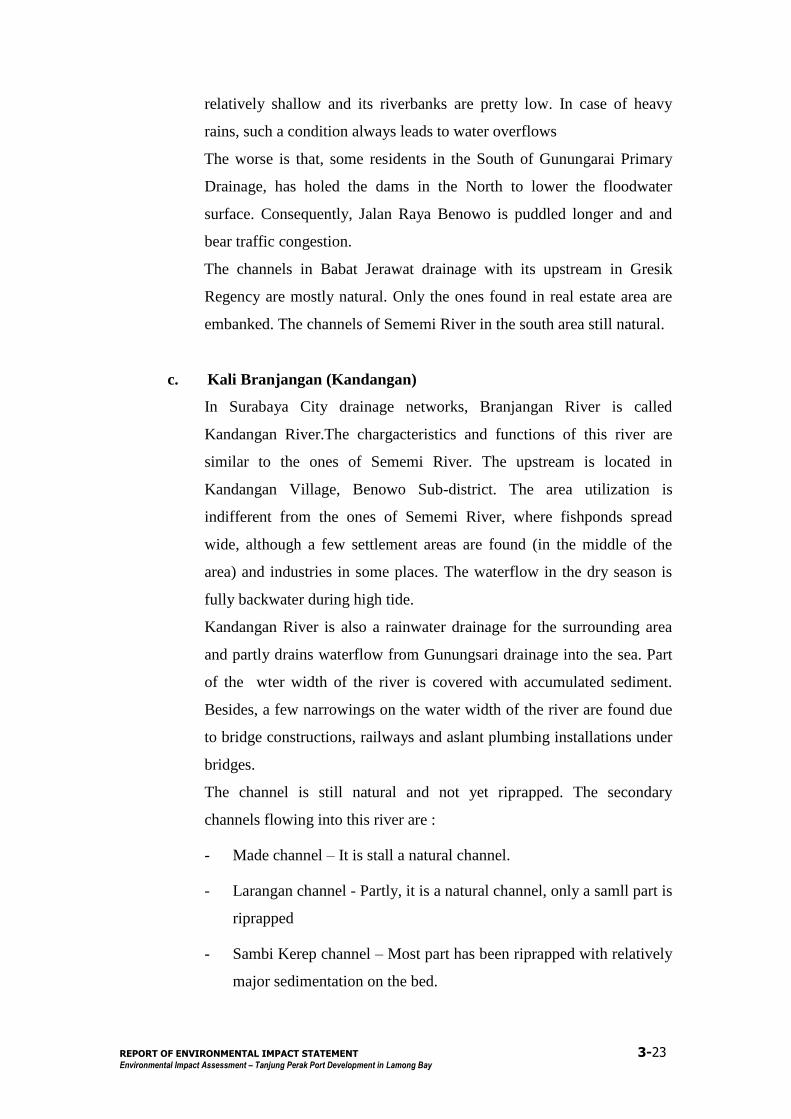
REPORT OF ENVIRONMENTAL IMPACT STATEMENT 3-23
Environmental Impact Assessment – Tanjung Perak Port Development in Lamong Bay
relatively shallow and its riverbanks are pretty low. In case of heavy
rains, such a condition always leads to water overflows
The worse is that, some residents in the South of Gunungarai Primary
Drainage, has holed the dams in the North to lower the floodwater
surface. Consequently, Jalan Raya Benowo is puddled longer and and
bear traffic congestion.
The channels in Babat Jerawat drainage with its upstream in Gresik
Regency are mostly natural. Only the ones found in real estate area are
embanked. The channels of Sememi River in the south area still natural.
c. Kali Branjangan (Kandangan)
In Surabaya City drainage networks, Branjangan River is called
Kandangan River.The chargacteristics and functions of this river are
similar to the ones of Sememi River. The upstream is located in
Kandangan Village, Benowo Sub-district. The area utilization is
indifferent from the ones of Sememi River, where fishponds spread
wide, although a few settlement areas are found (in the middle of the
area) and industries in some places. The waterflow in the dry season is
fully backwater during high tide.
Kandangan River is also a rainwater drainage for the surrounding area
and partly drains waterflow from Gunungsari drainage into the sea. Part
of the wter width of the river is covered with accumulated sediment.
Besides, a few narrowings on the water width of the river are found due
to bridge constructions, railways and aslant plumbing installations under
bridges.
The channel is still natural and not yet riprapped. The secondary
channels flowing into this river are :
- Made channel – It is stall a natural channel.
- Larangan channel - Partly, it is a natural channel, only a samll part is
riprapped
- Sambi Kerep channel – Most part has been riprapped with relatively
major sedimentation on the bed.
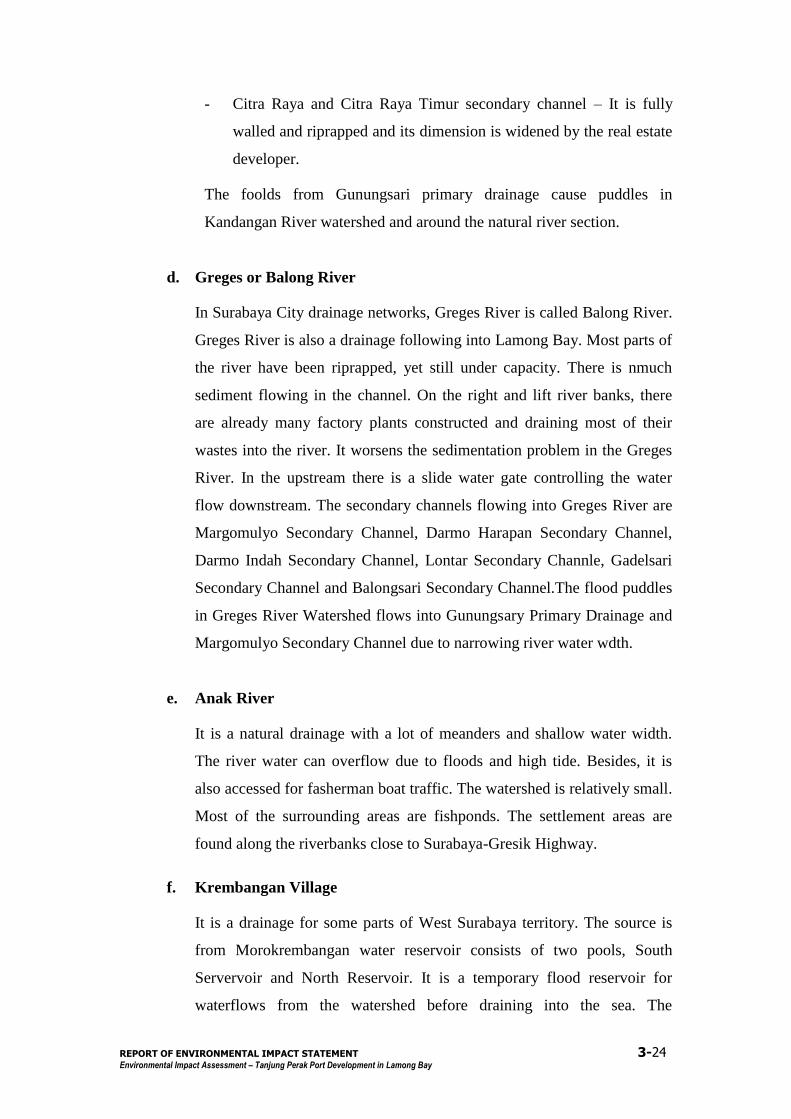
REPORT OF ENVIRONMENTAL IMPACT STATEMENT 3-24
Environmental Impact Assessment – Tanjung Perak Port Development in Lamong Bay
- Citra Raya and Citra Raya Timur secondary channel – It is fully
walled and riprapped and its dimension is widened by the real estate
developer.
The foolds from Gunungsari primary drainage cause puddles in
Kandangan River watershed and around the natural river section.
d. Greges or Balong River
In Surabaya City drainage networks, Greges River is called Balong River.
Greges River is also a drainage following into Lamong Bay. Most parts of
the river have been riprapped, yet still under capacity. There is nmuch
sediment flowing in the channel. On the right and lift river banks, there
are already many factory plants constructed and draining most of their
wastes into the river. It worsens the sedimentation problem in the Greges
River. In the upstream there is a slide water gate controlling the water
flow downstream. The secondary channels flowing into Greges River are
Margomulyo Secondary Channel, Darmo Harapan Secondary Channel,
Darmo Indah Secondary Channel, Lontar Secondary Channle, Gadelsari
Secondary Channel and Balongsari Secondary Channel.The flood puddles
in Greges River Watershed flows into Gunungsary Primary Drainage and
Margomulyo Secondary Channel due to narrowing river water wdth.
e. Anak River
It is a natural drainage with a lot of meanders and shallow water width.
The river water can overflow due to floods and high tide. Besides, it is
also accessed for fasherman boat traffic. The watershed is relatively small.
Most of the surrounding areas are fishponds. The settlement areas are
found along the riverbanks close to Surabaya-Gresik Highway.
f. Krembangan Village
It is a drainage for some parts of West Surabaya territory. The source is
from Morokrembangan water reservoir consists of two pools, South
Servervoir and North Reservoir. It is a temporary flood reservoir for
waterflows from the watershed before draining into the sea. The
REPORT OF ENVIRONMENTAL IMPACT STATEMENT 3-25
Environmental Impact Assessment – Tanjung Perak Port Development in Lamong Bay
waterflow in the reservoir is controlled by water gates and pumps. The
water flowing into the reservoir is from Greges Channel, Perak Channel
and Simo River. The reservoir is full of rubbish. Flood is present in
Gunungsari Primary Drainage due to the overflows from the upstream
when the flows enter the siphon and in the down stream between
Gunungsari Primary Drainage and Morokrembangan reservoir.
The problems of floods in Lamong River watershed and it tributaries are
typically indifferent from the ones in Surabaya City. Mainly, it is due to :
Heavy torrents.
Area topography and river angle downstream (< 1%).
Ineffective drainage networks and system and inconsistent with the present
spatial utilization concerning with surface erosion and rain precipitation.
There is specific reference for the water surface on streets and dwelling
areas and the ones in drainage channels.
There is no river provided with water gates to cope with back waterto the
river and channels.
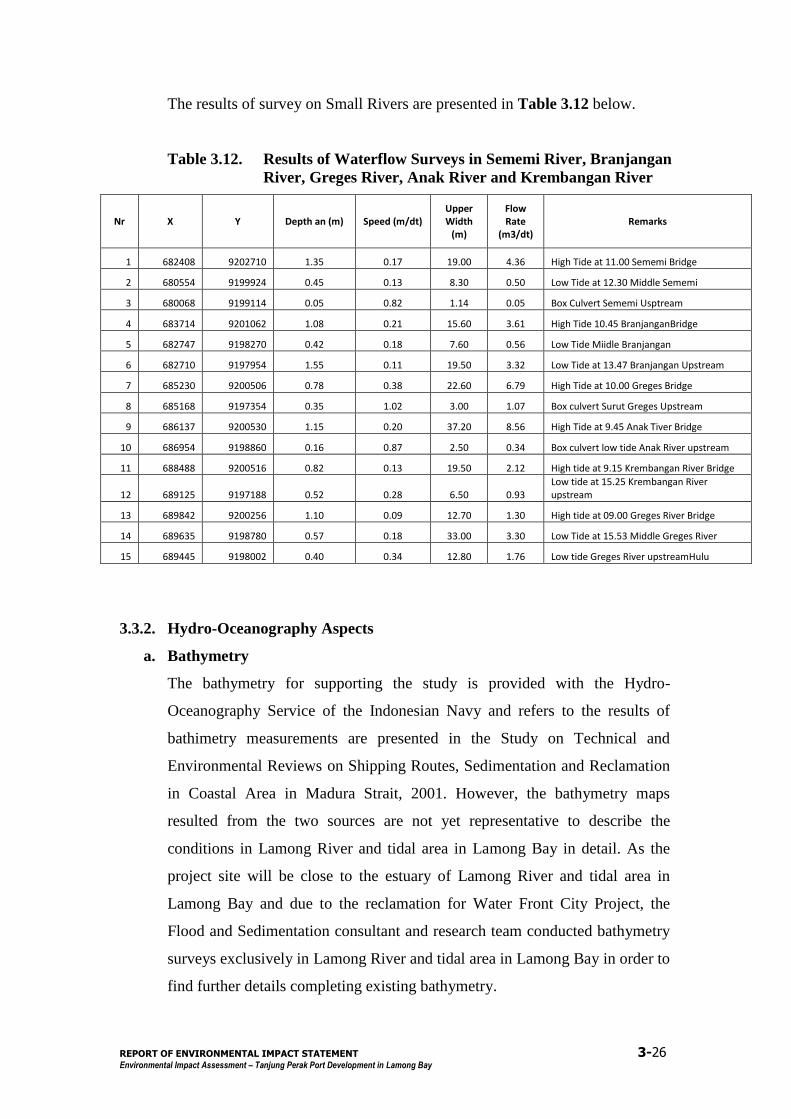
REPORT OF ENVIRONMENTAL IMPACT STATEMENT 3-26
Environmental Impact Assessment – Tanjung Perak Port Development in Lamong Bay
The results of survey on Small Rivers are presented in Table 3.12 below.
Table 3.12. Results of Waterflow Surveys in Sememi River, Branjangan
River, Greges River, Anak River and Krembangan River
Nr X Y Depth an (m) Speed (m/dt) Upper Width
(m)
Flow Rate
(m3/dt) Remarks
1 682408 9202710 1.35 0.17 19.00 4.36 High Tide at 11.00 Sememi Bridge
2 680554 9199924 0.45 0.13 8.30 0.50 Low Tide at 12.30 Middle Sememi
3 680068 9199114 0.05 0.82 1.14 0.05 Box Culvert Sememi Usptream
4 683714 9201062 1.08 0.21 15.60 3.61 High Tide 10.45 BranjanganBridge
5 682747 9198270 0.42 0.18 7.60 0.56 Low Tide Miidle Branjangan
6 682710 9197954 1.55 0.11 19.50 3.32 Low Tide at 13.47 Branjangan Upstream
7 685230 9200506 0.78 0.38 22.60 6.79 High Tide at 10.00 Greges Bridge
8 685168 9197354 0.35 1.02 3.00 1.07 Box culvert Surut Greges Upstream
9 686137 9200530 1.15 0.20 37.20 8.56 High Tide at 9.45 Anak Tiver Bridge
10 686954 9198860 0.16 0.87 2.50 0.34 Box culvert low tide Anak River upstream
11 688488 9200516 0.82 0.13 19.50 2.12 High tide at 9.15 Krembangan River Bridge
12 689125 9197188 0.52 0.28 6.50 0.93 Low tide at 15.25 Krembangan River upstream
13 689842 9200256 1.10 0.09 12.70 1.30 High tide at 09.00 Greges River Bridge
14 689635 9198780 0.57 0.18 33.00 3.30 Low Tide at 15.53 Middle Greges River
15 689445 9198002 0.40 0.34 12.80 1.76 Low tide Greges River upstreamHulu
3.3.2. Hydro-Oceanography Aspects
a. Bathymetry
The bathymetry for supporting the study is provided with the Hydro-
Oceanography Service of the Indonesian Navy and refers to the results of
bathimetry measurements are presented in the Study on Technical and
Environmental Reviews on Shipping Routes, Sedimentation and Reclamation
in Coastal Area in Madura Strait, 2001. However, the bathymetry maps
resulted from the two sources are not yet representative to describe the
conditions in Lamong River and tidal area in Lamong Bay in detail. As the
project site will be close to the estuary of Lamong River and tidal area in
Lamong Bay and due to the reclamation for Water Front City Project, the
Flood and Sedimentation consultant and research team conducted bathymetry
surveys exclusively in Lamong River and tidal area in Lamong Bay in order to
find further details completing existing bathymetry.
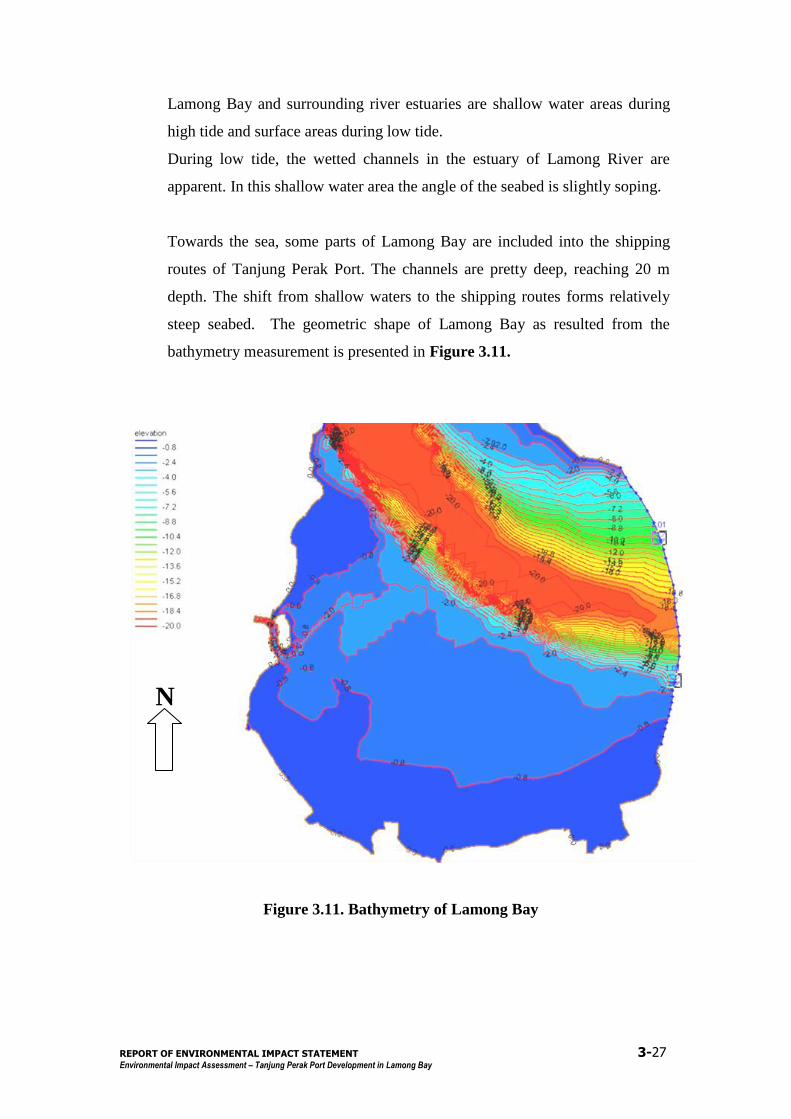
REPORT OF ENVIRONMENTAL IMPACT STATEMENT 3-27
Environmental Impact Assessment – Tanjung Perak Port Development in Lamong Bay
Lamong Bay and surrounding river estuaries are shallow water areas during
high tide and surface areas during low tide.
During low tide, the wetted channels in the estuary of Lamong River are
apparent. In this shallow water area the angle of the seabed is slightly soping.
Towards the sea, some parts of Lamong Bay are included into the shipping
routes of Tanjung Perak Port. The channels are pretty deep, reaching 20 m
depth. The shift from shallow waters to the shipping routes forms relatively
steep seabed. The geometric shape of Lamong Bay as resulted from the
bathymetry measurement is presented in Figure 3.11.
Figure 3.11. Bathymetry of Lamong Bay
N
U
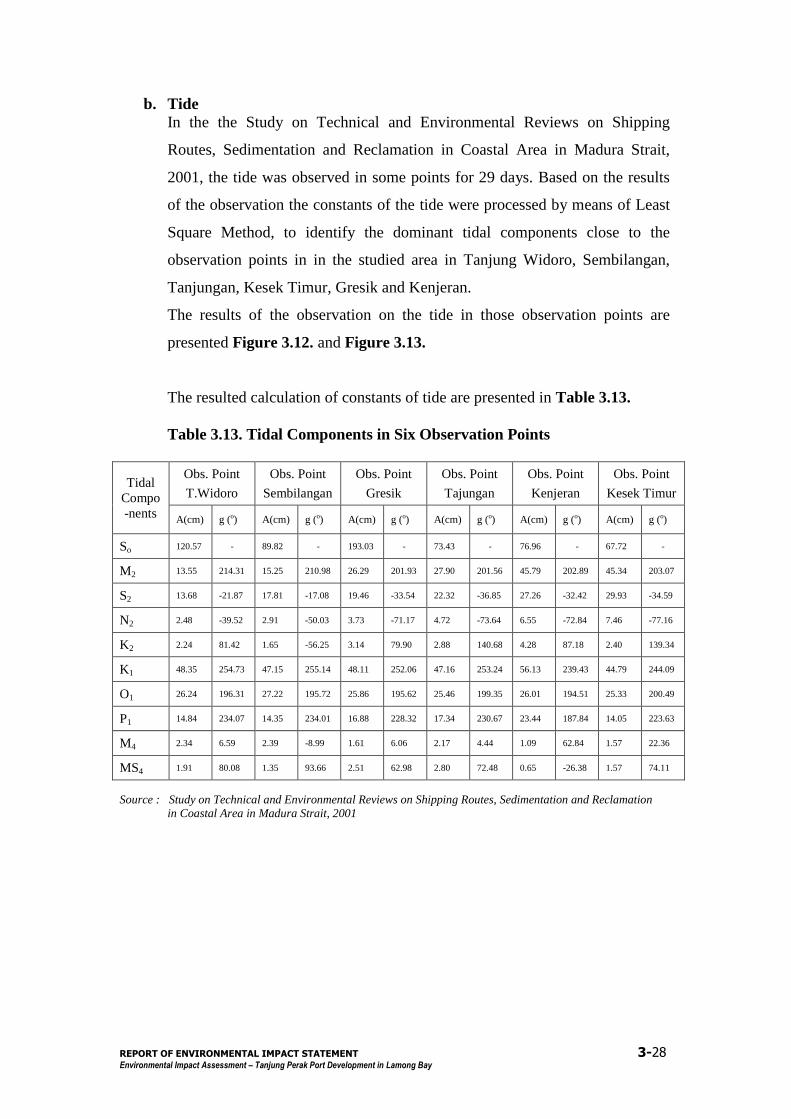
REPORT OF ENVIRONMENTAL IMPACT STATEMENT 3-28
Environmental Impact Assessment – Tanjung Perak Port Development in Lamong Bay
b. Tide
In the the Study on Technical and Environmental Reviews on Shipping
Routes, Sedimentation and Reclamation in Coastal Area in Madura Strait,
2001, the tide was observed in some points for 29 days. Based on the results
of the observation the constants of the tide were processed by means of Least
Square Method, to identify the dominant tidal components close to the
observation points in in the studied area in Tanjung Widoro, Sembilangan,
Tanjungan, Kesek Timur, Gresik and Kenjeran.
The results of the observation on the tide in those observation points are
presented Figure 3.12. and Figure 3.13.
The resulted calculation of constants of tide are presented in Table 3.13.
Table 3.13. Tidal Components in Six Observation Points
Tidal
Compo
-nents
Obs. Point
T.Widoro
Obs. Point
Sembilangan
Obs. Point
Gresik
Obs. Point
Tajungan
Obs. Point
Kenjeran
Obs. Point
Kesek Timur
A(cm) g (o) A(cm) g (o) A(cm) g (o) A(cm) g (o) A(cm) g (o) A(cm) g (o)
So 120.57 - 89.82 - 193.03 - 73.43 - 76.96 - 67.72 -
M2 13.55 214.31 15.25 210.98 26.29 201.93 27.90 201.56 45.79 202.89 45.34 203.07
S2 13.68 -21.87 17.81 -17.08 19.46 -33.54 22.32 -36.85 27.26 -32.42 29.93 -34.59
N2 2.48 -39.52 2.91 -50.03 3.73 -71.17 4.72 -73.64 6.55 -72.84 7.46 -77.16
K2 2.24 81.42 1.65 -56.25 3.14 79.90 2.88 140.68 4.28 87.18 2.40 139.34
K1 48.35 254.73 47.15 255.14 48.11 252.06 47.16 253.24 56.13 239.43 44.79 244.09
O1 26.24 196.31 27.22 195.72 25.86 195.62 25.46 199.35 26.01 194.51 25.33 200.49
P1 14.84 234.07 14.35 234.01 16.88 228.32 17.34 230.67 23.44 187.84 14.05 223.63
M4 2.34 6.59 2.39 -8.99 1.61 6.06 2.17 4.44 1.09 62.84 1.57 22.36
MS4 1.91 80.08 1.35 93.66 2.51 62.98 2.80 72.48 0.65 -26.38 1.57 74.11
Source : Study on Technical and Environmental Reviews on Shipping Routes, Sedimentation and Reclamation
in Coastal Area in Madura Strait, 2001
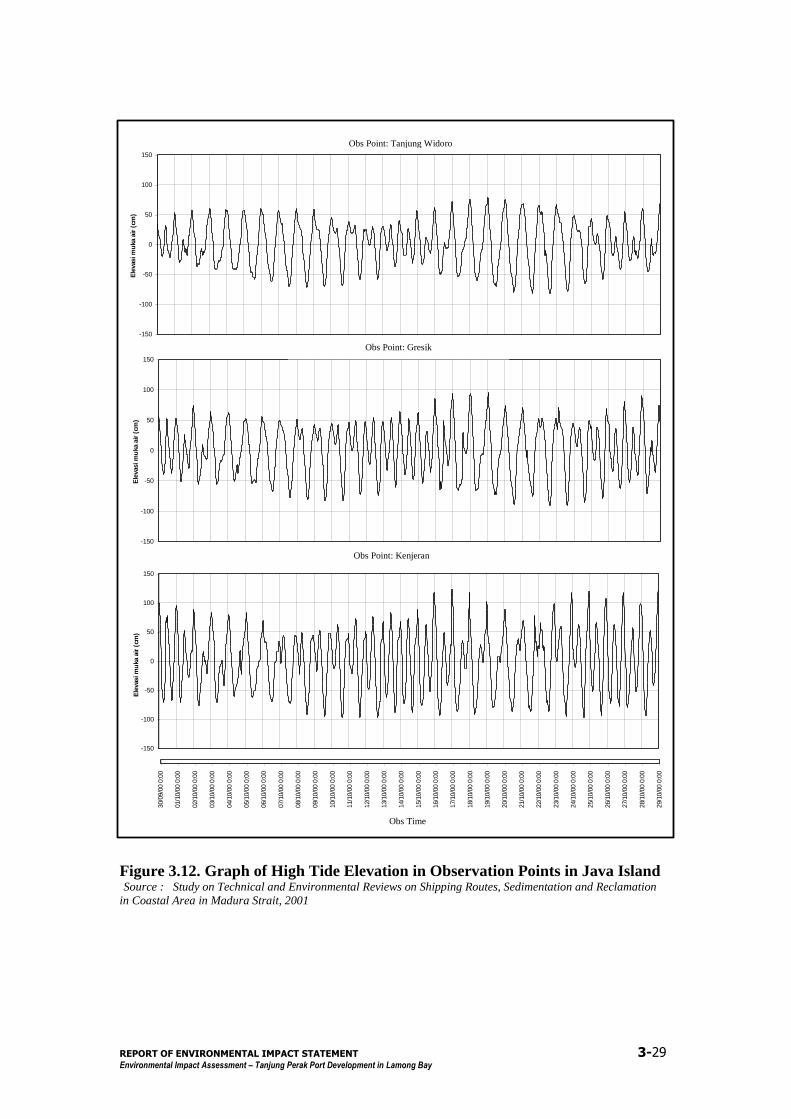
REPORT OF ENVIRONMENTAL IMPACT STATEMENT 3-29
Environmental Impact Assessment – Tanjung Perak Port Development in Lamong Bay
Figure 3.12. Graph of High Tide Elevation in Observation Points in Java Island Source : Study on Technical and Environmental Reviews on Shipping Routes, Sedimentation and Reclamation
in Coastal Area in Madura Strait, 2001
Lokasi: Tanjung Widoro
-150
-100
-50
0
50
100
150
Ele
vasi m
uka a
ir (
cm
)
30/0
9/0
0 0
:00
01/1
0/0
0 0
:00
02/1
0/0
0 0
:00
03/1
0/0
0 0
:00
04/1
0/0
0 0
:00
05/1
0/0
0 0
:00
06/1
0/0
0 0
:00
07/1
0/0
0 0
:00
08/1
0/0
0 0
:00
09/1
0/0
0 0
:00
10/1
0/0
0 0
:00
11/1
0/0
0 0
:00
12/1
0/0
0 0
:00
13/1
0/0
0 0
:00
14/1
0/0
0 0
:00
15/1
0/0
0 0
:00
16/1
0/0
0 0
:00
17/1
0/0
0 0
:00
18/1
0/0
0 0
:00
19/1
0/0
0 0
:00
20/1
0/0
0 0
:00
21/1
0/0
0 0
:00
22/1
0/0
0 0
:00
23/1
0/0
0 0
:00
24/1
0/0
0 0
:00
25/1
0/0
0 0
:00
26/1
0/0
0 0
:00
27/1
0/0
0 0
:00
28/1
0/0
0 0
:00
29/1
0/0
0 0
:00
Waktu Pengamatan
Lokasi: Gresik
-150
-100
-50
0
50
100
150
Ele
vasi m
uka a
ir (
cm
)
Lokasi: Kenjeran
-150
-100
-50
0
50
100
150
Ele
vasi m
uka a
ir (
cm
)
Obs Point: Tanjung Widoro
Obs Point: Gresik
Obs Point: Kenjeran
Obs Time
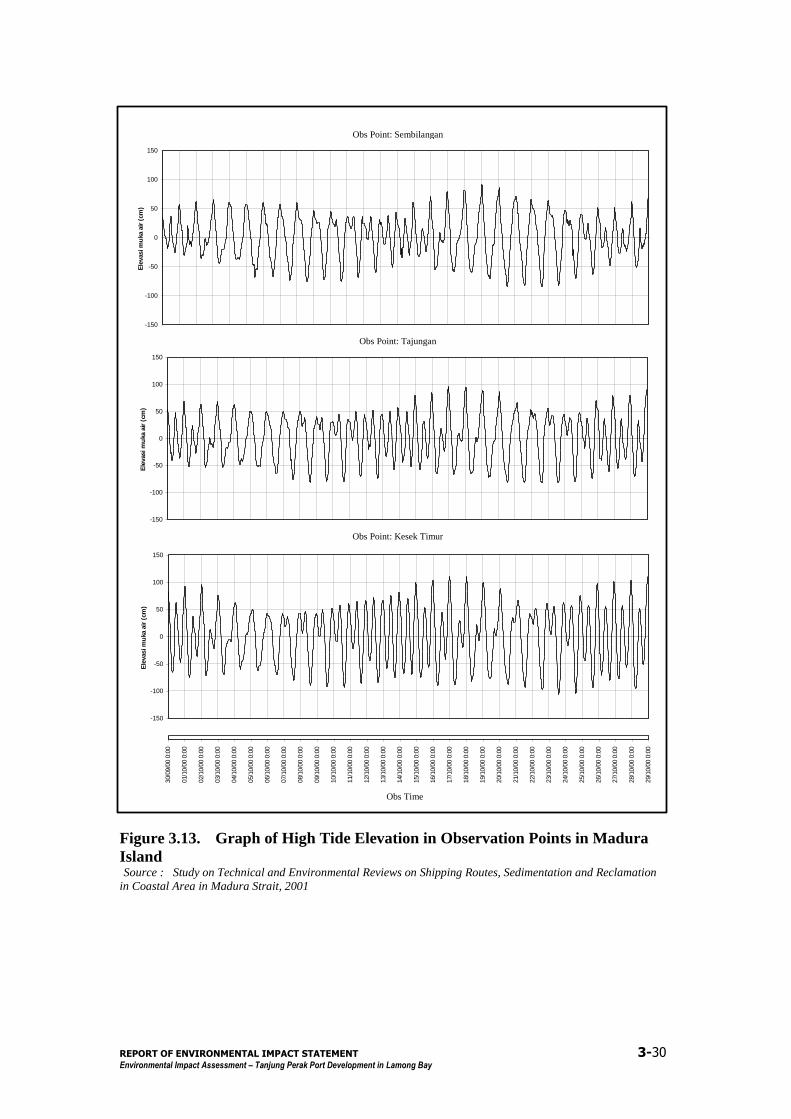
REPORT OF ENVIRONMENTAL IMPACT STATEMENT 3-30
Environmental Impact Assessment – Tanjung Perak Port Development in Lamong Bay
Figure 3.13. Graph of High Tide Elevation in Observation Points in Madura
Island Source : Study on Technical and Environmental Reviews on Shipping Routes, Sedimentation and Reclamation
in Coastal Area in Madura Strait, 2001
30/0
9/0
0 0
:00
01/1
0/0
0 0
:00
02/1
0/0
0 0
:00
03/1
0/0
0 0
:00
04/1
0/0
0 0
:00
05/1
0/0
0 0
:00
06/1
0/0
0 0
:00
07/1
0/0
0 0
:00
08/1
0/0
0 0
:00
09/1
0/0
0 0
:00
10/1
0/0
0 0
:00
11/1
0/0
0 0
:00
12/1
0/0
0 0
:00
13/1
0/0
0 0
:00
14/1
0/0
0 0
:00
15/1
0/0
0 0
:00
16/1
0/0
0 0
:00
17/1
0/0
0 0
:00
18/1
0/0
0 0
:00
19/1
0/0
0 0
:00
20/1
0/0
0 0
:00
21/1
0/0
0 0
:00
22/1
0/0
0 0
:00
23/1
0/0
0 0
:00
24/1
0/0
0 0
:00
25/1
0/0
0 0
:00
26/1
0/0
0 0
:00
27/1
0/0
0 0
:00
28/1
0/0
0 0
:00
29/1
0/0
0 0
:00
Waktu Pengamatan
Lokasi: Kesek Timur
-150
-100
-50
0
50
100
150
Ele
vasi m
uka a
ir (
cm
)
Lokasi: Tajungan
-150
-100
-50
0
50
100
150
Ele
vasi m
uka a
ir (
cm
)Lokasi: Sembilangan
-150
-100
-50
0
50
100
150
Ele
vasi m
uka a
ir (
cm
)Obs Point: Sembilangan
Obs Point: Tajungan
Obs Point: Kesek Timur
Obs Time
REPORT OF ENVIRONMENTAL IMPACT STATEMENT 3-31
Environmental Impact Assessment – Tanjung Perak Port Development in Lamong Bay
Where : A : amplitude
g : phase diference
M2 : main component of the moon (semi diurnal)
S2 : main component of the sun (semi diurnal)
N2 : eliptic component of the moon
K2 : component of moon-sun (semi diurnal)
K1 : component of moon-sun (diurnal)
O1 : main component of the moon (diurnal)
P1 : main component of the sun (semi diurnal)
M4 : tidal component of shallow water (quarter – diurnal)
MS4 : tidal component of shallow water (compound tide)
Based on the results of calculation of the main tidal constants, the value of
Formzhal (F) can be identified to determine the tide in the studied area
(Defant, 1958). The value of Formzhal is determined by comparing the total
amplitude of components K1 and O1 and the total components of M2 and S2, or
in the following equation :
Equation :
2S2M
1O1KF
The tidal types are then derived from the resulted Formzhal value. The
classification of Formzhal values are as follows :
F > 3,00 Diurnal Tide
1,50 – 3,00 Mixed, Diurnal Dominant Tide
0,25 – 1,49 Mixed, Semi Diurnal Dominant Tide
F < 0,25 Semi Diurnal Tide
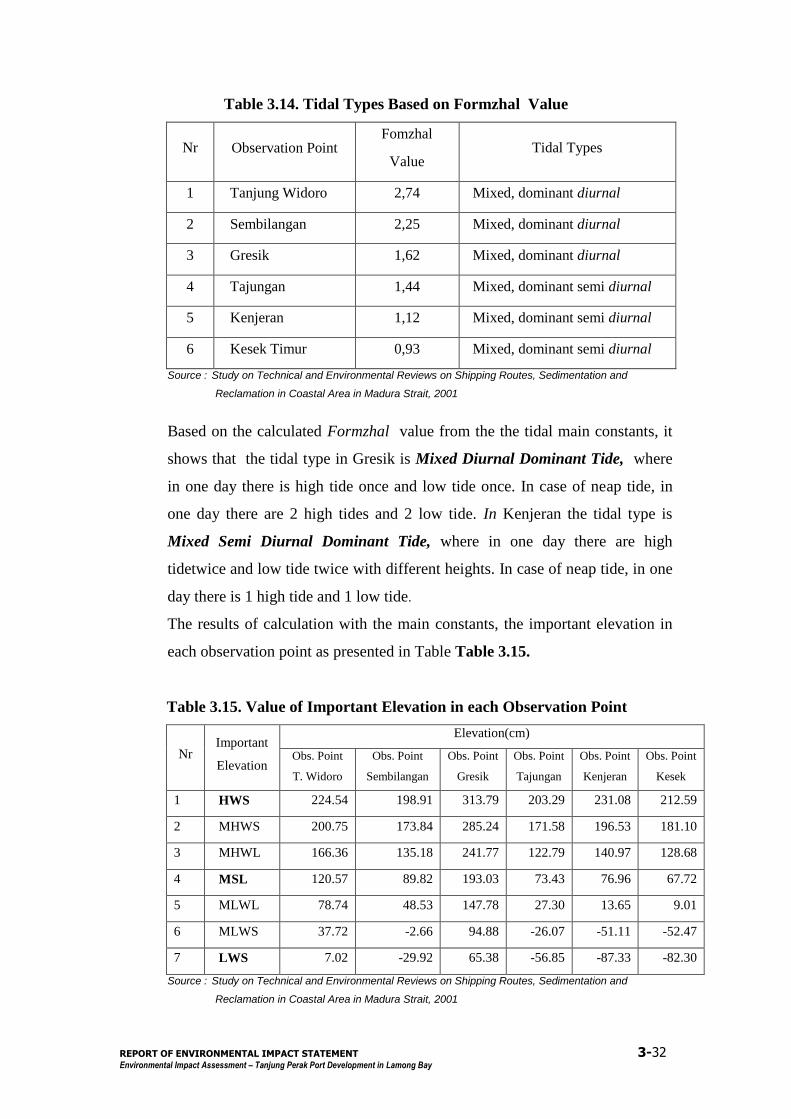
REPORT OF ENVIRONMENTAL IMPACT STATEMENT 3-32
Environmental Impact Assessment – Tanjung Perak Port Development in Lamong Bay
Table 3.14. Tidal Types Based on Formzhal Value
Nr Observation Point Fomzhal
Value Tidal Types
1 Tanjung Widoro 2,74 Mixed, dominant diurnal
2 Sembilangan 2,25 Mixed, dominant diurnal
3 Gresik 1,62 Mixed, dominant diurnal
4 Tajungan 1,44 Mixed, dominant semi diurnal
5 Kenjeran 1,12 Mixed, dominant semi diurnal
6 Kesek Timur 0,93 Mixed, dominant semi diurnal
Source : Study on Technical and Environmental Reviews on Shipping Routes, Sedimentation and
Reclamation in Coastal Area in Madura Strait, 2001
Based on the calculated Formzhal value from the the tidal main constants, it
shows that the tidal type in Gresik is Mixed Diurnal Dominant Tide, where
in one day there is high tide once and low tide once. In case of neap tide, in
one day there are 2 high tides and 2 low tide. In Kenjeran the tidal type is
Mixed Semi Diurnal Dominant Tide, where in one day there are high
tidetwice and low tide twice with different heights. In case of neap tide, in one
day there is 1 high tide and 1 low tide.
The results of calculation with the main constants, the important elevation in
each observation point as presented in Table Table 3.15.
Table 3.15. Value of Important Elevation in each Observation Point
Nr Important
Elevation
Elevation(cm)
Obs. Point
T. Widoro
Obs. Point
Sembilangan
Obs. Point
Gresik
Obs. Point
Tajungan
Obs. Point
Kenjeran
Obs. Point
Kesek
1 HWS 224.54 198.91 313.79 203.29 231.08 212.59
2 MHWS 200.75 173.84 285.24 171.58 196.53 181.10
3 MHWL 166.36 135.18 241.77 122.79 140.97 128.68
4 MSL 120.57 89.82 193.03 73.43 76.96 67.72
5 MLWL 78.74 48.53 147.78 27.30 13.65 9.01
6 MLWS 37.72 -2.66 94.88 -26.07 -51.11 -52.47
7 LWS 7.02 -29.92 65.38 -56.85 -87.33 -82.30
Source : Study on Technical and Environmental Reviews on Shipping Routes, Sedimentation and
Reclamation in Coastal Area in Madura Strait, 2001
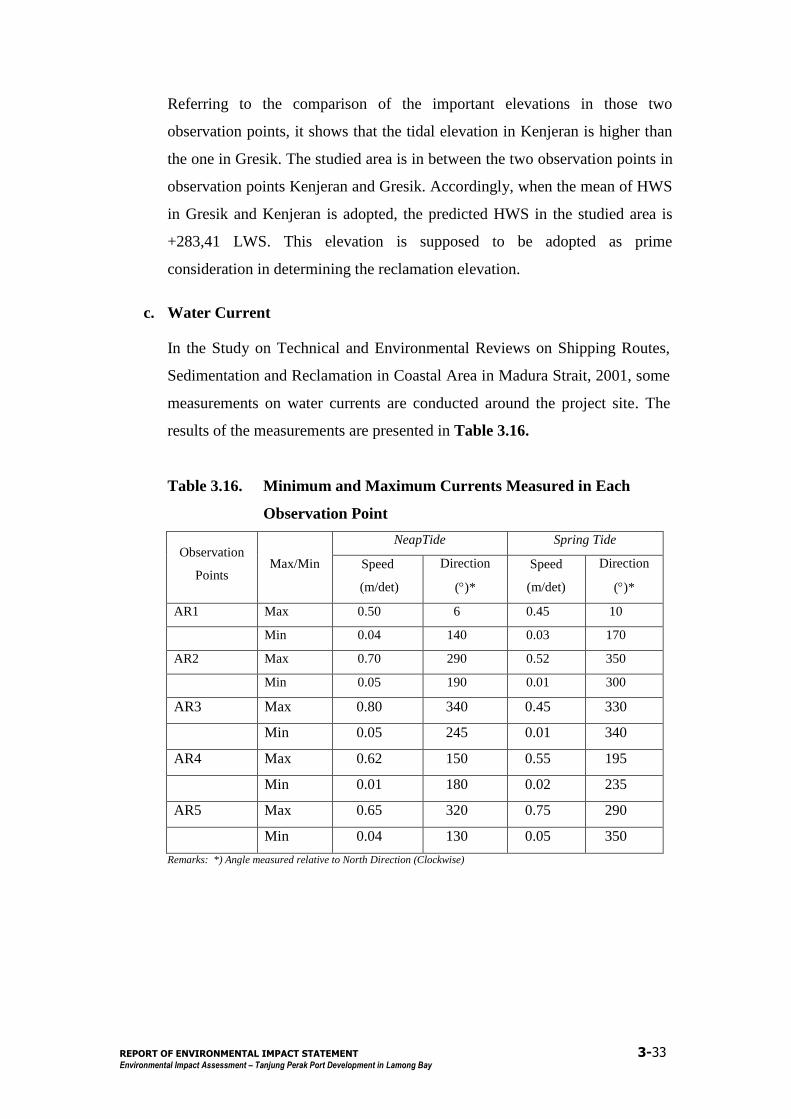
REPORT OF ENVIRONMENTAL IMPACT STATEMENT 3-33
Environmental Impact Assessment – Tanjung Perak Port Development in Lamong Bay
Referring to the comparison of the important elevations in those two
observation points, it shows that the tidal elevation in Kenjeran is higher than
the one in Gresik. The studied area is in between the two observation points in
observation points Kenjeran and Gresik. Accordingly, when the mean of HWS
in Gresik and Kenjeran is adopted, the predicted HWS in the studied area is
+283,41 LWS. This elevation is supposed to be adopted as prime
consideration in determining the reclamation elevation.
c. Water Current
In the Study on Technical and Environmental Reviews on Shipping Routes,
Sedimentation and Reclamation in Coastal Area in Madura Strait, 2001, some
measurements on water currents are conducted around the project site. The
results of the measurements are presented in Table 3.16.
Table 3.16. Minimum and Maximum Currents Measured in Each
Observation Point
Observation
Points Max/Min
NeapTide Spring Tide
Speed
(m/det)
Direction
()*
Speed
(m/det)
Direction
()*
AR1 Max 0.50 6 0.45 10
Min 0.04 140 0.03 170
AR2 Max 0.70 290 0.52 350
Min 0.05 190 0.01 300
AR3 Max 0.80 340 0.45 330
Min 0.05 245 0.01 340
AR4 Max 0.62 150 0.55 195
Min 0.01 180 0.02 235
AR5 Max 0.65 320 0.75 290
Min 0.04 130 0.05 350
Remarks: *) Angle measured relative to North Direction (Clockwise)
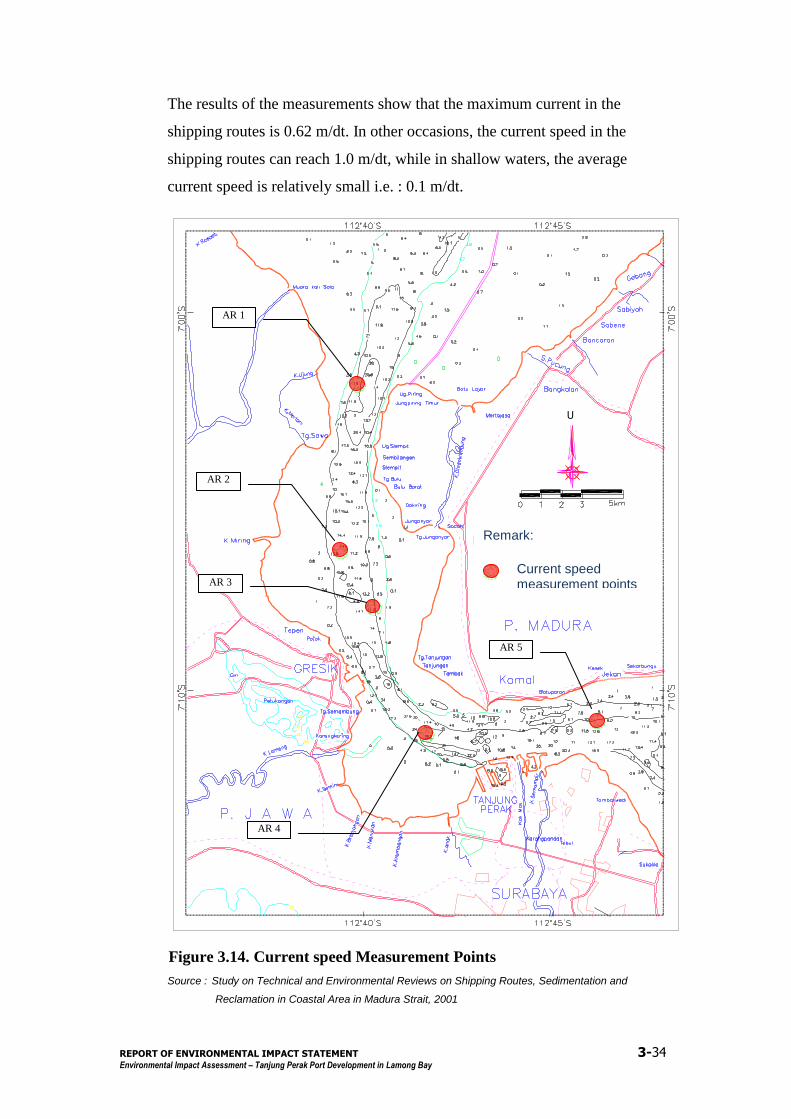
REPORT OF ENVIRONMENTAL IMPACT STATEMENT 3-34
Environmental Impact Assessment – Tanjung Perak Port Development in Lamong Bay
The results of the measurements show that the maximum current in the
shipping routes is 0.62 m/dt. In other occasions, the current speed in the
shipping routes can reach 1.0 m/dt, while in shallow waters, the average
current speed is relatively small i.e. : 0.1 m/dt.
Figure 3.14. Current speed Measurement Points
Source : Study on Technical and Environmental Reviews on Shipping Routes, Sedimentation and
Reclamation in Coastal Area in Madura Strait, 2001
arus laut
Keterangan :
Lokasi pengukuran
U
AR 1
AR 4
AR 5
AR 3
AR 2
Current speed measurement points
Remark:
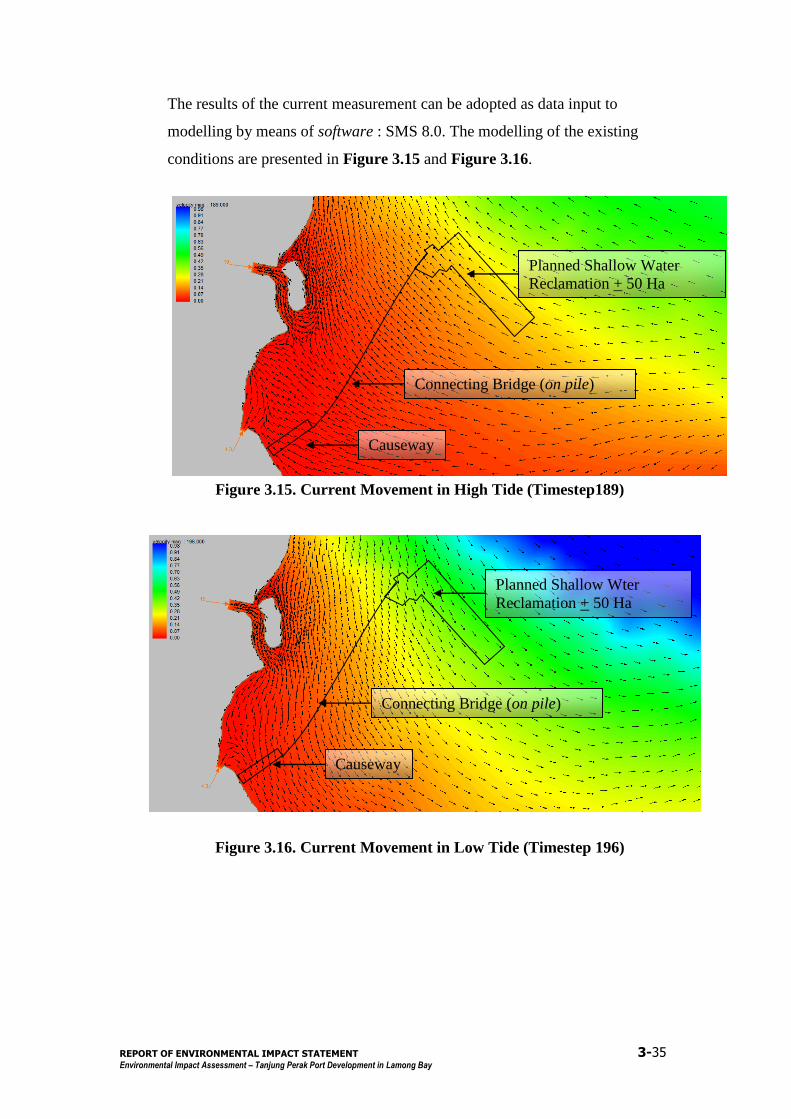
REPORT OF ENVIRONMENTAL IMPACT STATEMENT 3-35
Environmental Impact Assessment – Tanjung Perak Port Development in Lamong Bay
The results of the current measurement can be adopted as data input to
modelling by means of software : SMS 8.0. The modelling of the existing
conditions are presented in Figure 3.15 and Figure 3.16.
Figure 3.15. Current Movement in High Tide (Timestep189)
Figure 3.16. Current Movement in Low Tide (Timestep 196)
Planned Shallow Water
Reclamation + 50 Ha
Connecting Bridge (on pile)
Causeway
Planned Shallow Wter
Reclamation + 50 Ha
Connecting Bridge (on pile)
Causeway
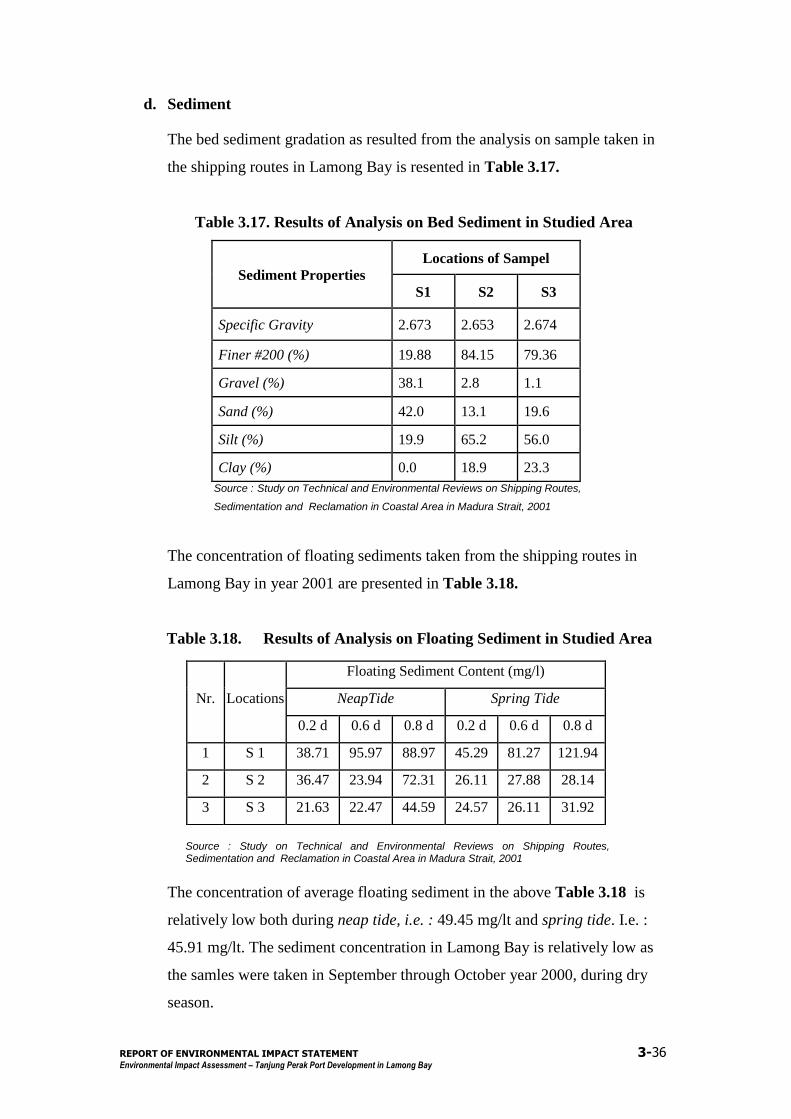
REPORT OF ENVIRONMENTAL IMPACT STATEMENT 3-36
Environmental Impact Assessment – Tanjung Perak Port Development in Lamong Bay
d. Sediment
The bed sediment gradation as resulted from the analysis on sample taken in
the shipping routes in Lamong Bay is resented in Table 3.17.
Table 3.17. Results of Analysis on Bed Sediment in Studied Area
Sediment Properties
Locations of Sampel
S1 S2 S3
Specific Gravity 2.673 2.653 2.674
Finer #200 (%) 19.88 84.15 79.36
Gravel (%) 38.1 2.8 1.1
Sand (%) 42.0 13.1 19.6
Silt (%) 19.9 65.2 56.0
Clay (%) 0.0 18.9 23.3
Source : Study on Technical and Environmental Reviews on Shipping Routes,
Sedimentation and Reclamation in Coastal Area in Madura Strait, 2001
The concentration of floating sediments taken from the shipping routes in
Lamong Bay in year 2001 are presented in Table 3.18.
Table 3.18. Results of Analysis on Floating Sediment in Studied Area
Source : Study on Technical and Environmental Reviews on Shipping Routes, Sedimentation and Reclamation in Coastal Area in Madura Strait, 2001
The concentration of average floating sediment in the above Table 3.18 is
relatively low both during neap tide, i.e. : 49.45 mg/lt and spring tide. I.e. :
45.91 mg/lt. The sediment concentration in Lamong Bay is relatively low as
the samles were taken in September through October year 2000, during dry
season.
Nr. Locations
Floating Sediment Content (mg/l)
NeapTide Spring Tide
0.2 d 0.6 d 0.8 d 0.2 d 0.6 d 0.8 d
1 S 1 38.71 95.97 88.97 45.29 81.27 121.94
2 S 2 36.47 23.94 72.31 26.11 27.88 28.14
3 S 3 21.63 22.47 44.59 24.57 26.11 31.92
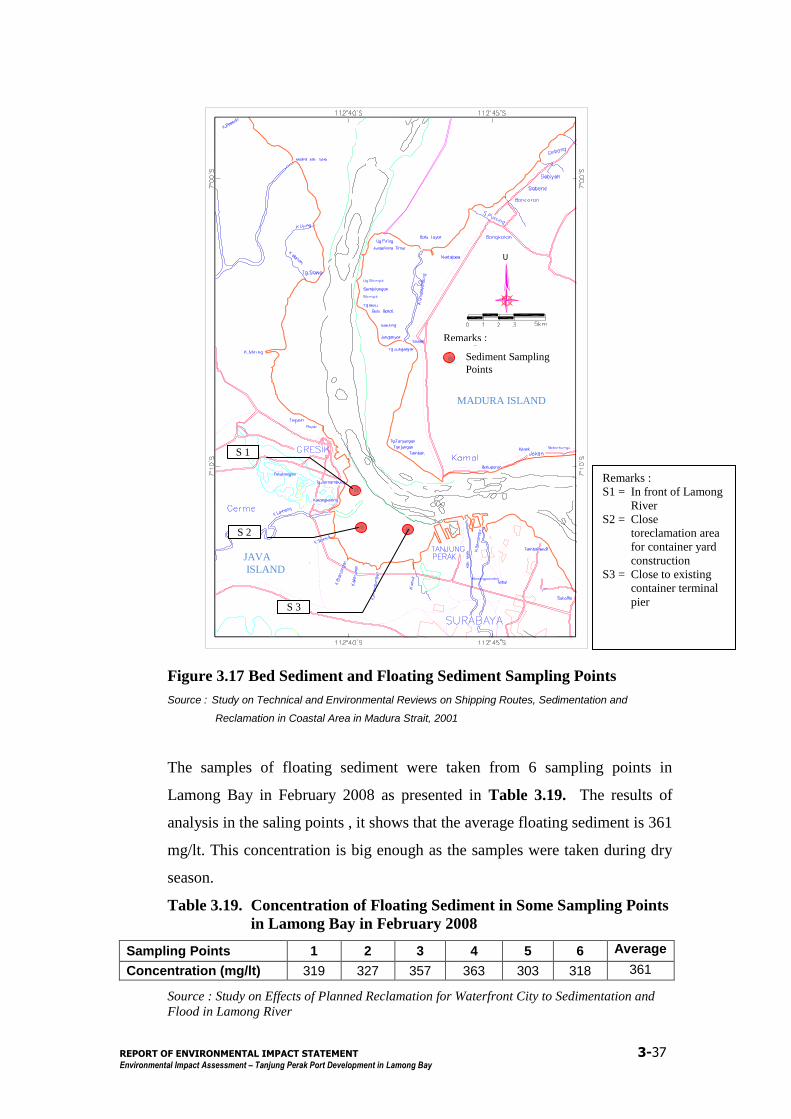
REPORT OF ENVIRONMENTAL IMPACT STATEMENT 3-37
Environmental Impact Assessment – Tanjung Perak Port Development in Lamong Bay
Figure 3.17 Bed Sediment and Floating Sediment Sampling Points
Source : Study on Technical and Environmental Reviews on Shipping Routes, Sedimentation and
Reclamation in Coastal Area in Madura Strait, 2001
The samples of floating sediment were taken from 6 sampling points in
Lamong Bay in February 2008 as presented in Table 3.19. The results of
analysis in the saling points , it shows that the average floating sediment is 361
mg/lt. This concentration is big enough as the samples were taken during dry
season.
Table 3.19. Concentration of Floating Sediment in Some Sampling Points
in Lamong Bay in February 2008
Sampling Points 1 2 3 4 5 6 Average
Concentration (mg/lt) 319 327 357 363 303 318 361
Source : Study on Effects of Planned Reclamation for Waterfront City to Sedimentation and
Flood in Lamong River
contoh sedimenLokasi pengambilan
Keterangan:
U
S 1
S 2
S 3
Remarks :
S1 = In front of Lamong
River
S2 = Close
toreclamation area
for container yard
construction
S3 = Close to existing
container terminal
pier
Sediment Sampling
Points
Remarks :
MADURA ISLAND
JAVA
ISLAND
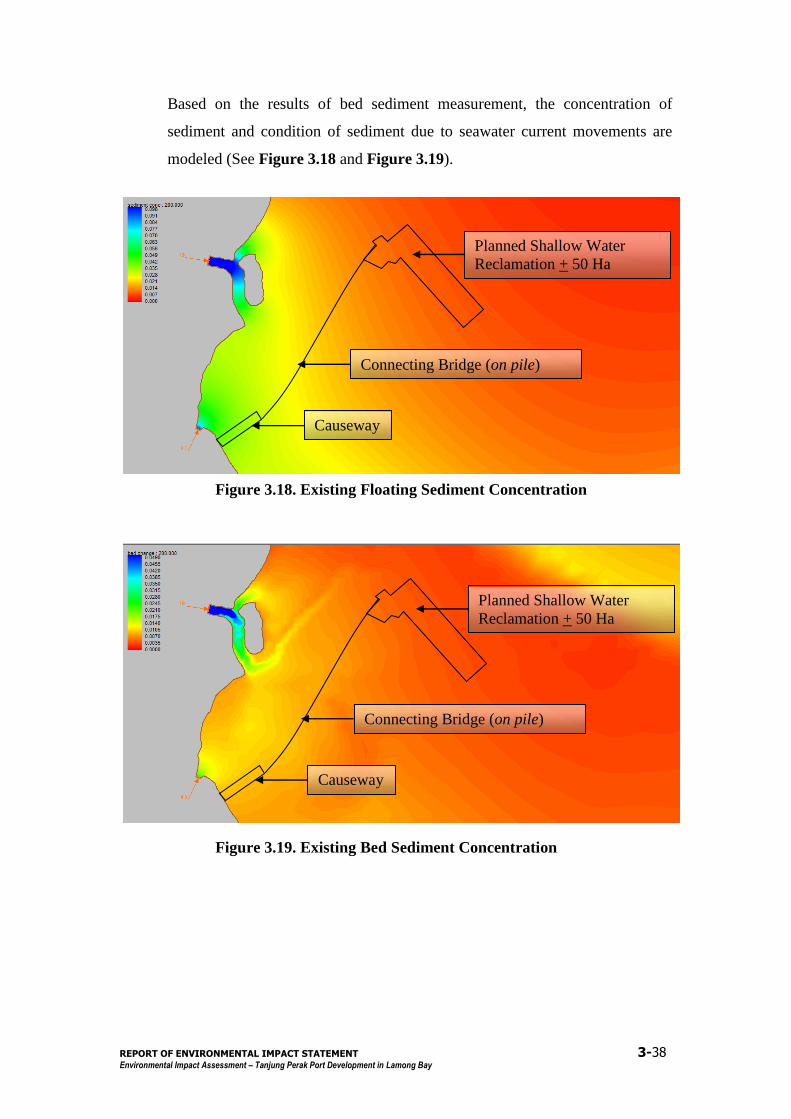
REPORT OF ENVIRONMENTAL IMPACT STATEMENT 3-38
Environmental Impact Assessment – Tanjung Perak Port Development in Lamong Bay
Based on the results of bed sediment measurement, the concentration of
sediment and condition of sediment due to seawater current movements are
modeled (See Figure 3.18 and Figure 3.19).
Figure 3.18. Existing Floating Sediment Concentration
Figure 3.19. Existing Bed Sediment Concentration
Planned Shallow Water
Reclamation + 50 Ha
Connecting Bridge (on pile)
Causeway
Planned Shallow Water
Reclamation + 50 Ha
Connecting Bridge (on pile)
Causeway

REPORT OF ENVIRONMENTAL IMPACT STATEMENT 3-39
Environmental Impact Assessment – Tanjung Perak Port Development in Lamong Bay
3.4. Biological Components
3.4.1. Ecosystem Type
The planned project site for container terminal construction in Lamong Bay
comprises surface and coastal areas. The ecosystem consists of managed
ecosystem, i.e.: salt ponds and natural ecosystem, i.e.: mangrove.
3.4.2. Water Flora and Fauna
Plankton as Water Quality Bio-Indicator
Changes in water quality is closely related to water potencied in terms of
plankton abundance and compositions. The existence of plankton in an area
can supply information in regard with the conditions in the water.
Plankton is a biological parameter that can serve as indicator to evaluate the
quality and degree of fertility in a water area, i.e. : descriptions about the
amounts of living phytoplanktons in an water area and dominating
phytoplankton.
The samples of planktons are taken from 12 sampling points. Point 1 through
point 8 and point 12 are surrounding river estuaries. Point 9 through point 11
are inter-tidal area. All sampling points represent waters surrounding Mirah
Pier of Tanjung Perak Port (See conditions of sampling points in Figure 3.20).
a. Phytoplankton
The dominant phytoplankton in all samping points is Skeletonema sp. In
general, the kinds of phytoplankton found in each sampling point are
relatively indiferent. Saved for Skeletonema sp, the kinds of phytoplanktons
commonly found are Biddulphia sp, Dithylium sp, Chaetoceros sp,
Chaetoceros pseudocurvisetus, Coscinodiscus sp, Coscinodiscus radiatus,
Navicula sp, Pseudo-nitzschia sp, Oscillatoria sp, and Ulothrix sp. The
composition of the kinds, abundance and diversity index in each sampling
point are shown in Table 3.19.
It is idicated that some kinds of phytoplanktons causing red tide, such as :
Ceratium spp, Peridinium sp, Pseudo-nitzschia sp, Noctiluca sp, and
Triceratium sp are relatively not abundant, less than 5.000 individu/lt of
water. The red tide will take place when when the plankton abundance
reaches 2,000,000 individu/lt of water.
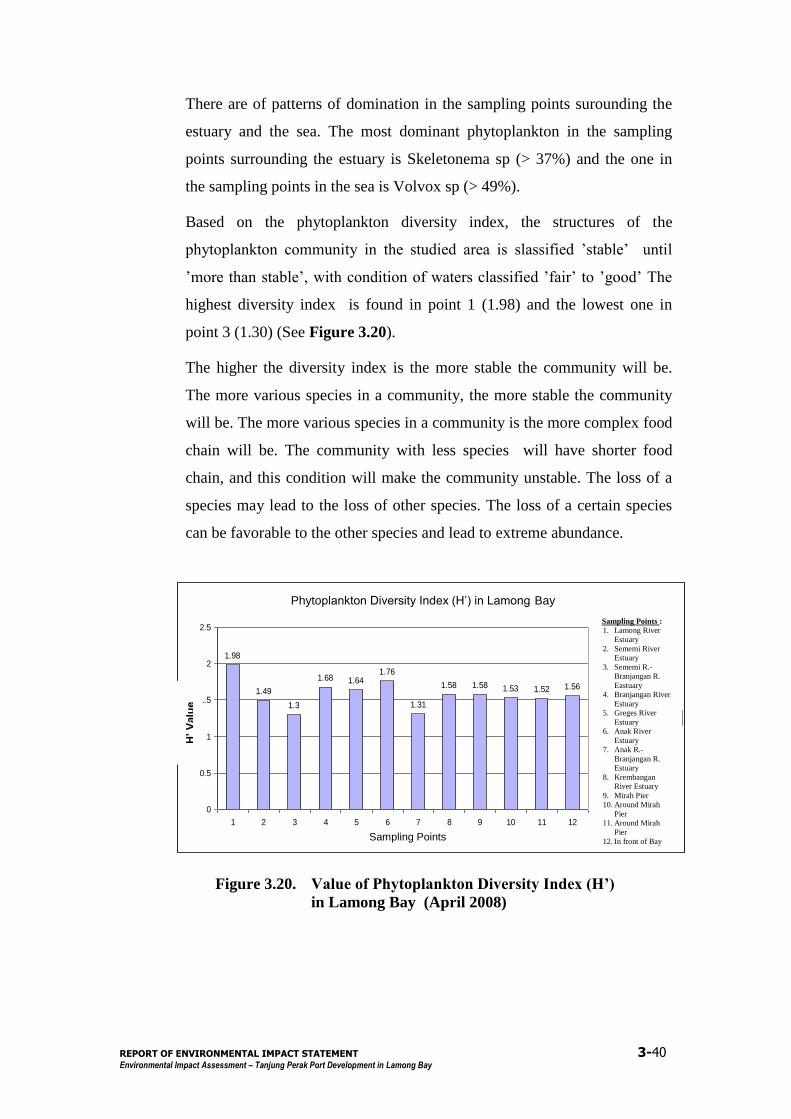
REPORT OF ENVIRONMENTAL IMPACT STATEMENT 3-40
Environmental Impact Assessment – Tanjung Perak Port Development in Lamong Bay
There are of patterns of domination in the sampling points surounding the
estuary and the sea. The most dominant phytoplankton in the sampling
points surrounding the estuary is Skeletonema sp (> 37%) and the one in
the sampling points in the sea is Volvox sp (> 49%).
Based on the phytoplankton diversity index, the structures of the
phytoplankton community in the studied area is slassified ‟stable‟ until
‟more than stable‟, with condition of waters classified ‟fair‟ to ‟good‟ The
highest diversity index is found in point 1 (1.98) and the lowest one in
point 3 (1.30) (See Figure 3.20).
The higher the diversity index is the more stable the community will be.
The more various species in a community, the more stable the community
will be. The more various species in a community is the more complex food
chain will be. The community with less species will have shorter food
chain, and this condition will make the community unstable. The loss of a
species may lead to the loss of other species. The loss of a certain species
can be favorable to the other species and lead to extreme abundance.
Figure 3.20. Value of Phytoplankton Diversity Index (H’)
in Lamong Bay (April 2008)
Phytoplankton Diversity Index (H’) in Lamong Bay
Sampling Points
Indeks Diversitas (H') Fitoplankton Teluk Lamong
1.98
1.49
1.3
1.68 1.641.76
1.31
1.58 1.58 1.53 1.52 1.56
0
0.5
1
1.5
2
2.5
1 2 3 4 5 6 7 8 9 10 11 12
Titik pengambilan sampel
Nil
ai
H'
Indeks Diversitas (H')
Sampling Points :
1. Lamong River
Estuary
2. Sememi River
Estuary
3. Sememi R.-
Branjangan R.
Eastuary
4. Branjangan River
Estuary
5. Greges River
Estuary
6. Anak River
Estuary
7. Anak R.-
Branjangan R.
Estuary
8. Krembangan
River Estuary
9. Mirah Pier
10. Around Mirah
Pier
11. Around Mirah
Pier
12. In front of Bay
Lamong
H’
Valu
e
Sampling Points
Phytoplankton Diversity Index (H’) in Lamong Bay

REPORT OF ENVIRONMENTAL IMPACT STATEMENT 3-41
Environmental Impact Assessment – Tanjung Perak Port Development in Lamong Bay
b. Zooplankton
In the studied area there are 43 species of zooplanktons found and
comprising : Crustacea, fish larva, gelatinous plankton, larva Mollusca,
larva Polychaeta, Nematoda, Chaetognatha, Protozoa, and Foraminifera.
The most dominant species is Copepoda Calanoida of Acartiidae family
and Eucalanidae as well as Brachyura larva (crab) stadia zoea (See Table
3.20).
Almost in all sampling points around the estuary, both economically and
uneconomically potential fish larva are found. Accordingly, it is probable
that the areas surrounding the estuary and mangrove in Lamong Bay are
hatching grounds and nursery grounds of fish. The existence of larva is
predicted to have relationship with the existence and abundance of natural
food of fish larva, i.e. : Copepoda (of Acartiidae and Eucalanidae families)
and other Crustacea, such as Cirripedia dan zoea Brachyura larva (crab).
Fish larvas bringing economic values are gereh/laosan (of Polynemidae
family), milkfish (of Chanidaefamily), tiny sea fish (of Atherinidae family),
belanak (of Mugilidae family), and lemuru (of Clupeidae family).
Based on the diversity index, the waters are categorized „fair‟ to good‟ with
relatively stable community structure. The highest diversity index is found
in point 1 and point 6 (2.21) while the lowest index is found in point 9
(1.41) (Figure 3.21).
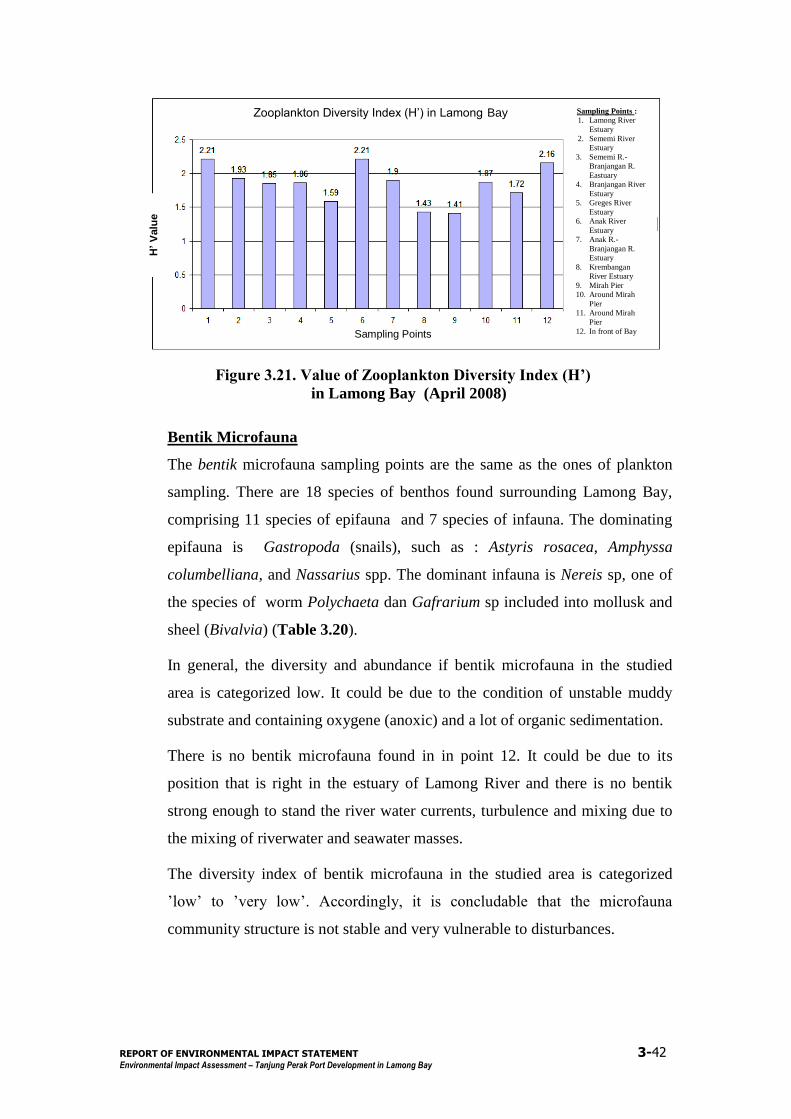
REPORT OF ENVIRONMENTAL IMPACT STATEMENT 3-42
Environmental Impact Assessment – Tanjung Perak Port Development in Lamong Bay
Figure 3.21. Value of Zooplankton Diversity Index (H’)
in Lamong Bay (April 2008)
Bentik Microfauna
The bentik microfauna sampling points are the same as the ones of plankton
sampling. There are 18 species of benthos found surrounding Lamong Bay,
comprising 11 species of epifauna and 7 species of infauna. The dominating
epifauna is Gastropoda (snails), such as : Astyris rosacea, Amphyssa
columbelliana, and Nassarius spp. The dominant infauna is Nereis sp, one of
the species of worm Polychaeta dan Gafrarium sp included into mollusk and
sheel (Bivalvia) (Table 3.20).
In general, the diversity and abundance if bentik microfauna in the studied
area is categorized low. It could be due to the condition of unstable muddy
substrate and containing oxygene (anoxic) and a lot of organic sedimentation.
There is no bentik microfauna found in in point 12. It could be due to its
position that is right in the estuary of Lamong River and there is no bentik
strong enough to stand the river water currents, turbulence and mixing due to
the mixing of riverwater and seawater masses.
The diversity index of bentik microfauna in the studied area is categorized
‟low‟ to ‟very low‟. Accordingly, it is concludable that the microfauna
community structure is not stable and very vulnerable to disturbances.
Sampling Points :
1. Lamong River
Estuary
2. Sememi River
Estuary
3. Sememi R.-
Branjangan R.
Eastuary
4. Branjangan River
Estuary
5. Greges River
Estuary
6. Anak River
Estuary
7. Anak R.-
Branjangan R.
Estuary
8. Krembangan
River Estuary
9. Mirah Pier
10. Around Mirah
Pier
11. Around Mirah
Pier
12. In front of Bay
Zooplankton Diversity Index (H’) in Lamong Bay
H’
Valu
e
Sampling Points
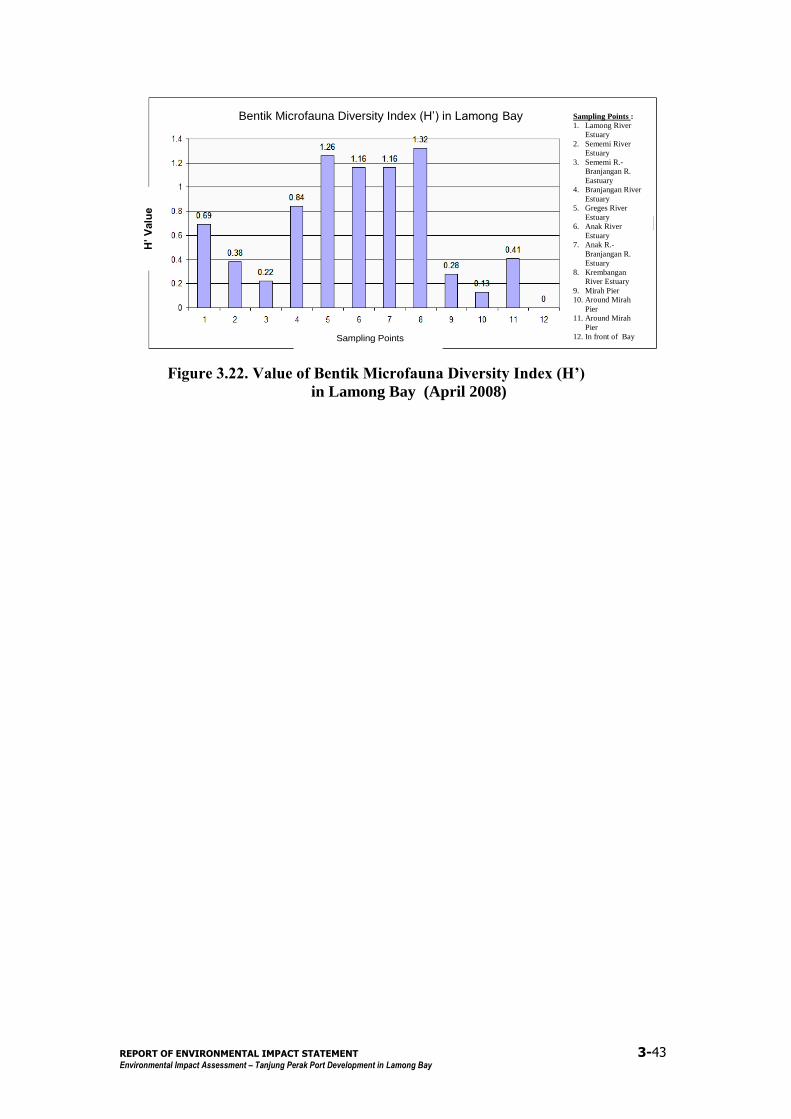
REPORT OF ENVIRONMENTAL IMPACT STATEMENT 3-43
Environmental Impact Assessment – Tanjung Perak Port Development in Lamong Bay
Figure 3.22. Value of Bentik Microfauna Diversity Index (H’)
in Lamong Bay (April 2008)
Sampling Points :
1. Lamong River
Estuary
2. Sememi River
Estuary
3. Sememi R.-
Branjangan R.
Eastuary
4. Branjangan River
Estuary
5. Greges River
Estuary
6. Anak River
Estuary
7. Anak R.-
Branjangan R.
Estuary
8. Krembangan
River Estuary
9. Mirah Pier
10. Around Mirah
Pier
11. Around Mirah
Pier
12. In front of Bay
Sampling Points
H’
Valu
e
Bentik Microfauna Diversity Index (H’) in Lamong Bay
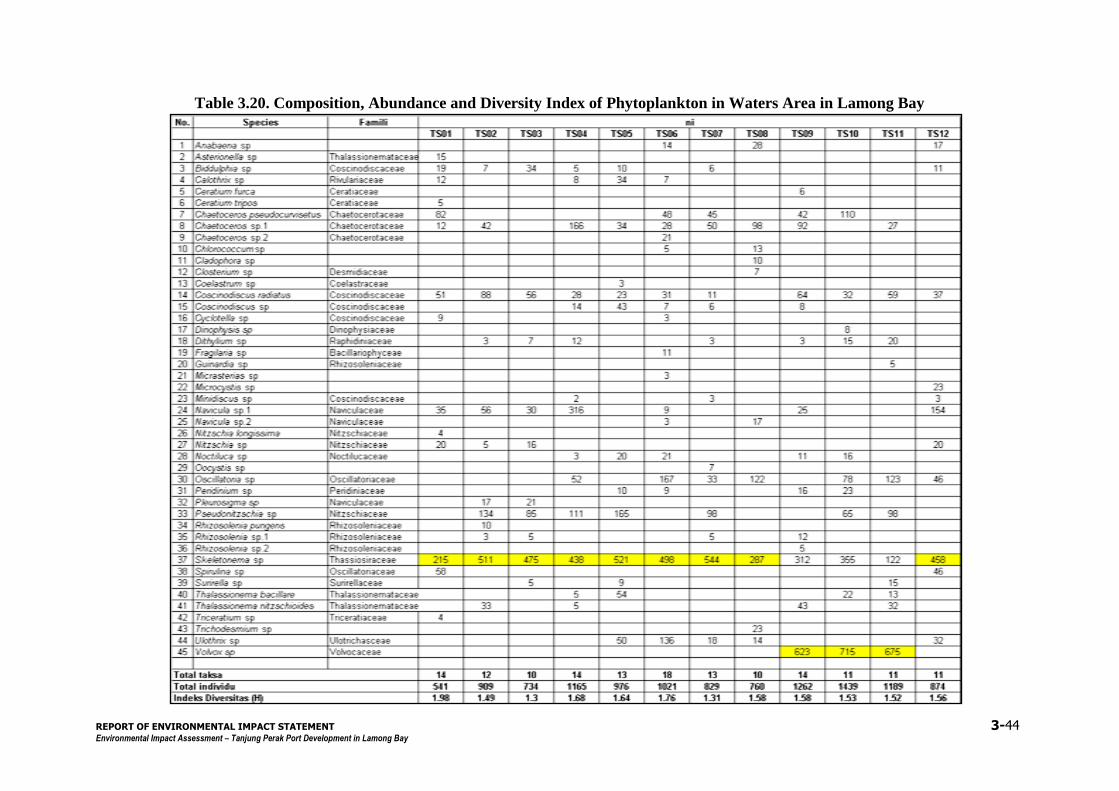
REPORT OF ENVIRONMENTAL IMPACT STATEMENT 3-44
Environmental Impact Assessment – Tanjung Perak Port Development in Lamong Bay
Table 3.20. Composition, Abundance and Diversity Index of Phytoplankton in Waters Area in Lamong Bay
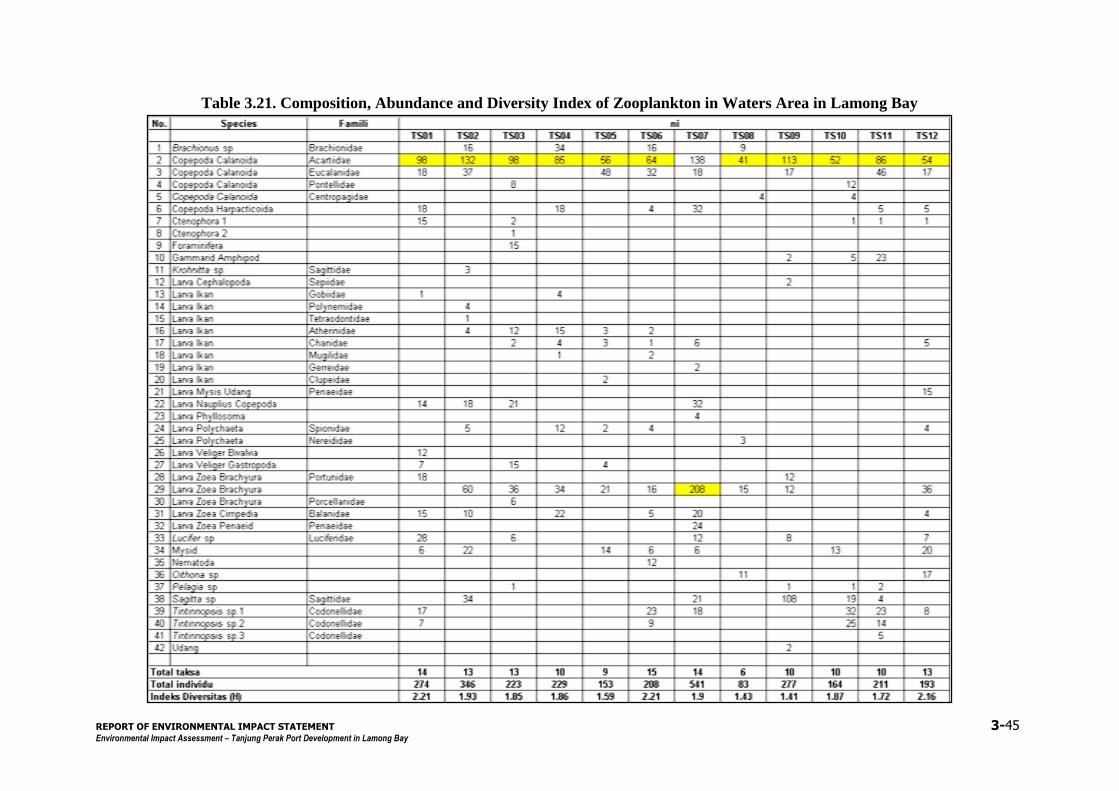
REPORT OF ENVIRONMENTAL IMPACT STATEMENT 3-45
Environmental Impact Assessment – Tanjung Perak Port Development in Lamong Bay
Table 3.21. Composition, Abundance and Diversity Index of Zooplankton in Waters Area in Lamong Bay
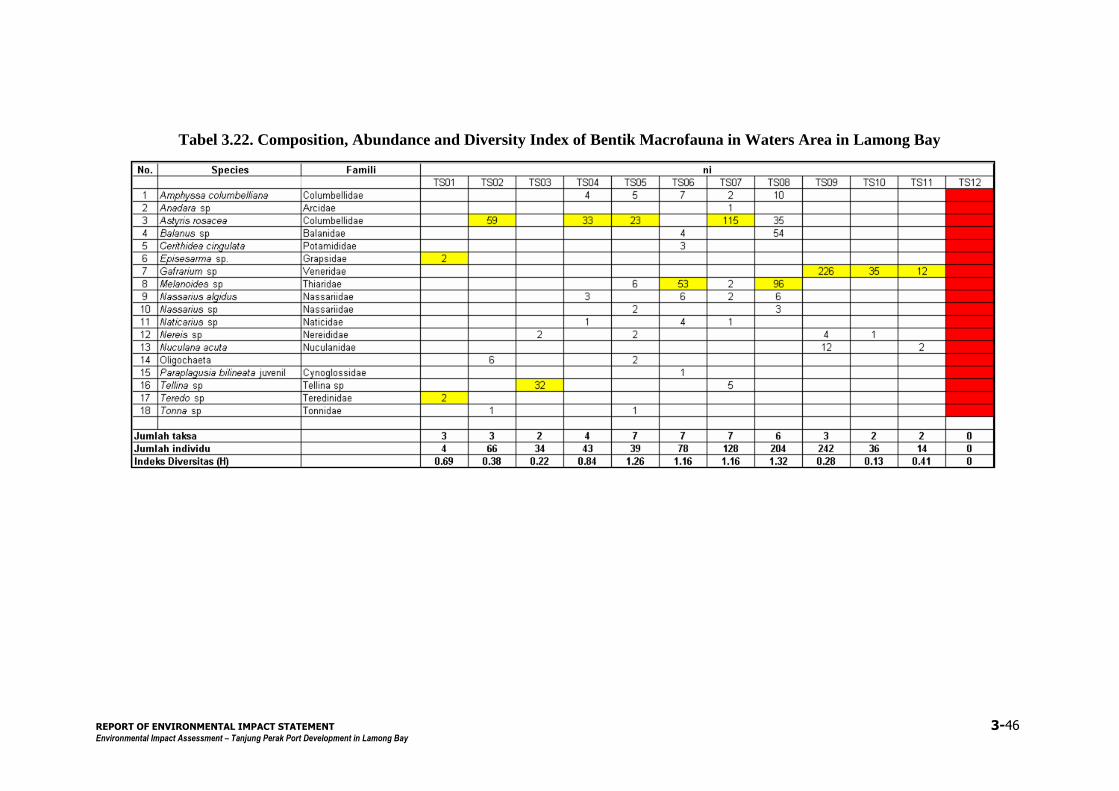
REPORT OF ENVIRONMENTAL IMPACT STATEMENT 3-46
Environmental Impact Assessment – Tanjung Perak Port Development in Lamong Bay
Tabel 3.22. Composition, Abundance and Diversity Index of Bentik Macrofauna in Waters Area in Lamong Bay
REPORT OF ENVIRONMENTAL IMPACT STATEMENT 3-47
Environmental Impact Assessment – Tanjung Perak Port Development in Lamong Bay
3.4.3. Terrestrial Flora and Fauna
Flora (Mangrove Vegetation)
The initial description of terrestrial flora is focused onmangrove vegetatio as
the project site of port development in Lamong Bay is in coastal ecosystem
and the representative and relevant terrestrial vegetation is mangrove.
Mangorove ecosystem is an ecosystem with tropical community vegetation
growing the coastal area and river estuaries. Mangrove ecosystem is affected
by tide and is sensitive to environmenta changes, such as : salinity, shallowing,
oil spills and sedimentation. The parameters adopted for observing the initial
conditions of the mangrove environment and ecosystem is vegetation density
per hectare (tree/Ha), Important Value Index and Mangrove Coverage
Area (%)
The analysis on mangrove vegetation is conducted in 8 observation point in
North Galang Island, South Galang Island, Lamong River Border, Sememmi
River Estuary, Branjangan River Estuary, Project Site, Greges River Estuary,
and Anak River Restuary. The mangrove vegetation is not conserved as the
mangrove conservation in directed to the Eastern Coastal Area of Surabaya
City, saved for Galang Island. The East Java Provincial Government plans to
plot Galang Island as a conservation area for coastal birds.
a. Density
Density is a comparison between the number standing tree ith
(ni) and the
total standing trees (∑n) in % (Decision of Minister of Environment Nr.
201/2004). There are 13 spcies of mangrove in the studied area and 7
sepcies of manggrove surrounding the estuary of Lamong River. 5 other
species, i.e. : Avicennia alba, Avicennia marina, Bruguiera gymnorrhiza,
Rhizophora mocronata and Soneratia alba are found in the project site.
Other species found in the study are completely listed in Table 3.23.
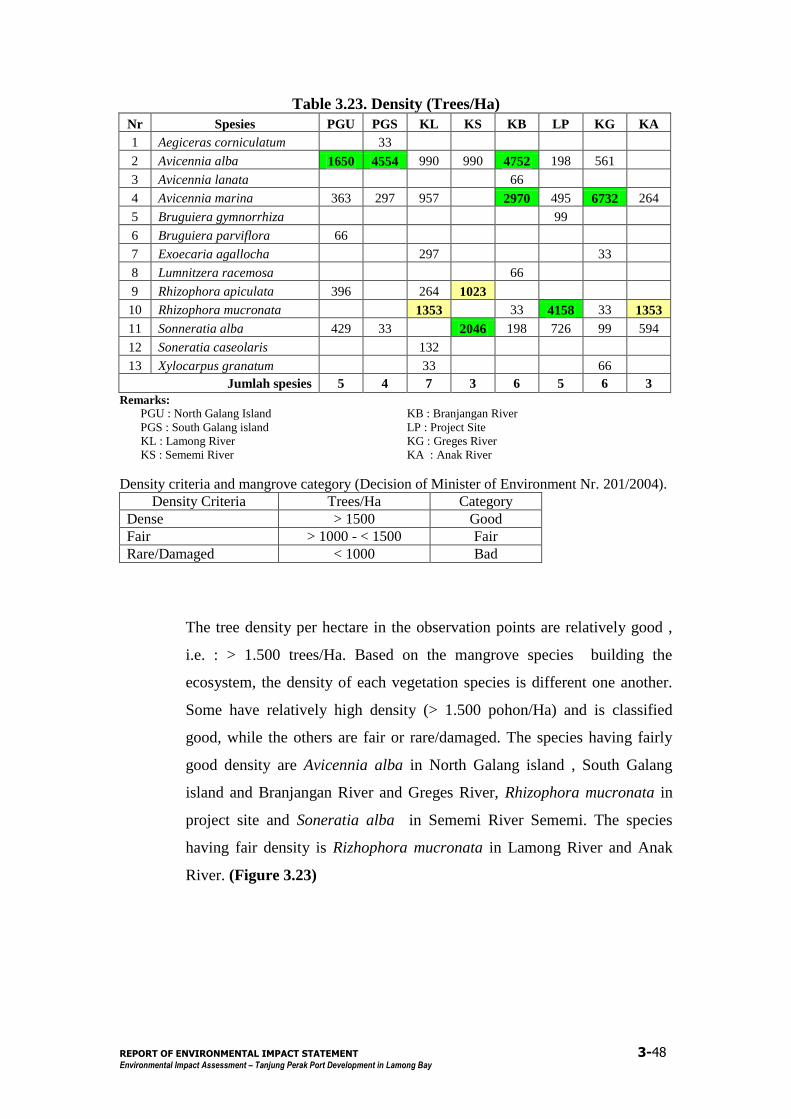
REPORT OF ENVIRONMENTAL IMPACT STATEMENT 3-48
Environmental Impact Assessment – Tanjung Perak Port Development in Lamong Bay
Table 3.23. Density (Trees/Ha)
Nr Spesies PGU PGS KL KS KB LP KG KA
1 Aegiceras corniculatum 33
2 Avicennia alba 1650 4554 990 990 4752 198 561
3 Avicennia lanata 66
4 Avicennia marina 363 297 957 2970 495 6732 264
5 Bruguiera gymnorrhiza 99
6 Bruguiera parviflora 66
7 Exoecaria agallocha 297 33
8 Lumnitzera racemosa 66
9 Rhizophora apiculata 396 264 1023
10 Rhizophora mucronata 1353 33 4158 33 1353
11 Sonneratia alba 429 33 2046 198 726 99 594
12 Soneratia caseolaris 132
13 Xylocarpus granatum 33 66
Jumlah spesies 5 4 7 3 6 5 6 3
Remarks:
PGU : North Galang Island KB : Branjangan River
PGS : South Galang island LP : Project Site
KL : Lamong River KG : Greges River
KS : Sememi River KA : Anak River
Density criteria and mangrove category (Decision of Minister of Environment Nr. 201/2004).
Density Criteria Trees/Ha Category
Dense > 1500 Good
Fair > 1000 - < 1500 Fair
Rare/Damaged < 1000 Bad
The tree density per hectare in the observation points are relatively good ,
i.e. : > 1.500 trees/Ha. Based on the mangrove species building the
ecosystem, the density of each vegetation species is different one another.
Some have relatively high density (> 1.500 pohon/Ha) and is classified
good, while the others are fair or rare/damaged. The species having fairly
good density are Avicennia alba in North Galang island , South Galang
island and Branjangan River and Greges River, Rhizophora mucronata in
project site and Soneratia alba in Sememi River Sememi. The species
having fair density is Rizhophora mucronata in Lamong River and Anak
River. (Figure 3.23)
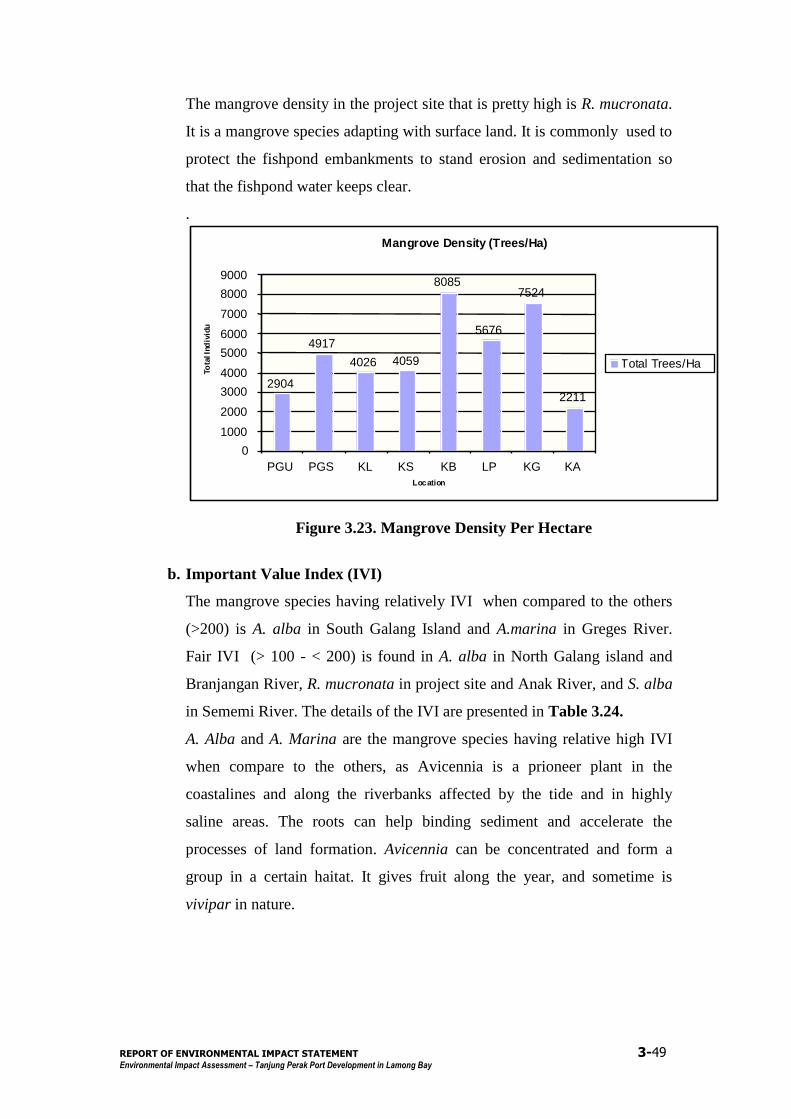
REPORT OF ENVIRONMENTAL IMPACT STATEMENT 3-49
Environmental Impact Assessment – Tanjung Perak Port Development in Lamong Bay
The mangrove density in the project site that is pretty high is R. mucronata.
It is a mangrove species adapting with surface land. It is commonly used to
protect the fishpond embankments to stand erosion and sedimentation so
that the fishpond water keeps clear.
.
Mangrove Density (Trees/Ha)
2904
4917
4026 4059
8085
5676
7524
2211
0
1000
2000
3000
4000
5000
6000
7000
8000
9000
PGU PGS KL KS KB LP KG KA Location
To
tal In
div
idu
Total Trees/Ha
Figure 3.23. Mangrove Density Per Hectare
b. Important Value Index (IVI)
The mangrove species having relatively IVI when compared to the others
(>200) is A. alba in South Galang Island and A.marina in Greges River.
Fair IVI (> 100 - < 200) is found in A. alba in North Galang island and
Branjangan River, R. mucronata in project site and Anak River, and S. alba
in Sememi River. The details of the IVI are presented in Table 3.24.
A. Alba and A. Marina are the mangrove species having relative high IVI
when compare to the others, as Avicennia is a prioneer plant in the
coastalines and along the riverbanks affected by the tide and in highly
saline areas. The roots can help binding sediment and accelerate the
processes of land formation. Avicennia can be concentrated and form a
group in a certain haitat. It gives fruit along the year, and sometime is
vivipar in nature.
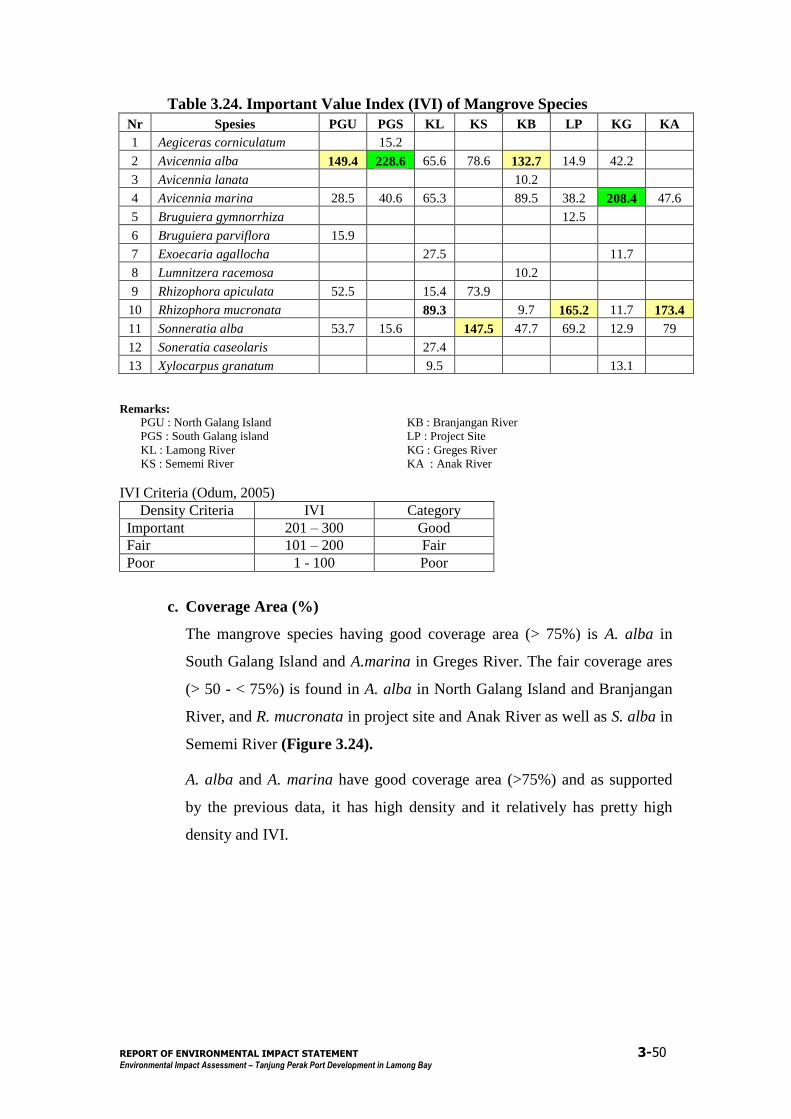
REPORT OF ENVIRONMENTAL IMPACT STATEMENT 3-50
Environmental Impact Assessment – Tanjung Perak Port Development in Lamong Bay
Table 3.24. Important Value Index (IVI) of Mangrove Species
Nr Spesies PGU PGS KL KS KB LP KG KA
1 Aegiceras corniculatum 15.2
2 Avicennia alba 149.4 228.6 65.6 78.6 132.7 14.9 42.2
3 Avicennia lanata 10.2
4 Avicennia marina 28.5 40.6 65.3 89.5 38.2 208.4 47.6
5 Bruguiera gymnorrhiza 12.5
6 Bruguiera parviflora 15.9
7 Exoecaria agallocha 27.5 11.7
8 Lumnitzera racemosa 10.2
9 Rhizophora apiculata 52.5 15.4 73.9
10 Rhizophora mucronata 89.3 9.7 165.2 11.7 173.4
11 Sonneratia alba 53.7 15.6 147.5 47.7 69.2 12.9 79
12 Soneratia caseolaris 27.4
13 Xylocarpus granatum 9.5 13.1
Remarks:
PGU : North Galang Island KB : Branjangan River
PGS : South Galang island LP : Project Site
KL : Lamong River KG : Greges River
KS : Sememi River KA : Anak River
IVI Criteria (Odum, 2005)
Density Criteria IVI Category
Important 201 – 300 Good
Fair 101 – 200 Fair
Poor 1 - 100 Poor
c. Coverage Area (%)
The mangrove species having good coverage area (> 75%) is A. alba in
South Galang Island and A.marina in Greges River. The fair coverage ares
(> 50 - < 75%) is found in A. alba in North Galang Island and Branjangan
River, and R. mucronata in project site and Anak River as well as S. alba in
Sememi River (Figure 3.24).
A. alba and A. marina have good coverage area (>75%) and as supported
by the previous data, it has high density and it relatively has pretty high
density and IVI.

REPORT OF ENVIRONMENTAL IMPACT STATEMENT 3-51
Environmental Impact Assessment – Tanjung Perak Port Development in Lamong Bay
Coverage Area
Penutupan Species Mangrove
67.6
93.1
62.24
85.5
61.9 62.2 68.6
0
20
40
60
80
100
PGU PGS KL KS KB LP KG KA
Location
% C
overa
ge
Avicennia alba
Avicennia marina
Rhizophora mucronata
Sonneratia alba
Figure 3.24. Good and Fair Category of Mangrove Coverage
The detailed coverage area of each mangrove species are presented in
Table 3.25.
Table 3.25. Coverage Area (%)
No Spesies PGU PGS KL KS KB LP KG KA
1 Aegiceras corniculatum 0.3
2 Avicennia alba 67.6 93.1 26.7 25.6 62.24 1.5 12.5
3 Avicennia lanata 0.38
4 Avicennia marina 3.5 5.9 20.2 33.9 9.4 85.5 19
5 Bruguiera gymnorrhiza 0.8
6 Bruguiera parviflora 1.2
7 Exoecaria agallocha 5.8 0.2
8 Lumnitzera racemosa 0.4
9 Rhizophora apiculata 13.8 1.7 5.8
10 Rhizophora mucronata 34.3 0.3 61.9 0.1 62.2
11 Sonneratia alba 13.9 0.7 68.6 2.7 26.4 0.5 18.8
12 Sonneratia caseolaris 9.8
13 Xylocarpus granatum 1.5 1.2
Remarks:
PGU : North Galang Island KB : Branjangan River
PGS : South Galang island LP : Project Site
KL : Lamong River KG : Greges River
KS : Sememi River KA : Anak River
Quality Standard (Decision of Minister of Environment Nr. 201/2004).
Coverage Criteria %
Good > 75
Fair > 50 - < 75
Damaged < 50

REPORT OF ENVIRONMENTAL IMPACT STATEMENT 3-52
Environmental Impact Assessment – Tanjung Perak Port Development in Lamong Bay
3.4.1. Fauna (Birds)
a. Identified Spesies
There are 39 species of birds included in 22 families found in the studied
area. Ardeidae family has the most number of species, i.e. : 8 species
(Table 3.26).
In the observation point in Sememi River the most number of bird species,
i.e. : 24, while in Lamong River and estuary of Branjangan River 23
species, and in the project site, 9 species identified (Figure 3.25), that are
included into 7 families, namely : Alcedinidae, Apodidae, Ardeidae,
Artamidae, Nectarinidae, Picidae dan Silviidae.
Identified Bird Species
20 19
23 24
9
23
16 13
0
5
10
15
20
25
30
PG1 PG2 KL KS LP KB KG KA Study Location
To
tal
Sp
ecie
s
Number of Species
Figure 3.25. Number of Bird Species Identified in Studied Area
The bird species with high frequency and always identified in each
observation point (8 points) are three, comprising : Collocalia esculenta,
Egretta garzetta and Gerygone sulphurea. The species always found in
more than 5 observation sites are 8 spesies, namely Ardeola speciosa,
Butorides striatus, Egretta alba, Nectarinia jugularis, Nycticorax
nycticorax, Streptophilia chinensis, Tordihampus chloris and Trynga
hypoleucos. The detailed identified species are presented in Table 3.26.
PGU PGS
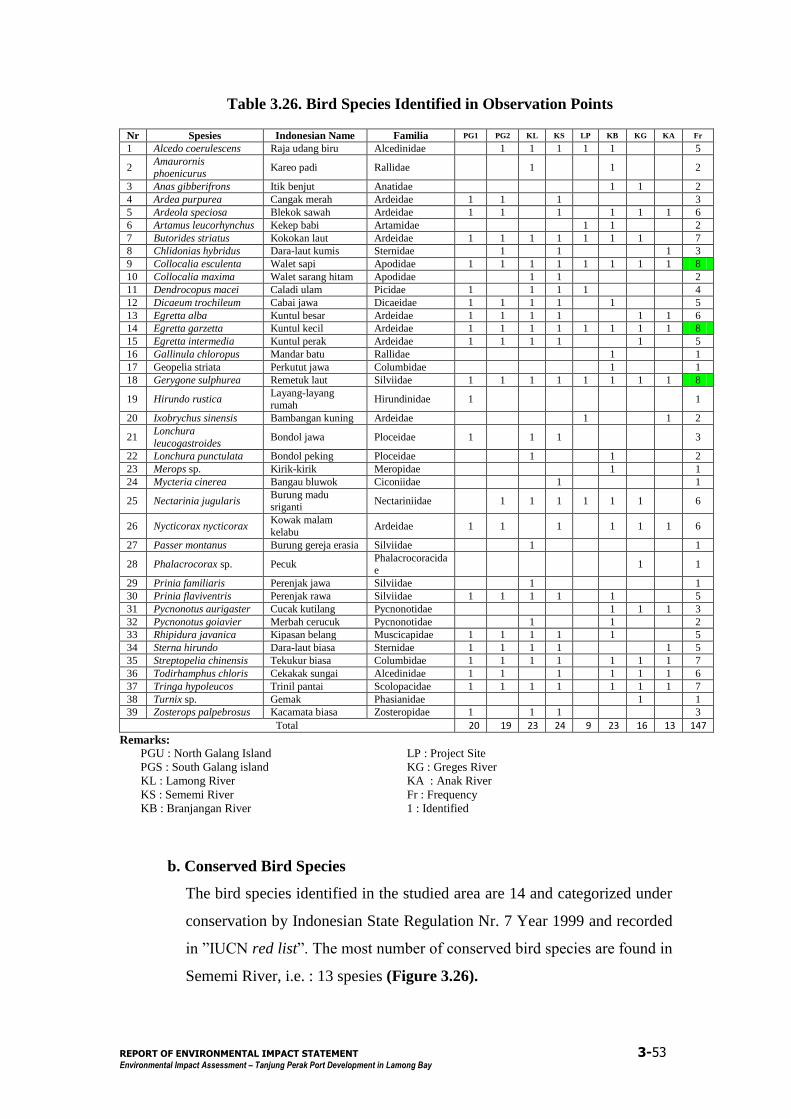
REPORT OF ENVIRONMENTAL IMPACT STATEMENT 3-53
Environmental Impact Assessment – Tanjung Perak Port Development in Lamong Bay
Table 3.26. Bird Species Identified in Observation Points
Nr Spesies Indonesian Name Familia PG1 PG2 KL KS LP KB KG KA Fr
1 Alcedo coerulescens Raja udang biru Alcedinidae 1 1 1 1 1 5
2 Amaurornis phoenicurus
Kareo padi Rallidae 1 1 2
3 Anas gibberifrons Itik benjut Anatidae 1 1 2
4 Ardea purpurea Cangak merah Ardeidae 1 1 1 3
5 Ardeola speciosa Blekok sawah Ardeidae 1 1 1 1 1 1 6
6 Artamus leucorhynchus Kekep babi Artamidae 1 1 2
7 Butorides striatus Kokokan laut Ardeidae 1 1 1 1 1 1 1 7
8 Chlidonias hybridus Dara-laut kumis Sternidae 1 1 1 3
9 Collocalia esculenta Walet sapi Apodidae 1 1 1 1 1 1 1 1 8
10 Collocalia maxima Walet sarang hitam Apodidae 1 1 2
11 Dendrocopus macei Caladi ulam Picidae 1 1 1 1 4
12 Dicaeum trochileum Cabai jawa Dicaeidae 1 1 1 1 1 5
13 Egretta alba Kuntul besar Ardeidae 1 1 1 1 1 1 6
14 Egretta garzetta Kuntul kecil Ardeidae 1 1 1 1 1 1 1 1 8
15 Egretta intermedia Kuntul perak Ardeidae 1 1 1 1 1 5
16 Gallinula chloropus Mandar batu Rallidae 1 1
17 Geopelia striata Perkutut jawa Columbidae 1 1
18 Gerygone sulphurea Remetuk laut Silviidae 1 1 1 1 1 1 1 1 8
19 Hirundo rustica Layang-layang rumah
Hirundinidae 1 1
20 Ixobrychus sinensis Bambangan kuning Ardeidae 1 1 2
21 Lonchura
leucogastroides Bondol jawa Ploceidae 1 1 1 3
22 Lonchura punctulata Bondol peking Ploceidae 1 1 2
23 Merops sp. Kirik-kirik Meropidae 1 1
24 Mycteria cinerea Bangau bluwok Ciconiidae 1 1
25 Nectarinia jugularis Burung madu sriganti
Nectariniidae 1 1 1 1 1 1 6
26 Nycticorax nycticorax Kowak malam
kelabu Ardeidae 1 1 1 1 1 1 6
27 Passer montanus Burung gereja erasia Silviidae 1 1
28 Phalacrocorax sp. Pecuk Phalacrocoracidae
1 1
29 Prinia familiaris Perenjak jawa Silviidae 1 1
30 Prinia flaviventris Perenjak rawa Silviidae 1 1 1 1 1 5
31 Pycnonotus aurigaster Cucak kutilang Pycnonotidae 1 1 1 3
32 Pycnonotus goiavier Merbah cerucuk Pycnonotidae 1 1 2
33 Rhipidura javanica Kipasan belang Muscicapidae 1 1 1 1 1 5
34 Sterna hirundo Dara-laut biasa Sternidae 1 1 1 1 1 5
35 Streptopelia chinensis Tekukur biasa Columbidae 1 1 1 1 1 1 1 7
36 Todirhamphus chloris Cekakak sungai Alcedinidae 1 1 1 1 1 1 6
37 Tringa hypoleucos Trinil pantai Scolopacidae 1 1 1 1 1 1 1 7
38 Turnix sp. Gemak Phasianidae 1 1
39 Zosterops palpebrosus Kacamata biasa Zosteropidae 1 1 1 3
Total 20 19 23 24 9 23 16 13 147
Remarks:
PGU : North Galang Island LP : Project Site
PGS : South Galang island KG : Greges River
KL : Lamong River KA : Anak River
KS : Sememi River Fr : Frequency
KB : Branjangan River 1 : Identified
b. Conserved Bird Species
The bird species identified in the studied area are 14 and categorized under
conservation by Indonesian State Regulation Nr. 7 Year 1999 and recorded
in ”IUCN red list”. The most number of conserved bird species are found in
Sememi River, i.e. : 13 spesies (Figure 3.26).
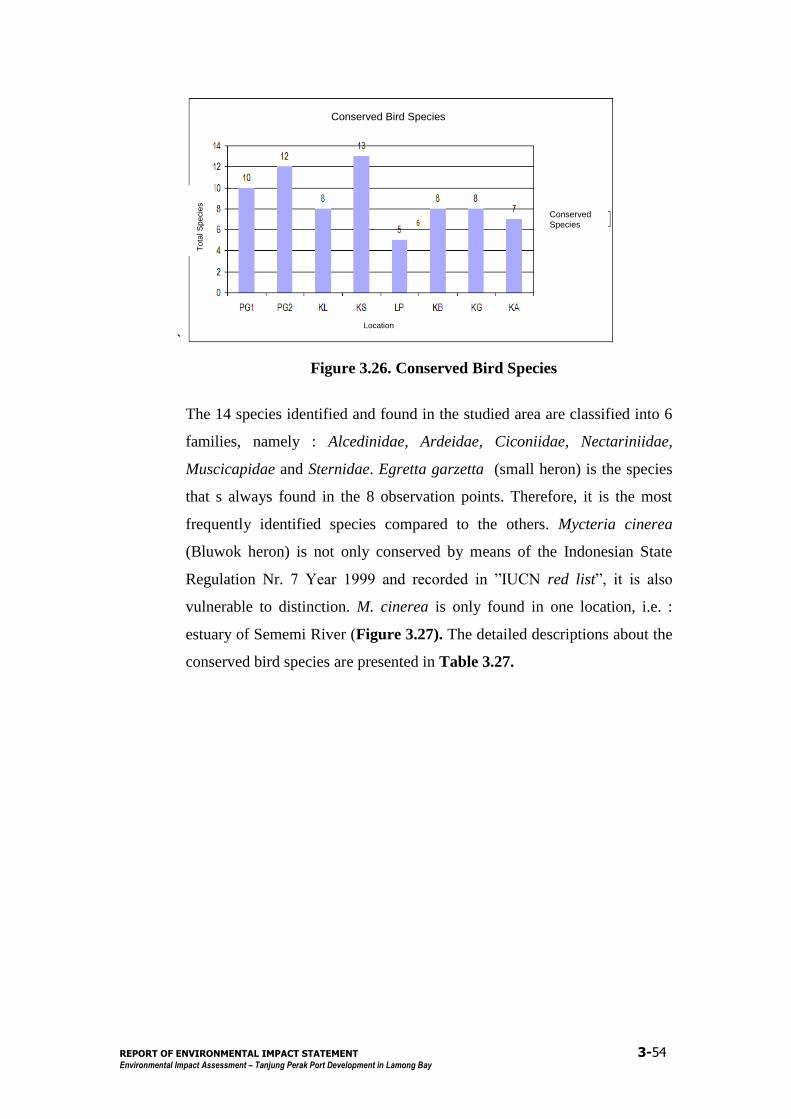
REPORT OF ENVIRONMENTAL IMPACT STATEMENT 3-54
Environmental Impact Assessment – Tanjung Perak Port Development in Lamong Bay
`
Figure 3.26. Conserved Bird Species
The 14 species identified and found in the studied area are classified into 6
families, namely : Alcedinidae, Ardeidae, Ciconiidae, Nectariniidae,
Muscicapidae and Sternidae. Egretta garzetta (small heron) is the species
that s always found in the 8 observation points. Therefore, it is the most
frequently identified species compared to the others. Mycteria cinerea
(Bluwok heron) is not only conserved by means of the Indonesian State
Regulation Nr. 7 Year 1999 and recorded in ”IUCN red list”, it is also
vulnerable to distinction. M. cinerea is only found in one location, i.e. :
estuary of Sememi River (Figure 3.27). The detailed descriptions about the
conserved bird species are presented in Table 3.27.
Conserved Bird Species
To
tal S
pe
cie
s
Location
Conserved
Species
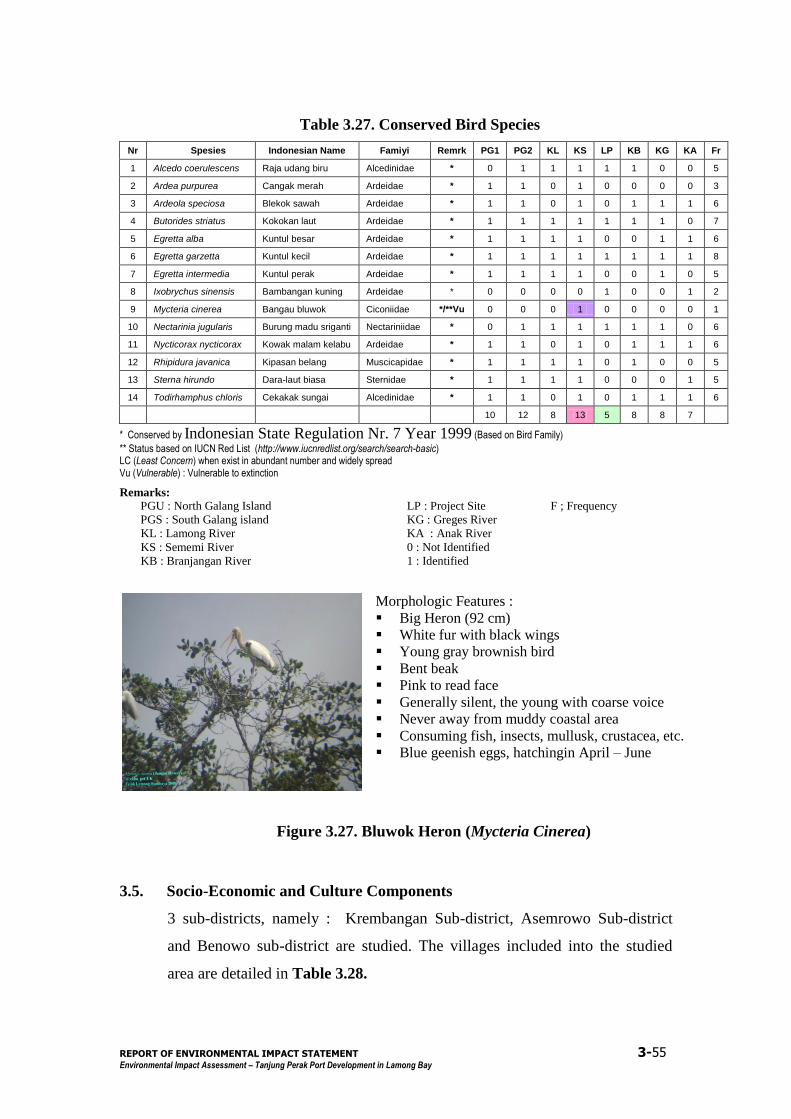
REPORT OF ENVIRONMENTAL IMPACT STATEMENT 3-55
Environmental Impact Assessment – Tanjung Perak Port Development in Lamong Bay
Table 3.27. Conserved Bird Species
Nr Spesies Indonesian Name Famiyi Remrk PG1 PG2 KL KS LP KB KG KA Fr
1 Alcedo coerulescens Raja udang biru Alcedinidae * 0 1 1 1 1 1 0 0 5
2 Ardea purpurea Cangak merah Ardeidae * 1 1 0 1 0 0 0 0 3
3 Ardeola speciosa Blekok sawah Ardeidae * 1 1 0 1 0 1 1 1 6
4 Butorides striatus Kokokan laut Ardeidae * 1 1 1 1 1 1 1 0 7
5 Egretta alba Kuntul besar Ardeidae * 1 1 1 1 0 0 1 1 6
6 Egretta garzetta Kuntul kecil Ardeidae * 1 1 1 1 1 1 1 1 8
7 Egretta intermedia Kuntul perak Ardeidae * 1 1 1 1 0 0 1 0 5
8 Ixobrychus sinensis Bambangan kuning Ardeidae * 0 0 0 0 1 0 0 1 2
9 Mycteria cinerea Bangau bluwok Ciconiidae */**Vu 0 0 0 1 0 0 0 0 1
10 Nectarinia jugularis Burung madu sriganti Nectariniidae * 0 1 1 1 1 1 1 0 6
11 Nycticorax nycticorax Kowak malam kelabu Ardeidae * 1 1 0 1 0 1 1 1 6
12 Rhipidura javanica Kipasan belang Muscicapidae * 1 1 1 1 0 1 0 0 5
13 Sterna hirundo Dara-laut biasa Sternidae * 1 1 1 1 0 0 0 1 5
14 Todirhamphus chloris Cekakak sungai Alcedinidae * 1 1 0 1 0 1 1 1 6
10 12 8 13 5 8 8 7
* Conserved by Indonesian State Regulation Nr. 7 Year 1999 (Based on Bird Family)
** Status based on IUCN Red List (http://www.iucnredlist.org/search/search-basic) LC (Least Concern) when exist in abundant number and widely spread Vu (Vulnerable) : Vulnerable to extinction
Remarks:
PGU : North Galang Island LP : Project Site F ; Frequency
PGS : South Galang island KG : Greges River
KL : Lamong River KA : Anak River
KS : Sememi River 0 : Not Identified
KB : Branjangan River 1 : Identified
Figure 3.27. Bluwok Heron (Mycteria Cinerea)
3.5. Socio-Economic and Culture Components
3 sub-districts, namely : Krembangan Sub-district, Asemrowo Sub-district
and Benowo sub-district are studied. The villages included into the studied
area are detailed in Table 3.28.
Morphologic Features :
Big Heron (92 cm)
White fur with black wings
Young gray brownish bird
Bent beak
Pink to read face
Generally silent, the young with coarse voice
Never away from muddy coastal area
Consuming fish, insects, mullusk, crustacea, etc.
Blue geenish eggs, hatchingin April – June
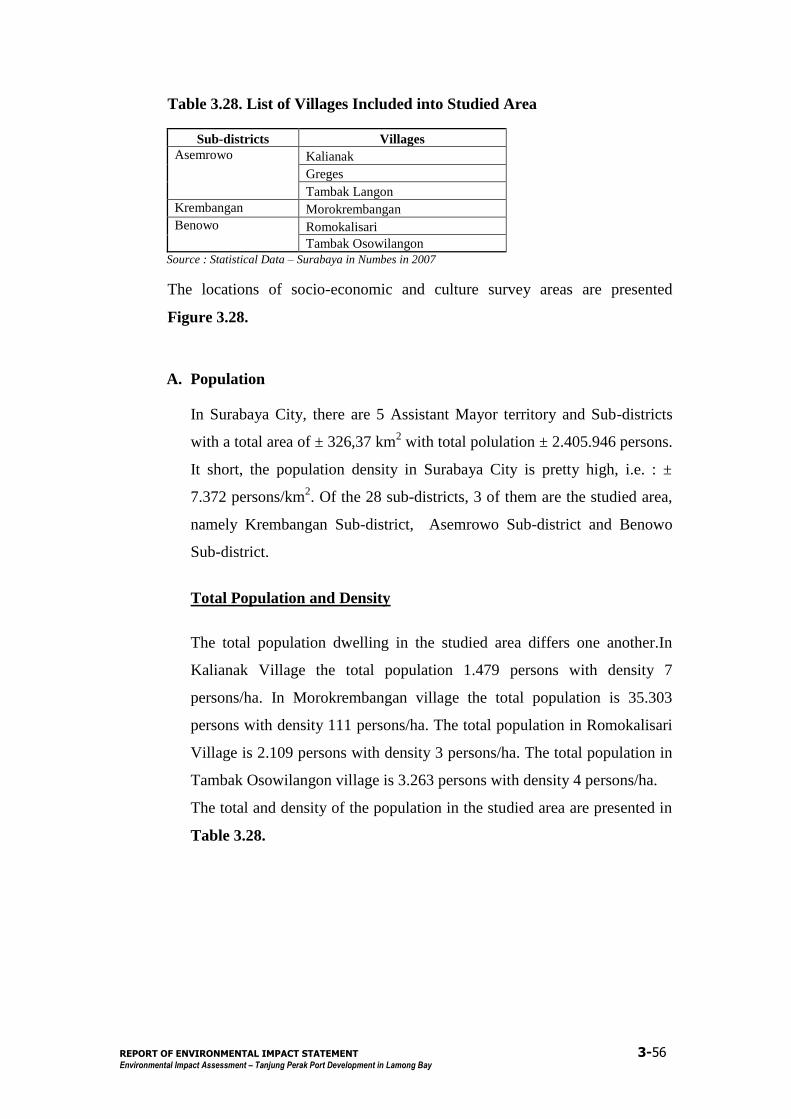
REPORT OF ENVIRONMENTAL IMPACT STATEMENT 3-56
Environmental Impact Assessment – Tanjung Perak Port Development in Lamong Bay
Table 3.28. List of Villages Included into Studied Area
Sub-districts Villages
Asemrowo Kalianak
Greges
Tambak Langon
Krembangan Morokrembangan
Benowo Romokalisari
Tambak Osowilangon
Source : Statistical Data – Surabaya in Numbes in 2007
The locations of socio-economic and culture survey areas are presented
Figure 3.28.
A. Population
In Surabaya City, there are 5 Assistant Mayor territory and Sub-districts
with a total area of ± 326,37 km2 with total polulation ± 2.405.946 persons.
It short, the population density in Surabaya City is pretty high, i.e. : ±
7.372 persons/km2. Of the 28 sub-districts, 3 of them are the studied area,
namely Krembangan Sub-district, Asemrowo Sub-district and Benowo
Sub-district.
Total Population and Density
The total population dwelling in the studied area differs one another.In
Kalianak Village the total population 1.479 persons with density 7
persons/ha. In Morokrembangan village the total population is 35.303
persons with density 111 persons/ha. The total population in Romokalisari
Village is 2.109 persons with density 3 persons/ha. The total population in
Tambak Osowilangon village is 3.263 persons with density 4 persons/ha.
The total and density of the population in the studied area are presented in
Table 3.28.
Figure 3.28.
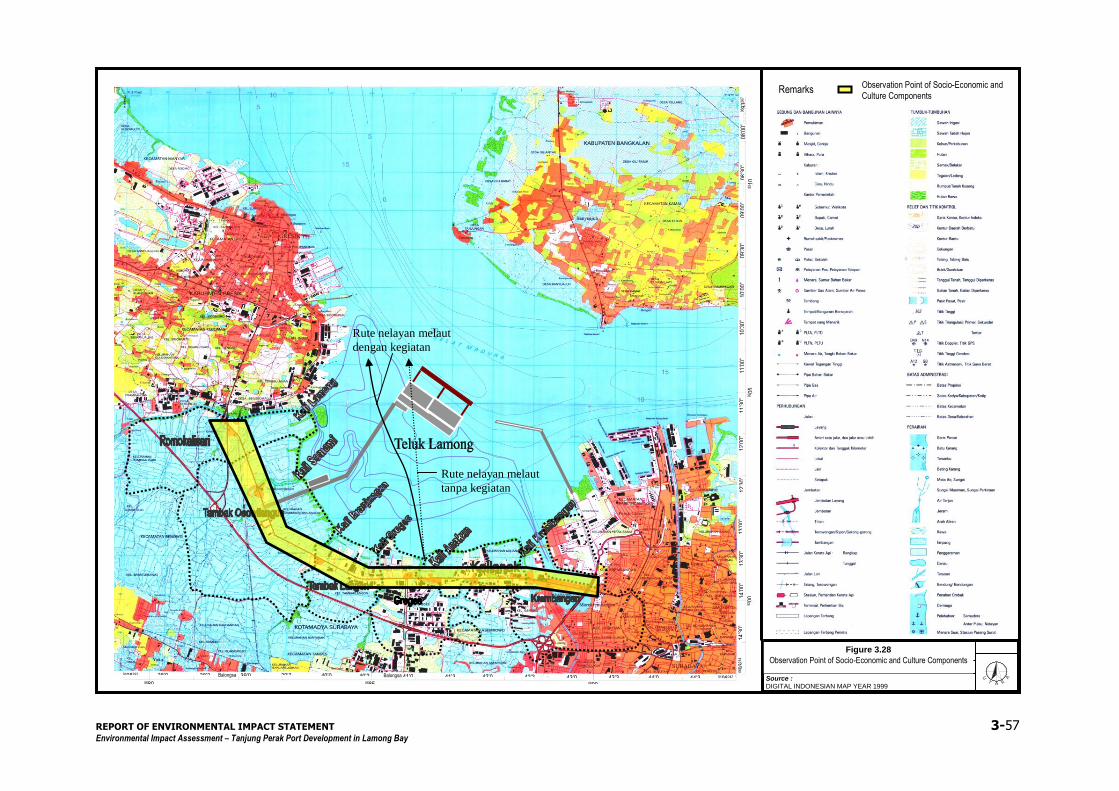
REPORT OF ENVIRONMENTAL IMPACT STATEMENT 3-57
Environmental Impact Assessment – Tanjung Perak Port Development in Lamong Bay
Source : DIGITAL INDONESIAN MAP YEAR 1999 PENGUKURAN BATHYMETRI MUARA KALI LAMONG TAHUN 2008
1 0 1 2k
m
SKALA
U
TA R
A
14’3
0”
14’0
0”
9200
13’3
0”
13’0
0”
12’3
0”
12’0
0”
11’3
0”
11’0
0”
9205
10’3
0”
10’0
0”
09’3
0”
09’0
0”
08’3
0”
9210
08
’00”
06
932
67
mT
44’00”
44’30”
9198242 mU
9198293 mU
38’00”
38’30” 0680
Balongsa
ri 3,5 km
39’00”
39’30”
40’00”
40’30” 0685
Balongsari
1 km
41’00”
41’30”
42’00”
42’30”
43’00” 0690
43’30”
0693
214
m
T
Remarks : Observation Point of Socio-Economic and
Culture Components
-1 -
0,8 -
0,2
-0,6
Figure 3.28
Observation Point of Socio-Economic and Culture Components
Rute nelayan melaut
tanpa kegiatan
Rute nelayan melaut
dengan kegiatan
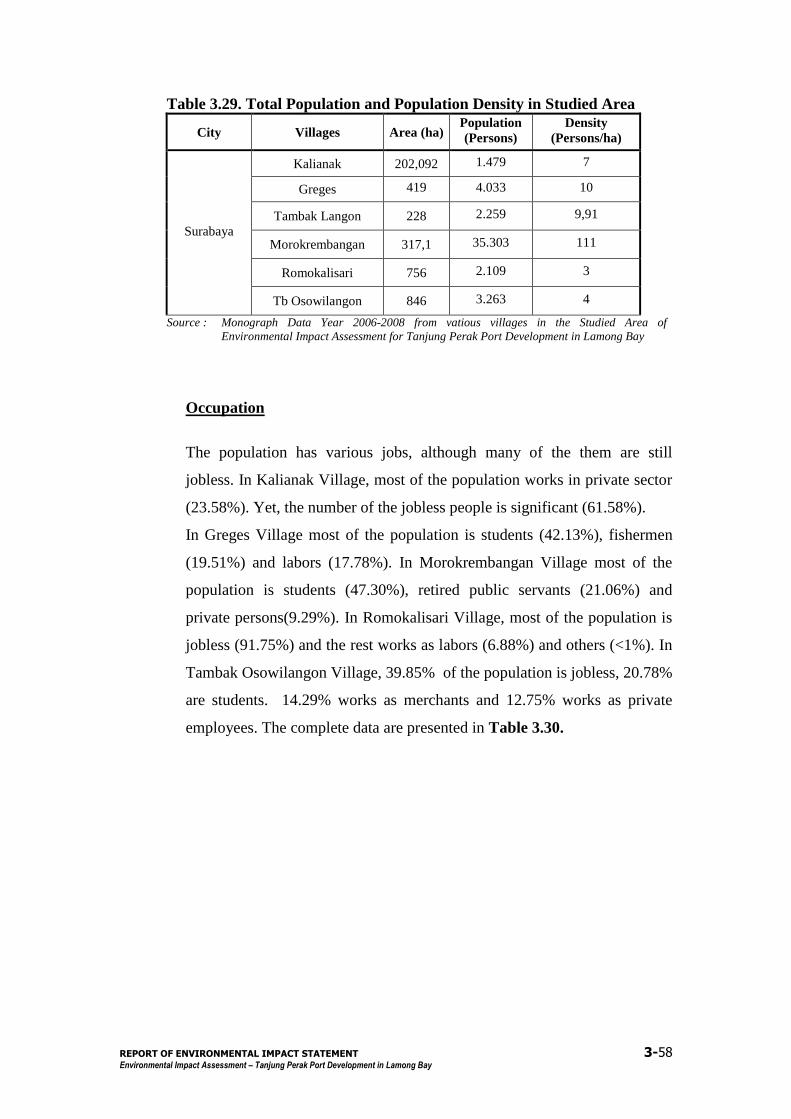
REPORT OF ENVIRONMENTAL IMPACT STATEMENT 3-58
Environmental Impact Assessment – Tanjung Perak Port Development in Lamong Bay
Table 3.29. Total Population and Population Density in Studied Area
City Villages Area (ha) Population
(Persons)
Density
(Persons/ha)
Surabaya
Kalianak 202,092 1.479 7
Greges 419 4.033 10
Tambak Langon 228 2.259 9,91
Morokrembangan 317,1 35.303 111
Romokalisari 756 2.109 3
Tb Osowilangon 846 3.263 4
Source : Monograph Data Year 2006-2008 from vatious villages in the Studied Area of
Environmental Impact Assessment for Tanjung Perak Port Development in Lamong Bay
Occupation
The population has various jobs, although many of the them are still
jobless. In Kalianak Village, most of the population works in private sector
(23.58%). Yet, the number of the jobless people is significant (61.58%).
In Greges Village most of the population is students (42.13%), fishermen
(19.51%) and labors (17.78%). In Morokrembangan Village most of the
population is students (47.30%), retired public servants (21.06%) and
private persons(9.29%). In Romokalisari Village, most of the population is
jobless (91.75%) and the rest works as labors (6.88%) and others (<1%). In
Tambak Osowilangon Village, 39.85% of the population is jobless, 20.78%
are students. 14.29% works as merchants and 12.75% works as private
employees. The complete data are presented in Table 3.30.
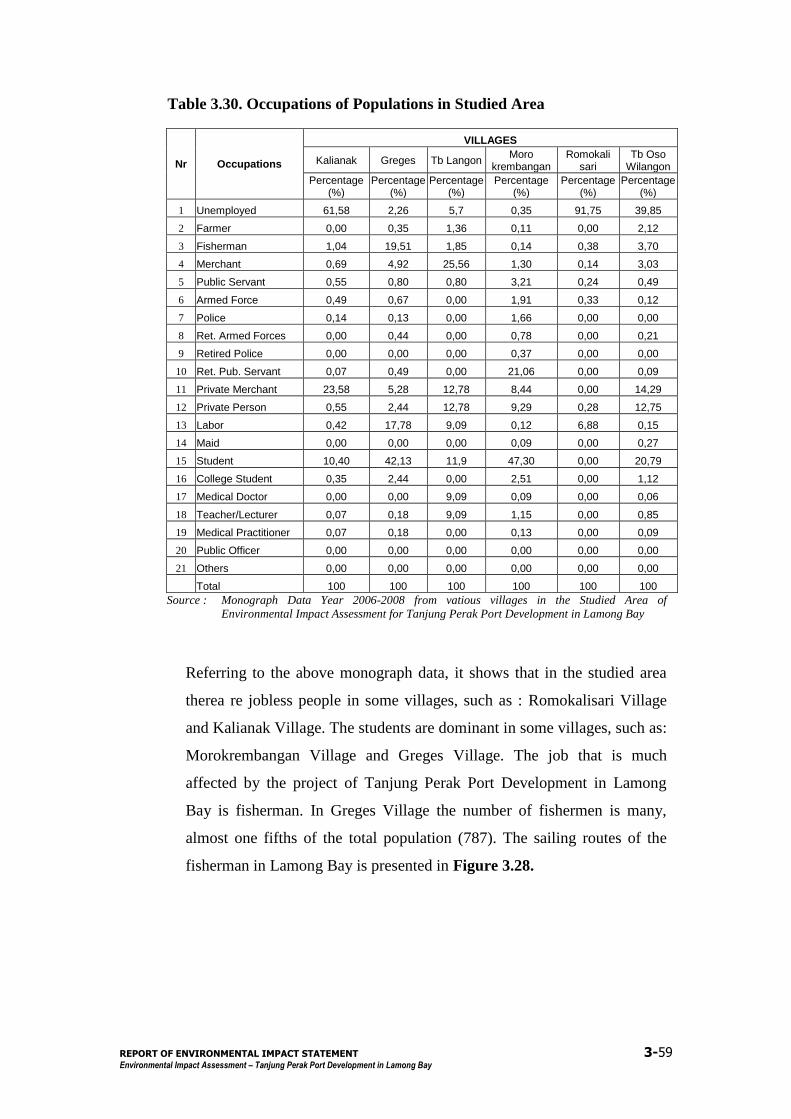
REPORT OF ENVIRONMENTAL IMPACT STATEMENT 3-59
Environmental Impact Assessment – Tanjung Perak Port Development in Lamong Bay
Table 3.30. Occupations of Populations in Studied Area
Nr Occupations
VILLAGES
Kalianak Greges Tb Langon Moro
krembangan Romokali
sari Tb Oso
Wilangon
Percentage (%)
Percentage (%)
Percentage (%)
Percentage (%)
Percentage (%)
Percentage (%)
1 Unemployed 61,58 2,26 5,7 0,35 91,75 39,85
2 Farmer 0,00 0,35 1,36 0,11 0,00 2,12
3 Fisherman 1,04 19,51 1,85 0,14 0,38 3,70
4 Merchant 0,69 4,92 25,56 1,30 0,14 3,03
5 Public Servant 0,55 0,80 0,80 3,21 0,24 0,49
6 Armed Force 0,49 0,67 0,00 1,91 0,33 0,12
7 Police 0,14 0,13 0,00 1,66 0,00 0,00
8 Ret. Armed Forces 0,00 0,44 0,00 0,78 0,00 0,21
9 Retired Police 0,00 0,00 0,00 0,37 0,00 0,00
10 Ret. Pub. Servant 0,07 0,49 0,00 21,06 0,00 0,09
11 Private Merchant 23,58 5,28 12,78 8,44 0,00 14,29
12 Private Person 0,55 2,44 12,78 9,29 0,28 12,75
13 Labor 0,42 17,78 9,09 0,12 6,88 0,15
14 Maid 0,00 0,00 0,00 0,09 0,00 0,27
15 Student 10,40 42,13 11,9 47,30 0,00 20,79
16 College Student 0,35 2,44 0,00 2,51 0,00 1,12
17 Medical Doctor 0,00 0,00 9,09 0,09 0,00 0,06
18 Teacher/Lecturer 0,07 0,18 9,09 1,15 0,00 0,85
19 Medical Practitioner 0,07 0,18 0,00 0,13 0,00 0,09
20 Public Officer 0,00 0,00 0,00 0,00 0,00 0,00
21 Others 0,00 0,00 0,00 0,00 0,00 0,00
Total 100 100 100 100 100 100
Source : Monograph Data Year 2006-2008 from vatious villages in the Studied Area of
Environmental Impact Assessment for Tanjung Perak Port Development in Lamong Bay
Referring to the above monograph data, it shows that in the studied area
therea re jobless people in some villages, such as : Romokalisari Village
and Kalianak Village. The students are dominant in some villages, such as:
Morokrembangan Village and Greges Village. The job that is much
affected by the project of Tanjung Perak Port Development in Lamong
Bay is fisherman. In Greges Village the number of fishermen is many,
almost one fifths of the total population (787). The sailing routes of the
fisherman in Lamong Bay is presented in Figure 3.28.
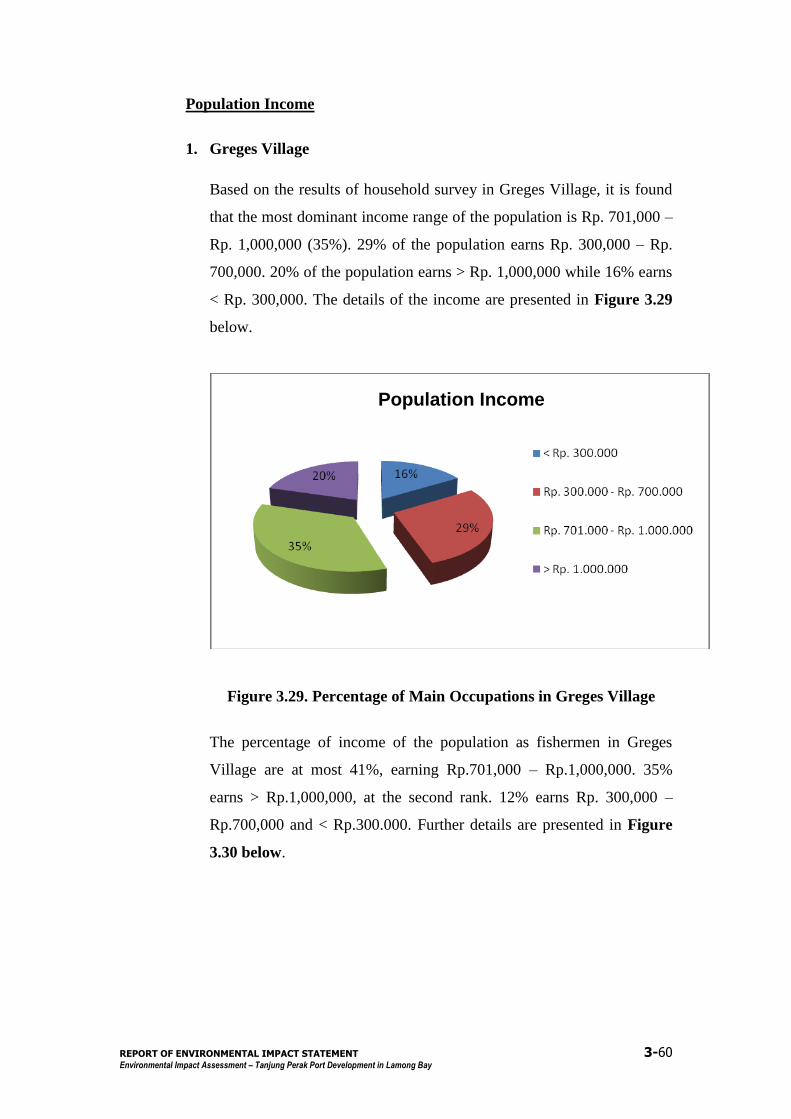
REPORT OF ENVIRONMENTAL IMPACT STATEMENT 3-60
Environmental Impact Assessment – Tanjung Perak Port Development in Lamong Bay
Population Income
1. Greges Village
Based on the results of household survey in Greges Village, it is found
that the most dominant income range of the population is Rp. 701,000 –
Rp. 1,000,000 (35%). 29% of the population earns Rp. 300,000 – Rp.
700,000. 20% of the population earns > Rp. 1,000,000 while 16% earns
< Rp. 300,000. The details of the income are presented in Figure 3.29
below.
Figure 3.29. Percentage of Main Occupations in Greges Village
The percentage of income of the population as fishermen in Greges
Village are at most 41%, earning Rp.701,000 – Rp.1,000,000. 35%
earns > Rp.1,000,000, at the second rank. 12% earns Rp. 300,000 –
Rp.700,000 and < Rp.300.000. Further details are presented in Figure
3.30 below.
Population Income
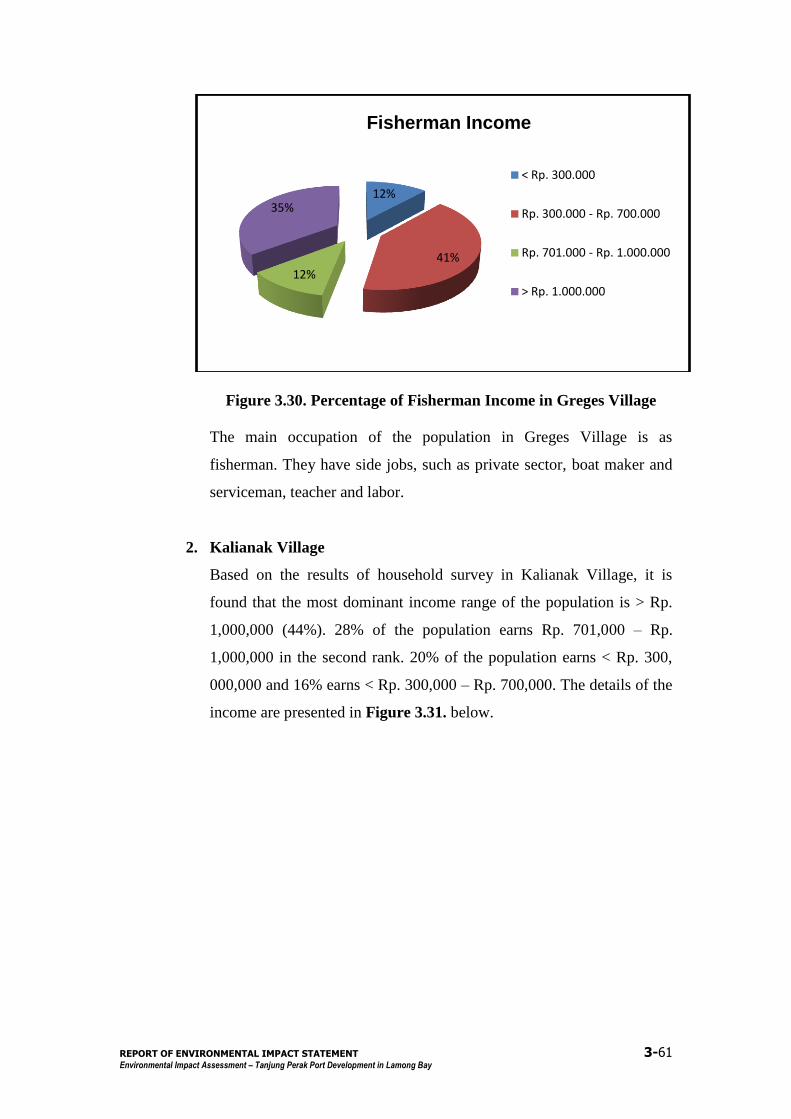
REPORT OF ENVIRONMENTAL IMPACT STATEMENT 3-61
Environmental Impact Assessment – Tanjung Perak Port Development in Lamong Bay
Figure 3.30. Percentage of Fisherman Income in Greges Village
The main occupation of the population in Greges Village is as
fisherman. They have side jobs, such as private sector, boat maker and
serviceman, teacher and labor.
2. Kalianak Village
Based on the results of household survey in Kalianak Village, it is
found that the most dominant income range of the population is > Rp.
1,000,000 (44%). 28% of the population earns Rp. 701,000 – Rp.
1,000,000 in the second rank. 20% of the population earns < Rp. 300,
000,000 and 16% earns < Rp. 300,000 – Rp. 700,000. The details of the
income are presented in Figure 3.31. below.
12%
41%
12%
35%
Penghasilan Nelayan
< Rp. 300.000
Rp. 300.000 - Rp. 700.000
Rp. 701.000 - Rp. 1.000.000
> Rp. 1.000.000
Fisherman Income
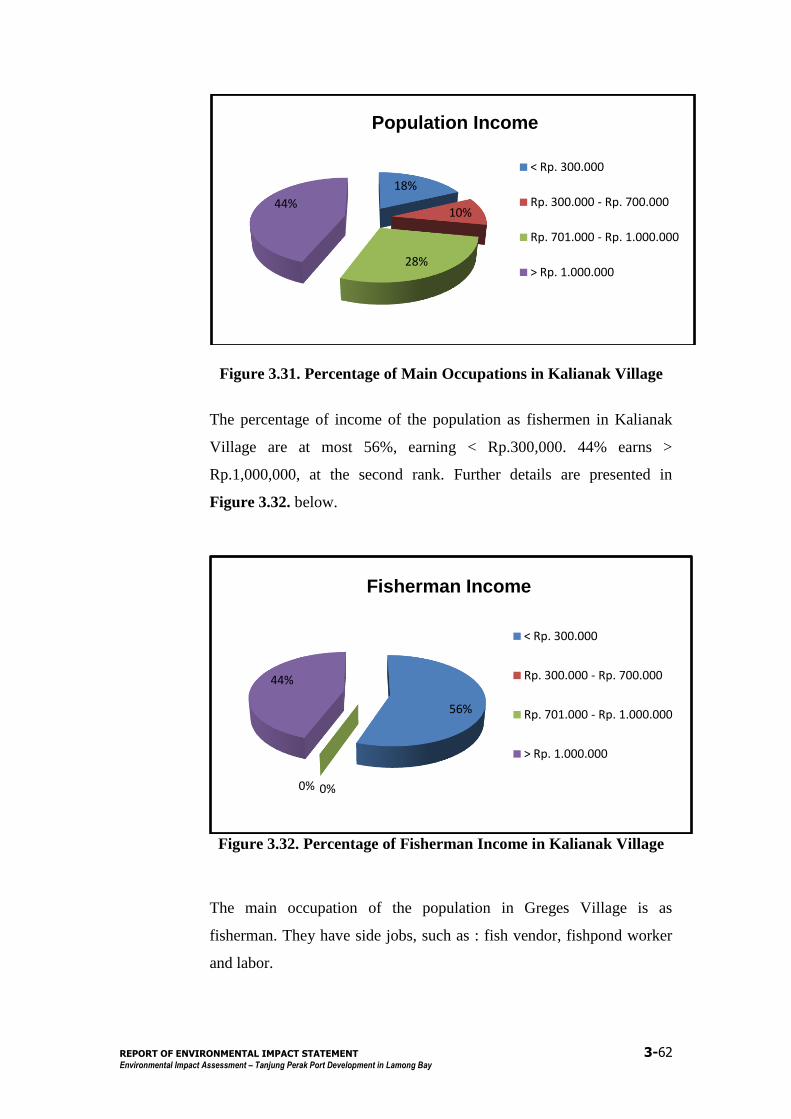
REPORT OF ENVIRONMENTAL IMPACT STATEMENT 3-62
Environmental Impact Assessment – Tanjung Perak Port Development in Lamong Bay
Figure 3.31. Percentage of Main Occupations in Kalianak Village
The percentage of income of the population as fishermen in Kalianak
Village are at most 56%, earning < Rp.300,000. 44% earns >
Rp.1,000,000, at the second rank. Further details are presented in
Figure 3.32. below.
Figure 3.32. Percentage of Fisherman Income in Kalianak Village
The main occupation of the population in Greges Village is as
fisherman. They have side jobs, such as : fish vendor, fishpond worker
and labor.
18%
10%
28%
44%
Penghasilan Penduduk
< Rp. 300.000
Rp. 300.000 - Rp. 700.000
Rp. 701.000 - Rp. 1.000.000
> Rp. 1.000.000
56%
0%0%
44%
Penghasilan Nelayan
< Rp. 300.000
Rp. 300.000 - Rp. 700.000
Rp. 701.000 - Rp. 1.000.000
> Rp. 1.000.000
Population Income
Fisherman Income
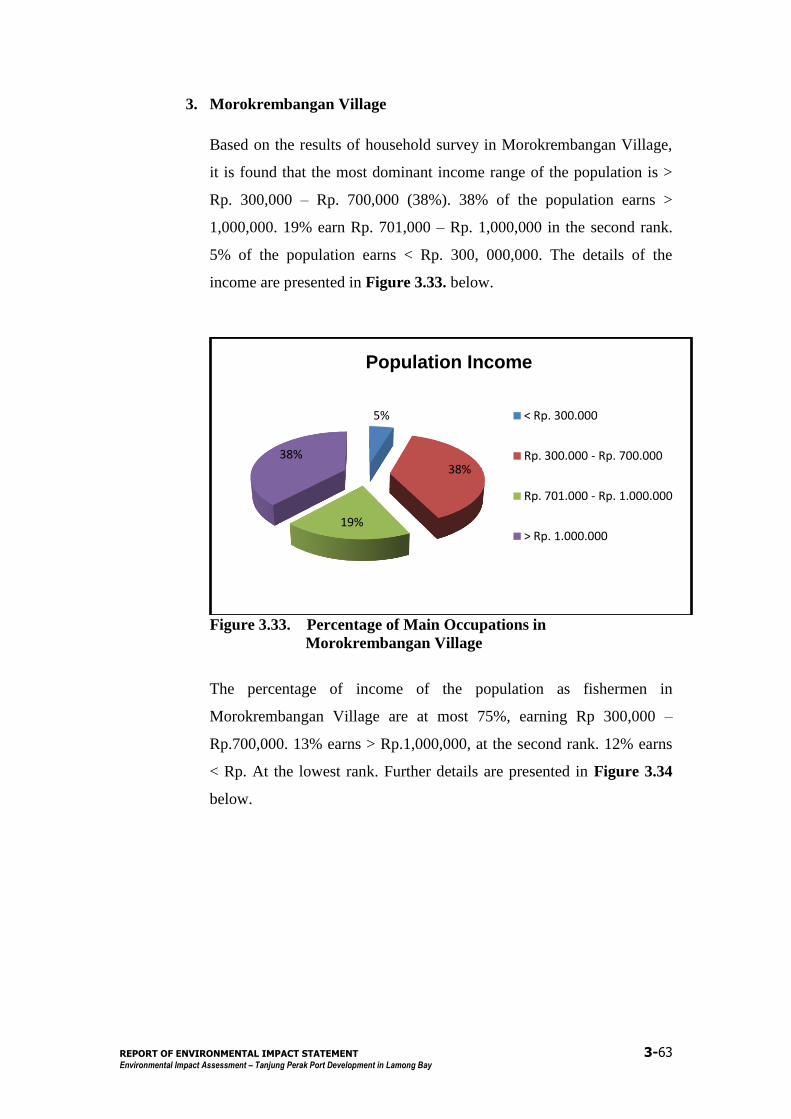
REPORT OF ENVIRONMENTAL IMPACT STATEMENT 3-63
Environmental Impact Assessment – Tanjung Perak Port Development in Lamong Bay
3. Morokrembangan Village
Based on the results of household survey in Morokrembangan Village,
it is found that the most dominant income range of the population is >
Rp. 300,000 – Rp. 700,000 (38%). 38% of the population earns >
1,000,000. 19% earn Rp. 701,000 – Rp. 1,000,000 in the second rank.
5% of the population earns < Rp. 300, 000,000. The details of the
income are presented in Figure 3.33. below.
Figure 3.33. Percentage of Main Occupations in
Morokrembangan Village
The percentage of income of the population as fishermen in
Morokrembangan Village are at most 75%, earning Rp 300,000 –
Rp.700,000. 13% earns > Rp.1,000,000, at the second rank. 12% earns
< Rp. At the lowest rank. Further details are presented in Figure 3.34
below.
5%
38%
19%
38%
Penghasilan Penduduk
< Rp. 300.000
Rp. 300.000 - Rp. 700.000
Rp. 701.000 - Rp. 1.000.000
> Rp. 1.000.000
Population Income
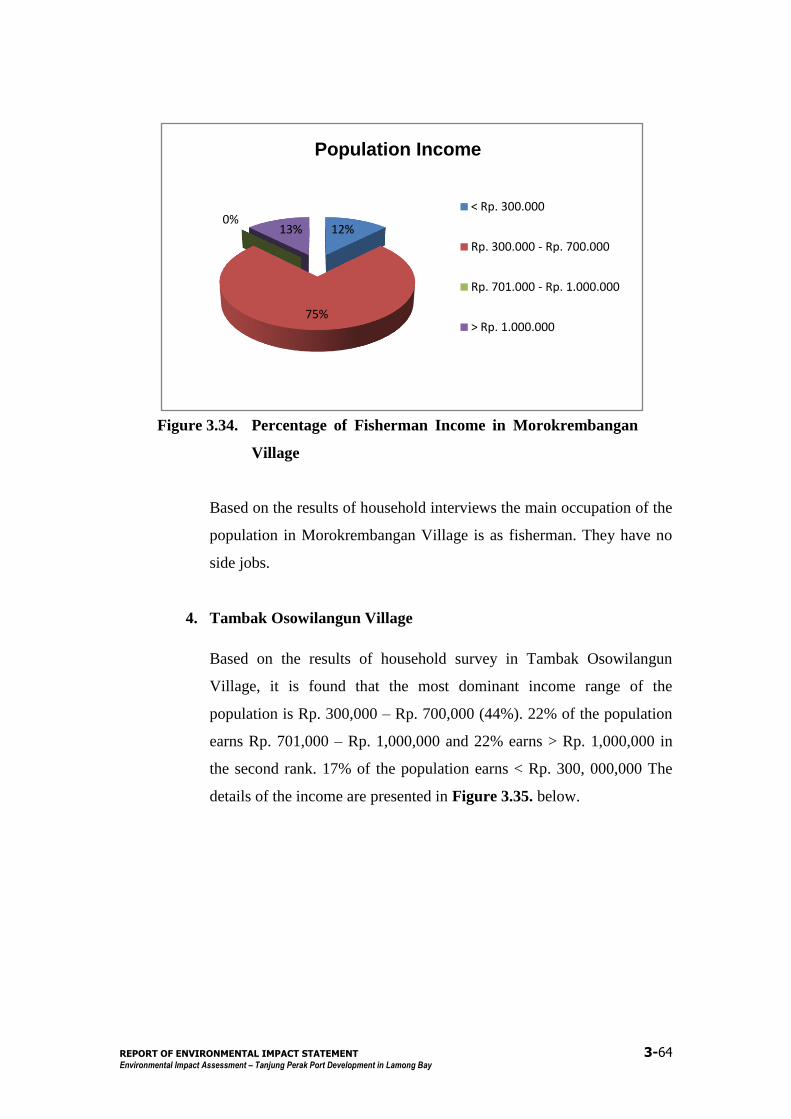
REPORT OF ENVIRONMENTAL IMPACT STATEMENT 3-64
Environmental Impact Assessment – Tanjung Perak Port Development in Lamong Bay
Figure 3.34. Percentage of Fisherman Income in Morokrembangan
Village
Based on the results of household interviews the main occupation of the
population in Morokrembangan Village is as fisherman. They have no
side jobs.
4. Tambak Osowilangun Village
Based on the results of household survey in Tambak Osowilangun
Village, it is found that the most dominant income range of the
population is Rp. 300,000 – Rp. 700,000 (44%). 22% of the population
earns Rp. 701,000 – Rp. 1,000,000 and 22% earns > Rp. 1,000,000 in
the second rank. 17% of the population earns < Rp. 300, 000,000 The
details of the income are presented in Figure 3.35. below.
12%
75%
0%13%
Penghasilan Nelayan
< Rp. 300.000
Rp. 300.000 - Rp. 700.000
Rp. 701.000 - Rp. 1.000.000
> Rp. 1.000.000
Population Income
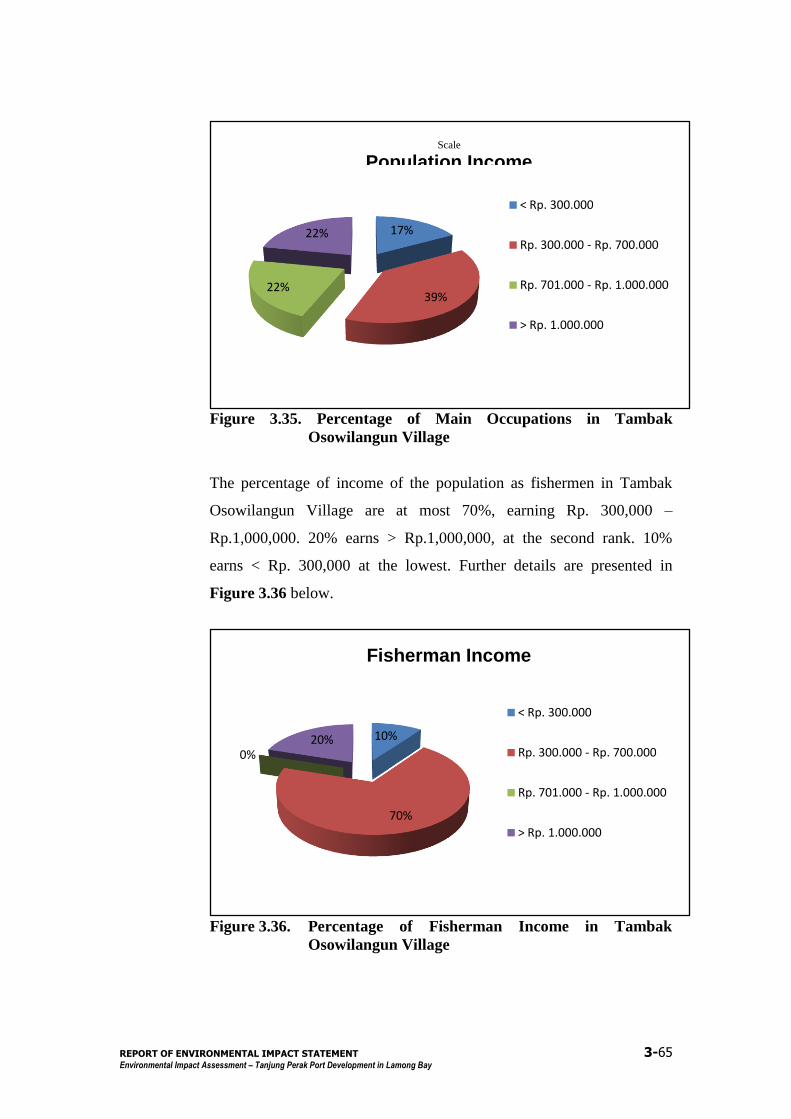
REPORT OF ENVIRONMENTAL IMPACT STATEMENT 3-65
Environmental Impact Assessment – Tanjung Perak Port Development in Lamong Bay
Figure 3.35. Percentage of Main Occupations in Tambak
Osowilangun Village
The percentage of income of the population as fishermen in Tambak
Osowilangun Village are at most 70%, earning Rp. 300,000 –
Rp.1,000,000. 20% earns > Rp.1,000,000, at the second rank. 10%
earns < Rp. 300,000 at the lowest. Further details are presented in
Figure 3.36 below.
Figure 3.36. Percentage of Fisherman Income in Tambak
Osowilangun Village
17%
39%22%
22%
Penghasilan Penduduk
< Rp. 300.000
Rp. 300.000 - Rp. 700.000
Rp. 701.000 - Rp. 1.000.000
> Rp. 1.000.000
10%
70%
0%20%
Penghasilan Nelayan
< Rp. 300.000
Rp. 300.000 - Rp. 700.000
Rp. 701.000 - Rp. 1.000.000
> Rp. 1.000.000
Fisherman Income
Scale
Population Income
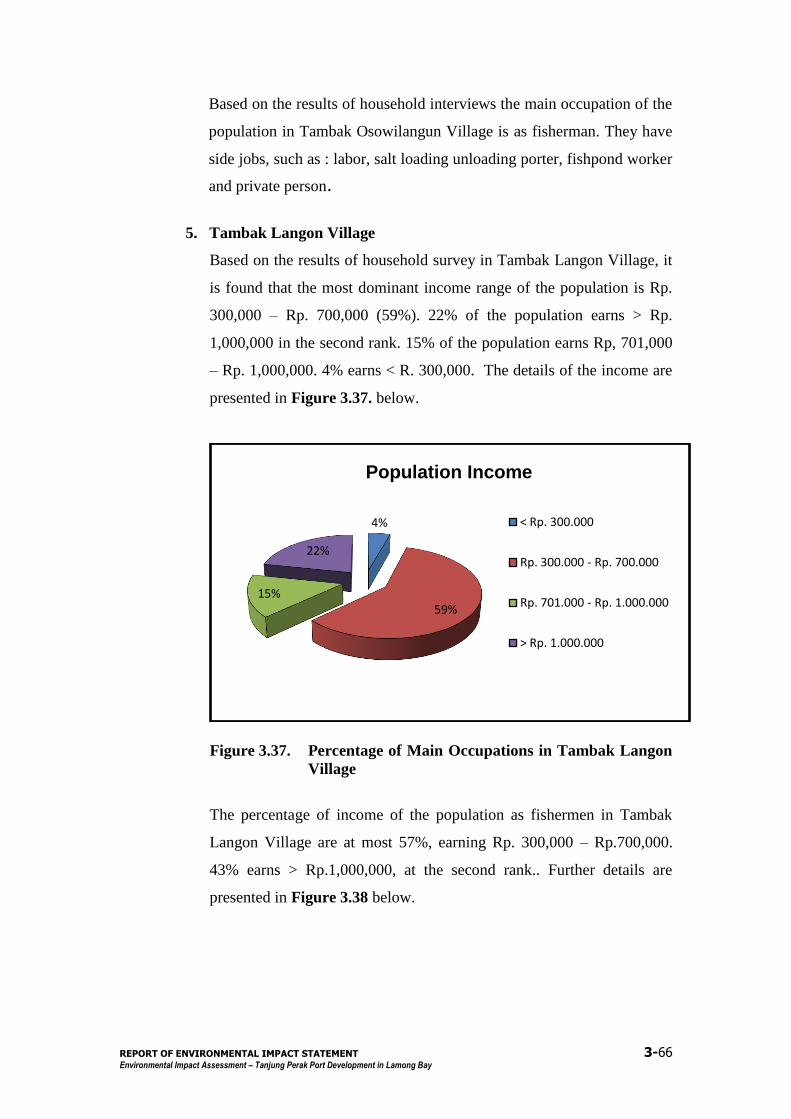
REPORT OF ENVIRONMENTAL IMPACT STATEMENT 3-66
Environmental Impact Assessment – Tanjung Perak Port Development in Lamong Bay
Based on the results of household interviews the main occupation of the
population in Tambak Osowilangun Village is as fisherman. They have
side jobs, such as : labor, salt loading unloading porter, fishpond worker
and private person.
5. Tambak Langon Village
Based on the results of household survey in Tambak Langon Village, it
is found that the most dominant income range of the population is Rp.
300,000 – Rp. 700,000 (59%). 22% of the population earns > Rp.
1,000,000 in the second rank. 15% of the population earns Rp, 701,000
– Rp. 1,000,000. 4% earns < R. 300,000. The details of the income are
presented in Figure 3.37. below.
Figure 3.37. Percentage of Main Occupations in Tambak Langon
Village
The percentage of income of the population as fishermen in Tambak
Langon Village are at most 57%, earning Rp. 300,000 – Rp.700,000.
43% earns > Rp.1,000,000, at the second rank.. Further details are
presented in Figure 3.38 below.
4%
59%15%
22%
Penghasilan Penduduk
< Rp. 300.000
Rp. 300.000 - Rp. 700.000
Rp. 701.000 - Rp. 1.000.000
> Rp. 1.000.000
Population Income
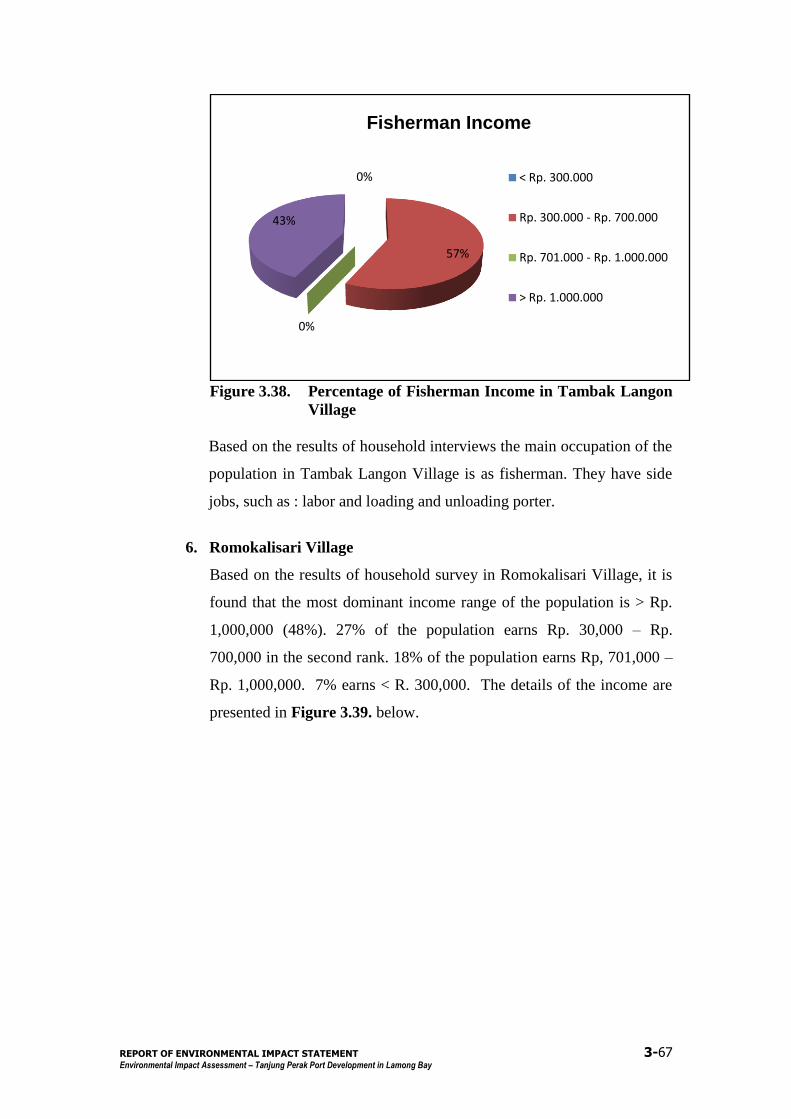
REPORT OF ENVIRONMENTAL IMPACT STATEMENT 3-67
Environmental Impact Assessment – Tanjung Perak Port Development in Lamong Bay
Figure 3.38. Percentage of Fisherman Income in Tambak Langon
Village
Based on the results of household interviews the main occupation of the
population in Tambak Langon Village is as fisherman. They have side
jobs, such as : labor and loading and unloading porter.
6. Romokalisari Village
Based on the results of household survey in Romokalisari Village, it is
found that the most dominant income range of the population is > Rp.
1,000,000 (48%). 27% of the population earns Rp. 30,000 – Rp.
700,000 in the second rank. 18% of the population earns Rp, 701,000 –
Rp. 1,000,000. 7% earns < R. 300,000. The details of the income are
presented in Figure 3.39. below.
0%
57%
0%
43%
Penghasilan Nelayan
< Rp. 300.000
Rp. 300.000 - Rp. 700.000
Rp. 701.000 - Rp. 1.000.000
> Rp. 1.000.000
Fisherman Income
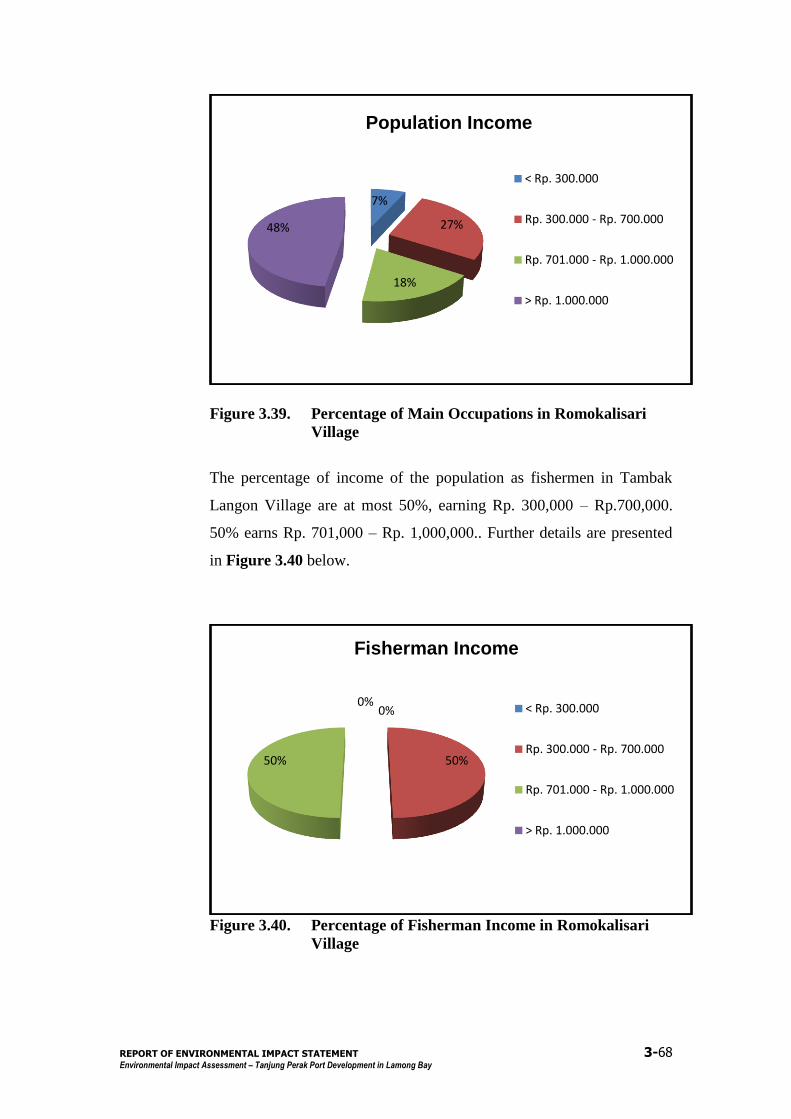
REPORT OF ENVIRONMENTAL IMPACT STATEMENT 3-68
Environmental Impact Assessment – Tanjung Perak Port Development in Lamong Bay
Figure 3.39. Percentage of Main Occupations in Romokalisari
Village
The percentage of income of the population as fishermen in Tambak
Langon Village are at most 50%, earning Rp. 300,000 – Rp.700,000.
50% earns Rp. 701,000 – Rp. 1,000,000.. Further details are presented
in Figure 3.40 below.
Figure 3.40. Percentage of Fisherman Income in Romokalisari
Village
7%
27%
18%
48%
Penghasilan Penduduk
< Rp. 300.000
Rp. 300.000 - Rp. 700.000
Rp. 701.000 - Rp. 1.000.000
> Rp. 1.000.000
0%
50%50%
0%
Penghasilan Nelayan
< Rp. 300.000
Rp. 300.000 - Rp. 700.000
Rp. 701.000 - Rp. 1.000.000
> Rp. 1.000.000
Population Income
Fisherman Income
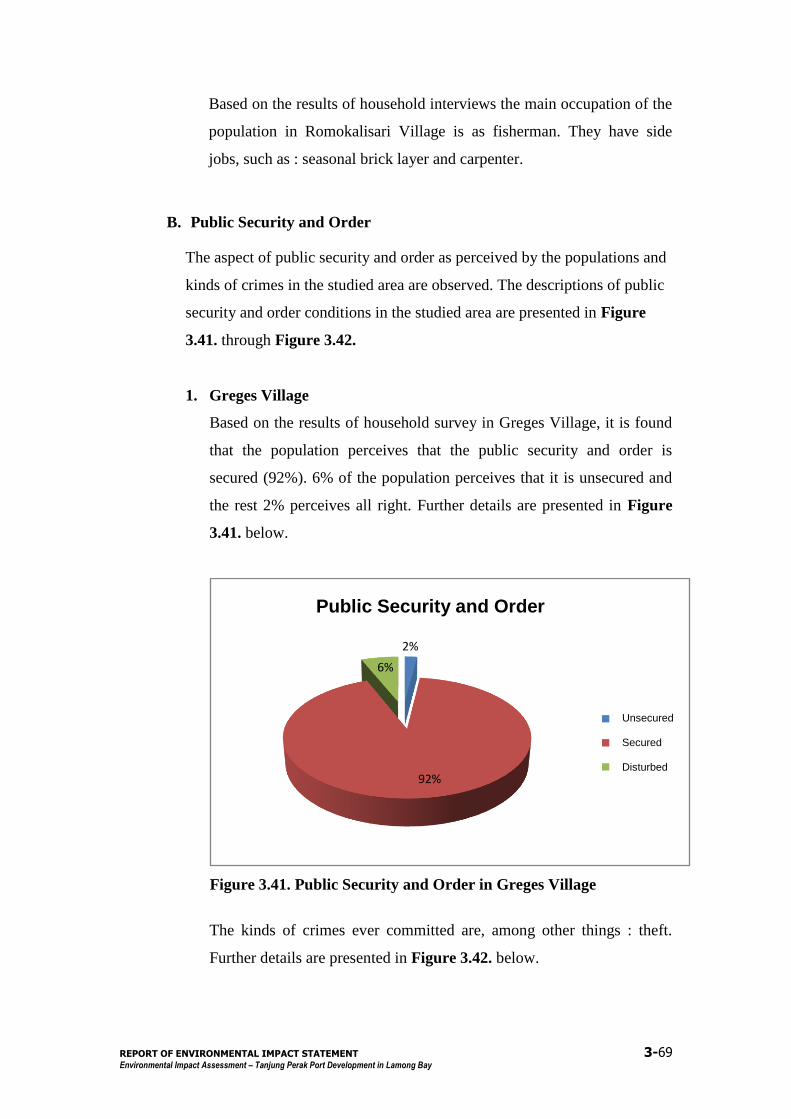
REPORT OF ENVIRONMENTAL IMPACT STATEMENT 3-69
Environmental Impact Assessment – Tanjung Perak Port Development in Lamong Bay
Based on the results of household interviews the main occupation of the
population in Romokalisari Village is as fisherman. They have side
jobs, such as : seasonal brick layer and carpenter.
B. Public Security and Order
The aspect of public security and order as perceived by the populations and
kinds of crimes in the studied area are observed. The descriptions of public
security and order conditions in the studied area are presented in Figure
3.41. through Figure 3.42.
1. Greges Village
Based on the results of household survey in Greges Village, it is found
that the population perceives that the public security and order is
secured (92%). 6% of the population perceives that it is unsecured and
the rest 2% perceives all right. Further details are presented in Figure
3.41. below.
Figure 3.41. Public Security and Order in Greges Village
The kinds of crimes ever committed are, among other things : theft.
Further details are presented in Figure 3.42. below.
2%
92%
6%
Kondisi Keamanan
Tidak Aman
Aman
Terganggu
Public Security and Order
Unsecured Secured Disturbed
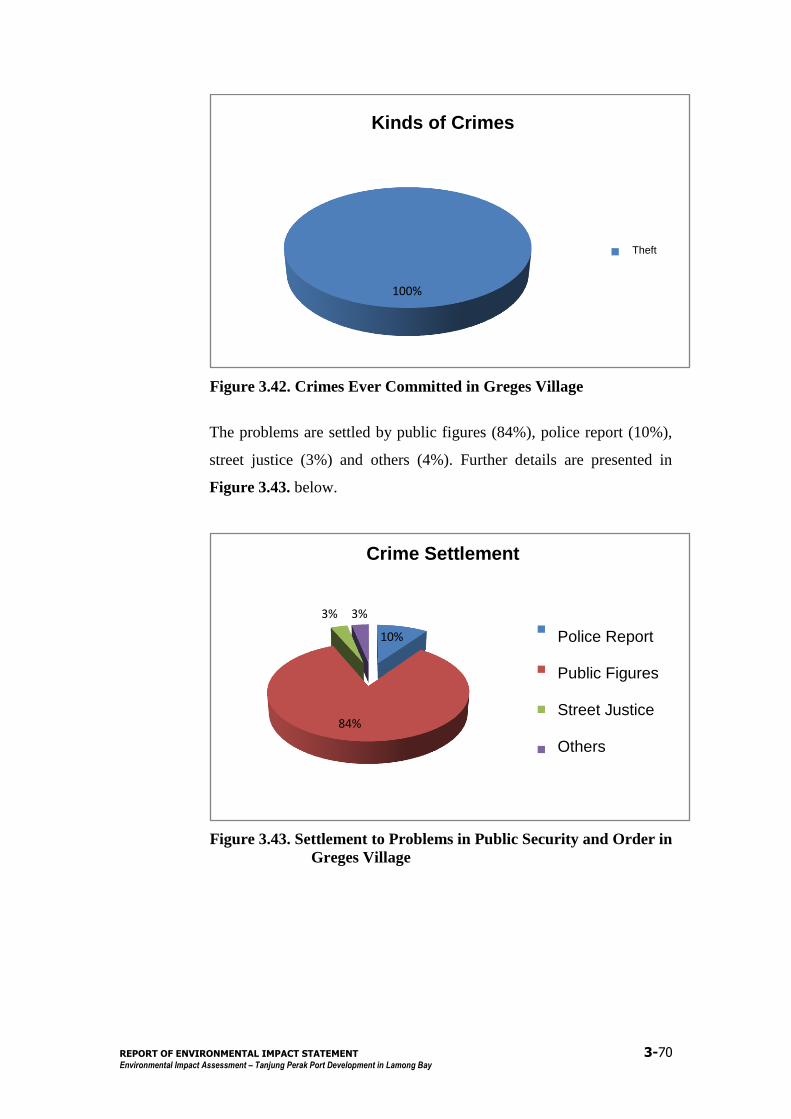
REPORT OF ENVIRONMENTAL IMPACT STATEMENT 3-70
Environmental Impact Assessment – Tanjung Perak Port Development in Lamong Bay
Figure 3.42. Crimes Ever Committed in Greges Village
The problems are settled by public figures (84%), police report (10%),
street justice (3%) and others (4%). Further details are presented in
Figure 3.43. below.
Figure 3.43. Settlement to Problems in Public Security and Order in
Greges Village
100%
Bentuk Kejahatan
Pencurian
10%
84%
3% 3%
Cara Penyelesaian
Lapor Polisi
Diselesaikan oleh tokoh masyarakat
Dihakimi sendiri
Lainnya
Kinds of Crimes
Theft
Crime Settlement
Police Report Public Figures Street Justice Others
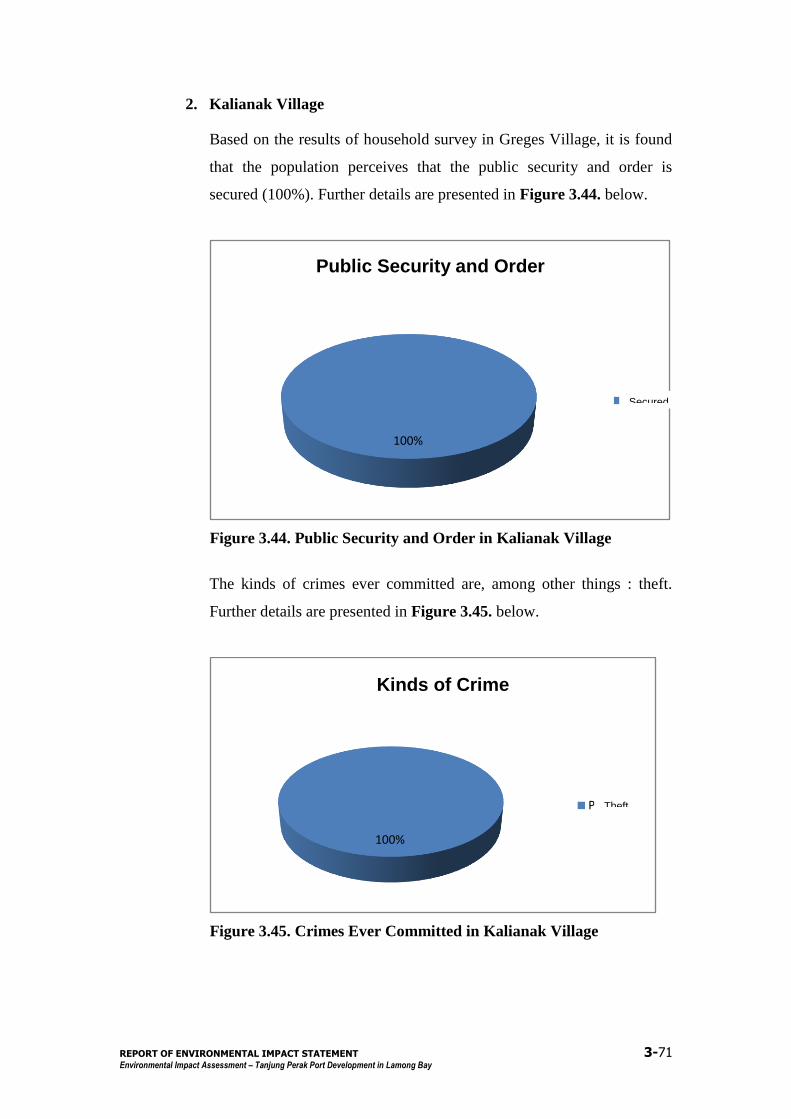
REPORT OF ENVIRONMENTAL IMPACT STATEMENT 3-71
Environmental Impact Assessment – Tanjung Perak Port Development in Lamong Bay
2. Kalianak Village
Based on the results of household survey in Greges Village, it is found
that the population perceives that the public security and order is
secured (100%). Further details are presented in Figure 3.44. below.
Figure 3.44. Public Security and Order in Kalianak Village
The kinds of crimes ever committed are, among other things : theft.
Further details are presented in Figure 3.45. below.
Figure 3.45. Crimes Ever Committed in Kalianak Village
100%
Kondisi Keamanan
Aman
100%
Bentuk Kejahatan
Pencurian
Public Security and Order
Secured
Theft
Kinds of Crime
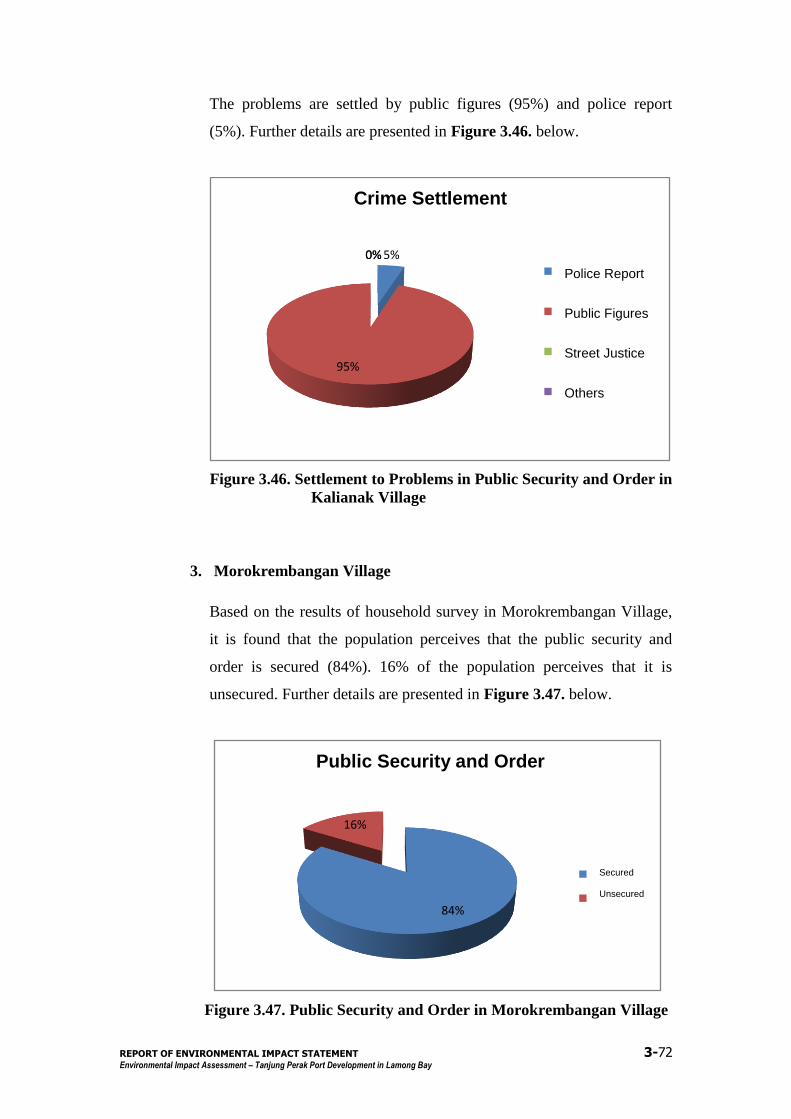
REPORT OF ENVIRONMENTAL IMPACT STATEMENT 3-72
Environmental Impact Assessment – Tanjung Perak Port Development in Lamong Bay
The problems are settled by public figures (95%) and police report
(5%). Further details are presented in Figure 3.46. below.
Figure 3.46. Settlement to Problems in Public Security and Order in
Kalianak Village
3. Morokrembangan Village
Based on the results of household survey in Morokrembangan Village,
it is found that the population perceives that the public security and
order is secured (84%). 16% of the population perceives that it is
unsecured. Further details are presented in Figure 3.47. below.
Figure 3.47. Public Security and Order in Morokrembangan Village
5%
95%
0%0%
Cara Penyelesaian
Lapor Polisi
Diselesaikan tokoh masyarakat
Dihakimi sendiri
Lainnya
84%
16%
Kondisi Keamanan
Aman
Terganggu
Police Report
Public Figures
Street Justice
Others
Crime Settlement
Public Security and Order
Secured Unsecured
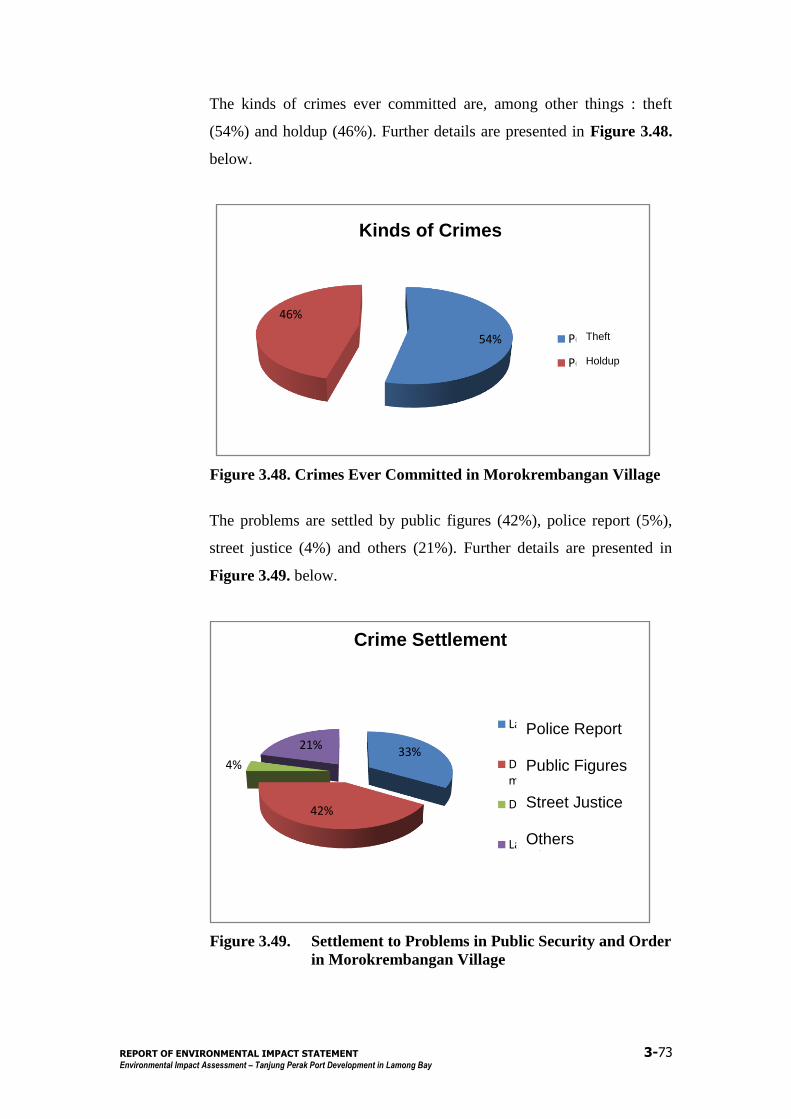
REPORT OF ENVIRONMENTAL IMPACT STATEMENT 3-73
Environmental Impact Assessment – Tanjung Perak Port Development in Lamong Bay
The kinds of crimes ever committed are, among other things : theft
(54%) and holdup (46%). Further details are presented in Figure 3.48.
below.
Figure 3.48. Crimes Ever Committed in Morokrembangan Village
The problems are settled by public figures (42%), police report (5%),
street justice (4%) and others (21%). Further details are presented in
Figure 3.49. below.
Figure 3.49. Settlement to Problems in Public Security and Order
in Morokrembangan Village
54%
46%
Bentuk Kejahatan
Pencurian
Penodongan
33%
42%
4%
21%
Cara Penyelesaian
Lapor Polisi
Diselesaikan oleh tokoh masyarakat
Dihakimi sendiri
Lainnya
Kinds of Crimes
Theft Holdup
Police Report Public Figures Street Justice Others
Crime Settlement
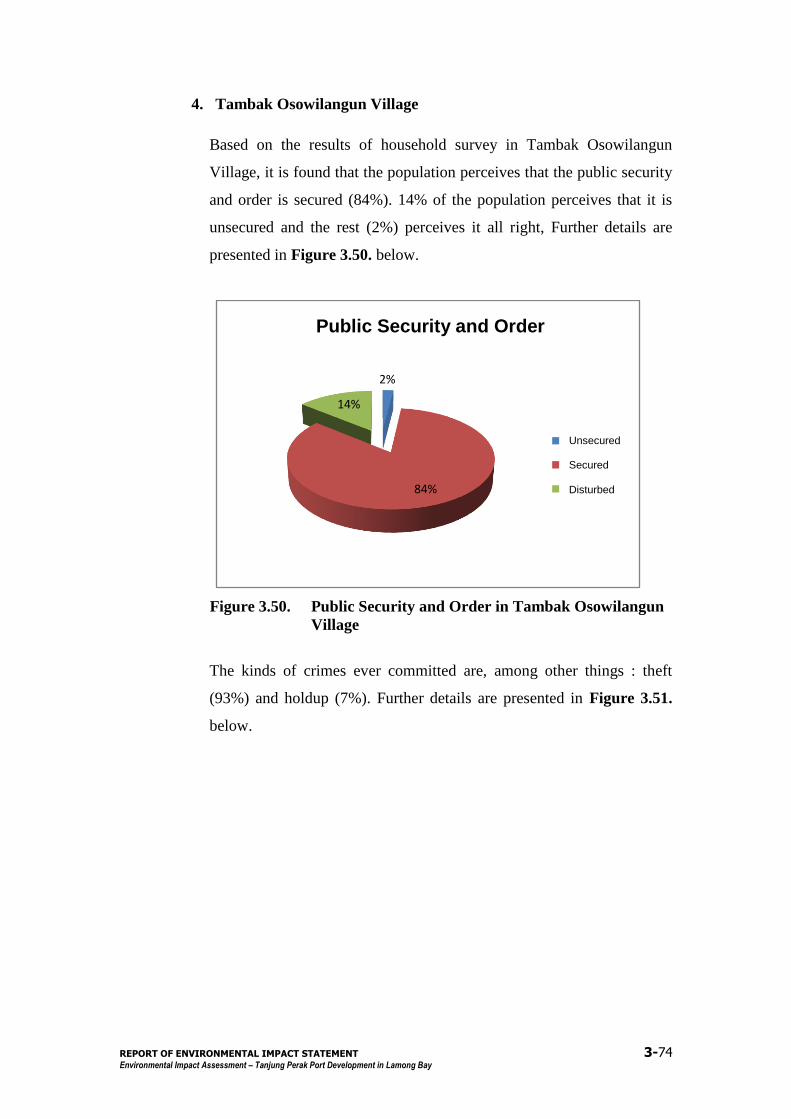
REPORT OF ENVIRONMENTAL IMPACT STATEMENT 3-74
Environmental Impact Assessment – Tanjung Perak Port Development in Lamong Bay
4. Tambak Osowilangun Village
Based on the results of household survey in Tambak Osowilangun
Village, it is found that the population perceives that the public security
and order is secured (84%). 14% of the population perceives that it is
unsecured and the rest (2%) perceives it all right, Further details are
presented in Figure 3.50. below.
Figure 3.50. Public Security and Order in Tambak Osowilangun
Village
The kinds of crimes ever committed are, among other things : theft
(93%) and holdup (7%). Further details are presented in Figure 3.51.
below.
2%
84%
14%
Kondisi Keamanan
Tidak Aman
Aman
Terganggu
Unsecured Secured Disturbed
Public Security and Order

REPORT OF ENVIRONMENTAL IMPACT STATEMENT 3-75
Environmental Impact Assessment – Tanjung Perak Port Development in Lamong Bay
Figure 3.51. Crimes Ever Committed in Tambak Osowilangun
Village
The problems are settled by public figures (72%), police report (24%),
and street justice (4%). Further details are presented in Figure 3.52.
below.
Figure 3.52. Settlement to Problems in Public Security and Order
in Tambak Osowilangun Village
5. Tambak Langon Village
Based on the results of household survey in Tambak Langon Village, it
is found that the population perceives that the public security and order
93%
7%
Bentuk Kejahatan
Pencurian
Penodongan
24%
72%
4%
Cara Penyelesaian
Lapor Polisi
Diselesaikan oleh tokoh masyarakat
Dihakimi sendiri
Kinds of Crimes
Theft Holdup
Police Report Public Figures Street Justice
Crime Settlement
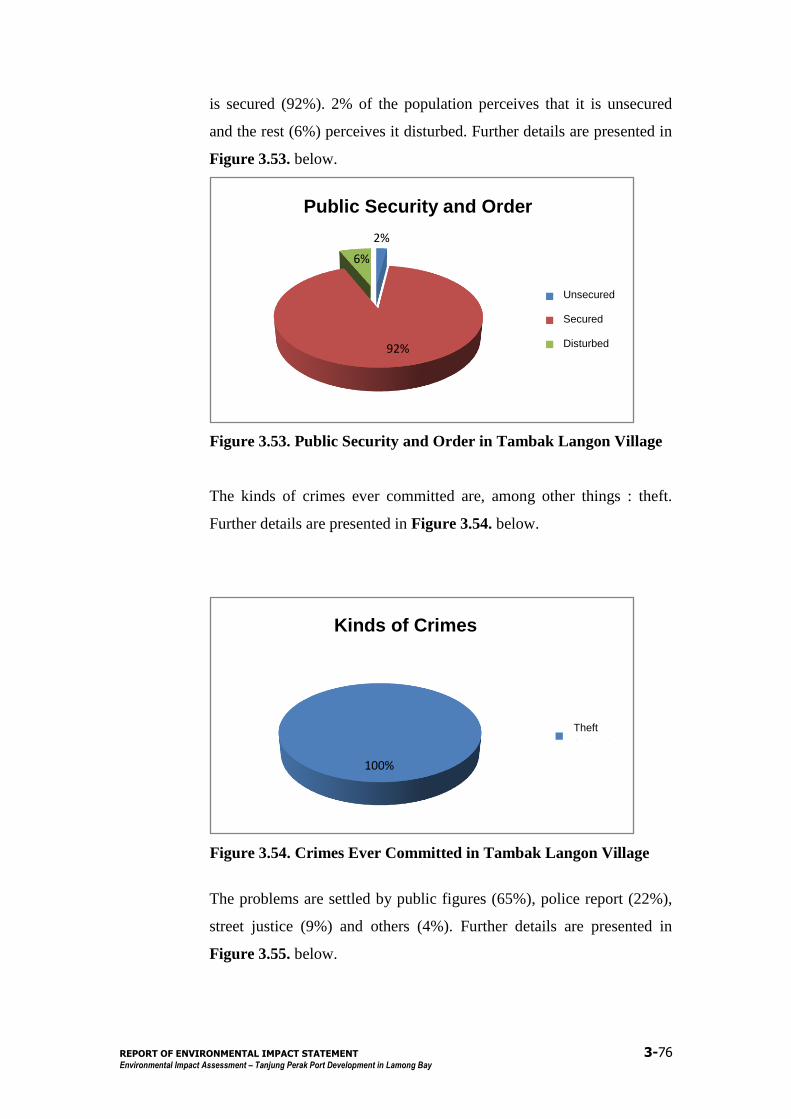
REPORT OF ENVIRONMENTAL IMPACT STATEMENT 3-76
Environmental Impact Assessment – Tanjung Perak Port Development in Lamong Bay
is secured (92%). 2% of the population perceives that it is unsecured
and the rest (6%) perceives it disturbed. Further details are presented in
Figure 3.53. below.
Figure 3.53. Public Security and Order in Tambak Langon Village
The kinds of crimes ever committed are, among other things : theft.
Further details are presented in Figure 3.54. below.
Figure 3.54. Crimes Ever Committed in Tambak Langon Village
The problems are settled by public figures (65%), police report (22%),
street justice (9%) and others (4%). Further details are presented in
Figure 3.55. below.
2%
92%
6%
Kondisi Keamanan
Tidak Aman
Aman
Terganggu
100%
Bentuk Kejahatan
Pencurian
Public Security and Order
Unsecured Secured Disturbed
Kinds of Crimes
Theft
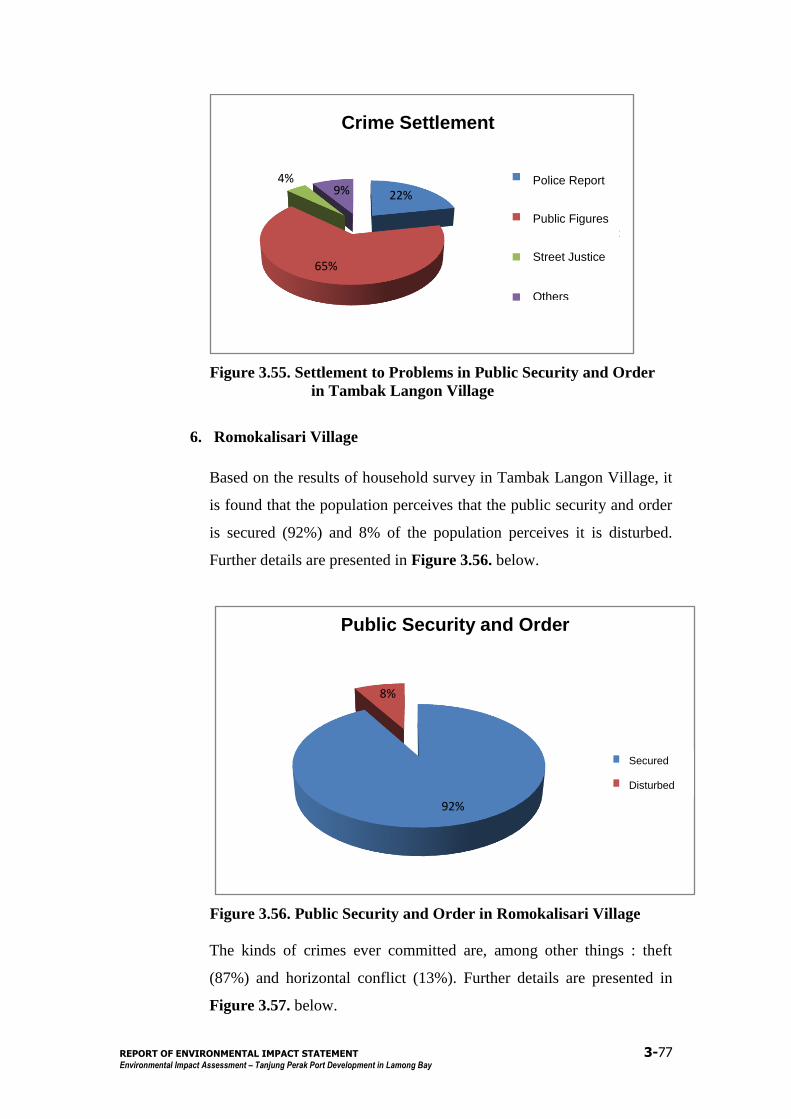
REPORT OF ENVIRONMENTAL IMPACT STATEMENT 3-77
Environmental Impact Assessment – Tanjung Perak Port Development in Lamong Bay
Figure 3.55. Settlement to Problems in Public Security and Order
in Tambak Langon Village
6. Romokalisari Village
Based on the results of household survey in Tambak Langon Village, it
is found that the population perceives that the public security and order
is secured (92%) and 8% of the population perceives it is disturbed.
Further details are presented in Figure 3.56. below.
Figure 3.56. Public Security and Order in Romokalisari Village
The kinds of crimes ever committed are, among other things : theft
(87%) and horizontal conflict (13%). Further details are presented in
Figure 3.57. below.
22%
65%
4%9%
Cara Penyelesaian
Lapor Polisi
Diselesaikan oleh tokoh masyarakat
Dihakimi sendiri
Lainnya
92%
8%
Kondisi Keamanan
Aman
Terganggu
Police Report
Public Figures
Street Justice
Others
Crime Settlement
Public Security and Order
Secured Disturbed
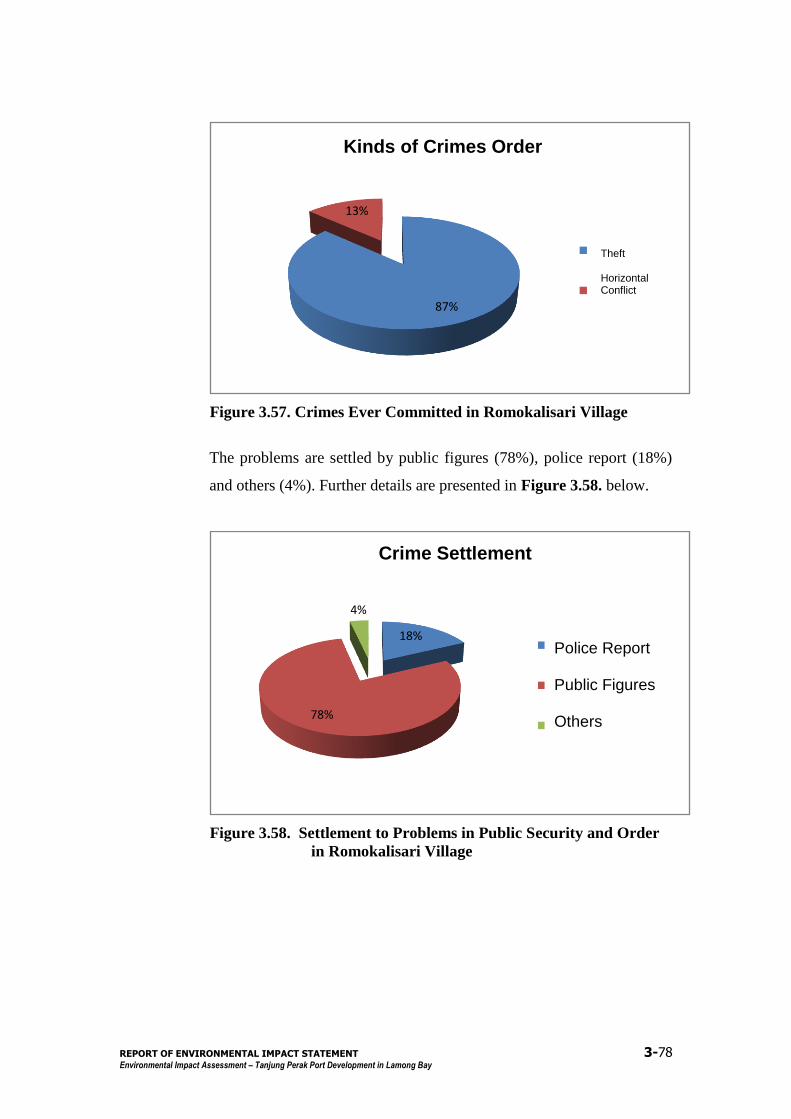
REPORT OF ENVIRONMENTAL IMPACT STATEMENT 3-78
Environmental Impact Assessment – Tanjung Perak Port Development in Lamong Bay
Figure 3.57. Crimes Ever Committed in Romokalisari Village
The problems are settled by public figures (78%), police report (18%)
and others (4%). Further details are presented in Figure 3.58. below.
Figure 3.58. Settlement to Problems in Public Security and Order
in Romokalisari Village
87%
13%
Bentuk Kejahatan
Pencurian
Pertikaian antar penduduk
18%
78%
4%
Cara Penyelesaian
Lapor Polisi
Diselesaikan oleh tokoh masyarakat
Lainnya
Kinds of Crimes Order
Theft Horizontal Conflict
Crime Settlement
Police Report Public Figures Others
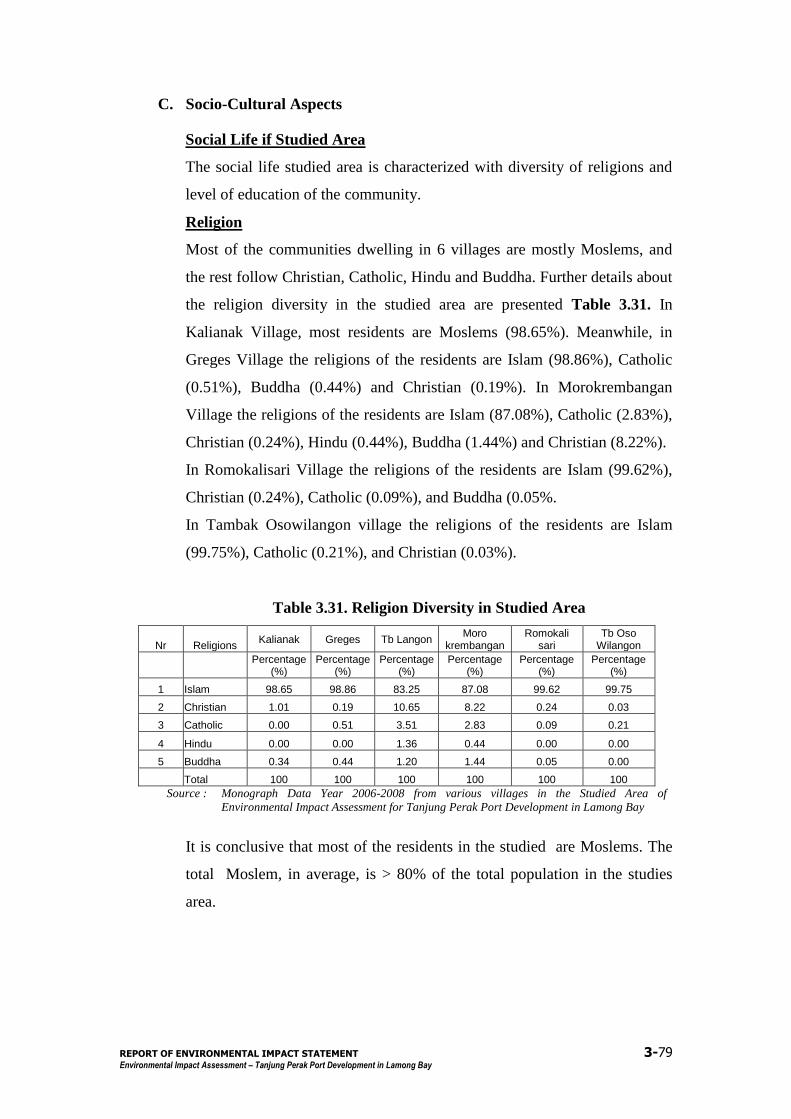
REPORT OF ENVIRONMENTAL IMPACT STATEMENT 3-79
Environmental Impact Assessment – Tanjung Perak Port Development in Lamong Bay
C. Socio-Cultural Aspects
Social Life if Studied Area
The social life studied area is characterized with diversity of religions and
level of education of the community.
Religion
Most of the communities dwelling in 6 villages are mostly Moslems, and
the rest follow Christian, Catholic, Hindu and Buddha. Further details about
the religion diversity in the studied area are presented Table 3.31. In
Kalianak Village, most residents are Moslems (98.65%). Meanwhile, in
Greges Village the religions of the residents are Islam (98.86%), Catholic
(0.51%), Buddha (0.44%) and Christian (0.19%). In Morokrembangan
Village the religions of the residents are Islam (87.08%), Catholic (2.83%),
Christian (0.24%), Hindu (0.44%), Buddha (1.44%) and Christian (8.22%).
In Romokalisari Village the religions of the residents are Islam (99.62%),
Christian (0.24%), Catholic (0.09%), and Buddha (0.05%.
In Tambak Osowilangon village the religions of the residents are Islam
(99.75%), Catholic (0.21%), and Christian (0.03%).
Table 3.31. Religion Diversity in Studied Area
Nr Religions Kalianak Greges Tb Langon
Moro krembangan
Romokali sari
Tb Oso Wilangon
Percentage
(%) Percentage
(%) Percentage
(%) Percentage
(%) Percentage
(%) Percentage
(%)
1 Islam 98.65 98.86 83.25 87.08 99.62 99.75
2 Christian 1.01 0.19 10.65 8.22 0.24 0.03
3 Catholic 0.00 0.51 3.51 2.83 0.09 0.21
4 Hindu 0.00 0.00 1.36 0.44 0.00 0.00
5 Buddha 0.34 0.44 1.20 1.44 0.05 0.00
Total 100 100 100 100 100 100
Source : Monograph Data Year 2006-2008 from various villages in the Studied Area of
Environmental Impact Assessment for Tanjung Perak Port Development in Lamong Bay
It is conclusive that most of the residents in the studied are Moslems. The
total Moslem, in average, is > 80% of the total population in the studies
area.
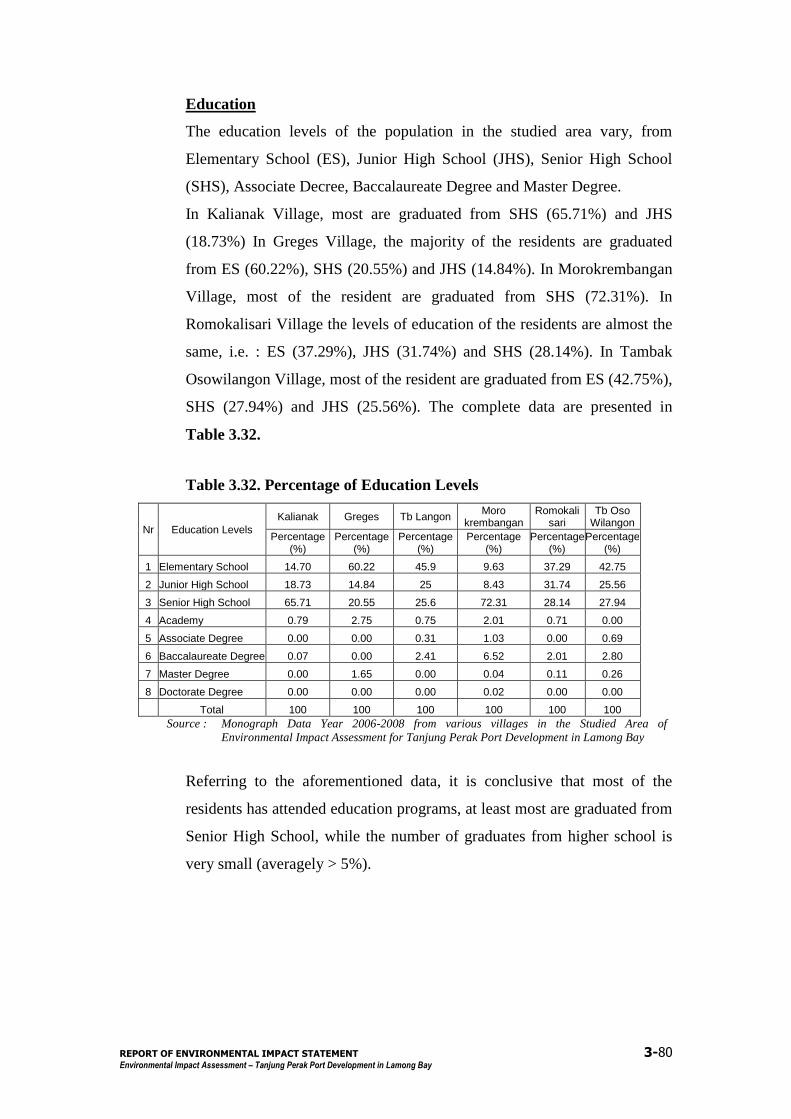
REPORT OF ENVIRONMENTAL IMPACT STATEMENT 3-80
Environmental Impact Assessment – Tanjung Perak Port Development in Lamong Bay
Education
The education levels of the population in the studied area vary, from
Elementary School (ES), Junior High School (JHS), Senior High School
(SHS), Associate Decree, Baccalaureate Degree and Master Degree.
In Kalianak Village, most are graduated from SHS (65.71%) and JHS
(18.73%) In Greges Village, the majority of the residents are graduated
from ES (60.22%), SHS (20.55%) and JHS (14.84%). In Morokrembangan
Village, most of the resident are graduated from SHS (72.31%). In
Romokalisari Village the levels of education of the residents are almost the
same, i.e. : ES (37.29%), JHS (31.74%) and SHS (28.14%). In Tambak
Osowilangon Village, most of the resident are graduated from ES (42.75%),
SHS (27.94%) and JHS (25.56%). The complete data are presented in
Table 3.32.
Table 3.32. Percentage of Education Levels
Nr Education Levels
Kalianak Greges Tb Langon Moro
krembangan Romokali
sari Tb Oso
Wilangon
Percentage (%)
Percentage (%)
Percentage (%)
Percentage (%)
Percentage (%)
Percentage (%)
1 Elementary School 14.70 60.22 45.9 9.63 37.29 42.75
2 Junior High School 18.73 14.84 25 8.43 31.74 25.56
3 Senior High School 65.71 20.55 25.6 72.31 28.14 27.94
4 Academy 0.79 2.75 0.75 2.01 0.71 0.00
5 Associate Degree 0.00 0.00 0.31 1.03 0.00 0.69
6 Baccalaureate Degree 0.07 0.00 2.41 6.52 2.01 2.80
7 Master Degree 0.00 1.65 0.00 0.04 0.11 0.26
8 Doctorate Degree 0.00 0.00 0.00 0.02 0.00 0.00
Total 100 100 100 100 100 100
Source : Monograph Data Year 2006-2008 from various villages in the Studied Area of
Environmental Impact Assessment for Tanjung Perak Port Development in Lamong Bay
Referring to the aforementioned data, it is conclusive that most of the
residents has attended education programs, at least most are graduated from
Senior High School, while the number of graduates from higher school is
very small (averagely > 5%).
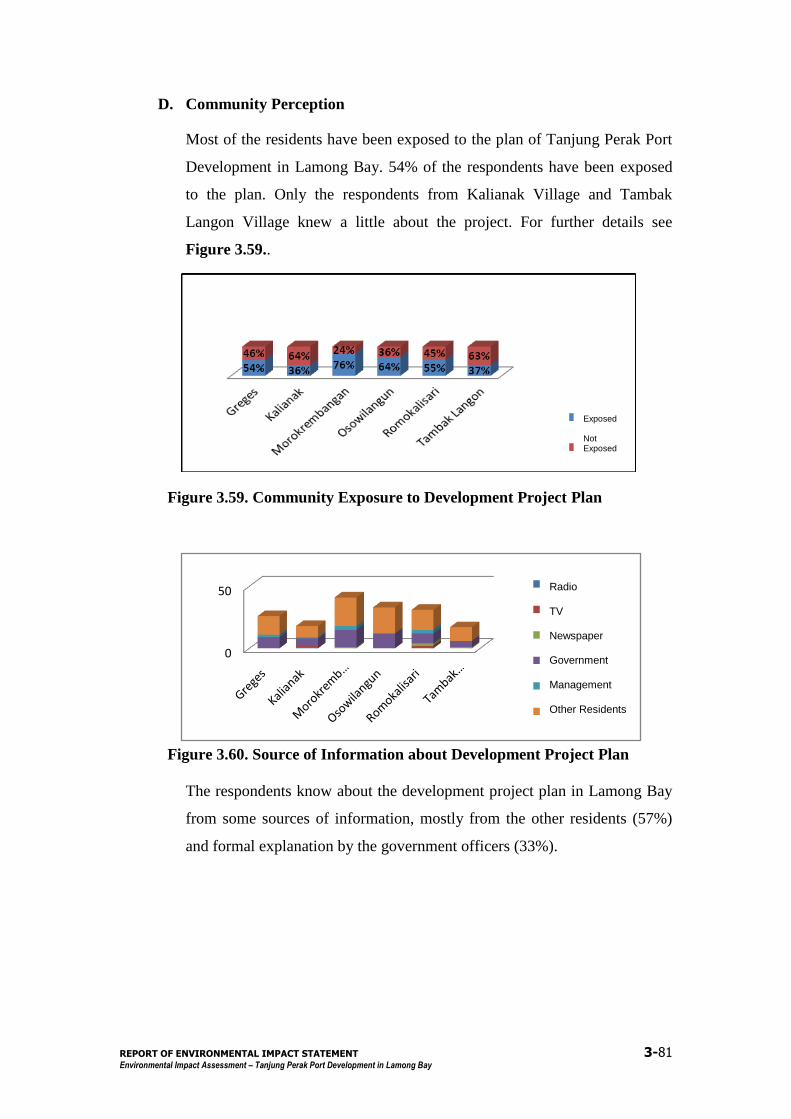
REPORT OF ENVIRONMENTAL IMPACT STATEMENT 3-81
Environmental Impact Assessment – Tanjung Perak Port Development in Lamong Bay
D. Community Perception
Most of the residents have been exposed to the plan of Tanjung Perak Port
Development in Lamong Bay. 54% of the respondents have been exposed
to the plan. Only the respondents from Kalianak Village and Tambak
Langon Village knew a little about the project. For further details see
Figure 3.59..
Figure 3.59. Community Exposure to Development Project Plan
Figure 3.60. Source of Information about Development Project Plan
The respondents know about the development project plan in Lamong Bay
from some sources of information, mostly from the other residents (57%)
and formal explanation by the government officers (33%).
0
50Radio
Televisi
Koran
Pemerintah
Pihak Proyek
Sesama Warga
Exposed Not Exposed
Radio TV Newspaper Government Management Other Residents
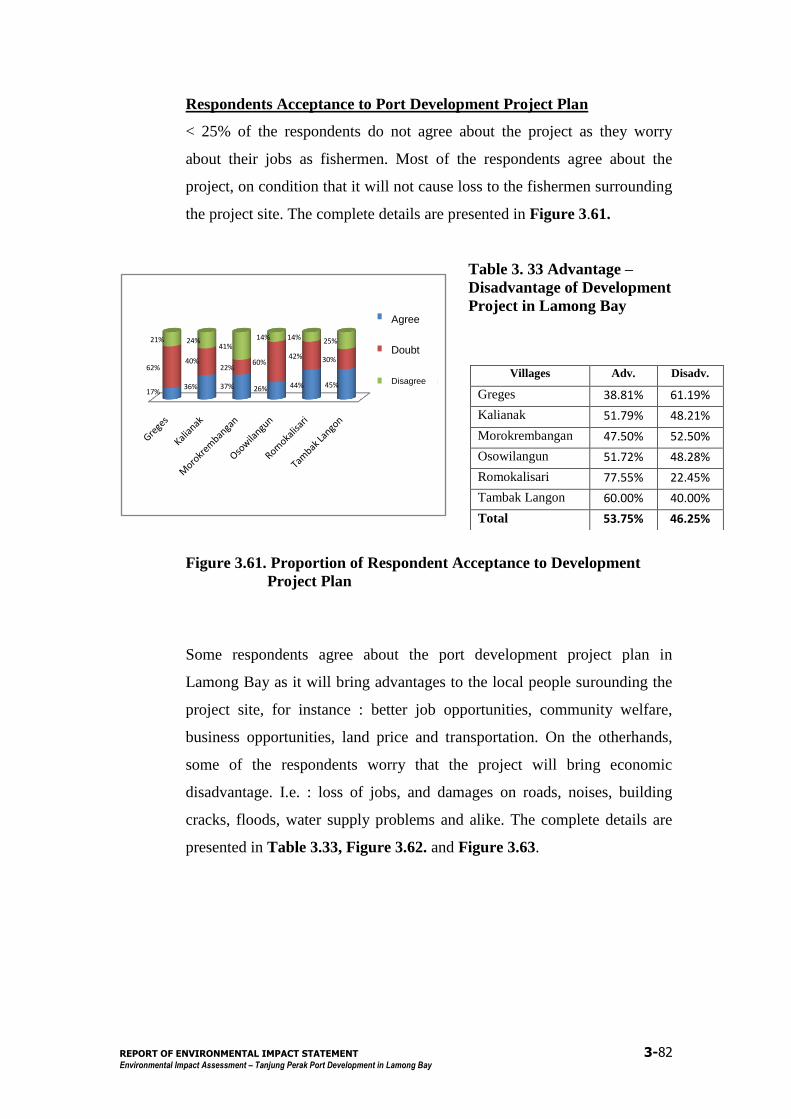
REPORT OF ENVIRONMENTAL IMPACT STATEMENT 3-82
Environmental Impact Assessment – Tanjung Perak Port Development in Lamong Bay
Respondents Acceptance to Port Development Project Plan
< 25% of the respondents do not agree about the project as they worry
about their jobs as fishermen. Most of the respondents agree about the
project, on condition that it will not cause loss to the fishermen surrounding
the project site. The complete details are presented in Figure 3.61.
Table 3. 33 Advantage –
Disadvantage of Development
Project in Lamong Bay
Figure 3.61. Proportion of Respondent Acceptance to Development
Project Plan
Some respondents agree about the port development project plan in
Lamong Bay as it will bring advantages to the local people surounding the
project site, for instance : better job opportunities, community welfare,
business opportunities, land price and transportation. On the otherhands,
some of the respondents worry that the project will bring economic
disadvantage. I.e. : loss of jobs, and damages on roads, noises, building
cracks, floods, water supply problems and alike. The complete details are
presented in Table 3.33, Figure 3.62. and Figure 3.63.
Villages Adv. Disadv.
Greges 38.81% 61.19%
Kalianak 51.79% 48.21%
Morokrembangan 47.50% 52.50%
Osowilangun 51.72% 48.28%
Romokalisari 77.55% 22.45%
Tambak Langon 60.00% 40.00%
Total 53.75% 46.25%
17%36% 37% 26% 44% 45%
62%40%
22%60%
42% 30%
21% 24%41%
14% 14% 25%
Setuju
Ragu-ragu
Tidak setuju
Agree
Doubt
Disagree
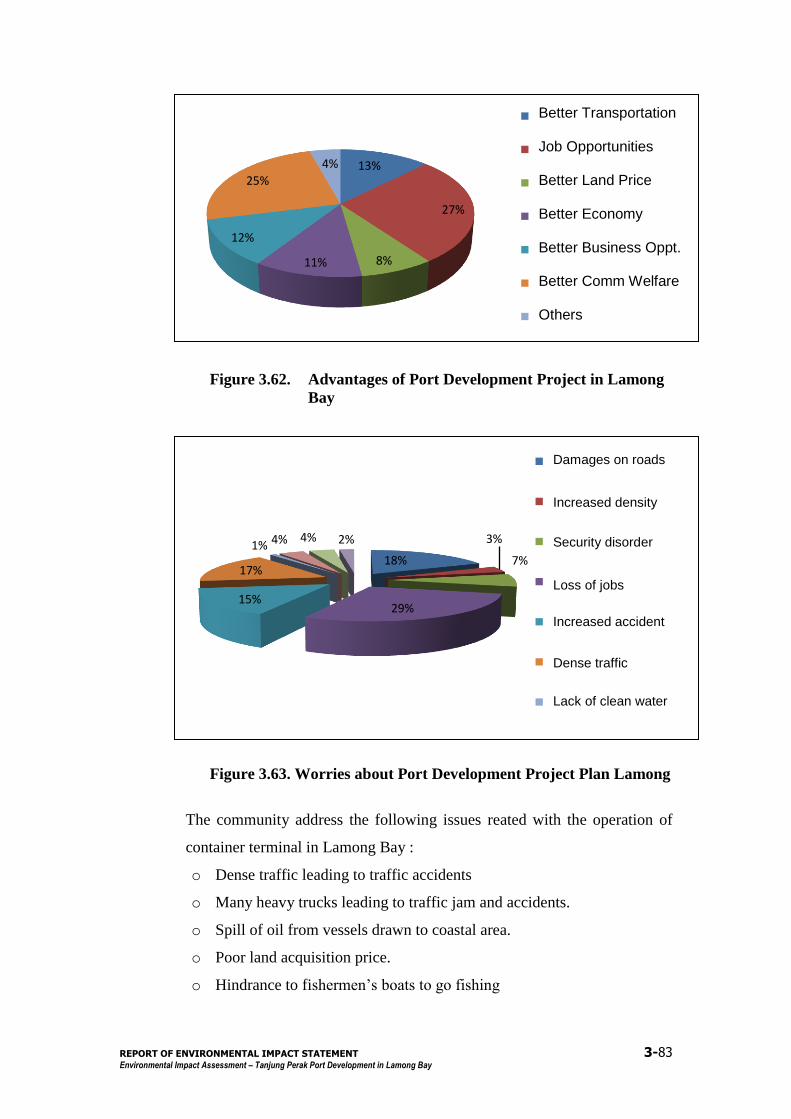
REPORT OF ENVIRONMENTAL IMPACT STATEMENT 3-83
Environmental Impact Assessment – Tanjung Perak Port Development in Lamong Bay
Figure 3.62. Advantages of Port Development Project in Lamong
Bay
Figure 3.63. Worries about Port Development Project Plan Lamong
The community address the following issues reated with the operation of
container terminal in Lamong Bay :
o Dense traffic leading to traffic accidents
o Many heavy trucks leading to traffic jam and accidents.
o Spill of oil from vessels drawn to coastal area.
o Poor land acquisition price.
o Hindrance to fishermen‟s boats to go fishing
13%
27%
8%11%
12%
25%
4%
transportasi lebih baik
kesempatan kerja
Menaikkan harga tanah
Menaikkan kegiatan ekonomi
Memperlancar usaha dagang
kesejahteraan masyarakat
lainnya
18%
3%
7%
29%15%
17%
1% 4% 4% 2%
Jalan rusak & berdebu
Menambah kepadatan
Mengganggu keamanan
kehilangan mata pencaharian
Kecelakaan meningkat
lalu-lintas padat
air bersih kurang
Better Transportation Job Opportunities Better Land Price Better Economy Better Business Oppt. Better Comm Welfare Others
Damages on roads
Increased density
Security disorder
Loss of jobs
Increased accident
Dense traffic
Lack of clean water

REPORT OF ENVIRONMENTAL IMPACT STATEMENT 3-84
Environmental Impact Assessment – Tanjung Perak Port Development in Lamong Bay
The imputs and recommendations given by the respondents in regard with
the development project plan in Lamong Bay are as follows :
1. Socialization about the port development project plan in Lamong Bay to
the community.
2. Priority to local people recruitment to partly cope with problems of
jobless people surrounding the project site.
3. Preventive measure pollution in the sea as it will lead to pollution in the
river and problems to fishermen‟s activities.
4. Socialization of Environmental Impact Assessment to fishermen before
commencing construction activities.
5. Road widening to anticipate traffic jam and street lighting.
6. No hindrance to fishermen‟s activities, especially during measurement
activities.
7. Provision of overhead crossing bridge.
8. No hindrance for fishermen to go fishing and sail under the connecting
bridge during high tide and project execution.
9. Compensation for fishpond owners whose fishponds are reclaimed. The
compensation rate is to be higher than the one for ordinary fishermen,
as they have exploited the fishponds for years.
10. Well considering and actively involving the local people. No
incompetent authorities in the port. Mutually beneficial to both the
community and government.

REPORT OF ENVIRONMENTAL IMPACT STATEMENT 3-85
Environmental Impact Assessment – Tanjung Perak Port Development in Lamong Bay
3.6. Community Health Aspects
Based on the results of interviews to 300 respondents in 6 villages in the
studies area , i.e. : Romokalisari Village, Tambak Osowilangon Village,
Tambak Langon Village, Greges Village, Kalianak Village dan
Morokrembangan Village in April 2008 in week 1 and week 2, it is found as
follows :
A. Dwelling Condition
In general the dwellings of the respondents are permanent buildings (76%),
non-permanent buildings (7%), semi-permanent building (4%), and others
(13%). In terms of ownership, the buildings are private proprietary (67%),
relative‟s property (6%), provided with Building Permit (6%), rent (3%)
and others (4%). The yards are private proprietary (29%), relative‟s
property (4%), provided with Building permit (2%), and rent (1%).
In terms of fuel, gas and energy, most of the respondents use kerosene
(69%) and the rest use LPG (31%). 90% of the respondents confirm that
the electric lighting from PLN is bright, while the rest 5% say not.
The plan water used by the respondents is clear and does not smell (78%),
clear but smells (13%) and dirty but does not smell (2%). The sources of
water for drinking/cooking is supplied by PDAM (86%) and purchased
from vendors (8%). The water for washing/bathing is supplied by PDAM
(92%) and is supplied by vendor (2%).
The dwellings are provided with rubbish bin (79%) and liquid waste dump
(61%). The respondent use water-closed (60%), zeptic tanks (45%), public
bathing, washing and toilet facilities (37%), and directly draw to
rivers/swamps (13%). In term of drainage, in the dwellings there is no
puddle (56%), there is puddle when raining hard (19%) and the draining
does not works due to rubbish hindrance (7%)
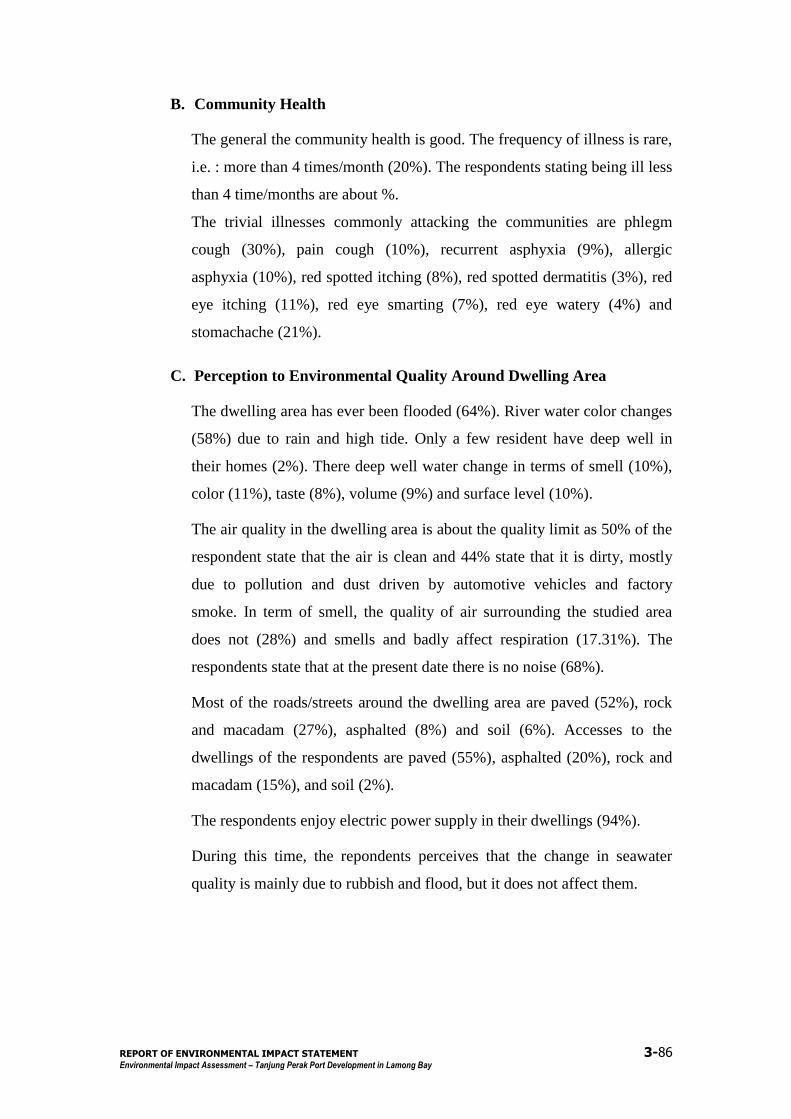
REPORT OF ENVIRONMENTAL IMPACT STATEMENT 3-86
Environmental Impact Assessment – Tanjung Perak Port Development in Lamong Bay
B. Community Health
The general the community health is good. The frequency of illness is rare,
i.e. : more than 4 times/month (20%). The respondents stating being ill less
than 4 time/months are about %.
The trivial illnesses commonly attacking the communities are phlegm
cough (30%), pain cough (10%), recurrent asphyxia (9%), allergic
asphyxia (10%), red spotted itching (8%), red spotted dermatitis (3%), red
eye itching (11%), red eye smarting (7%), red eye watery (4%) and
stomachache (21%).
C. Perception to Environmental Quality Around Dwelling Area
The dwelling area has ever been flooded (64%). River water color changes
(58%) due to rain and high tide. Only a few resident have deep well in
their homes (2%). There deep well water change in terms of smell (10%),
color (11%), taste (8%), volume (9%) and surface level (10%).
The air quality in the dwelling area is about the quality limit as 50% of the
respondent state that the air is clean and 44% state that it is dirty, mostly
due to pollution and dust driven by automotive vehicles and factory
smoke. In term of smell, the quality of air surrounding the studied area
does not (28%) and smells and badly affect respiration (17.31%). The
respondents state that at the present date there is no noise (68%).
Most of the roads/streets around the dwelling area are paved (52%), rock
and macadam (27%), asphalted (8%) and soil (6%). Accesses to the
dwellings of the respondents are paved (55%), asphalted (20%), rock and
macadam (15%), and soil (2%).
The respondents enjoy electric power supply in their dwellings (94%).
During this time, the repondents perceives that the change in seawater
quality is mainly due to rubbish and flood, but it does not affect them.

REPORT OF ENVIRONMENTAL IMPACT STATEMENT 3-87
Environmental Impact Assessment – Tanjung Perak Port Development in Lamong Bay
3.7. Transportation Component
In terms of transportation, the activities of Tanjung Perak Port development in
Lamong Bay will entail traffic consequences. The traffic will access primary
arterial roads, among other things : access road to and from PT Terminal
Petikemas Surabaya and some crossroads, such as signaled Jl. Gresik-Jl
Demak crossroad, signaled Jl. Gresik-Jl Margomulyo crossroad and
unsignaled Jl. Gresik-Jl Romokalisari crossroad. The locations of traffic
surveys are presented in Figure 3.64.
The traffic conditions will be analysed in terms of road geometry (C), traffic
volume (Q) and traffic saturation (DS).
Traffic Internodes
a. Road Geometry
The studied roads are internodes to and from PT Terminal Petikemas
Surabaya as presented in Figure 3.65., Jalan Gresik, Jalan Demak, Jalan
Margomulyo, Jalan Tambak Osowilangon and Jalan Kalianak.
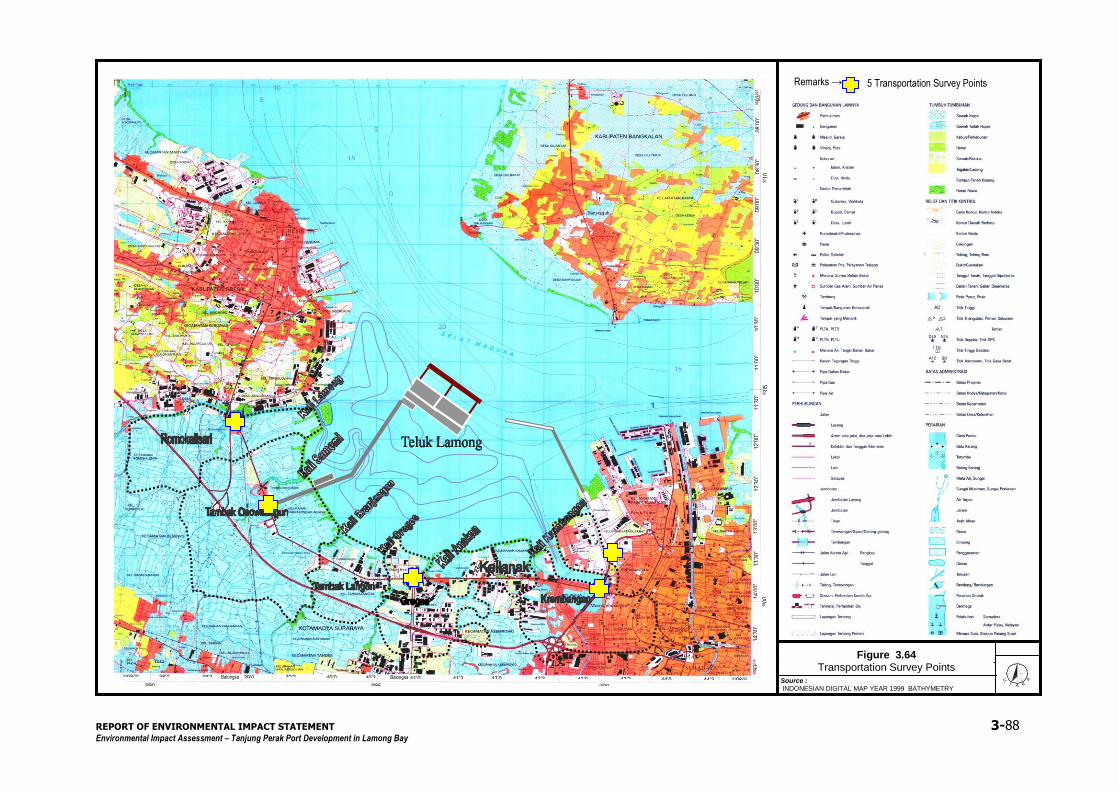
REPORT OF ENVIRONMENTAL IMPACT STATEMENT 3-88
Environmental Impact Assessment – Tanjung Perak Port Development in Lamong Bay
Source : INDONESIAN DIGITAL MAP YEAR 1999 BATHYMETRY MEASUREMEASUREMENT KALI LAMONG TAHUN 2008
1 0 1 2k
m
SKALA
U
TA R
A
14’3
0”
14’0
0”
9200
13’3
0”
13’0
0”
12’3
0”
12’0
0”
11’3
0”
11’0
0”
9205
10’3
0”
10’0
0”
09’3
0”
09’0
0”
08’3
0”
9210
08
’00”
06
932
67
mT
44’00”
44’30”
9198242 mU
9198293 mU
38’00”
38’30” 0680
Balongsari
3,5 km
39’00”
39’30”
40’00”
40’30” 0685
Balongsari
1 km
41’00”
41’30”
42’00”
42’30”
43’00” 0690
43’30”
0693
214
m
T
Remarks → : 5 Transportation Survey Points
-1 -
0,8 -
0,2
-0,6
10
Figure 3.64 Transportation Survey Points
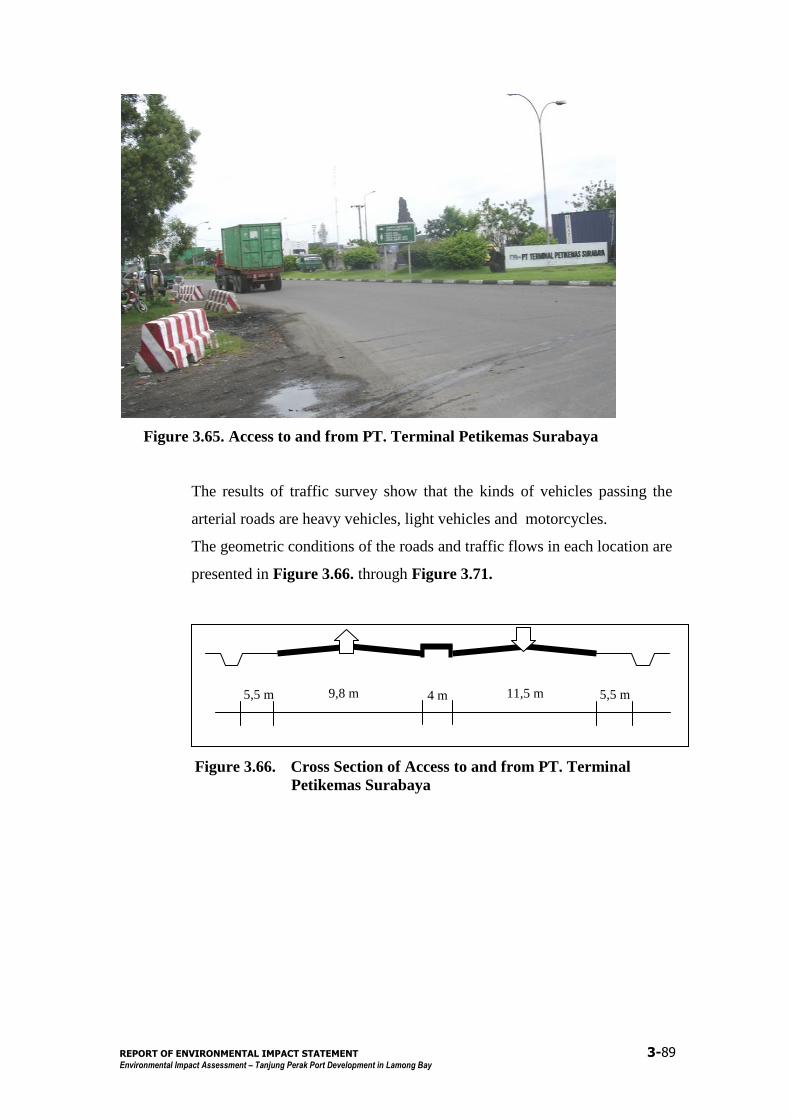
REPORT OF ENVIRONMENTAL IMPACT STATEMENT 3-89
Environmental Impact Assessment – Tanjung Perak Port Development in Lamong Bay
Figure 3.65. Access to and from PT. Terminal Petikemas Surabaya
The results of traffic survey show that the kinds of vehicles passing the
arterial roads are heavy vehicles, light vehicles and motorcycles.
The geometric conditions of the roads and traffic flows in each location are
presented in Figure 3.66. through Figure 3.71.
Figure 3.66. Cross Section of Access to and from PT. Terminal
Petikemas Surabaya
9,8 m 5,5 m 5,5 m 4 m 11,5 m
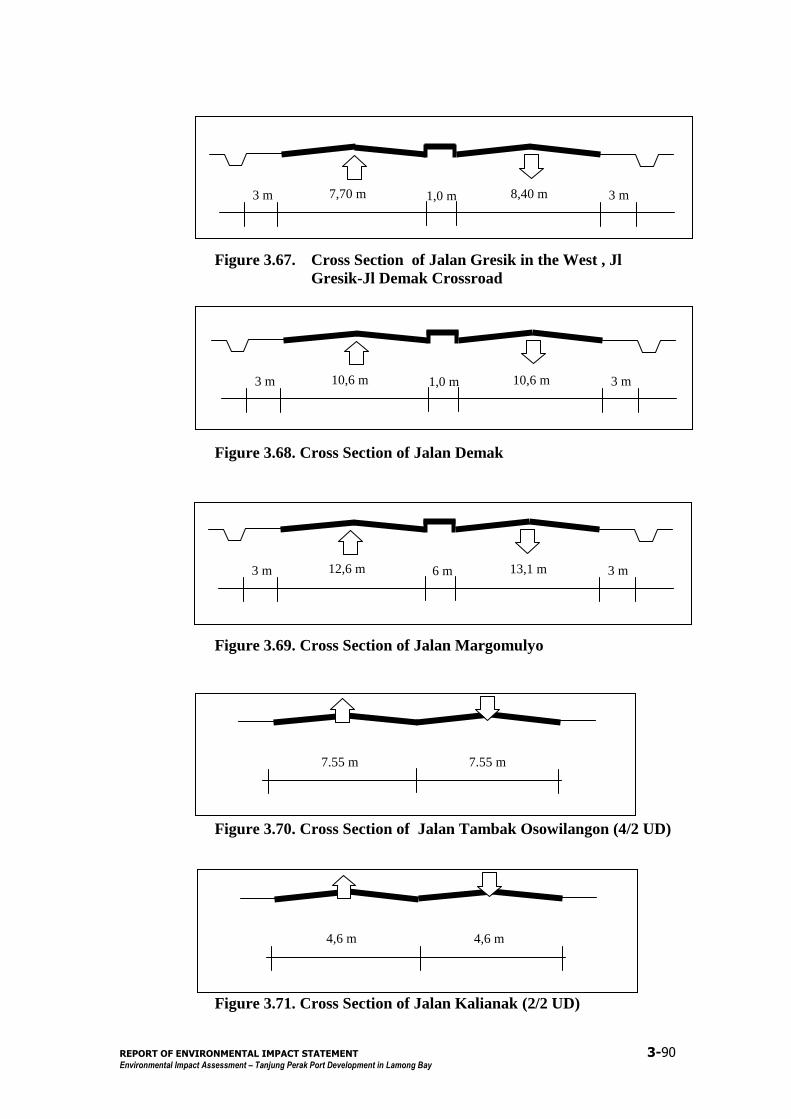
REPORT OF ENVIRONMENTAL IMPACT STATEMENT 3-90
Environmental Impact Assessment – Tanjung Perak Port Development in Lamong Bay
Figure 3.67. Cross Section of Jalan Gresik in the West , Jl
Gresik-Jl Demak Crossroad
Figure 3.68. Cross Section of Jalan Demak
Figure 3.69. Cross Section of Jalan Margomulyo
Figure 3.70. Cross Section of Jalan Tambak Osowilangon (4/2 UD)
Figure 3.71. Cross Section of Jalan Kalianak (2/2 UD)
7,70 m 3 m 3 m 1,0 m 8,40 m
10,6 m 3 m 3 m 1,0 m 10,6 m
12,6 m 3 m 3 m 6 m 13,1 m
7.55 m 7.55 m
4,6 m 4,6 m
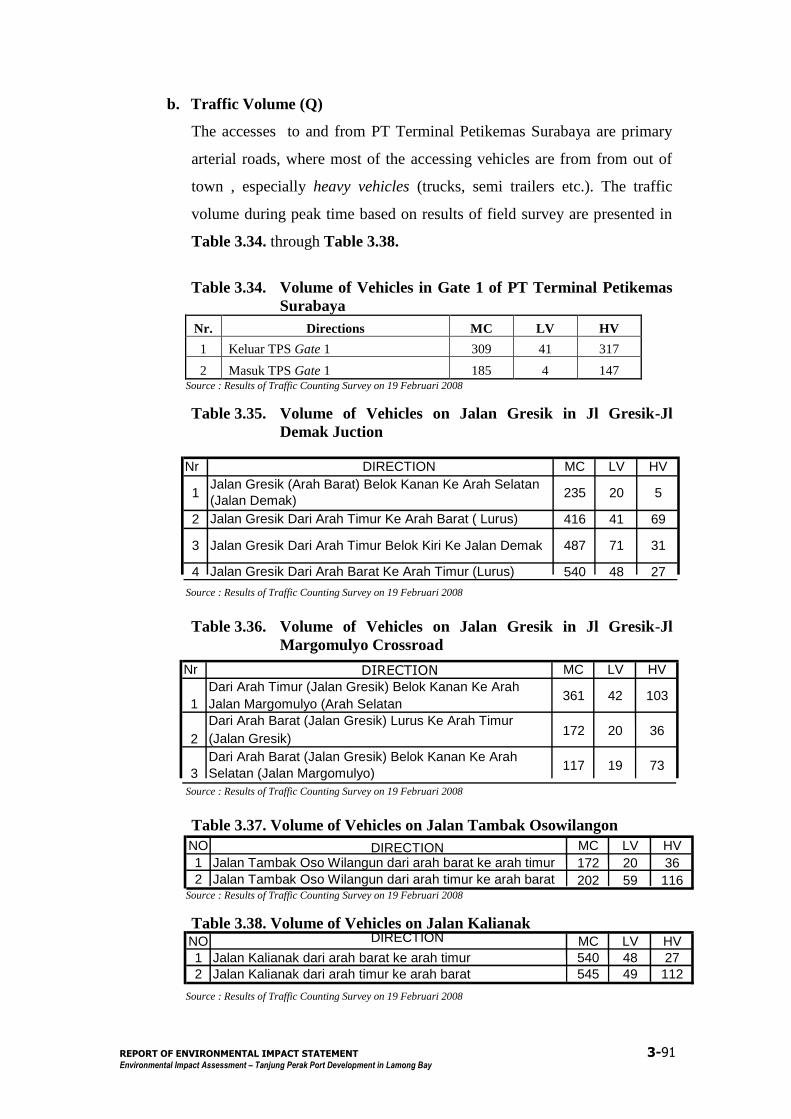
REPORT OF ENVIRONMENTAL IMPACT STATEMENT 3-91
Environmental Impact Assessment – Tanjung Perak Port Development in Lamong Bay
b. Traffic Volume (Q)
The accesses to and from PT Terminal Petikemas Surabaya are primary
arterial roads, where most of the accessing vehicles are from from out of
town , especially heavy vehicles (trucks, semi trailers etc.). The traffic
volume during peak time based on results of field survey are presented in
Table 3.34. through Table 3.38.
Table 3.34. Volume of Vehicles in Gate 1 of PT Terminal Petikemas
Surabaya
Nr. Directions MC LV HV
1 Keluar TPS Gate 1 309 41 317
2 Masuk TPS Gate 1 185 4 147 Source : Results of Traffic Counting Survey on 19 Februari 2008
Table 3.35. Volume of Vehicles on Jalan Gresik in Jl Gresik-Jl
Demak Juction
Source : Results of Traffic Counting Survey on 19 Februari 2008
Table 3.36. Volume of Vehicles on Jalan Gresik in Jl Gresik-Jl
Margomulyo Crossroad
Source : Results of Traffic Counting Survey on 19 Februari 2008
Table 3.37. Volume of Vehicles on Jalan Tambak Osowilangon
Source : Results of Traffic Counting Survey on 19 Februari 2008
Table 3.38. Volume of Vehicles on Jalan Kalianak
Source : Results of Traffic Counting Survey on 19 Februari 2008
Nr DIRECTION MC LV HV
1 Jalan Gresik (Arah Barat) Belok Kanan Ke Arah Selatan
(Jalan Demak) 235 20 5
2 Jalan Gresik Dari Arah Timur Ke Arah Barat ( Lurus) 416 41 69
3 Jalan Gresik Dari Arah Timur Belok Kiri Ke Jalan Demak 487 71 31
4 Jalan Gresik Dari Arah Barat Ke Arah Timur (Lurus) 540 48 27
Nr DIRECTION MC LV HV
1
Dari Arah Timur (Jalan Gresik) Belok Kanan Ke Arah
Jalan Margomulyo (Arah Selatan 361 42 103
2
Dari Arah Barat (Jalan Gresik) Lurus Ke Arah Timur
(Jalan Gresik) 172 20 36
3
Dari Arah Barat (Jalan Gresik) Belok Kanan Ke Arah
Selatan (Jalan Margomulyo) 117 19 73
NO DIRECTION MC LV HV
1 Jalan Tambak Oso Wilangun dari arah barat ke arah timur 172 20 36
2 Jalan Tambak Oso Wilangun dari arah timur ke arah barat 202 59 116
NO DIRECTION MC LV HV
1 Jalan Kalianak dari arah barat ke arah timur 540 48 27
2 Jalan Kalianak dari arah timur ke arah barat 545 49 112
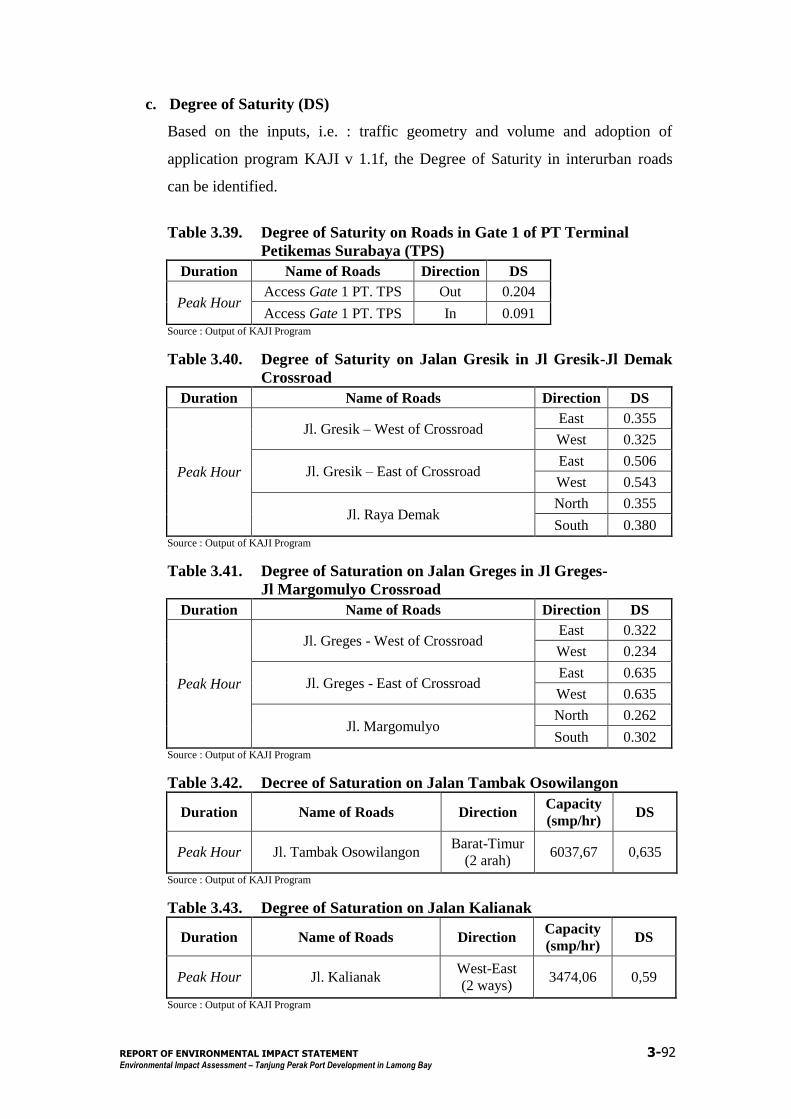
REPORT OF ENVIRONMENTAL IMPACT STATEMENT 3-92
Environmental Impact Assessment – Tanjung Perak Port Development in Lamong Bay
c. Degree of Saturity (DS)
Based on the inputs, i.e. : traffic geometry and volume and adoption of
application program KAJI v 1.1f, the Degree of Saturity in interurban roads
can be identified.
Table 3.39. Degree of Saturity on Roads in Gate 1 of PT Terminal
Petikemas Surabaya (TPS)
Duration Name of Roads Direction DS
Peak Hour Access Gate 1 PT. TPS Out 0.204
Access Gate 1 PT. TPS In 0.091 Source : Output of KAJI Program
Table 3.40. Degree of Saturity on Jalan Gresik in Jl Gresik-Jl Demak
Crossroad
Duration Name of Roads Direction DS
Peak Hour
Jl. Gresik – West of Crossroad East 0.355
West 0.325
Jl. Gresik – East of Crossroad East 0.506
West 0.543
Jl. Raya Demak North 0.355
South 0.380 Source : Output of KAJI Program
Table 3.41. Degree of Saturation on Jalan Greges in Jl Greges-
Jl Margomulyo Crossroad
Duration Name of Roads Direction DS
Peak Hour
Jl. Greges - West of Crossroad East 0.322
West 0.234
Jl. Greges - East of Crossroad East 0.635
West 0.635
Jl. Margomulyo North 0.262
South 0.302 Source : Output of KAJI Program
Table 3.42. Decree of Saturation on Jalan Tambak Osowilangon
Duration Name of Roads Direction Capacity
(smp/hr) DS
Peak Hour Jl. Tambak Osowilangon Barat-Timur
(2 arah) 6037,67 0,635
Source : Output of KAJI Program
Table 3.43. Degree of Saturation on Jalan Kalianak
Duration Name of Roads Direction Capacity
(smp/hr) DS
Peak Hour Jl. Kalianak West-East
(2 ways) 3474,06 0,59
Source : Output of KAJI Program
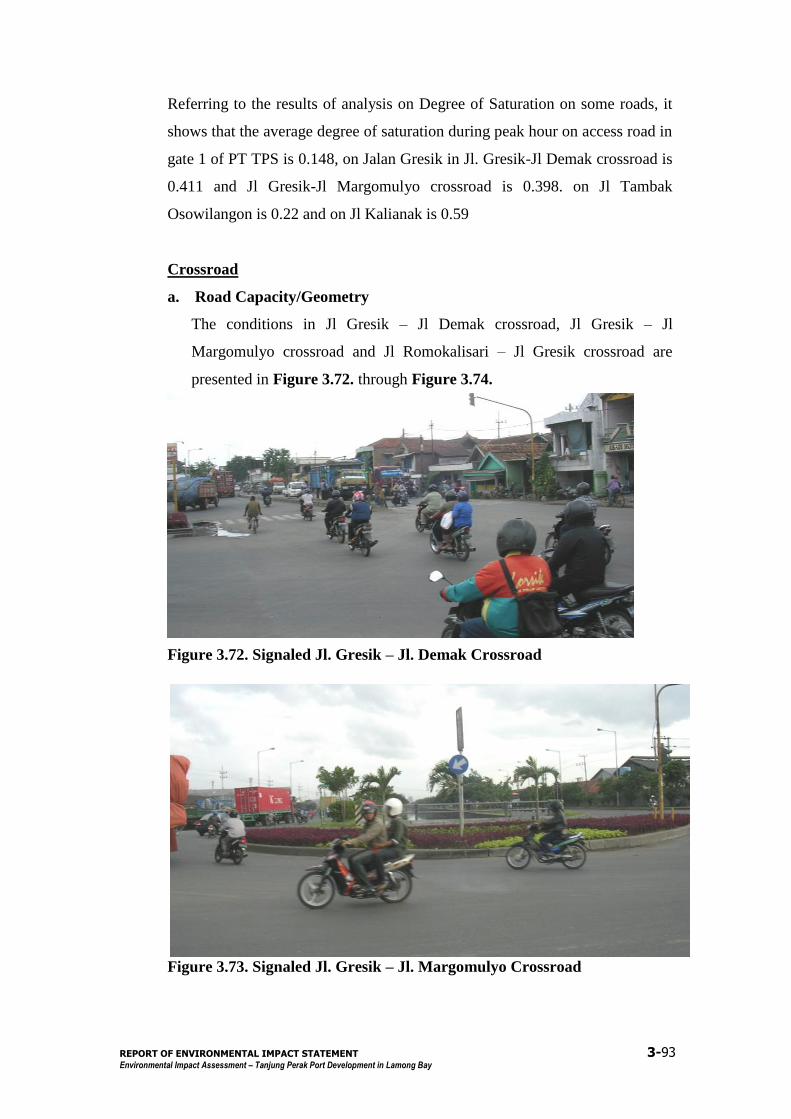
REPORT OF ENVIRONMENTAL IMPACT STATEMENT 3-93
Environmental Impact Assessment – Tanjung Perak Port Development in Lamong Bay
Referring to the results of analysis on Degree of Saturation on some roads, it
shows that the average degree of saturation during peak hour on access road in
gate 1 of PT TPS is 0.148, on Jalan Gresik in Jl. Gresik-Jl Demak crossroad is
0.411 and Jl Gresik-Jl Margomulyo crossroad is 0.398. on Jl Tambak
Osowilangon is 0.22 and on Jl Kalianak is 0.59
Crossroad
a. Road Capacity/Geometry
The conditions in Jl Gresik – Jl Demak crossroad, Jl Gresik – Jl
Margomulyo crossroad and Jl Romokalisari – Jl Gresik crossroad are
presented in Figure 3.72. through Figure 3.74.
Figure 3.72. Signaled Jl. Gresik – Jl. Demak Crossroad
Figure 3.73. Signaled Jl. Gresik – Jl. Margomulyo Crossroad
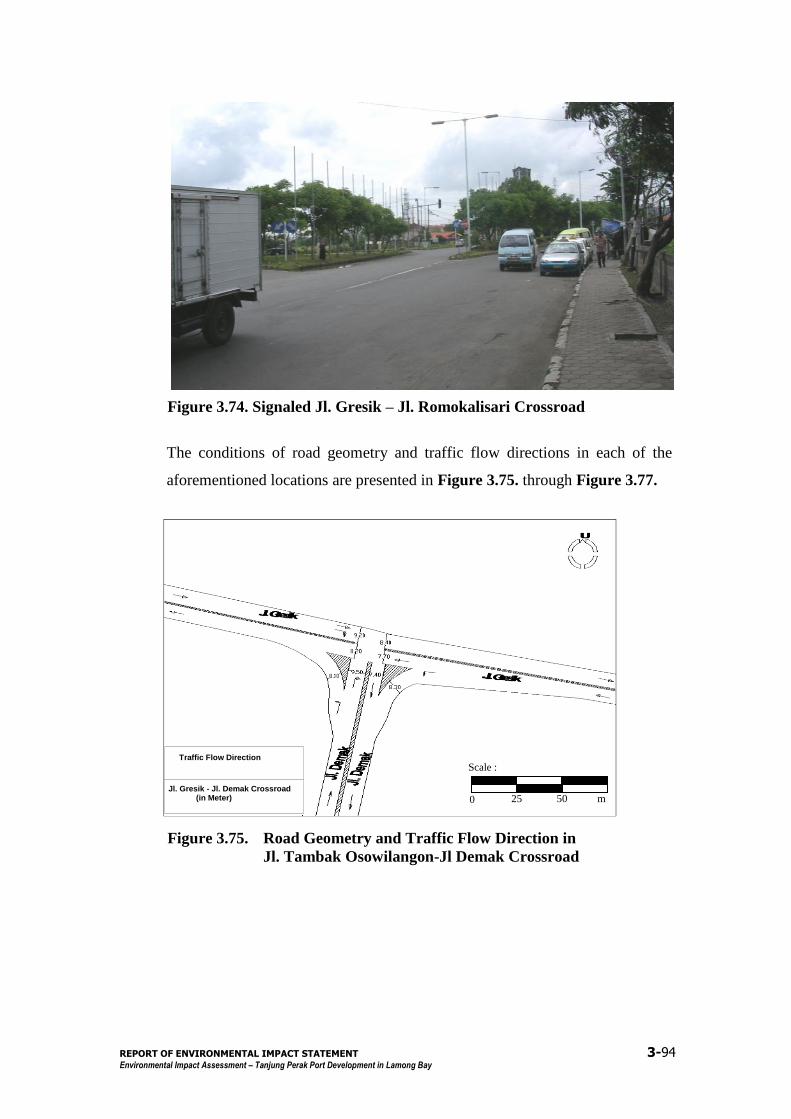
REPORT OF ENVIRONMENTAL IMPACT STATEMENT 3-94
Environmental Impact Assessment – Tanjung Perak Port Development in Lamong Bay
Figure 3.74. Signaled Jl. Gresik – Jl. Romokalisari Crossroad
The conditions of road geometry and traffic flow directions in each of the
aforementioned locations are presented in Figure 3.75. through Figure 3.77.
Figure 3.75. Road Geometry and Traffic Flow Direction in
Jl. Tambak Osowilangon-Jl Demak Crossroad
0 25 50 m
Scale :
Jl. Gresik - Jl. Demak Crossroad (in Meter)
Traffic Flow Direction pergerakan lalu-lintas
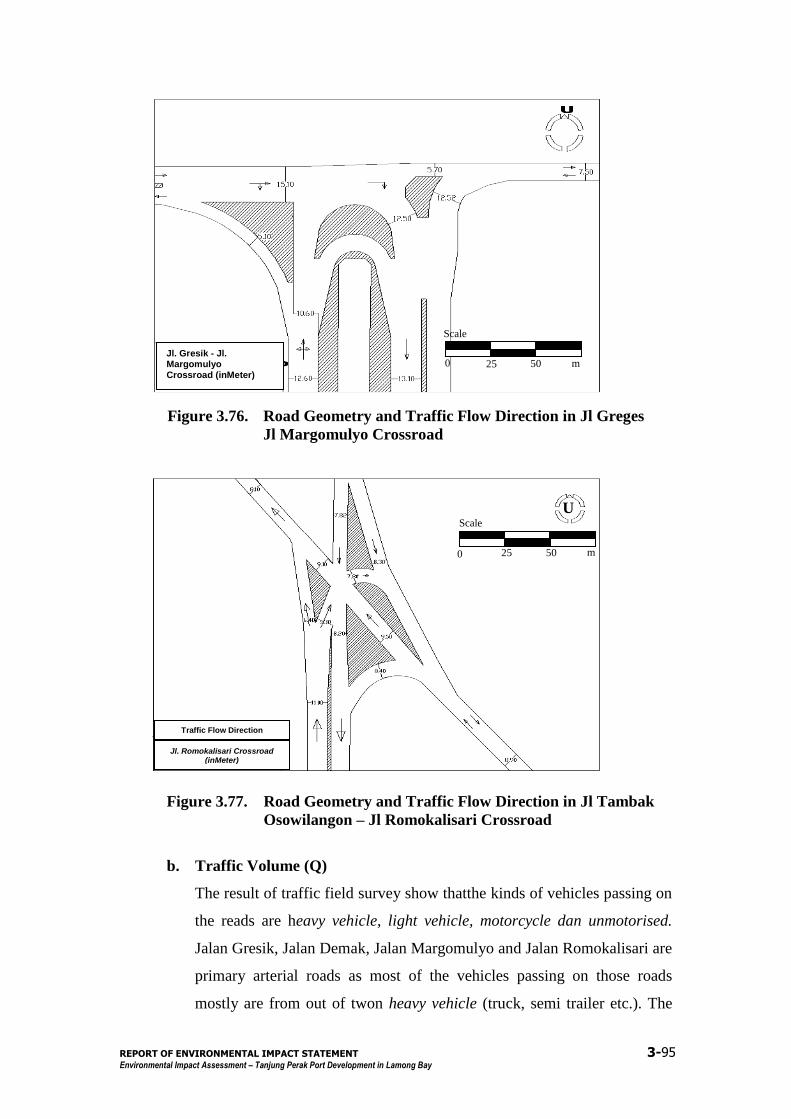
REPORT OF ENVIRONMENTAL IMPACT STATEMENT 3-95
Environmental Impact Assessment – Tanjung Perak Port Development in Lamong Bay
Figure 3.76. Road Geometry and Traffic Flow Direction in Jl Greges
Jl Margomulyo Crossroad
Figure 3.77. Road Geometry and Traffic Flow Direction in Jl Tambak
Osowilangon – Jl Romokalisari Crossroad
b. Traffic Volume (Q)
The result of traffic field survey show thatthe kinds of vehicles passing on
the reads are heavy vehicle, light vehicle, motorcycle dan unmotorised.
Jalan Gresik, Jalan Demak, Jalan Margomulyo and Jalan Romokalisari are
primary arterial roads as most of the vehicles passing on those roads
mostly are from out of twon heavy vehicle (truck, semi trailer etc.). The
Jl. Gresik - Jl. Margomulyo Crossroad (inMeter)
25 0 50 m
Scale
U
0 25 50 m
Scale
Population Income
Traffic Flow Direction
Jl. Romokalisari Crossroad (inMeter)
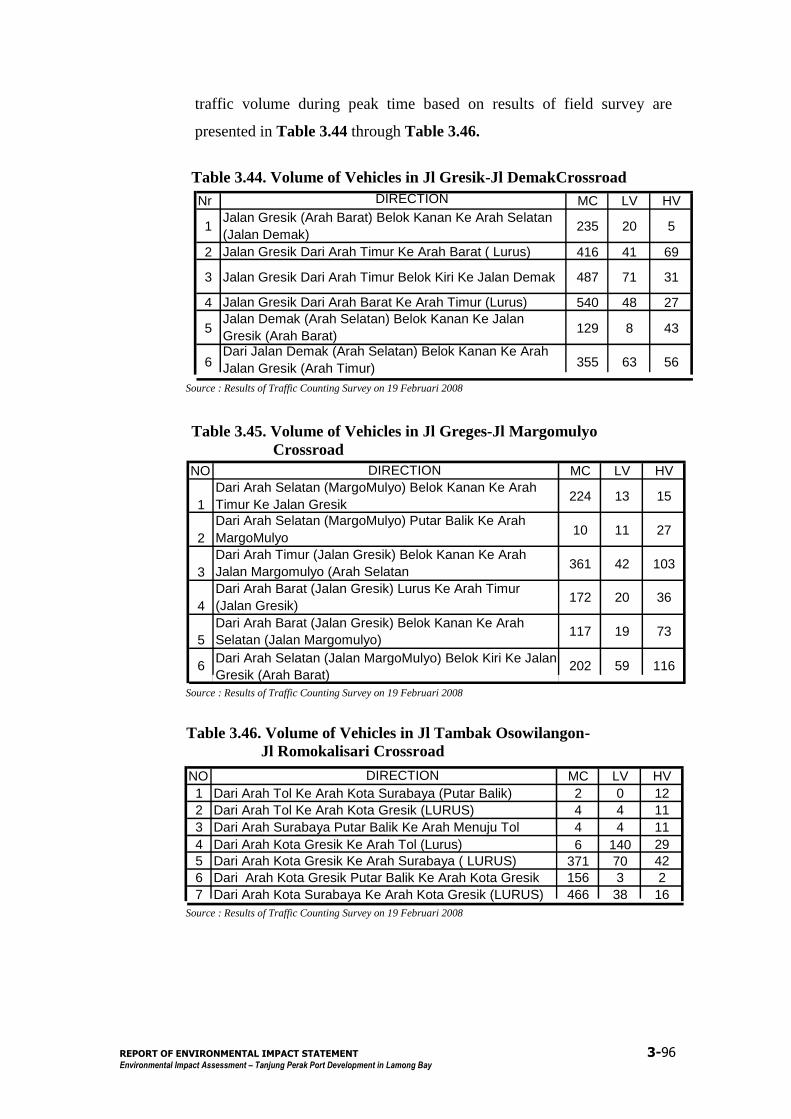
REPORT OF ENVIRONMENTAL IMPACT STATEMENT 3-96
Environmental Impact Assessment – Tanjung Perak Port Development in Lamong Bay
traffic volume during peak time based on results of field survey are
presented in Table 3.44 through Table 3.46.
Table 3.44. Volume of Vehicles in Jl Gresik-Jl DemakCrossroad
Source : Results of Traffic Counting Survey on 19 Februari 2008
Table 3.45. Volume of Vehicles in Jl Greges-Jl Margomulyo
Crossroad
Source : Results of Traffic Counting Survey on 19 Februari 2008
Table 3.46. Volume of Vehicles in Jl Tambak Osowilangon-
Jl Romokalisari Crossroad
Source : Results of Traffic Counting Survey on 19 Februari 2008
Nr DIRECTION MC LV HV
1 Jalan Gresik (Arah Barat) Belok Kanan Ke Arah Selatan
(Jalan Demak) 235 20 5
2 Jalan Gresik Dari Arah Timur Ke Arah Barat ( Lurus) 416 41 69
3 Jalan Gresik Dari Arah Timur Belok Kiri Ke Jalan Demak 487 71 31
4 Jalan Gresik Dari Arah Barat Ke Arah Timur (Lurus) 540 48 27
5 Jalan Demak (Arah Selatan) Belok Kanan Ke Jalan
Gresik (Arah Barat) 129 8 43
6 Dari Jalan Demak (Arah Selatan) Belok Kanan Ke Arah
Jalan Gresik (Arah Timur) 355 63 56
NO DIRECTION MC LV HV
1
Dari Arah Selatan (MargoMulyo) Belok Kanan Ke Arah
Timur Ke Jalan Gresik 224 13 15
2
Dari Arah Selatan (MargoMulyo) Putar Balik Ke Arah
MargoMulyo 10 11 27
3
Dari Arah Timur (Jalan Gresik) Belok Kanan Ke Arah
Jalan Margomulyo (Arah Selatan 361 42 103
4
Dari Arah Barat (Jalan Gresik) Lurus Ke Arah Timur
(Jalan Gresik) 172 20 36
5
Dari Arah Barat (Jalan Gresik) Belok Kanan Ke Arah
Selatan (Jalan Margomulyo) 117 19 73
6 Dari Arah Selatan (Jalan MargoMulyo) Belok Kiri Ke Jalan
Gresik (Arah Barat) 202 59 116
NO DIRECTION MC LV HV
1 Dari Arah Tol Ke Arah Kota Surabaya (Putar Balik) 2 0 12
2 Dari Arah Tol Ke Arah Kota Gresik (LURUS) 4 4 11
3 Dari Arah Surabaya Putar Balik Ke Arah Menuju Tol 4 4 11
4 Dari Arah Kota Gresik Ke Arah Tol (Lurus) 6 140 29
5 Dari Arah Kota Gresik Ke Arah Surabaya ( LURUS) 371 70 42
6 Dari Arah Kota Gresik Putar Balik Ke Arah Kota Gresik 156 3 2
7 Dari Arah Kota Surabaya Ke Arah Kota Gresik (LURUS) 466 38 16
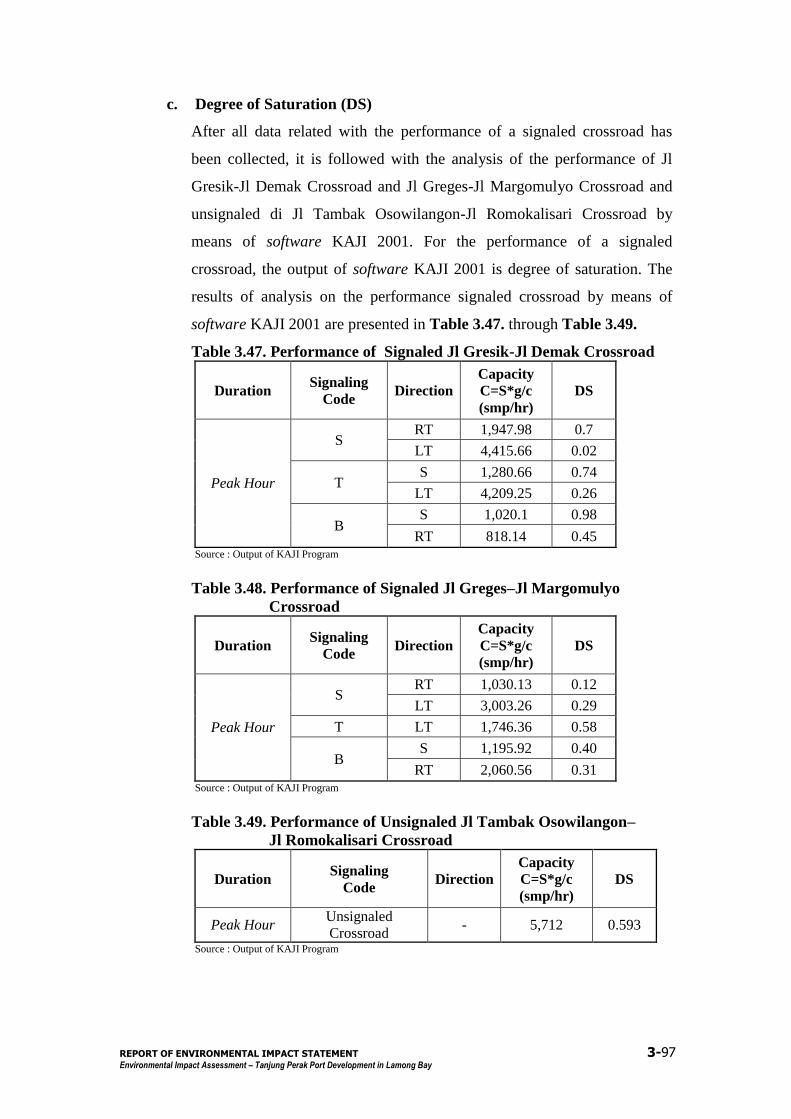
REPORT OF ENVIRONMENTAL IMPACT STATEMENT 3-97
Environmental Impact Assessment – Tanjung Perak Port Development in Lamong Bay
c. Degree of Saturation (DS)
After all data related with the performance of a signaled crossroad has
been collected, it is followed with the analysis of the performance of Jl
Gresik-Jl Demak Crossroad and Jl Greges-Jl Margomulyo Crossroad and
unsignaled di Jl Tambak Osowilangon-Jl Romokalisari Crossroad by
means of software KAJI 2001. For the performance of a signaled
crossroad, the output of software KAJI 2001 is degree of saturation. The
results of analysis on the performance signaled crossroad by means of
software KAJI 2001 are presented in Table 3.47. through Table 3.49.
Table 3.47. Performance of Signaled Jl Gresik-Jl Demak Crossroad
Duration Signaling
Code Direction
Capacity
C=S*g/c
(smp/hr)
DS
Peak Hour
S RT 1,947.98 0.7
LT 4,415.66 0.02
T S 1,280.66 0.74
LT 4,209.25 0.26
B S 1,020.1 0.98
RT 818.14 0.45 Source : Output of KAJI Program
Table 3.48. Performance of Signaled Jl Greges–Jl Margomulyo
Crossroad
Duration Signaling
Code Direction
Capacity
C=S*g/c
(smp/hr)
DS
Peak Hour
S RT 1,030.13 0.12
LT 3,003.26 0.29
T LT 1,746.36 0.58
B S 1,195.92 0.40
RT 2,060.56 0.31 Source : Output of KAJI Program
Table 3.49. Performance of Unsignaled Jl Tambak Osowilangon–
Jl Romokalisari Crossroad
Duration Signaling
Code Direction
Capacity
C=S*g/c
(smp/hr)
DS
Peak Hour Unsignaled
Crossroad - 5,712 0.593
Source : Output of KAJI Program
REPORT OF ENVIRONMENTAL IMPACT STATEMENT 3-98
Environmental Impact Assessment – Tanjung Perak Port Development in Lamong Bay
Based on the output of output software KAJI 2001 on the analysis, it
shows that the the signaled Jl Gresik-Jl Demak crossroad has degree of
saturation as much as 0.34, while the one in signaled Jl Greges-Jl
Margomulyo crossroad has degree of saturation as much as 0.49. The
degree of saturation in unsignaled Jl Tambak Osowilangon-Jl
Romokalisari crossroad is 0.593.
Sea Transportation – Voyage Safety
The initial descriptions about voyage safety in the studied area will be analogized
to the one in the existing container terminal, i.e. : Surabaya Terminal Peti Kemas
Surabaya (TPS), formerly named International Container Ternimal (ICT), and
passenger terminal in Gapura Surya Tanjung Perak. The shipping routes in the
studied area is commonly accessed by all voyages to and from Tanjung Perak
Port. The routes are free of mines and taccordingly safe to be accessed. The area
vulverable to mines are the ones out of the studied area, i.e. East of Kenjeran and
Karang Jamuang area (non shipping routes).
All vessels voyaging to and from the container terminal pier in Tanjung Perak Port
and Kalimas take the West routes in Madura Strait. The voyage schedules are
managed by the Port Administrator.
Based on the data of vessel visits in Tanjung Perak Port (see Table2.4.), it shows
that there is an average decrease of visits per year by 0.08%, with total vessel
visits as many as 15.459 in 2007.
The vessel accidents in Tanjung Perak Port are presented in Table 3.50.
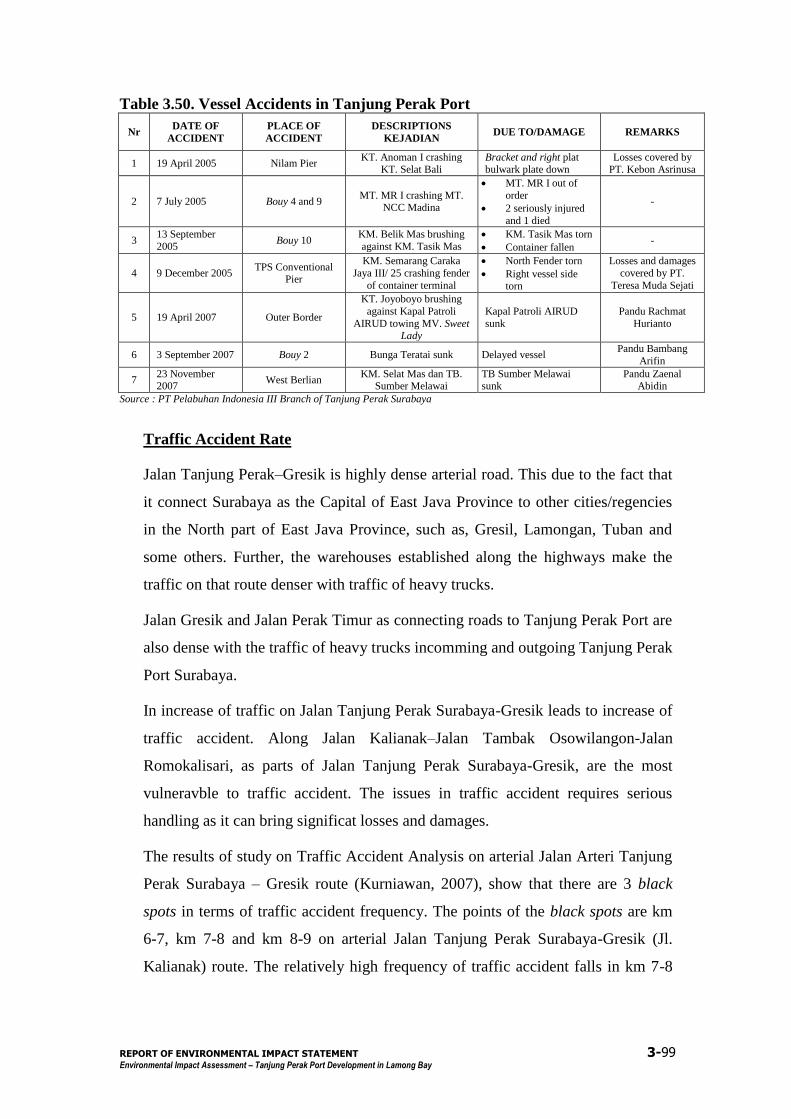
REPORT OF ENVIRONMENTAL IMPACT STATEMENT 3-99
Environmental Impact Assessment – Tanjung Perak Port Development in Lamong Bay
Table 3.50. Vessel Accidents in Tanjung Perak Port
Nr DATE OF
ACCIDENT
PLACE OF
ACCIDENT
DESCRIPTIONS
KEJADIAN DUE TO/DAMAGE REMARKS
1 19 April 2005 Nilam Pier KT. Anoman I crashing
KT. Selat Bali Bracket and right plat bulwark plate down
Losses covered by PT. Kebon Asrinusa
2 7 July 2005 Bouy 4 and 9 MT. MR I crashing MT.
NCC Madina
MT. MR I out of
order
2 seriously injured
and 1 died
-
3 13 September
2005 Bouy 10
KM. Belik Mas brushing
against KM. Tasik Mas
KM. Tasik Mas torn
Container fallen -
4 9 December 2005 TPS Conventional
Pier
KM. Semarang Caraka
Jaya III/ 25 crashing fender
of container terminal
North Fender torn
Right vessel side torn
Losses and damages
covered by PT.
Teresa Muda Sejati
5 19 April 2007 Outer Border
KT. Joyoboyo brushing
against Kapal Patroli
AIRUD towing MV. Sweet Lady
Kapal Patroli AIRUD
sunk
Pandu Rachmat
Hurianto
6 3 September 2007 Bouy 2 Bunga Teratai sunk Delayed vessel Pandu Bambang
Arifin
7 23 November 2007
West Berlian KM. Selat Mas dan TB.
Sumber Melawai TB Sumber Melawai sunk
Pandu Zaenal Abidin
Source : PT Pelabuhan Indonesia III Branch of Tanjung Perak Surabaya
Traffic Accident Rate
Jalan Tanjung Perak–Gresik is highly dense arterial road. This due to the fact that
it connect Surabaya as the Capital of East Java Province to other cities/regencies
in the North part of East Java Province, such as, Gresil, Lamongan, Tuban and
some others. Further, the warehouses established along the highways make the
traffic on that route denser with traffic of heavy trucks.
Jalan Gresik and Jalan Perak Timur as connecting roads to Tanjung Perak Port are
also dense with the traffic of heavy trucks incomming and outgoing Tanjung Perak
Port Surabaya.
In increase of traffic on Jalan Tanjung Perak Surabaya-Gresik leads to increase of
traffic accident. Along Jalan Kalianak–Jalan Tambak Osowilangon-Jalan
Romokalisari, as parts of Jalan Tanjung Perak Surabaya-Gresik, are the most
vulneravble to traffic accident. The issues in traffic accident requires serious
handling as it can bring significat losses and damages.
The results of study on Traffic Accident Analysis on arterial Jalan Arteri Tanjung
Perak Surabaya – Gresik route (Kurniawan, 2007), show that there are 3 black
spots in terms of traffic accident frequency. The points of the black spots are km
6-7, km 7-8 and km 8-9 on arterial Jalan Tanjung Perak Surabaya-Gresik (Jl.
Kalianak) route. The relatively high frequency of traffic accident falls in km 7-8
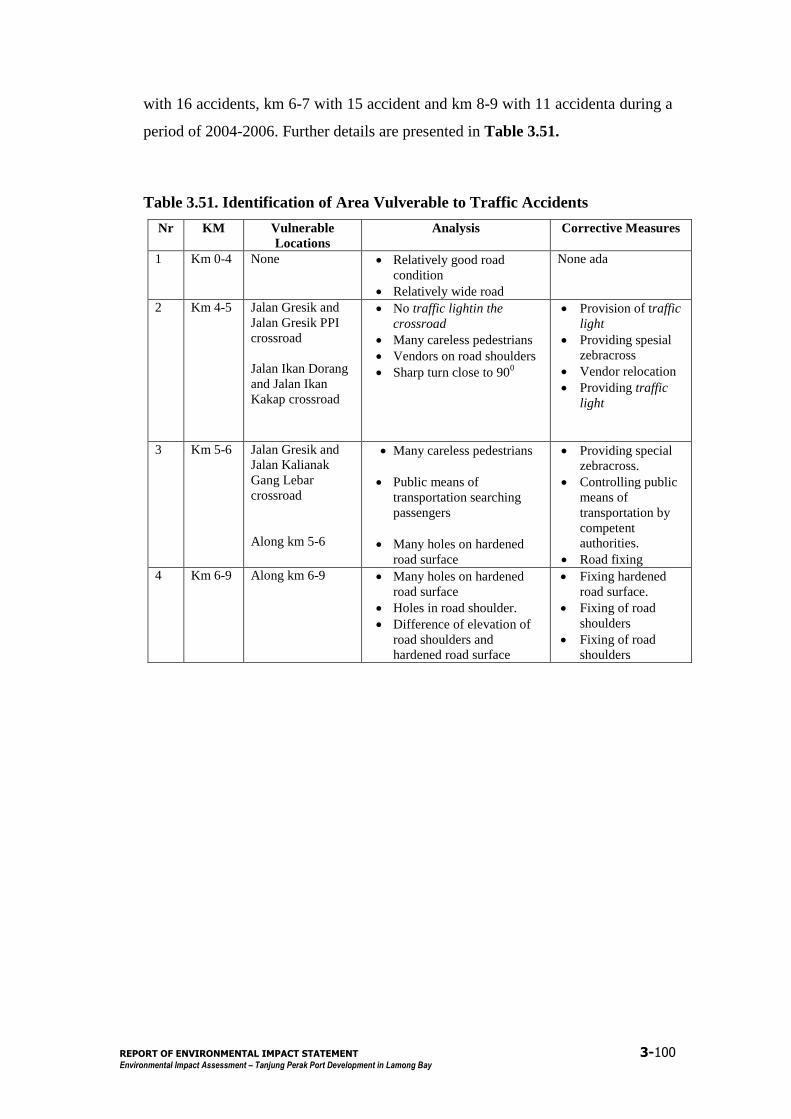
REPORT OF ENVIRONMENTAL IMPACT STATEMENT 3-100
Environmental Impact Assessment – Tanjung Perak Port Development in Lamong Bay
with 16 accidents, km 6-7 with 15 accident and km 8-9 with 11 accidenta during a
period of 2004-2006. Further details are presented in Table 3.51.
Table 3.51. Identification of Area Vulverable to Traffic Accidents
Nr KM Vulnerable
Locations
Analysis Corrective Measures
1 Km 0-4 None Relatively good road
condition
Relatively wide road
None ada
2 Km 4-5 Jalan Gresik and
Jalan Gresik PPI
crossroad
Jalan Ikan Dorang
and Jalan Ikan
Kakap crossroad
No traffic lightin the
crossroad
Many careless pedestrians
Vendors on road shoulders
Sharp turn close to 900
Provision of traffic
light
Providing spesial
zebracross
Vendor relocation
Providing traffic
light
3 Km 5-6 Jalan Gresik and
Jalan Kalianak
Gang Lebar
crossroad
Along km 5-6
Many careless pedestrians
Public means of
transportation searching
passengers
Many holes on hardened
road surface
Providing special
zebracross.
Controlling public
means of
transportation by
competent
authorities.
Road fixing
4 Km 6-9 Along km 6-9 Many holes on hardened
road surface
Holes in road shoulder.
Difference of elevation of
road shoulders and
hardened road surface
Fixing hardened
road surface.
Fixing of road
shoulders
Fixing of road
shoulders

REPORT OF ENVIRONMENTAL IMPACT STATEMENT 3-101
Environmental Impact Assessment – Tanjung Perak Port Development in Lamong Bay
Table 3.51. Identification of Area Vulverable to Traffic Accidents (Cont.) Nr KM Vulnerable
Locations
Analysis Corrective Measures
5 Km
9-10
Jalan Greges and
Jalan Margomulyo
Crossroad
Access road to warehousing
estate around the crossroad.
Providing road
median to enable
wider maneuver
for turning trucks.
6 Km
10-12
None None None
7 Km
12-13
In front of Tambak
Osowilangun
Indah
Warehousing
Estate
Turn before
Tambak
Osowilangon Bus
Terminal (from
Surabaya)
Damage on hardened road
surface leading to decreased
road wdth
Extremely sharp turn and
trees of road shoulders
hindering traffic usser‟s sight
Road fixing and
regulat
maintenance
Cutting down trees
Supplying relevant
traffic signs.
8 Km
13-15
None None None
9 Km
>15
Surabaya-Gresik
Toll Road Tidak ada traffic light
MPU berhenti di samping
jalan
Providing traffic
light
Controlling public
means of
transportation by
competent
authorities Source : Kurniawan, 2007
The most accidents invole motorcyclists, i.e. : 55.11 %. Un-motorized vehicle
users suffer from traffic accident the least frequently 3.56 %. This is due to mix
traffic among 2-wheel vehicles, light vehicles and heavy vehicles.
REPORT OF ENVIRONMENTAL IMPACT STATEMENT 3-102
Environmental Impact Assessment – Tanjung Perak Port Development in Lamong Bay
3.8. Spatial Aspect
The compliance of the planned project site to the Local Regulation Nr. 3 Year
2007 about Surabaya Master Plan is subject to condition that the studied area
to be completed with Environmental Impact Assessment is in the territory of
Surabaya City, covering 3 (three) sub-districts, i.e. : Benowo Sub-district,
Krembangan Sub-district and Asemrowo Sub-district.
In view of the city structure, the studied area is in the outskirt of Surabaya
City, in the North. In attempt to accommodate diversified interests, it requires
a comprehensive master plan well considering the utiilizations of land, water,
air and other natural resources in a dynamic and inegrated ecosystem.
Accordingly, Surabya City is divided into some Development Units. The 3
sub-districts in the studied area are in different Development Units.
Krembangan sub-district is under Development Unit V Tanjung Perak, mainly
functioning to develop port, special zone, strategic industrial zone, service and
trade with a center of development in Tanjung Perak area.
Benowo sub-district and Asemrowo sub-district are under Development Unit
XI mainly functioning to develop dwellings, trade and service and
warehousing, with a center of development in Tambak Osowilangon area.
Referring to the Sea Spatial Structure Plan, the studied area of Environmental
Impact Assessment is in Zone I. It is around the coastal area (Lamong Bay)
mainly functioning to develop port and shipping routes for large vessels. In
view of sea transportation development plan, Lamong Bay is projected for
international-scale container terminal and cargo development.
In Surabaya Master Plan it is stated that in the line with getting intensive cargo
loading and unloading activities in the exisiting terminal, it is impossible to
make extension due to space factors. Therfore, PT. Pelabuhan Indonesia III
plans to extend Tanjung Perak Port in Lamong Bay on the following
considerations :
The existing installed capacity in Tanjung Perak Port, i.e. : ±35 million
ton/year is to be improved as it is about to exceed. Accordingly, it is
reasonable to develop the port to the West.
REPORT OF ENVIRONMENTAL IMPACT STATEMENT 3-103
Environmental Impact Assessment – Tanjung Perak Port Development in Lamong Bay
It is impossible to develop Tanjung Perak Port in the existing area, and it
is impossible to exploit upland as the location is heavily populated. The
only feasible alternative is reclaiming areas approved by the Minister of
Communication.
With reference to East Java Province Master Plan, Lamong Bay is projected
for developing an international port hub.
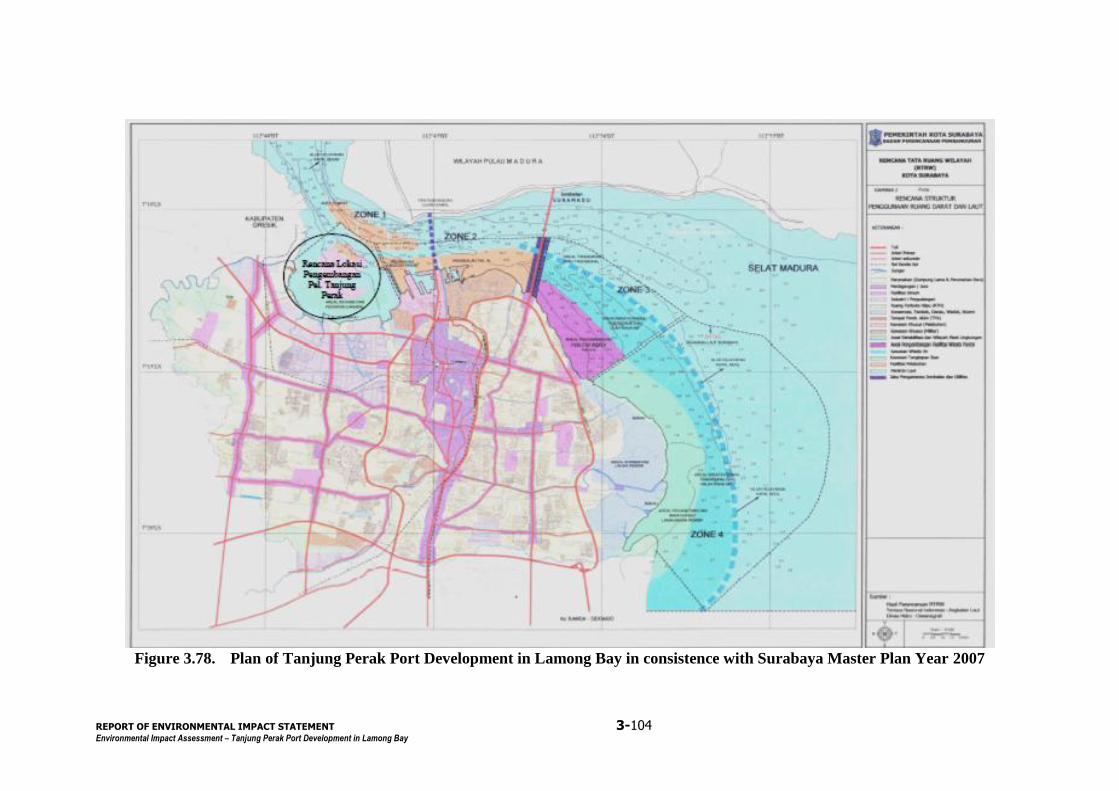
REPORT OF ENVIRONMENTAL IMPACT STATEMENT 3-104
Environmental Impact Assessment – Tanjung Perak Port Development in Lamong Bay
Figure 3.78. Plan of Tanjung Perak Port Development in Lamong Bay in consistence with Surabaya Master Plan Year 2007
Top Related