


Languages
Pages
Legal


to 1283 MPa after quenching and low tempering at 200oC. Tempering at 400 ° C significantly reduced this parameter, but its average value is still high. Tempering at higher temperatures reduces the yield strength to 519 MPa after tempering at 700° C. It should be noted that the average yield strength in delivery state and after normalization are much smaller and are respectively equal to 372 and 380 MPa.
Tab.2. Results of tensile test Heat treatment
deliv-ery state
after normalizat.
hard.
hard/temp 200
oC
hard/temp 300
oC
hard/temp 400
oC
hard/temp 500
oC
hard/temp 600
oC
hard/temp 700
oC R0,2[MPa]
372 380 1245 1283 1224 1072 837 714 519 Rm[MPa]
541 598 1762 1585 1412 1177 863 766 595
The highest tensile strength of the steel occurs after quenching, the average value is equal to 1762 MPa. The parameter Rm retains high after tempering at 200°C and 300°C. Rm is characterized by a significantly lower value after tempering at 400°C , but still relatively high rate of 1177 MPa. Then the value of the tensile strength decreases gradually with increasing tempering temperature, showing after tempering at 700°C value of 595 MPa. A similar, relatively low value of Rm is characterized by the steel in delivered state and after normalization.
Impact test Charpy impact test was used to measure impact strength. The measurement was carried out both at temperature 20° C and for selected states at temperatures 0, -20 and -40°C. The measurement results for steel after different heat treatments are summarized in table 3 for measurements at temperature of 20°C and in table 4 for measurements at other temperatures for selected states.
Tab.3. Results of impact test at temperature of 20o C Heat treatment
deliv-ery state
after normalizat.
hard.
hard/temp 200
oC
hard/temp 300
oC
hard/temp 400
oC
hard/temp 500
oC
hard/temp 600
oC
hard/temp 700
oC KCVav[J/cm2]
39 102 53 61 55 70 177 198 325
Tab.4. Results of impact test at temperature range from 0 to -40oC State 20oC 0oC -20oC -40oC
KCVav[J/cm2] as delivery 39 17 9 7
after normalize. 102 33 19 12 hardening 53 47 42 39
hard/temp 200 oC 61 56 45 37
Taking the criterion of minimum impact strength equal to 35 J/cm2, which is adopted for construction materials in many applications, steel tested meets this criterion in all analyzed states at 20o C. However, already at lower temperatures impact strength values for two of the four selected states are smaller. The criterion is not met for steel in delivered state and after normalization even at 0°C, and their impact strength is further lowered in sub-zero temperatures. Steel in delivered state and after normalization shows the impact strength at -40°C equal to 7 and 12 J/cm2, whereas in the states after quenching and tempering impact strength at this temperature is respectively equals to 39 and 37 J/cm2 and meet the criterion cited. Fractographic analysis Actual type of fracture was evaluated using scanning electron microscope JEOL JSM-5800LV. Macroscopic view of fracture
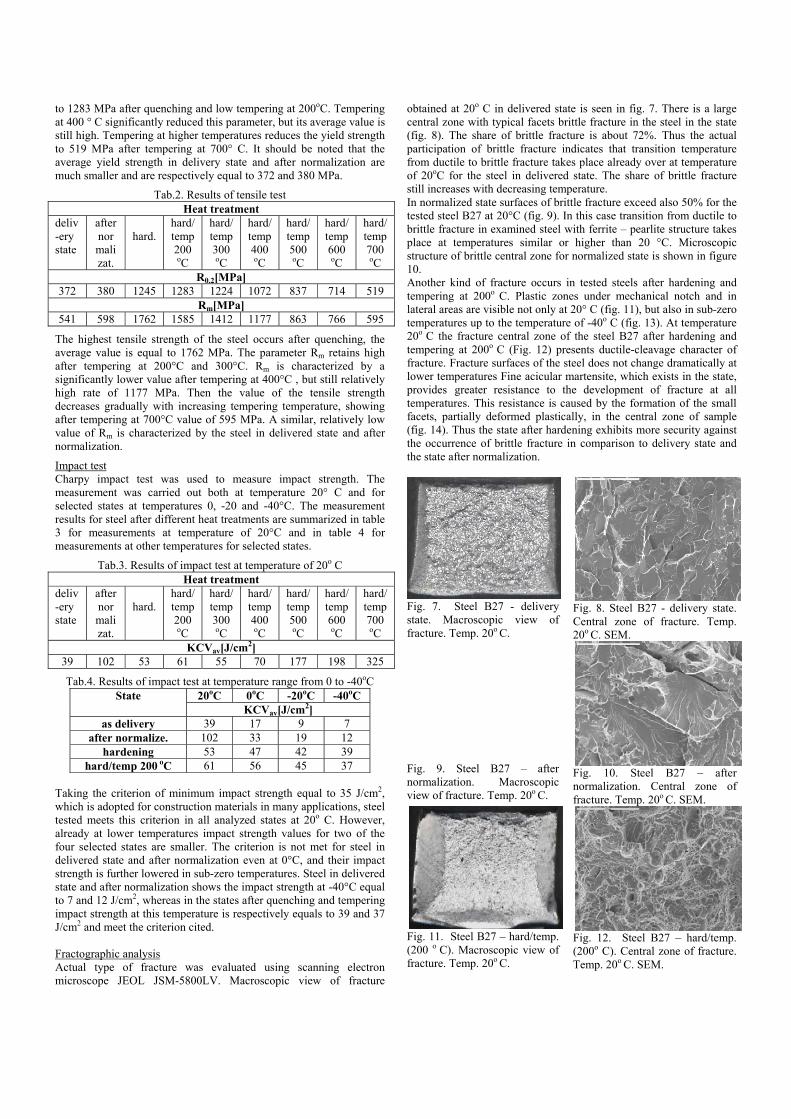
obtained at 20o C in delivered state is seen in fig. 7. There is a large central zone with typical facets brittle fracture in the steel in the state (fig. 8). The share of brittle fracture is about 72%. Thus the actual participation of brittle fracture indicates that transition temperature from ductile to brittle fracture takes place already over at temperature of 20oC for the steel in delivered state. The share of brittle fracture still increases with decreasing temperature. In normalized state surfaces of brittle fracture exceed also 50% for the tested steel B27 at 20°C (fig. 9). In this case transition from ductile to brittle fracture in examined steel with ferrite – pearlite structure takes place at temperatures similar or higher than 20 °C. Microscopic structure of brittle central zone for normalized state is shown in figure 10. Another kind of fracture occurs in tested steels after hardening and tempering at 200o C. Plastic zones under mechanical notch and in lateral areas are visible not only at 20° C (fig. 11), but also in sub-zero temperatures up to the temperature of -40o C (fig. 13). At temperature 20o C the fracture central zone of the steel B27 after hardening and tempering at 200o C (Fig. 12) presents ductile-cleavage character of fracture. Fracture surfaces of the steel does not change dramatically at lower temperatures Fine acicular martensite, which exists in the state, provides greater resistance to the development of fracture at all temperatures. This resistance is caused by the formation of the small facets, partially deformed plastically, in the central zone of sample (fig. 14). Thus the state after hardening exhibits more security against the occurrence of brittle fracture in comparison to delivery state and the state after normalization.
Fig. 7. Steel B27 - delivery state. Macroscopic view of fracture. Temp. 20o C.
Fig. 8. Steel B27 - delivery state. Central zone of fracture. Temp. 20o C. SEM.
Fig. 9. Steel B27 – after normalization. Macroscopic view of fracture. Temp. 20o C.
Fig. 10. Steel B27 – after normalization. Central zone of fracture. Temp. 20o C. SEM.
Fig. 11. Steel B27 – hard/temp. (200 o C). Macroscopic view of fracture. Temp. 20o C.
Fig. 12. Steel B27 – hard/temp. (200o C). Central zone of fracture. Temp. 20o C. SEM.
45

Fig. 13. Steel B27 – hard/temp. (200o C). Macroscopic view of fracture. Temp. -40o C.
Fig. 14. Steel B27 – hard/temp. (200o C). Central zone of fracture. Temp. -40o C. SEM.
Wear resistance The study was performed in accordance with the requirements of GOST 23.208-79. Steel grade C45 in normalized condition was used as a reference sample. The aim of this study was to determine the rate of wear resistance, Kb,av, compared to standard sample. Values of Kb,av after different heat treatment are presented in fig. 15. Steel B27 exhibits the greatest resistance to abrasion in states after hardening and after hardening and tempering at 200oC. Then the resistance decreases with increasing annealing temperature. Steel after normalization shows a similar resistance to the last two states, but abrasive wear mechanism is more beneficial for hardened steel [3]. The lowest value of the wear resistance is present in delivery state. Figures 16 and 17 show surfaces after wear test provided for steel B27 in delivery state and after hardening.
1- steel grade C45, 2- B27, as delivery, 3- B27, normaliz., 4- B27, hardening, 5- B27, hard/temp.200oC, 6- B27, hard/temp.300oC, 7- B27, hard/temp.400oC, 8- B27, hard/temp.500oC, 9- B27, hard/temp.600oC, 10- B27, hard/temp.700oC.
Fig. 15. The rate of wear resistance, Kb,av, of tested steel B27 after different heat treatment.
Fig. 16. Steel B27 – delivery state. Surface state after wear test. SEM.
Fig. 17. Steel B27 – after hardening. Surface state after wear test. SEM.
Resistance to corrosion Study of corrosion resistance of steel B27 in selected states was conducted using potentiostatic measurements [4]. Samples were tested in delivered state (1), after hardening (2) and after hardening and tempering at temperatures: 200 (3), 400 (4) and 600°C (5). Average results of the potentiostatic measurements are shown in table 5 and densities of corrosion current are also presented in figure 18.
Tab. 5. Average results of the potentiostatic measurements of steels B27 after different heat treatment in corrosive solution 3% NaCl.
Heat treat.
E0
[mV] ik
[μA/cm2] βa
[mV/dec] Βk
[mV/dec]
1 -609,15 7,34 56,5 -943,5
2 -460,20 2,56 43,8 -231,0
3 -556,45 4,24 45,2 -315,0
4 -489,45 6,15 49,8 -450,0
5 -553,30 4,09 64,8 -436,0
1- B27, as delivery, 2- B27, hardening, 3- B27, hard/temp.200oC, 4- B27, hard/temp.400oC, 5- B27, hard/temp.600oC
Fig. 18. Densities of corrosion current of steels B27 after different heat treatment in corrosive solution 3% NaCl.
The study shows that the largest current density occurs in the investigated steel in delivered state. Hardening produces a decrease of corrosion current density. Subsequent tempering at 200 and 400°C causes a gradual increase in density, and again after tempering at 600° C density lowered to a value similar to that after tempering at 200o C. 4. Conclusion The following conclusions can be drown from presented investigations. Basic strength parameters of the steel B27, R0,2 and Rm, are relatively low in delivered and after normalization states, whereas the high values of these parameters are obtained after treatments such as hardening and hardening/tempering at 200oC. Greater toughness and less tendency to brittle fracture, in the operating temperature range of most devices from 20° to -40° C, also occurs in the states after hardening and tempering in comparison to the states as delivery and after normalization. In the last two states a large share of brittle fracture during the impact test is taking place even at 20o C. Both abrasion resistance and abrasive wear mechanism are also favorable for the state after hardening and hardening and tempering. Finally, the corrosion resistance is also more advantageous for the state after hardening and hardening/tempering treatments than in delivered state. Thus using boron steel - in this case the B27 grade, but also similar – one should pay attention to its insufficient or less favorable properties for many applications in delivered state or only after normalization. Moreover, without carrying a proper heat treatment - hardening and hardening/tempering type, the potential opportunities for high mechanical and chemical properties of these modern steels can be lost.
5. References [1] Rautaruukki Corporation, P.O. Box 138, Fl-00811 Helsinki, Finland. [2] Frydman S., Konat Ł., Łętkowska B., Pękalski G., Impact resistance and fractography of low-alloy martensitic steels, Arch. of Foundry Eng., spec. iss. 1, vol. 8, 2008, 89-94. [3] Łętkowska B., Frydman S., Wear Resistance of lowcarbon steels with boron, Material of conference XXXIX Szkoła Inżynierii Materiałowej, Kraków-Krynica 27-30 IX 2011. [4] Łętkowska B., Klakočar-Ciepacz M., Dudziński W., Evaluation of corrosion rate for selected grades of steal at different stages of heat treatment, Ochrona przed Korozją, vol. 5, 2012, 195-199.
0
0.2
0.4
0.6
0.8
1
1 2 3 4 5 6 7 8 9 10
Kb,
av
0
5
10
1 2 3 4 5
i cor[µ
A/c
m2 ] 1- as delivery
2- hardening3- hard/temp.200oC4- hard/temp.400oC5- hard/temp.600oC
46
Top Related