


Languages
Pages
Legal


Profile of the Profession 2018
December 2018

Page 2
Contents
Foreword from President 3
Executive summary 5
1. Introduction and context 10
2. Profile of respondents 13
3. Earnings and bonuses 41
4. Partnership and career aspirations 47
5. Work patterns 60
6. Discrimination, bullying, harassment and sexual harassment
71
7. Views on future actions by the Law Society of Scotland and others
90

Page 3
Foreword from President
The publication of the 2018 Profile of the Profession report is a landmark for the Law
Society of Scotland and for the legal profession. With over 2700 full responses, it’s the
biggest survey of its kind in Scotland. It gives us unique insight; lets us hear directly from
solicitors and accredited paralegals about their experiences; and allows us to hear
collectively what the profession wants to see changed. This enables us to better
understand the issues affecting the legal profession and helps us to define ways to tackle
these underlying problems.
I am proud that we choose to look so closely at the issue of equality and diversity and
proud of the steps we have taken over the past five years to improve matters and proud
of the actions we have set out for next five years.
I do have mixed emotions about the survey results. Pleased on the one hand that while
there is still more to do, we have made real progress in many areas of equality and
diversity, but I am also saddened that any member of the legal profession has
experienced bullying or discrimination.
For example, I was pleased that the results show that the gender pay gap within the
profession has reduced from 42% in 2013 when the Profile of the Profession research
was last carried out to 23% in 2018. I was also heartened to read that the majority of
respondents felt that they were or mostly were achieving a reasonable work-life balance.
But I was saddened that 20% of respondents had at some stage personally experienced
discrimination in the profession in the past five years. There is no place in the profession
for discrimination.
We want the Scottish legal profession to be diverse and fair, accessible to anyone with
drive and talent who dreams of joining the legal profession, regardless of their
background. We want people who join the legal profession to have a long, fulfilling
career.
That’s why we have worked with law firms and other employers to promote the benefits
of flexible working, created equality and diversity standards, launched our wellbeing
project and set up the Lawscot Foundation to support young people from disadvantaged
backgrounds through their legal education journey.
We have set out 28 recommendations to address equality and diversity issues within the
profession which includes continuing to work with employers, representative groups
such as the Glass Network, Women in Law Scotland and SEMLA, as well as our members
to ensure we stamp out bullying and discrimination in the legal profession.
I would like to thank the individual solicitors and accredited paralegals who took the time
to fill in the survey. Every single respondent to this survey deserves our gratitude. It is
only through the data we gather over a number of years that we can see where progress
is being made and where there is more work to be done.

Page 4
I want to thank the members of the Law Society of Scotland Equality and Diversity
Committee who show their commitment and give their time freely to help us make our
profession a place where all who have the talent, drive and knowledge can thrive. In
particular, I would like to thank Iain Burke who has chaired that committee for the past
three years and under whose leadership huge steps were made and to our newly
appointed convener Susan Murray who I know is already excited to take our work in this
area to new levels.
We won’t move forward on these issues just by talking about it. We need to push for the
adoption of robust policies and procedures by employers. As the professional body for
solicitors and accredited paralegals, we will redouble our efforts on the work we carry
out to ensure that the legal profession is a place where all people, regardless of
background, can flourish.
Alison Atack
President
Law Society of Scotland

Page 5
Executive summary
The Law Society of Scotland’s Profile of the Profession 2018 survey was open from May
to June 2018. The survey sought the views of practising and trainee solicitors, non-
practising members, those retained on the roll and Accredited Paralegals.
Prior to the 2018 survey, a Profile of the Profession survey was last conducted in 2013.
Wherever appropriate and where relevant comparators within previous POP surveys
were available, these have been included in this report to assist understanding of how
the profession has changed over time.
Rocket Science was provided with anonymous data on the solicitor profession from the
Registrars Department of the Law Society to calculate response rates and compare
respondent data to that of the wider profession.
Responses to questions, eg on pay and progression within the profession, have been
analysed by protected characteristics where there was sufficient data and where
anonymity could be preserved.
Having analysed the data, the key messages are:
• The majority of respondents have considered leaving the profession in the last
five years
• Work-life balance in the profession for those who responded to the survey could
be improved
• There continues to be progression issues related to gender and ethnicity
• Respondents report a perception that discrimination, bullying, harassment and
sexual harassment occur frequently in the profession
• A third of LGBT+ respondents were not, or would not be, entirely comfortable
being out at work
• The majority of respondents think there have been improvements in gender
equality
• Many respondents with disabilities who required an adjustment had either not
been provided with a reasonable adjustment or were too apprehensive about
the response to request an adjustment.

Page 6
Key messages:
The majority of respondents have considered leaving the profession in the last five years
• 54% of respondents have considered leaving the profession in the past five years. Respondents most frequently cited their work-life balance as a reason for considering leaving the profession.
• While 30% of respondents who were trainees have considered leaving the profession, this figure was 69% for those who have been qualified for six-ten years.
• Respondents most frequently felt that achieving an improved work-life balance was their most important career aspiration over the next five years. This was followed by the aspiration for promotion or progression.
• A higher proportion of female than male respondents had considered leaving the profession across categories of time since qualification, except 31+ years PQE.

Page 7
Work-life balance in the profession for those who responded to the survey could be improved
• 24% of respondents felt that they were, and a further 49% of respondents felt that they mostly were, achieving a reasonable work-life balance.
• 83% of respondents stated that they worked some hours in addition to their contracted hours and 92% of those who work additional hours are never paid overtime.
• The percentage of respondents who have access to flexible working has reduced since 2013. Having access to flexi-time appears to have an impact on respondents feeling that they are achieving a reasonable work-life balance: 87% of those who have access to flexi-time and feel comfortable to use it feel that they are or mostly are achieving a reasonable work-life balance compared to 68% of those who do not have access to flexi-time.
• 83% of respondents felt that women leave the profession in their 30s and 40s for a better work-life balance elsewhere.
There continues to be progression issues related to gender and ethnicity
• A higher proportion of female than male respondents spent longer as a senior associate or similar level below partnership before becoming a partner.
• For both annual earnings and expected bonuses, a higher proportion of male than female respondents earn higher incomes.
• A higher proportion of White Scottish or British respondents earned over £60,000 when compared with White – Other and All other ethnic groups.

Page 8
Respondents report a perception that discrimination, bullying, harassment and sexual harassment occur frequently in the profession
• 20% of respondents had at some stage personally experienced discrimination in the profession.
• A higher proportion of female respondents had personal experience of bullying, harassment and sexual harassment over the past five years compared with male respondents.
• 44% of respondents felt that bullying was either systemic or frequently occurred in the legal profession.
• Respondents provided suggestions of actions which could address discrimination and harassment in the legal profession (see Chapter 6).
A third of LGBT+ respondents were not, or would not be, entirely comfortable being out at work
• 22% of respondents said they would be comfortable being out to a certain amount or limited group of people and 11% said they would not at all be comfortable being out at work about their sexual orientation.
The majority of respondents think there have been improvements in gender equality
• Just under 80% of respondents thought that gender equality in the profession had improved either to some extent or to a great extent in the last five years.

Page 9
Experience of respondents with disabilities
• 37% of respondents with disabilities who required an adjustment had either not been provided with a reasonable adjustment or were too apprehensive about the response to request an adjustment.

Page 10
1. Introduction and context
The Law Society of Scotland’s Profile of the Profession 2018 survey was open from May
to June 2018. The survey sought the views of practising and trainee solicitors, non-
practising members, those retained on the roll and Accredited Paralegals.
Respondents were provided with the following information:
To assist the Law Society in effectively supporting and representing members of
the profession, it is important to understand the current composition and
demographic profile of the membership and your views and concerns.
The findings will be used to create an up-to-date demographic profile of the
profession and to assist with policy creation and future projects that may be
identified from the results of the research.
Prior to the 2018 survey, a Profile of the Profession survey was last conducted in 2013.
Where possible, 2013 survey results have been analysed alongside 2018 results to
highlight areas of stability and change. In some instances, due to rounding, percentages
will not add up to exactly 100%.
Rocket Science was provided with anonymous data on the solicitor profession from the
Registrars Department of the Law Society to calculate response rates and compare
respondent data to that of the wider profession.
Previous survey results have helped the Law Society to1:
• Develop and promote its equality and diversity standards to practice units
• Undertake further, more detailed research into specific areas, including a
transgender experience case study, perceptions and impacts of working
patterns within the legal profession, and experiences of established legal
professionals within the profession
• Focus on gender equality in the legal profession by publishing the sector
gender pay gap in 2015 and running a year-long 'conversation on
progression’ in 2016
• Use its better understanding of the experiences of parents in the
profession, hosting events for those returning to work, and publishing well-
received parents in the profession guidance.
1 https://www.lawscot.org.uk/research-and-policy/equality-and-diversity/research/profile-of-the-profession/

Page 11
A total of 2,746 individuals provided a complete response to the 2018 Profile of the
Profession survey.
Response rates:
Type Total Respondents Response rate
Accredited Paralegals and Trainee Accredited Paralegals
502 184 37%
Trainees 1,056 230 22%
Solicitors 11,779 2,140 18%
Retained on the roll and Non-Practising Members
2,499 53 2%
Additional respondents:
Type Respondents
Not working – Qualified solicitor but not retained 5
Other sectors - Other 33
Other legal professionals 97
The viewpoints expressed in this report are those which were submitted to the 2018
Profile of the Profession survey and do not necessarily reflect the views of Rocket
Science UK Ltd or the Law Society.
Page 12
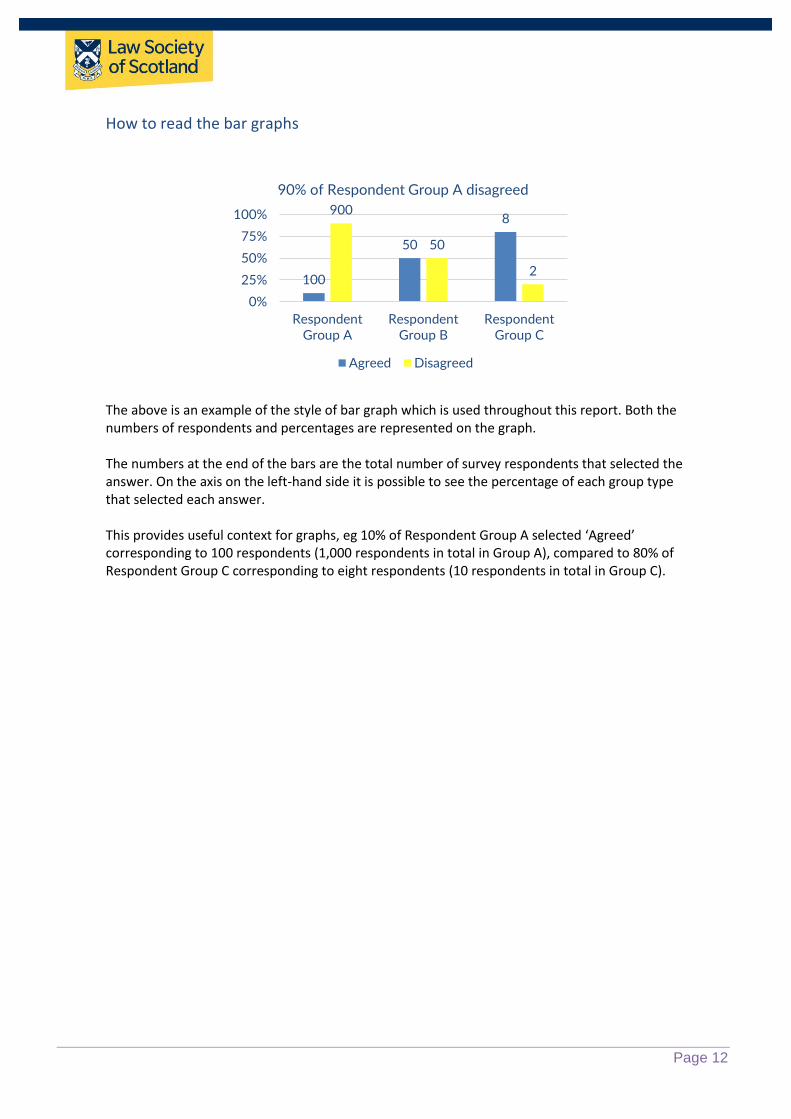
How to read the bar graphs
The above is an example of the style of bar graph which is used throughout this report. Both the numbers of respondents and percentages are represented on the graph. The numbers at the end of the bars are the total number of survey respondents that selected the answer. On the axis on the left-hand side it is possible to see the percentage of each group type that selected each answer. This provides useful context for graphs, eg 10% of Respondent Group A selected ‘Agreed’ corresponding to 100 respondents (1,000 respondents in total in Group A), compared to 80% of Respondent Group C corresponding to eight respondents (10 respondents in total in Group C).
100
50
8900
50
2
0%
25%
50%
75%
100%
RespondentGroup A
RespondentGroup B
RespondentGroup C
90% of Respondent Group A disagreed
Agreed Disagreed

Page 13
2. Profile of respondents
Working in the legal profession
Respondents were asked whether they were currently working in the legal profession.
97% (n=2,640) stated that they were working in the legal profession, while 3% (n=93)
were not.
Current position within a firm or organisation
The largest respondent group was those working in Private practice as an equity partner,
at 14% (n=388). 4% of respondents (n=97) selected the open text option ‘other legal
professional (advocate, legal academic, sheriff, senator) please specify’. Responses in this
category included:
• Legal academic or lecturer
• In-house professional
• Solicitor in Private practice
• Advocate
• Consultant
• Working in a policy role
• Procurator fiscal
• Sheriff or judge
5
20
23
30
30
33
36
61
65
94
97
137
148
150
164
171
200
237
326
327
388
0% 5% 10% 15%
Not working - Qualified solicitor but not retained
Private practice - Professional Support Lawyer
Not working - Non-Practising Member
Not working - Retained on the roll
Other sectors - Trainee Solicitor
Other sectors - Other
Other sectors - Accredited Paralegal
Private practice - Consultant
Private practice - Other
Other sectors - Director, or equivalent
Other legal professional, please specify
Other sectors - Team manager, or equivalent
Private practice - Accredited Paralegal
Private practice - Senior Associate
Private practice - Salaried Partner
Other sectors - Senior team member, or equivalent
Private practice - Trainee Solicitor
Private practice - Associate
Other sectors - Solicitor team member, or equivalent
Private practice - Assistant
Private practice - Equity Partner
Respondents' current positions (n=2,742)

Page 14
Gender and current position
An analysis of the most frequently described positions by gender highlights the following:
A significantly higher proportion of male respondents than female respondents were
equity partners. Amongst female respondents, 8% were Accredited Paralegals (n=138),
compared to 1% for male respondents (n=10).
40
58
86
94
95
112
120
138
148
166
215
227
53
38
46
69
52
57
267
10
51
67
106
98
0% 10% 20% 30%
Other sectors - Director, or equivalent
Other legal professional (advocate, legal academic,sheriff, senator) please specify:
Other sectors - Team manager, or equivalent
Private practice - Salaried Partner
Private practice - Senior Associate
Other sectors - Senior team member, or equivalent
Private practice - Equity Partner
Private practice - Accredited Paralegal
Private practice - Trainee Solicitor
Private practice - Associate
Other sectors - Solicitor team member, or equivalent
Private practice - Assistant
The greatest difference in proportions between genders is in Private practice equity partners, where 26% (male) compares to 7% (female)
Male (n=1022) Female (n=1682)

Page 15
An examination of female and male respondents who were equity partners by the length
of time since their traineeship highlights the following:
Amongst those who completed their traineeship or apprenticeship between zero and 15
years ago, 5% of male respondents were equity partners, compared to 2% of female
respondents.
Completion of a traineeship or apprenticeship
Respondents were asked to provide information about how many years ago they
completed their traineeship or apprenticeship, whether or not they had worked in law
since:
105, 19%
246, 42%
14, 2%
19, 5%
0% 10% 20% 30% 40% 50%
Female - 16+ years (n=539)
Male - 16+ years (n=587)
Female - 0-15 years (n=781)
Male - 0-15 years (n=357)
Amongst male respondents who completed their traineeship or apprenticeship more than 16 years ago, 42% were equity partners,
compared to 19% for female respondents
232
93
409
372
275 273
482
337
62
12
0%
5%
10%
15%
20%
I amcurrently a
traineesolicitor
Less thanone year
One tofive years
Six to tenyears
11 to 15years
16 to 20years
21 to 30years
31 to 40years
41+ years Irequalified
intoScotland
fromanother
jurisdiction
Just under one-fifth of respondents qualified between 21 and 30 years ago (n=2,547)

Page 16
Description of main employment or employer
Over a third of respondents (34%, n=942) worked in Private practice, in an organisation
with 16 or more partners. This proportion is similar to Profile of the Profession survey
data collected in 2013, where 35% identified this type of employment. Additional
categories of employment were added in 2018, which may explain variation between the
two surveys.
Employment/Employer 2013 (n=3,075) 2018 (n=2,738)
Sole Practitioner 6% 6%
Private practice - two to five partners 21% 17%
Private practice - six to ten partners 8% 6%
Private practice – 11 to 15 partners 3% 2%
Private practice - 16 or more partners 35% 34%
Private practice - Other N/A 1%
Other sectors - Local government 6% 7%
Other sectors - Central government (Scottish or UK) 3% 4%
Other sectors - COPFS 3% 4%
Other sectors - Other public body 4% 1%
Other sectors - Charity sector 1% 1%
Other sectors - Commercial organisation 7% 6%
Other sectors - Higher or further education 1% 1%
Other sectors - Other 2% 1%
Other sectors - Professional and regulatory bodies N/A 2%
Other sectors - Financial services organisation N/A 3%
Not working - Career break N/A 0%
Not working - Unemployed N/A 0%
Not working - Retired N/A 1%
Not working - Sabbatical N/A 0%

Page 17
Areas of law
Survey respondents were asked to indicate all areas that they currently worked in:
One-fifth of respondents (n=554) provided an additional area of law. These included:
• Agricultural, rural and environmental
• Charities
• Property and real estate
• Banking, financial and investment
• Construction
• Education
• EU law
• Housing
• Insurance
• Licensing
• Mental health
• Planning
58
112
130
139
215
249
253
261
283
320
326
332
360
453
531
554
565
715
0% 10% 20% 30%
Immigration and asylum
Consumer and civil rights
Social welfare
Media, IT and intellectual property
Energy, utilities and transport
Money and debt
Accident and injury
Employment and pensions
Business premises
Crime
Administrative and public
Family
Regulation and compliance
Dispute resolution
Residential property
Other
Private client
Company and commercial
Percentage of respondents (n=2,726)
Over a quarter of respondents selected 'company and commercial' as an area of law that they currently worked in

Page 18
Gender and areas of law
The top five areas of practice for male and female respondents were as follows:
Male respondents Female respondents
1. Company and commercial (31%, n=313) 1. Company and commercial (24%, n=393)
2. Private client (21%, n=213) 2. Other (21%, n=356)
3. Residential property (20%, n=203) 3. Private client (21%, n=349)
4. Dispute resolution (18%, n=186) 4. Residential property (19%, n=321)
5. Other (18%, n=186) 5. Dispute resolution (16%, n=262)
0% 10% 20% 30%
Immigration and asylum
Consumer and civil rights
Social welfare
Media, IT and intellectual property
Energy, utilities and transport
Money and debt
Accident and injury
Employment and pensions
Business premises
Crime
Administrative and public
Family
Regulation and compliance
Dispute resolution
Residential property
Other
Private client
Company and commercial
A significantly higher (>5%) proportion of male than female respondents currently work in 'company and commercial' law, 'crime' and 'business
premises'
Female % (n=1672) Male % (n=1012)

Page 19
Sheriffdom(s) or geographical area(s) of work
Respondents were asked to provide information about the sheriffdom(s) or geographical
area(s) that they worked in and could select more than one area. Of those who provided
information about the sheriffdoms or geographical areas in which they worked:
• 71% worked in one area
• 17% worked in between two and five areas
• 12% worked in between six and ten areas
46% of respondents stated that they worked in Lothian and Borders and 36% in Glasgow
and Strathkelvin, making these the two most frequent locations. The above survey
findings agree with Registrars data which shows Lothian and Borders, Glasgow and
Strathkelvin and Grampian, Highland and Islands to be the areas in which legal
professionals most frequently work.
35
135
201
282
513
515
696
746
991
1,257
0% 10% 20% 30% 40% 50%
Northern Ireland
EU/EEA Country
International
England and/or Wales
North Strathclyde
South Strathclyde, Dumfries and Galloway
Tayside, Central and Fife
Grampian, Highland and Islands
Glasgow & Strathkelvin
Lothian and Borders
Just under half of respondents worked in Lothian and Borders (n=2,722)

Page 20
A comparison with 2013 data shows the following:
1%
5%
7%
10%
19%
19%
26%
27%
36%
46%
1%
2%
4%
11%
16%
17%
22%
25%
32%
43%
0% 10% 20% 30% 40% 50%
Northern Ireland
EU/EEA Country
International
England and/or Wales
North Strathclyde
South Strathclyde, Dumfries and Galloway
Tayside, Central and Fife
Grampian, Highland and Islands
Glasgow & Strathkelvin
Lothian and Borders
Comparison between sheriffdom(s) or geographical area(s) where respondents worked from 2013 and 2018. It was possible to select more
than one answer option
2013 2018

Page 21
Age of respondents
The above survey findings broadly agree with Registrar data which shows that 32% of all
solicitors in Scotland are aged between 26 and 35, 26% are between 36 and 45, 23% are
between 46 and 55 and 15% are between 56 and 65.
Age of qualification
Respondents most frequently qualified between the ages of 23 and 26 years old (62%,
n=1,581). This compares to a proportion of 73% in 2013. 83% of respondents qualified
before they were 30 years old (n=2,118):
Age of qualification Frequency Percentage
Under 23 232 9%
23-26 1,581 62%
27-29 305 12%
30-34 164 6%
35+ 136 5%
N/A 133 5%
Total 2,551 100%
111
880
654 647
372
46 12 100%
10%
20%
30%
40%
Under 25 25-35 36-45 46-55 56-65 66-72 73 andolder
Prefer notto say
Just under a third of respondents were between 25 and 35 years old (n=2,732)

Page 22
Gender identity and sexual orientation
61% of respondents identified as female (n=1,682), 37% identified as male (n=1,024), 1%
(n=23) stated that they would prefer not to say their gender identity, and less than 1%
identified as intersex, non-binary, or a different term (n=2, n=2 and n=3 respectively).
Eight respondents identified as transgender and 25 respondents stated that they would
prefer not to say.
In comparison, Registrar data shows that:
• 53% of all solicitors, those retained on the roll and non-practising members
identify as female and 47% identify as male
• 94% of Accredited Paralegals and Trainee Accredited Paralegals identify as
female and 6% identify as male
• 67% of trainees identify as female and 33% identify as male
Amongst those respondents who identified as transgender or preferred not to say, and
those respondents who described their gender identity as non-binary, intersex, a
different term or preferred not to say:
• 33% stated that they were, or would be, comfortable being out at work
about their gender identity to all
• 8% were or would be comfortable being out at work about their gender
identity to a certain amount/limited group of people
• 54% said that they would prefer not to say whether they felt comfortable
• 5% said they would not at all be comfortable being out at work about their
gender identity
61%
37%
1% <1% <1% <1%0%
25%
50%
75%
Female Male Prefer not tosay
I prefer to usea different
term (pleasespecify)
Non-binary Intersex
Respondents most frequently described their gender identity as female (n=2,736)

Page 23
91% of respondents described their sexual orientation as heterosexual or straight
(n=2,487), 4% preferred not to say (n=101), 3% as gay man (n=73), 2% as bisexual (n=44)
and 1% as lesbian (n=20). Less than 1% of respondents preferred to use a different term
or identified as pansexual or asexual.
A lower proportion of respondents identified as heterosexual or straight when compared
with 2013:
2013 2018
Heterosexual/straight 94% 91%
Lesbian, gay man, bisexual or other 3% 5%
Prefer not to answer the question 3% 4%
Amongst those who described their sexual orientation as gay man, lesbian, bisexual,
pansexual, asexual, a different term or preferred not to say:
• 40% (n=100) said they were, or would be, comfortable being out at work
about their sexual orientation to all
• A further 22% (n=54) said they would be comfortable being out to a certain
amount/limited group of people
• 27% (n=66) stated they would prefer not to answer the question
• 11% (n=28) said that they would not at all be comfortable being out at
work about their sexual orientation

Page 24
Ethnicity
Ethnic group
84.6% of respondents described their ethnic group as White – Scottish. Amongst the
general population, this figure is 84%2. In the 2013 Profile of the Profession, 86% of
survey respondents described their ethnic group as White – Scottish.
In addition:
• 7.4% of survey respondents described their ethnic group as White – Other
British; this figure is 7.9% amongst the general population3
• 1.2% of the general population is Polish4; however, this figure was less than
0.001% amongst survey respondents
• 2.7% of the general population is Asian,5 compared to 1.7% amongst survey
respondents, suggesting some under-representation of this group in the
legal profession.
Respondents most frequently described their ethnic group as the following:
Ethnic group %, count
White - Scottish 85%, n=2,320
White – Other British 7%, n=204
Other White ethnic group 2%, n=51
White – Irish 1%, n=41
Other ethnic group 1%, n=40
Pakistani, Pakistani Scottish or Pakistani British 1%, n=27
Mixed or multiple ethnic groups 1%, n=27
2 http://www.scotlandscensus.gov.uk/documents/censusresults/release2a/rel2asbfigure2.pdf 3 Ibid. 4 Ibid. 5 Ibid.

Page 25
Less than 1% of respondents identified their ethnic group as:
• Chinese, Chinese Scottish or Chinese British
• Indian, Indian Scottish or Indian British
• Arab, Arab Scottish or Arab British
• White – Polish
• White – Gypsy/Traveller
• African, African Scottish or African British
• Caribbean, Caribbean Scottish or Caribbean British
• Black, Black Scottish or Black British
• Bangladeshi, Bangladeshi Scottish or Bangladeshi British
• Asian, Asian Scottish or Asian British – Other.
A comparison between 2013 and 2018 data shows similar proportions of white and other
ethnic group respondents:
Ethnic group 2013 2018
White - Scottish, British, Irish, Gypsy/Traveller, Polish, Other white ethnic group 96% 96%
Any other ethnic group 2% 4%
Did not specify 1% N/A

Page 26
Ethnicity and current position
An analysis of the most frequently described positions by ethnicity highlights:
A higher proportion of ‘White Scottish and British’ respondents were equity partners
compared with the other two groups. A higher proportion of ‘All other ethnic groups’
respondents were salaried partners and solicitor team members in other sectors.
Amongst ‘White – Other’ respondents, a higher proportion were senior team members
in other sectors when compared to the other two groups.6
6 ‘White – Other’ includes: ‘White – Polish’, ‘White – Irish’, ‘White – Gypsy/Traveller’ and ‘Other white ethnic group’.
‘All other ethnic groups’ includes: ‘African, African Scottish or African British’, ‘Arab, Arab Scottish or Arab British’, ‘Asian, Asian Scottish or Asian British – Other’, ‘Bangladeshi, Bangladeshi Scottish or Bangladeshi British’, ‘Black, Black Scottish or Black British’, ‘Caribbean, Caribbean Scottish or Caribbean British’, ‘Chinese, Chinese Scottish or Chinese British’, ‘Indian, Indian Scottish or Indian British’, ‘Mixed or multiple ethnic groups’, ‘Other ethnic group’ and ‘Pakistani, Pakistani Scottish or Pakistani British’.
90
83
130
152
134
151
365
145
183
213
297
300
0
6
2
3
7
11
11
0
8
15
12
13
4
8
5
9
9
9
11
3
8
8
17
14
0% 4% 8% 12% 16%
Other sectors - Director, or equivalent
Other legal professional (advocate, legal academic,sheriff, senator) please specify:
Other sectors - Team manager, or equivalent
Private practice - Salaried Partner
Private practice - Senior Associate
Other sectors - Senior team member, or equivalent
Private practice - Equity Partner
Private practice - Accredited Paralegal
Private practice - Trainee Solicitor
Private practice - Associate
Other sectors - Solicitor team member, orequivalent
Private practice - Assistant
A higher proportion of White Scottish and British respondents were equity partners when compared with the other two groups
All other ethnic groups White - Other White - Scottish and British

Page 27
Disability
Respondents were provided with the following information:
Section 6 of the Equality Act 2010 sets out the circumstances in which a
person is considered ‘disabled’. It says:
A person (P) has a disability if:
• (a) P has a physical or mental impairment, and
• (b) the impairment has a substantial and long-term adverse effect on
P's ability to carry out normal day-to-day activities
In consideration of the above:
In 2013, 4% of respondents considered themselves to have a disability.
In 2018, of those who considered themselves to have a disability:
• 37% had a long-term illness, disease or condition (n=46)
• 21% had a physical disability (n=27)
• 13% had stress and anxiety (n=17)
• 13% had deafness or partial hearing loss (n=17)
• 10% had a learning difficulty eg dyslexia (n=12)
• 9% had another mental health condition (n=11)
Fewer than ten respondents identified themselves as having another condition or
disability, blindness or partial sight loss, development disorder, learning disability or
preferred not to say.
2,615, 95%
126, 5%
5% of respondents considered themselves to have a disability (n=2,741)
No
Yes

Page 28
Those who considered themselves to have a disability were asked whether they required
reasonable adjustments to be made. 46% (n=57) stated that they did not need an
adjustment, 45% (n=56) identified that they did need an adjustment and a further 9%
(n=11) preferred not to say.
Of those who did need an adjustment:
The remaining 37% either requested an adjustment which was not provided, or had not
requested an adjustment due to being apprehensive about the response.
Amongst those who requested and were provided with an adjustment, these included:
Changes to working hours, leave or location
Four-day working week
Additional days of sick leave
Home working
Flexible hours
Changes to equipment or facilities
Adapted computer or telephone equipment
Trolley to move files
Standing desk
Allocated parking
Location of desk or office
Hearing aids
Speech recognition or translation software
Changes to role Reduced roles to relieve anxiety
Dividing up project work with other colleagues
8
13
35
0% 25% 50% 75%
Yes, adjustment requested but not provided
Yes, but I have not requested an adjustment as Iam apprehensive about the response
Yes, adjustment requested and provided
Of those who did need an adjustment, 63% requested and were provided with an adjustment (n=56)

Page 29
Religion
Less than 1% of respondents described themselves as Jewish, Sikh, Hindu or Buddhist.
49% of respondents indicated that they did not belong to a religion, religious
denomination or body, compared to 46% in 2013. In addition, 25% described belonging
to the Church or Scotland, compared with 30% in 2013.
31
39
71
171
384
691
1,337
0% 25% 50%
Other (please specify)
Muslim
Prefer not to say
Other Christian
Roman Catholic
Church of Scotland
None
Just under half of respondents selected 'none' when asked about belonging to a religion, religious denomination or body (n=2,473)

Page 30
Legal marital or civil partnership status
Respondents most frequently indicated that they were married (59%, n=1,627).
Legal marital or civil partnership status 2013 2018
Married 63% 59%
Never married and never registered a same-sex civil partnership 30% 20%
Cohabiting N/A 12%
Divorced 4% 3%
Separated, but still legally married 2% 2%
Prefer not to say N/A 2%
Widowed 1% 1%
In registered same-sex civil partnership 1% <1%
Surviving partner from a same-sex civil partnership N/A <1%

Page 31
Dependants
45% of respondents stated that they did have dependants (n=1,245), while 55% stated
that they did not (n=1,496).
Types of dependants
Of those who did have dependants, these were most likely to be a child or children:
48 respondents stated that they had an ‘other’ type of dependant; these most frequently
were:
• A spouse or partner
• An adult child living at home or requiring support
• A disabled child
6
23
25
48
62
300
378
394
494
0% 20% 40%
Elderly parent/relative (other)
Disabled adult
Elderly parent/relative (your current partner's relative)
Other
Elderly parent/relative (your direct relative)
Child/children at university
Pre-school child/children
Child/children at secondary school
Child/children at primary school
Dependants were more likely to be a child or children than disabled adult or elderly relative (n=1,242)

Page 32
Primary caregivers of children
While between 47% and 51% of those respondents who had dependants in pre-school,
primary school or secondary school described their primary caregiver to be fairly evenly
split between themselves and their partner, this figure was 64% for children at
university.
Fewer respondents with a partner who worked full-time described their partner as the
primary caregiver of child dependants when compared with those who had a partner
who did not work. Specifically:
• 5% or fewer respondents’ partners were the primary caregivers of child
dependants across all schooling stages, if their partner worked full-time.
• Over 70% of respondents’ partners were the primary caregivers of child
dependants across schooling stages excluding university, if their partner did not
work. At university, this figure dropped to 21%.
68
111
149
103
22
92
84
85
177
184
253
193
8
8
11
9
0% 25% 50% 75% 100%
University
Secondary school
Primary school
Pre-school
Primary caregivers of child dependants
Self Partner Fairly evenly split between self and partner Other arrangement

Page 33
Male respondents seemed to be increasingly likely to see themselves as the primary
caregiver of child dependants as the child progressed through schooling stages:
Time taken off when a child or other dependant is ill
While 9% of male respondents (n=43) stated that they would primarily take time off
work when a child or other dependant is ill, this figure was 49% (n=350) for female
respondents. This represents a drop since 2013, where 59% of female respondents
stated they would primarily take time off work if a dependant was ill.
47
101
142
102
19
9
4
1
0% 25% 50%
University
Secondary school
Primary school
Pre-school
Across all stages, a larger proportion of female respondents described themselves as the primary caregiver of child dependants
Male - Self Female - Self
446
89
169
124
401
239
54
34
32
350
198
35
134
91
43
0% 25% 50%
Fairly evenly split between self and partner
Other arrangement
Partner
Partner does not work so not an issue
Self
A higher proportion of female respondents felt that they would primarily take time off when a child or other dependant is ill
Male Female All

Page 34
English as a first language
98% of respondents stated that English was their first language (n=2,699). Amongst the
2% (n=43) whose first language was not English, these most frequently included:
• German
• Gaelic
• Italian
• Punjabi
Type of school attended
Just under three-quarters of respondents attended state schools.
21% of respondents attended private schools; this compares to around 4.1% of pupils in
Scotland currently attending an independent school,7 suggesting that those who have
attended private school are over-represented in the legal profession.
7 http://www.scis.org.uk/assets/Uploads/Facts-Figures/Annual-Census-2017.jpg
13
23
34
71
569
2,027
0% 25% 50% 75%
Other (please specify)
Prefer not to say
School outside of the UK
Both
Private school
State school
74% of respondents went to state school and 21% went to private school (n=2,737)

Page 35
University attendance for LLB completion
The most frequently attended universities for undertaking an LLB were:
15
25
26
42
43
49
59
251
408
494
552
590
0% 5% 10% 15% 20% 25%
Abertay University Dundee
Pre-Diploma route/LSS examinations
Stirling University
Robert Gordon University
Glasgow Caledonian University
Edinburgh Napier University
Didn’t attend a Scottish university – have requalified
University of Dundee
Strathclyde University
University of Aberdeen
University of Edinburgh
University of Glasgow
Universities attended for LLB completion (n=2,554)

Page 36
University attendance for LLB completion by type of school attended
While a higher proportion of those who had attended private school completed their LLB
at the University of Edinburgh and the University of Aberdeen, a higher proportion of
those who had attended state school completed their LLB at Strathclyde University and
Glasgow Caledonian University. Roughly similar proportions of respondents who
attended state and private schools completed their LLB at the University of Glasgow.
14
20
20
26
34
35
40
189
340
344
360
427
1
2
3
18
11
5
1
51
58
128
152
132
0% 10% 20% 30%
Abertay University Dundee
Pre-Diploma route/LSS examinations
Stirling University
Didn’t attend a Scottish university – have requalified
Edinburgh Napier University
Robert Gordon University
Glasgow Caledonian University
University of Dundee
Strathclyde University
University of Aberdeen
University of Edinburgh
University of Glasgow
University attendance for LLB completion by type of school attended
Attended private school Attended state school

Page 37
Profile of parents or carers
Occupations
Respondents were asked what the occupations or most recent occupations of their
parents or main carers were at the time they started studying for their degree.
If a respondent had one main parent or carer, they were asked to select ‘not applicable’
for their second parent or carer. 210 respondents selected not applicable for their
second parent or carer.
Of those respondents who provided information on the occupations of their parents, the
most frequent response was ‘professional’ – 30% of parents or main carers had this
occupation at the time respondents started studying for their degree:
7
11
48
61
106
134
156
156
197
401
505
531
567
864
1,630
0% 20% 40%
Not known
Legal - advocate
Legal - other
Prefer not to say
Deceased
Other
Executive
Legal - solicitor
Unemployed
Full-time parent (carer)
Self-employed
Unskilled
Managerial
Skilled
Professional
30% of all parents or main carers had professional occupations at the time respondents started studying for their degree (n=5,374)

Page 38
University attendance
36%
61%
0% 1% 1%
61% of all parents or main carers did not attend university (n=5,435)
Attended university
Did not attend university
Don't know
N/A
Prefer not to say

Page 39
Profile of Accredited Paralegals
Accredited Paralegals working in Private practice and Accredited Paralegals working in
other sectors were asked about their qualifications, the areas of practice which they
were accredited in and their long-term career aspirations.
Qualifications
Strathclyde University/Central Law Training paralegal qualifications were the most
frequently held type of qualification for Accredited Paralegals:
Less than 5% of Accredited Paralegals:
• Did not have any formal qualifications
• Had an LLB and a Diploma in Professional Legal Practice
• Had an LLB from a Scottish university
11
12
14
17
23
36
129
0% 25% 50% 75%
BA (Law)
Stirling University/Scotia Law Training paralegalqualification
Professional Development (PDA) in paralegal studies
HNC in Legal Studies (or similar)
HND in Legal Studies
Other
Strathclyde University/Central Law Training paralegalqualification
70% of Accredited Paralegals held a Strathclyde University/Central Law Training paralegal qualification (n=184)

Page 40
Accreditation in areas of practice
Accredited Paralegals were most frequently accredited in residential conveyancing (46%)
or wills and executries (28%):
Less than 5% of Accredited Paralegals were accredited in employment law, liquor
licensing, re-mortgage, civil litigation: reparation law, or civil litigation: repossession
litigation.
Aspirations
Accredited Paralegals were asked to select their most important long-term career
aspiration. This group most frequently identified an ‘improved work-life balance’ (25%,
n=46), or ‘promotion or progression’ (23%, n=41) as their most important aspiration:
Aspiration Frequency Percentage
Improved work-life balance 46 25%
Promotion or progression 41 23%
Increased salary 27 15%
Qualify as a solicitor 18 10%
Help others 16 9%
Upskill or specialise 13 7%
Other (please specify) 13 7%
Become an Accredited Paralegal in a different area of law 7 4%
Total 181 100%
7
8
11
15
25
52
85
0% 25% 50%
Company Secretarial
Criminal Litigation
Commercial conveyancing
Civil litigation: family law
Civil litigation: debt recovery
Wills and executries
Residential conveyancing
46% of Accredited Paralegals were accredited in residential conveyancing (n=183)

Page 41
3. Earnings and bonuses
Full-time or full-time equivalent earnings excluding bonuses
Across all respondents, 66% earned up to £60,000 per annum excluding bonuses, while
18% earned £80,001 or above. 12% earned over £100,000 and 6% earned more than
£150,000.
Bonuses
43% (n=1,169) of respondents stated that the organisation they worked for does not
offer bonuses. An additional 18% (n=492) selected that their organisation does offer
bonuses but that they did not expect to be paid a bonus. 5% (n=141) preferred not to say
whether they expected to be paid a bonus. The remaining 34% provided detail about
how much they would normally expect to be paid in bonuses per annum (n=931):
21
504
758
517
349
157 178 15395
0%
10%
20%
30%
28% of respondents earned between £30,001 and £45,000 per annum excluding bonuses (n=2,732)
356
206
99 8749 44
90
0%
25%
50%
38% of those who provided detail on their expected bonus per annum said this would be less than £1,000 (n=931)

Page 42
Relationship between earnings and bonuses
A higher proportion of those with incomes of £100,001-£150,000 or over £150,000
expected bonuses of more than £10,000. However, 39% of those with incomes of over
£150,000 stated that they did not expect to be paid a bonus even though their
organisation does offer them.
Full-time or full-time equivalent earnings and bonuses by gender
For both annual earnings and expected bonuses, a higher proportion of male than
female respondents earn higher incomes:
11
392
522
324
204
77 69
35 399
109
228
186
137
77
106117
50
0%
5%
10%
15%
20%
25%
30%
35%
Current salary excluding bonuses - A higher proportion of female respondents earn up to £60,000 compared to male respondents, and this
trend reverses for salaries above £60,001
Female Male

Page 43
While the 2013 Profile of the Profession survey did not include a question on bonuses, data on salaries by gender in 2013 showed
similar trends to 2018 in terms of male respondents receiving higher salaries than female respondents. The 2013 survey data
demonstrated that a higher proportion of female than male respondents earned between £15,000 and £45,000, a trend which is also
evident in the 2018 survey results.
297
252
142
6348
20 1633
191
103
62
36 3829 26
56
0%
20%
40%
I do not expect to bepaid a bonus, but theorganisation I work
for does offerbonuses
Less than £1,000 £1,001-£3,000 £3,001-£5,000 £5,001-£10,000 £10,001-£15,000 £15,001-£20,000 More than £20,000
Expected bonus per annum - Of those who work in organisations which do offer bonuses, male respondents are more likely than female respondents to expect to be paid bonuses of more than £5,000
Female Male

Page 44
Gender pay gap
Earnings
Amongst solicitors working in the profession, female respondents earned on average
77% of what male respondents earned. The gender pay gap was calculated by finding the
median category of earnings for male and female respondents and taking the midpoint
of this category. For female respondents, this was £42,500.50 and for male respondents,
this was £55,000.50.
Bonuses
Amongst respondents who indicated that they expected to receive a bonus, the bonus
gap was 50%. This means that female respondents on average expected a bonus that
was 50% of what male respondents expected. The bonus gap was calculated by finding
the median category of expected bonus earnings for male and female respondents who
expected to receive a bonus and taking the midpoint of this category. For female
respondents, this was £2,000.50 and for male respondents this was £4,000.50.
Awareness about gender pay gap
Respondents were most frequently not aware of a gender pay gap in their organisation.
21% of female respondents were aware that there was a gap but were unsure of what it
was (n=351), compared to 8% of male respondents (n=82). While 21% of male
respondents felt that there was no gender pay gap at their organisation (n=215), this
figure was 11% for female respondents (n=177):
0%
25%
50%
Yes – our organisation has
published its gender pay as per Gender Pay Gap
Reporting Regulations
Yes – the organisation has undertaken an equal pay audit
Yes – am aware there is a gap but
unsure of what the gap is
Am not aware of agap
There is no genderpay gap at myorganisation
21% of male respondents felt that there was no gender pay gap at their organisation compared to 11% of female respondents
All
Female
Male

Page 45
Earnings by ethnic group
A higher proportion of ‘White – Scottish/British’ respondents were earning over £60,000
when compared with the other two groups. This might reflect the higher proportion of
this group working as equity partners or directors.
0%
10%
20%
30%
40%
Earnings by ethnic group
White - Scottish/British (n=2,512) White - Other (n=96) All other ethnic groups (n=120)

Page 46
Time since traineeship and earnings
The earnings of trainees appear to have increased since 2013. In 2013, 97% of trainees
stated their income as up to £25,000, whereas in 2018, this was 94%, while 6% earned
between £25,001 and £45,000.
The same proportion of those with up to five years of experience earned between
£25,001 and £45,000 (77%) in 2013 and 2018; however, for this group, earnings also
appear to have increased as 14% earned between £45,001 and £80,000 in 2018, whereas
this figure was 11% in 2013.
232465
295
562
185 157
27
73
327
270 205
0%
25%
50%
75%
100%
Trainee Up to 5 years 6-10 years 11-20 years 21-30 years 31+ years
Those with a longer time since their traineeship have higher earnings
% earning less than £60,000 % earning £60,001 or more

Page 47
4. Partnership and career aspirations
Becoming a partner
Years as a senior associate or other level below partner
Respondents who were partners had most frequently been a senior associate for
between one and three years before becoming a partner (36%, n=198):
An examination of time spent as a senior associate or other level below partner before
becoming a partner by gender shows that:
• A higher proportion of male than female respondents spent six years or less
as a senior associate before becoming a partner
• Conversely, a higher proportion of female than male respondents spent
seven years or more as a senior associate before becoming partner
63
198
139
8862
0%
20%
40%
No time or lessthan a year
1-3 years 4-6 years 7-9 years 10 or more years
72% of partners were a senior associate for zero to six years before becoming partner (n=550)
18
69
45 4438
45
129
92
4424
0%
25%
50%
No time or lessthan a year
1-3 years 4-6 years 7-9 years 10 or more years
A higher proportion of female respondents spent longer as a senior associate before becoming a partner than male respondents
Female Male

Page 48
Putting oneself forward to become a partner
• 72% of partners stated that they did not have to put themselves forward to
become a partner (n=392).
• A further 21% were successful the first time they put themselves forward
(n=116).
• The remaining 7% unsuccessfully put themselves forward one or more
times before they were successful in becoming a partner. Of these, 4%
were unsuccessful once before they were successful, while 2% were
unsuccessful twice, less than 1% were unsuccessful three times and 1%
were unsuccessful four times.
An examination of how many times respondents put themselves forward before
becoming partner by gender shows that a higher proportion of male respondents did not
have to put themselves forward to be a partner:
145
51
10 7
246
65
13 9
0%
25%
50%
75%
I did not have to putmyself forward
I was successful thefirst time I put myself
forward
I was unsuccessfulonce before I was
successful
I was unsuccessfultwo or more times
before I wassuccessful
Just under three-quarters of male respondents did not have to put themselves forward to be a partner, compared to 68% of female
respondents
Female Male

Page 49
Aspirations of partnership
The importance of achieving partner status
Those who were not already partners were asked about the importance of achieving
partnership status. Excluding those who selected ‘N/A’:
• 19% stated that they do not intend to work in Private practice (n=280)
• 33% felt that achieving partner status was either not important at all or
somewhat unimportant (n=485)
• 48% felt that achieving partner status was either somewhat or very
important (n=701)
An examination by gender showed that, while roughly similar proportions of male and
female respondents felt that achieving partner status was ‘somewhat important’, a
higher proportion of male respondents felt it was ‘very important’. In addition, a higher
proportion of female respondents described achieving partner status as ‘not important
at all’:
By ethnic group, it was evident that a higher proportion of those in the ‘all other ethnic
group’ category felt achieving partner status to be ‘very important’ when compared with
the ‘White – Scottish and British’, and ‘White – Other’ groups:
185
204
152
297
158
89
68
52
131
106
0% 15% 30%
Do not intend to work in private practice
Not important at all
Somewhat unimportant
Somewhat important
Very important
A higher proportion of male respondents felt that achieving partner status was 'very important' than female respondents
Male Female

Page 50
254 257192
383
236
7
13
7
27
10
19
8 7
2319
0%
15%
30%
45%
Do not intend towork in private
practice
Not important atall
Somewhatunimportant
Somewhatimportant
Very important
A higher proportion of respondents in all other ethnic groups felt achieving partner status to be 'very important' when compared to the
other two groups
White - Scottish, British White - Other All other ethnic groups

Page 51
Those who expressed that achieving partner status was either not important at all or
somewhat unimportant were asked to comment on why they felt this way:
Theme Examples
Work-life balance
Achieving job satisfaction combined with a healthy work-life balance is more important to me.
Do not wish to be on call 24/7.
The work-life balance of a partner is typically poor and therefore not something I am particularly interested in.
Avoiding additional responsibilities and risk
Does not seem a particularly attractive or financially lucrative prospect for the associated risks and responsibilities.
I do not know whether I would wish to get into debt to potentially not get that money back should the market fall etc.
I do not wish to be responsible for other people’s lives…
Avoiding stress
Being a partner seems to involve too much stress and responsibility.
It doesn't pay enough for the additional stresses etc.
For me, this job is already incredibly stressful and reaching partner status only seems to increase that level of stress, which I do not think is healthy.
Focus on family
As I have children, I cannot give the extra hours that being a partner would require.
Becoming a partner would impact on family life, mainly due to the time involved in being a partner, and I am keen to have as much time with my family as I possibly can.
I am a mother first before I have a career.
Retirement
At a stage in my career where thinking about retiring.
Approaching retirement.
I am now working towards retirement and do not want the additional responsibility at this time in my career.
Becoming a partner can change the types of work undertaken
Actual client work seems to take a back seat in favour of managerial work.
I like the daily work of a solicitor, so I currently do not aspire to perform the partner role.
Content to practise law without the burden of management.

Page 52
Theme Examples
Have been a partner in the past
Been there, done that, lost sleep during it, enjoy sleeping now.
I have been a partner in three firms and have no wish to repeat the experience. I feel utterly ‘burned out’.
Have had experience of being a partner and found it to be the worst period of my life and caused incredible stress.
View that being a partner is about ‘status’
Being salaried partner is just a status thing; I'm more bothered about getting a good salary.
Fulfilling work is more important than status.
I feel the focus on personal status and salary over positive social impact is deeply problematic.
Barriers to partnership for women
Having worked in a previous Private practice firm where bullying of female partners went on, it is something I wouldn’t put myself into.
Whilst it is true that people from all backgrounds do become partners, for people from a state school background who do not come from middle class networks with contacts who can refer work, it is a long road which requires many hours of investment in business development, in addition to top-quality technical work. This road is even longer and more difficult for women who may struggle to be visible to (more often than not) male decision makers.
I do not think it is a realistic goal for a young female in the legal profession. I want to have a family and a work-life balance is very important to me; as such I have adjusted my goals accordingly.
Do not intend to stay in Private practice or the profession
I do not intend to keep working in the legal profession and am actively looking for other jobs.
I do not intend to stay in Private practice long enough for it to be relevant.
Not sure I'll stick around. Private legal practice is not a hugely appealing/fulfilling place to be.
Not at the stage of thinking about partnership yet
I am not currently at a stage in my career where I have ‘achieving partner status’ as a near-future goal.
I am still a trainee, so my priority is to qualify and have a successful career; at this time I am not considering achieving partner status.
I am too junior to consider whether this is really something I would like to achieve.

Page 53
Theme Examples
View that benefits would not outweigh additional work
My personal view is that the financial rewards of partnership of the average firm in Scotland would not compensate for the loss of work-life balance involved.
Have been a partner previously - the financial benefits are outweighed by the burden of managing a business.
It has massive responsibility and little reward.
Unsuccessful applications for partnership
Legal professionals who were not partners were asked whether they had previously
applied for partnership and been rejected or not supported:
• 97% stated that they had not (n=1,921)
• 2% stated that they had (n=34)
• 1% preferred not to say (n=23)
Those who had been rejected or not supported in their application for partnership
explained why:
Theme Examples
Financial reasons
2008 financial crisis.
Business case not strong enough.
Gender
Female, working part-time, with three children. At that time, no female partners had more than one child!
I am female, opinionated, (potential) rival from a working-class background.
It was never really explained but am sure there was an element of male chauvinism at the time.
Varied reasons. My perception is that it was largely to do with being a woman of child-bearing age. The partnership delays promotion of women compared to men and does not promote women once they have children.
Working part time
Worked part-time because I had young children and a husband who worked long hours.
Working 'part-time' ... Head of department preferring to be in charge.
Lack of opportunity to develop business development skills due to part-time role.

Page 54
Transparency around becoming a partner
Overall, the same proportions of respondents felt there was transparency around the
criteria to become a partner in 2013 and 2018, with male respondents significantly more
likely to think there is transparency when compared to female respondents. However,
there has been an increase in the proportion of female respondents who feel there is
transparency around criteria to become a partner, from 25% in 2013 to 29% in 2018:
All - 2013 All - 2018 Female - 2013
Female - 2018
Male - 2013
Male - 2018
Yes 37% 37% 25% 29% 48% 48%
No 40% 39% 46% 44% 33% 32%
Do not know 24% 24% 29% 27% 18% 20%

Page 55
Career aspirations
Respondents most frequently felt that achieving an improved work-life balance was their
most important career aspiration over the next five years. This was followed by the
aspiration for promotion or progression:
Career aspirations by gender
A higher proportion of female respondents identified promotion and/or progression and
an increased salary as their most important career aspirations over the next five years.
Aspiration Female (n=1,507) Male (n=1,005)
Improved work-life balance 32% 31%
Promotion and/or progression 26% 19%
Increased salary 14% 12%
Other (please specify) 6% 15%
Up-skill or specialise 8% 6%
Career change out-with the legal profession 5% 6%
Career change within the legal profession 5% 3%
Help others 3% 4%
Become a partner 2% 3%
59
91
113
130
178
248
331
590
812
0% 10% 20% 30% 40%
Become a partner
Help others
Career change within the legal profession
Career change outwith the legal profession
Up-skill or specialise
Other (please specify)
Increased salary
Promotion and/or progression
Improved work-life balance
Just under a third of respondents identified an improved work-life balance as their most important career aspiration over the next five years
(n=2,552)

Page 56
A higher proportion of male respondents selected an ‘other’ aspiration compared to
female respondents. Other aspirations included:
• Retirement – either currently retired, about to retire or hoping to retire in the
next five years
• Continuing as at present
• Development of one’s practice
• Leave the profession
• Maintain or consolidate position

Page 57
Career aspirations by length of time in the profession
The top three most important career aspirations for those who were trainees or had
been qualified for up to five years, those who had been qualified for between six and 20
years and those who had been qualified for over 20 years were as follows:
Trainees and qualified for up to five years
Qualified for between six and 20 years
Qualified for 21+ years
1. Promotion and/or progression (44%)
1. Improved work-life balance (33%)
1. Improved work-life balance (43%)
2. Improved work-life balance (17%)
2. Promotion and/or progression (23%) 2. Other (23%)
3. Increased salary (16%) 3. Increased salary (16%) 3. Increased salary (8%)
Leaving the profession
54% of all respondents (n=1,459) have considered leaving the profession in the last five
years.
30% of trainees have considered leaving the profession, compared to 69% of those who
have been qualified for six to ten years:
70
285
255
326
248
162
0%
25%
50%
75%
Trainee Up to fiveyears
6-10 years 11-20 years 21-30 years 31+ years
Just under 70% of those who completed their traineeship between six and ten years ago have considered leaving the profession in the past five years

Page 58
An examination of respondents who have considered leaving the profession in the last
five years by length of time since their traineeship or apprenticeship and gender:
The most frequent factor identified for prompting respondents’ consideration to leave
the profession was ‘work-life balance’:
52
195
186219 149
4717
8768
103
90 109
0%
25%
50%
75%
Currenttrainee
Up to fiveyears
6-10 years 11-20 years 21-30 years 31+ years
While 73% of female respondents who completed their traineeship or apprenticeship between six and ten years ago have considered leaving
the profession in the last five years, this figure is 60% for male respondents
Female Male
134
148
331
467
723
1,029
0% 20% 40% 60% 80%
Retirement
In an uneconomical position
Other
Lack of opportunities within the profession
Better pay or new opportunities elsewhere
Work life balance
71% of those who have considered leaving the profession were prompted by their work-life balance (n=1,456)

Page 59
An examination of the reasons for considering leaving the profession by gender shows:
While the same proportion of female and male respondents considered leaving the
profession due to better pay or new opportunities elsewhere, a higher proportion of
male respondents (18%) considered leaving the profession for retirement compared to
female respondents (4%).
In addition, 35% of female respondents considered leaving the profession due to a lack
of opportunities within the profession, compared to 25% of male respondents.
42
91
229
334
471
684
8756
101122
236
325
134 148
331
467
723
1,029
0%
25%
50%
75%
Retirement In anuneconomical
position
Other Lack ofopportunities
within theprofession
Better pay ornew
opportunitieselsewhere
Work-lifebalance
Reasons for considering leaving the profession by gender
Female Male All

Page 60
5 Work patterns
Contracted weekly hours
Respondents were asked to provide detail about their contracted weekly hours. Of those
for whom the question was applicable8, three-quarters indicated that they are
contracted to work for 31-40 hours:
Hours worked in addition to contracted hours
83% of respondents stated that they worked some hours in addition to their contracted
hours, while 10% did not work any additional hours. A higher proportion of male
respondents worked no additional hours compared to female respondents. However,
15% of male respondents worked over 16 additional hours per week, compared to 7% of
female respondents.
14% of ‘White – Other’ and ‘White – All other ethnic groups’ respondents worked on
average over 16 hours per week in addition to their contracted hours, compared to 10%
of ‘White Scottish or British’ respondents.
8 An additional 285 respondents selected N/A to this question.
16 61
325
1,829
17250
0%
20%
40%
60%
80%
0-10 hours 11-20 hours 21-30 hours 31-40 hours 41-48 hours Other
Three-quarters of respondents had contracted weekly hours of between 31 and 40 hours (n=2,453)

Page 61
All Female Male
White - Scottish/ British
White - Other
All other ethnic groups
No additional hours 10% 8% 12% 9% 9% 11%
0-6 hours 40% 48% 27% 40% 36% 35%
7-15 hours 33% 32% 34% 33% 35% 26%
Over 16 hours 10% 7% 15% 10% 14% 14%
Do not know 4% 3% 7% 4% 2% 8%
Prefer not to say 3% 2% 5% 3% 3% 5%
Sample size (n) 2,716 1,672 1,004 2,497 96 118
While a higher proportion of respondents without dependants work between seven and
15 additional hours per week, around 10% of both those with and without dependants
work over 16 hours on top of their contracted hours:
Pay for additional hours worked
92% of those who work on average some additional hours per week are ‘never paid
overtime’ (n=2,236), while 4% are ‘sometimes paid overtime’ (n=89) and 2% are ‘always
126
504
363
12075
43
133
578530
154
43 42
0%
25%
50%
No additionalhours
0-6 hours 7-15 hours Over 16hours
Do not know Prefer not tosay
Roughly equal proportions of those with and without dependants work no additional hours and over 16 hours on top of their contracted hours
Yes - Has dependants No - Does not have dependants

Page 62
paid overtime’ (n=41). 3% of respondents indicated that working overtime is rewarded
through bonuses (n=72).
Types of overtime worked
The most frequent type of overtime worked by respondents was after-work hours. Just
under a quarter of respondents always worked after-work hours, a further 39% usually
did, and 27% sometimes did. Only 10% of respondents rarely or never worked additional
hours after work. Similarly, only 10% of respondents rarely or never worked during lunch
breaks. While 3% of respondents always worked at the weekends, 38% sometimes did.
Flexi-time
35% of respondents indicated that they have access to flexi-time (n=809):
In comparison, 42% of respondents reported having access to flexi-time in their
organisation in 2013, suggesting a decrease in its availability over time.
993
1,5241,641
380 325284
0%
25%
50%
75%
Before workhours
During lunchbreaks
After workhours
At the weekend While onholiday
On any non-contractedweekdays
62% of respondents either always or usually worked after hours
35%, 809
59%, 1,346
6%, 138
Just over a third of respondents have access to flexi-time (n=2,293)
Has access to flexi-time
Does not have access to flexi-time
Does not know if one has accessto flexi-time

Page 63
Of those who did have access to flexi-time:
• 82% felt comfortable to use it if they had accrued it (n=665), while 18% did
not feel comfortable to use it (n=144).
• 72% said they would be able to continue in their job if they did not have
access to flexi-time (n=480).
• 17% of all respondents expressed that they would not be able to continue
in their job if they did not have access to flexi-time (n=116). This compares
to 14% of respondents who had this view in 2013.
• 20% of female respondents would not be able to continue in their job if
they did not have access to flexi-time (n=84); this is similar to 2013 data
where 19% of female respondents had this view.
• 12% of male respondents would not be able to continue in their job if they
did not have access to flexi-time (n=29); this is higher than in 2013 where
9% of male respondents had this view.
• 21% of respondents with a partner who worked full-time expressed that
they would not be able to continue in their job without access to flexi-time
(n=83), while 13% of respondents with a partner who did not work had this
view (n=9).
Working amended hours
Respondents were asked whether they currently worked amended working hours
through a contractual change such as part-time or condensed hours. 74% did not work
amended hours and had not asked to (n=2,018). 1% did not work amended hours but
had asked to do so and were refused (n=38). 21% did work amended hours (n=575) and
3% did not know (n=83).
When asked about the main reason for working amended hours, respondents most
frequently identified this as being due to care responsibilities:
1
5
7
35
36
114
379
0% 25% 50% 75%
For the benefit of the employer or colleagues
Phased return to work
It is required or imposed
Other (please specify)
Phased retirement plan
Personal preference
Care responsibilities
Two-thirds of those working amended hours cited the main reason for this as having care responsibilities (n=577)

Page 64
Of those who provided an ‘other’ reason for working amended hours, these included:
• Physical or mental health
• Disability
• To help with commuting requirements
• Balancing work with other commitments eg another role or studies
• Personal preference or a lifestyle choice
Respondents were asked to comment on whether they would be able to continue in
their current role if they were not able to work amended hours:
• 37% stated that they would not be able to continue in their current role if
they were not able to work amended hours (n=214), while 47% said that they
would be able to continue (n=271)
• A further 16% stated that they were not sure whether they would be able to
continue in their current role if it was not possible for them to work
amended hours (n=91)
Impact of working amended hours on career progression
Amongst those who were working amended hours, respondents most frequently felt
that this had not had a negative impact on their career progression:
Impact of working amended hours Percentage (n=573)
Yes - lasting negative impact 16%
Yes - temporary but would be partially remedied if I worked full-time again
15%
Yes - temporary but would be fully remedied if I worked full-time again
9%
No 48%
Don't know 13%

Page 65
Respondents who indicated that working amended hours had had a negative impact on
their career progression provided details of these impacts. These included:
Theme Examples
Limited access to promotions or more senior positions
Any jobs in the grade above have been for full-time applicants only.
If I wanted to progress to partner, I would need to work full-time. Not achievable otherwise.
I have observed less-qualified, but full-time, employees being promoted to senior positions over me.
I feel that, as a part-time worker, I have no serious prospect of being offered a management/senior role.
No part-time promoted posts exist in the geographical area in which I work. I would have to return to full-time working or move if I wished to apply for promotion.
Perception that those working amended hours are less dedicated
As a part-time employee I feel I am very much ‘parked’ career-wise and am not considered as committed to my role as full-time employees.
General impression that those working less days are less dedicated.
I don't believe part-time has a negative impact with my current employer, but it certainly did with my previous employer. I wasn't allowed to tell clients I worked part-time, and I was expected to pick up emails/calls on my non-working days. My perception was that working part-time was viewed as demonstrating a lack of commitment.
I feel as if some members of my team believe I am not as committed to the job/clients because I work a four-day week.
It changes people’s perceptions of you. It affects their view of your dedication to the firm.
Less respect from colleagues, viewed as less reliable without any justification.
Lack of recognition around hours worked or expectation that full-time work should be completed in part-time hours
I feel that my workload is the same despite me only working three days. I do overtime to try and keep on top of things when I can.
I work full-time hours which are condensed over four days. This is viewed negatively by management as they perceive me as having a ‘day off’ rather than working the same amount of hours over four days.
I work condensed hours but, as I leave earlier (having started earlier), I am considered part-time and am expected to be contactable until 5pm - 7pm despite having worked a full day.

Page 66
People expect certain roles to be filled by a full-time person plus would still be expected to do a full-time role in part-time hours.
Hours worked at home are not recognised.
Limits to income from fees
In a legal role, fee income is all important; any decline in this or a step away from long hours will have a lasting impact.
As the sole partner in the firm, the responsibility of fee income rests with me and restricted hours limits income.
Fewer hours mean lower fees, a major role in career progression.
Unable to participate in out-of-hours networking or business development
Overlooked for promotion for many years - I think it was assumed that I was part-time and not interested. When I spoke up I was told I needed to be seen at more social events, which were difficult for me to attend. Even if I worked full-time that would be difficult sometimes.
The model to achieve partnership is based on someone who gives 100%+ to the business, is always available to do BD, has no other commitments and can get involved in everything. I work part-time and need to leave at 5ish, although I log on a lot at night, I just can't get involved the way I used to. Something has to give!
Unable to participate in a lot of out-of-hours business development, which is crucial to moving up the ladder.

Page 67
Parental leave
A higher proportion of respondents with children of up to six years of age had taken
longer durations of parental leave (seven to nine months, ten to 12 months or over one
year) compared with those who had children of seven years and over. In addition, a
significantly higher proportion of those with children aged seven years and over had
taken no time off, compared with those who had younger children:
Work-life balance
73% of respondents felt that they were or mostly were achieving a ‘reasonable work-life
balance’ (n=1,991), compared to 71% of respondents in 2013.
• Just under a quarter of respondents felt that they were achieving a
reasonable work-life balance (24%, n=648)
• A further 49% felt that they were mostly achieving a reasonable work-life
balance (n=1,343), making this the most frequent response
Having access to and feeling comfortable to use, flexi-time appeared to have an impact
on the extent to which respondents felt that they were, or mostly were, achieving a
reasonable work-life balance.
Amongst those who had access to, and felt comfortable to use, flexi-time, 87% felt they
were, or mostly were, achieving a reasonable work-life balance (n=578):
2636
150
9
3242
103
191
72
371
214 199
17
104
241
165 169
115
0%
10%
20%
30%
No timetaken off
1 week 2 weeks 3 weeks 1-3months
4-6months
7-9months
10-12months
Over 1year
For children of up to six years of age, a higher proportion of respondents had taken off seven months or more parental leave
Children of up to 6 years Children of 7 years and over

Page 68
On the other hand, 19% felt that they were mostly not and 8% felt that they were not
achieving a reasonable balance (n=517 and 221 respectively).
A higher proportion of female respondents responded that they were, or mostly were,
achieving a reasonable work-life balance (75%, n=1,254) when compared to male
respondents (71%, n=717). However, the same proportion of male and female
respondents said that they were not achieving a reasonable balance (8%).
21% of those with dependants said that they were achieving a reasonable work-life
balance (n=262), compared to 26% amongst those without dependants (n=384).
While 73% of those without a disability said that they were, or mostly were, achieving a
reasonable work-life balance (n=1,910), this figure was 63% for those with a disability
(n=77):
578
913
84
433
0%
25%
50%
75%
100%
Has access to flexi-time and feelscomfortable to use it
Does not have access to flexi-time
87% of those who have access to flexi-time and feel comfortable to use it feel that they are, or mostly are, achieving a reasonable work-life
balance compared to 68% of those who do not have access to flexi-time
Is or mostly is achieving a reasonable work-life balance
Is not or mostly is not achieving a reasonable work-life balance
77
46
1,910
691
0% 25% 50% 75%
Respondent does or mostly does believethey are achieving a reasonable work-life
balance
Respondent does not or mostly does notbelieve they are achieving a reasonable
work-life balance
A higher proportion of those with a disability reported not having a reasonable work-life balance
No disability Disability

Page 69
Amongst current trainees, 76% felt that they were, or mostly were, achieving a
reasonable work-life balance; however, this figure was 71% for those who qualified 16 or
more years ago:
Respondents were asked to comment on why they felt they were, or were not, achieving
a reasonable work-life balance:
Explanations for feeling one has a reasonable work-life balance
Explanations for feeling one does not have a reasonable work-life balance
Having access to flexi-time or flexible working arrangements.
Being required to work outside of work hours, including on holiday.
Ability to work amended hours. Challenges in organising or taking time off.
Living locally or being able to cycle to work. Expectation that personal plans or leave should be cancelled if required by work.
Personally prioritising one’s work-life balance. Feeling continuously ‘on duty’.
Feeling satisfied with working additional hours where required.
Volume of work requires long working hours.
Work-life balance fluctuates depending on workload.
Pressures on those working in legal
aid.
Having an employer that is considerate or supportive of work-life balance.
Tiredness or stress having an impact even when not working, feeling it is difficult to unwind.
Being able to work from home. The need to work additional hours to progress or be promoted.
176
360
470
809
70%
72%
74%
76%
Current trainee Qualified 0-5 years ago Qualified 6-15 yearsago
Qualified 16+ years ago
A higher proportion of current trainees and those who qualified between six and 15 years ago felt that they were, or mostly were, achieving a
reasonable work-life balance

Page 70
Having interests and hobbies outside work. Finding it difficult to balance family and work life.
Due to changing one’s role or place of work. Needing to spend time travelling to work.
Not being expected to log on at home or while on holiday.
Lack of flexible working arrangements.
Annual leave – being able to use or arrange leave with short notice or having a reasonable entitlement.
Client demands being prioritised over the work-life balance of staff.
Retirement
12% of respondents stated that they were planning to retire in the next five years, with
an additional 6% who did not know whether they would:
6%, 156
82%, 2,246
12%, 333
12% of respondents are planning to retire in the next five years (n=2,735)
Don't know
No
Yes

Page 71
6. Discrimination, bullying, harassment and sexual harassment
Discrimination
When asked whether they had experienced or witnessed discrimination in the
workplace:
Rate of discrimination experience
Witnessed discrimination 20% (n=561)
Experienced discrimination 20% (n=544)
Neither witnessed nor experienced discrimination 67% (n=1,823)
Personal experience of discrimination
Group Rate of discrimination experience
All respondents 20%
White – Other 32%
All other ethnic groups 27%
Female 26%
Aged 36-55 25%
Asexual, bisexual, gay man, lesbian, pansexual, prefer to use a different term 22%
Attended state school 20%
White Scottish or British 19%
Heterosexual/straight 19%
Attended private school 18%
Aged 56 and older 16%
Aged up to 35 15%
Male 10%

Page 72
Respondents were asked if they had personally experienced discrimination in the
workplace. They were able to answer if this discrimination was within the last five years;
more than five years ago (NB more than five years could have been a six years ago or 26
years ago); or both. Of the 544 respondents who had personally experienced
discrimination, 72% had experience of discrimination in the last five years and 44% had
experience more than five years ago.
20% of respondents had at some stage personally experienced discrimination in the
workplace (n=544). A higher proportion of female respondents described personal
experience of discrimination (26%, n=431) than male respondents (10%, n=99).
While 19% of ‘White – Scottish or British’ respondents said they had personally
experienced discrimination (n=479), this figure was 27% for ‘All other ethnic groups’
(n=33) and 32% for ‘White – Other’ respondents (n=31).
Types of discrimination
The most frequently identified type of discrimination which was personally experienced
by respondents in the past five years was due to their gender or sex:
In addition, 5% or fewer respondents experienced discrimination in the past five years
due to their sexual orientation or due to being transgender.
66 respondents described an ‘other’ type of discrimination, including:
• Due to one’s position eg Accredited Paralegal or trainee
• Due to being a mother or parent
• Due to being pregnant
• Due to one’s health or mental heath
• Due to one’s level of qualification eg not having a degree.
24
26
27
28
28
44
66
81
95
231
0% 20% 40% 60%
Due to my marriage or civil partner status
Due to my disability
Prefer not to say
Due to my race or ethnicity
Due to my religion or belief
Due to my socioeconomic background
Other
Due to my amended working hours
Due to my age
Due to my gender or sex
60% of those who had experienced discrimination in the past five years identified this as being due to their gender or sex

Page 73
Ways of being discriminated against
Respondents identified the ways in which they had been discriminated against in the
past five years:
In addition, 5% or fewer respondents felt they were discriminated against in the past five
years in the allocation of flexi-time, during their undergraduate study or during their
study for their Diploma. No respondents felt that they were discriminated against when
instructing an advocate.
75 respondents identified an ‘other’ way in which they were discriminated against. These
included:
• Being demoted or refused amended hours on return from maternity leave
• In relation to promotion or progression
• Receiving offensive or patronising comments
• Bullying.
22
22
33
34
46
69
71
75
86
142
146
159
170
0% 25% 50%
In court
Prefer not to say
In securing a job as an NQ
In securing your traineeship
In the allocation of leave
In the allocation of other benefits
During your traineeship
Other
In relation to networking
Left out of communications
Not considered for development or training
In the allocation of work
In relation to salary
Respondents most frequently felt they were discriminated against in relation to salary

Page 74
Witnessing discrimination
20% of respondents had witnessed discrimination in the workplace (n=561).
Amongst those who said they had witnessed discrimination, 80% said this had happened
in the last five years (n=451) and 34% said this was more than five years ago (n=190).9
Types of witnessed discrimination
Respondents were asked to identify which types of discrimination they had witnessed
within the past five years. The most frequently identified type of discrimination which
was witnessed by respondents was due to a person’s gender or sex:
In addition, 5% or fewer respondents witnessed discrimination in the past five years due
a person’s marriage or civil partner status or due to being transgender.
37 respondents described an ‘other’ type of discrimination which they had witnessed.
These included:
• Due to one’s position eg as a trainee or junior worker
• Due to being pregnant
• Due to having children or other caring responsibilities
• Due to one’s mental health
9 Respondents were able to answer that they had witnessed discrimination both within the last five years and more than five years ago.
28
33
37
41
49
55
67
133
178
318
0% 25% 50% 75%
Prefer not to say
Due to their religion or belief
Other
Due to their disability
Due to their sexual orientation
Due to their race or ethnicity
Due to their socioeconomic background
Due to their age
Due to their amended working hours
Due to their gender or sex
71% of those who witnessed discrimination in the past five years identified this as being due to a person's gender or sex

Page 75
Ways in which others have been discriminated against
Respondents were asked to identify the ways in which they had witnessed discrimination
in the past five years. The most frequent way in which someone was identified as having
been discriminated against was in the allocation of work, followed by not being
considered for development or training. In comparison, the most frequent way in which
respondents identified personally experiencing discrimination was in relation to salary
(see above).
In addition, 5% or fewer respondents witnessed discrimination in the past five years in
court, during a person’s study for their Diploma, during a person’s undergraduate study
or when instructing an advocate.
67 respondents identified an ‘other’ way in which they had witnessed a person or people
be discriminated against in the past five years. These included:
• In relation to promotion or progression
• Losing one’s job unfairly
• Bullying, harassment or sexual harassment
• Discriminatory or racist comments
• General or day-to-day environments eg ‘people speaking over and judging more
junior or female members of staff’
• In relation to requests for flexible working or amended hours
35
35
39
46
55
56
62
67
98
144
164
182
209
0% 25% 50%
In securing their traineeship
In securing a job as an NQ
Prefer not to say
In the allocation of flexi-time
In the allocation of leave
In the allocation of other benefits
During their traineeship
Other
In relation to networking
In relation to salary
Left out of communication
Not considered for development or training
In the allocation of work
Respondents most frequently stated that they had witnessed discrimination in the allocation of work

Page 76
Bullying, harassment and sexual harassment
Respondents were provided with the following information about bullying and
harassment:
Bullying is often described as the process whereby an employee is intimidated,
mistreated or humiliated. It can be characterised by offensive, malicious or
insulting behaviour which is designed to undermine the confidence and capability
of the victim.
Harassment can be described as unwanted behaviour which affects the dignity of
people at work. It may be persistent or an isolated incident. Either way, the key is
that the actions or comments are seen as demeaning or humiliating and are
unacceptable to the recipient.
Harassment which is related to ‘a protected characteristic’ is a form of conduct
expressly prohibited by the Equality Act. S26 of the Equality Act 2010 provides
that ‘A person (A) harasses another (B) if A engages in unwanted conduct related
to a relevant protected characteristic, and the conduct has the purpose or effect
of violating B’s dignity, or creating an intimidating, hostile, degrading, humiliating
or offensive environment for B.’
In consideration of the above:
51% of respondents stated that they had neither experienced nor witnessed bullying,
harassment or sexual harassment in the workplace (n=1,399). However, 34% stated that
they had witnessed bullying, harassment or sexual harassment (n=939) and 28% said
they had personal experience of bullying, harassment or sexual harassment (n=779).
Personal experience of bullying, harassment or sexual harassment
28% of respondents had personally experienced bullying, harassment or sexual
harassment in the workplace.
A significantly higher proportion of female respondents reported having experienced
bullying, harassment or sexual harassment compared to male respondents. A third of
female respondents stated that they had personal experience of bullying, harassment or
sexual harassment (33%, n=550), while this figure was 21% for male respondents
(n=214).
34% of those who identified as asexual, bisexual, gay man, lesbian, pansexual or
preferred to use a different term described personal experience of bullying, harassment
or sexual harassment in the workplace (n=51), compared to 27% for
heterosexual/straight respondents (n=683).

Page 77
Just under half of those in the ‘White – Other’ group described having personally
experienced bullying, harassment or sexual harassment in the workplace (49%, n=47).
Over a third of those in ‘All other ethnic groups’ had personal experience of bullying,
harassment or sexual harassment (34%, n=41), while this figure was 27% for ‘White –
Scottish and British’ respondents (n=691).
Amongst those who said they had personally experienced bullying, harassment or sexual
harassment in the workplace, 66% said that this occurred within the past five years
(n=514), while 48% had experience of bullying, harassment or sexual harassment from
over five years ago (n=375). Amongst all respondents, 19% had experienced bullying,
harassment or sexual harassment within the past five years.
Personal experiences of bullying, harassment or sexual harassment
Respondents were asked to identify whether they had personally experienced bullying,
harassment, sexual harassment or an ‘other’ type of harassment. Respondents most
frequently expressed that they had experienced bullying in the workplace:
Experience Frequency Percentage of all respondents (n=2,746)
Bullying 450 16%
Harassment 167 6%
Sexual harassment 79 3%
Other 13 <1%
A higher proportion of female respondents had personal experience of bullying,
harassment and sexual harassment over the past five years compared with male
respondents. While 20% of female respondents had experienced bullying, this figure was
10% for male respondents. While 73 female respondents reported experience of sexual
harassment in the workplace, this figure was five for male respondents:

Page 78
Relationship between respondent age and experience of bullying, harassment or
sexual harassment
While experiences of bullying and sexual harassment appear to be less frequent amongst
older age groups, the rate of experience of harassment is higher for those aged 36-55:
Witnessing bullying, harassment or sexual harassment
Over a third of respondents stated that they had witnessed bullying, harassment or
sexual harassment in the workplace (34%, n=939).
Of those who had witnessed bullying, harassment or sexual harassment in the workplace, 71% stated that this had happened within the past five years (n=672), while 44% said this happened more than five years ago (n=416).
332
11873
107
44
50%
5%
10%
15%
20%
Bullying Harassment Sexual harassment
A higher proportion of female respondents reported experience of bullying, harassment and sexual harassment over the past five years
when compared with male respondents
Female Male
186
51 48
215
91
28
41
22
2
0%
5%
10%
15%
20%
Bullying Harassment Sexual harassment
A higher proportion of those aged up to 35 have experienced bullying or sexual harassment within the past five years when compared to other
age groups
Aged up to age 35 Aged 36-55 Aged 56 and older

Page 79
Types of witnessed bullying, harassment and sexual harassment
Respondents were asked to identify which types of bullying, harassment or sexual
harassment they had witnessed within the past five years. Bullying was most frequently
identified by respondents:
While a higher proportion of female respondents reported personal experience of
bullying, harassment and sexual harassment, a higher proportion also reported
witnessing bullying, harassment and sexual harassment when compared with male
respondents:
407
12994
190
6742
0%
10%
20%
30%
Bullying Harassment Sexual harassment
A higher proportion of all female respondents identified different types of bullying and harassment when compared with male respondents
Female Male
Witnessed Frequency Percentage of all respondents (n=2,746)
Bullying 607 22%
Harassment 199 7%
Sexual harassment 139 5%
Other 6 0%

Page 80
Perceptions of the frequency with which discrimination, bullying, harassment and sexual harassment occur in the Scottish legal profession
All respondents (regardless of whether they had personally experienced or witnessed
discrimination or harassment in the workplace) were asked to comment on how
widespread they thought discrimination, harassment, sexual harassment and bullying
were within the Scottish legal profession:
Bullying and discrimination were seen to be more widespread in the legal profession
than harassment and sexual harassment.
85
124
266
302
399
473
728
889
1,506
1,499
1,270
1,224
620
540
395
256
46
33
27
17
0% 25% 50% 75% 100%
Sexual harassment
Harassment
Discrimination
Bullying
11% of respondents felt that bullying was systemic in the legal profession
This is systemic in the legal profession (happens on a day-to-day basis)
This frequently occurs in the legal profession
This occasionally occurs in the legal profession
This rarely occurs in the legal profession
This does not occur in the legal profession

Page 81
Perception of discrimination, bullying, harassment and sexual harassment by position
Addressing discrimination, bullying, harassment and sexual harassment
Dealing with past incidents
Respondents who had indicated that they had at any point experienced or witnessed
discrimination, bullying, harassment and sexual harassment were asked about whether
they felt incidents had been dealt with appropriately. Less than 20% of respondents felt
that all or most incidents had been dealt with appropriately:
137152
7056
175197
10175
0%
20%
40%
Discrimination Bullying Harassment Sexual harassment
Across all categories, a higher proportion of Accredited Paralegals and trainees felt that discrimination, bullying, harassment or sexual
harassment were systemic or frequent in the legal profession when compared with partners and directors
Paralegal or trainee Partner or director
85
204
515
710
0%
10%
20%
30%
40%
50%
All incidents have beendealt with appropriately
Most incidents havebeen dealt withappropriately
Some incidents havebeen dealt withappropriately
No incidents have beendealt with appropriately
Just under half of respondents felt that no incidents of discrimination, bullying, harassment or sexual harassment had been dealt with
appropriately (n=1,514)

Page 82
Organisational responses to incidents
All respondents were asked about the extent to which they were confident that
allegations of discrimination, bullying, harassment or sexual harassment would be dealt
with appropriately if reported to their organisation, the Scottish Legal Complaints
Commission or the Law Society:
An examination of levels of confidence that all or most issues would be dealt with
appropriately by the Law Society, Scottish Legal Complaints Commission and one’s own
organisation by gender shows the following:
752
472
555
941
873
994
596
580
594
307
445
308
0% 25% 50% 75% 100%
One's own organisation
Scottish Legal Complaints Commission
The Law Society
65% of respondents were confident that all or most issues would be dealt with by their organisation
Confident that all issues would be dealt with appropriately
Confident that most issues would be dealt with appropriately
Confident that some issues would be dealt with appropriately
Not confident that any issues would be dealt with appropriately
720
566
462
959 974879
0%
25%
50%
75%
One's own organisation The Law Society Scottish Legal ComplaintsCommission
While 70% of male respondents were confident that all or most issues would be dealt with appropriately by their own organisation, this figure
was 57% for female respondents
Male Female

Page 83
Comments relating to discrimination, bullying, harassment or sexual harassment
Respondents were invited to provide accounts and information on discrimination,
bullying, harassment or sexual harassment. The responses ranged from a respondent
having not seen or experienced this behaviour, to unwanted or inappropriate comments
to allegations of serious sexual assault. The comments also covered incidents or accounts
from within the last five years, and over a longer period of more than five years.
A summary of some of the accounts received are outlined below in order to protect the
anonymity of respondents and any other individuals who may have been identifiable
from the accounts provided:
Accounts of discrimination, bullying, harassment or sexual harassment
Theme Comments included accounts of:
Sexual harassment
• Inappropriate comments
• Unwanted physical contact
• A colleague being reported for inappropriate
behaviour with no resulting action at an HR level
• Sexual harassment and bullying during traineeships
• Threat of sexual violence
Discrimination based on gender
• Discrimination in promotions
• Women being left out of meetings etc because of
the perception they will potentially take time off in
the future to have a baby
• Reduced salary prospects for women
• Judges talking down to women in court
• Uncomfortable comments towards women about
‘going off to have children’
• Male lawyers talking in communal spaces about
sexual activity in a way which is derogatory to
women
• Refusal to use gender neutral language

Page 84
Bullying and harassment
• The prevalence of bullying and aggression in the
legal profession
• Bullying and harassment in high street firms
• Bullying of trainees as ‘standard practice’ as well as
casual racism and sexism
Discrimination based on race or ethnicity
• Systemic discrimination against ethnic minorities
• Use of racist language
• Racial prejudice
• Differences in the way that the Law Society reviews
and responds to traineeship applications made by
people from ethnic minority backgrounds
‘Boys’ club' or problems with elitism
• A view that the ‘old boys’ network’ is alive in the
legal profession, with males being treated better and
given better caseloads
• Unconscious bias towards those who have attended
public school, are middle or upper class or ‘well-
spoken’ white people
• Discrimination in recruitment against those who do
not have family in the profession or are not part of
the ‘elite’
• Discrimination by employers against people who
went to college before attending university

Page 85
Bullying and harassment of those in more junior positions or trainees by those in more
senior positions or partners
Theme Comments included accounts of:
Treatment of those in more junior positions eg trainees, NQs and Accredited Paralegals
• Bullying of trainees and NQs by partners in small
Private practice
• Bullying or harassment of trainees and junior
female members of staff
• Acceptance across staff members around trainees
not being treated with respect
• Abuse of power by partners or very senior
associates towards junior members of staff
Views that the occurrence of discrimination, bullying, harassment and sexual
harassment is decreasing or not a problem unique to the legal profession
Theme Comments included accounts of:
Issues are not necessarily more widespread in the legal profession than in other sectors
• Incidents relating to discrimination, bullying,
harassment or sexual harassment do not happen
more frequently in the legal profession than in
other fields
• Incidents will inevitably occur across sectors, not
necessarily more so in the legal profession
• Expression that one has not witnessed any such
behaviour
There has been progress in this area
• While casual sexual harassment was previously
common, this has decreased over time
• Feeling that most law firms are more committed
and better at tackling these issues now than they
were in the past

Page 86
Views that discrimination and harassment can be subtle or unconscious
Theme Comments included accounts of:
Subtle or unconscious discrimination or harassment
• Discrimination is not overt or even conscious in some
instances
• Individuals who bully or harass others may see their
behaviour as normal
• Discrimination can be subtle, such as partners
assisting male rather than female assistants in their
careers
• Unconscious sexism
• Existence of behaviours which are ‘milder’ forms of
discrimination, bullying, harassment or sexual
harassment which are difficult to call out but are
nevertheless damaging or undermining to the victim

Page 87
Problems with raising issues or complaints
Theme Comments included accounts of:
Fear or
resistance to
speaking up
about
discrimination
or harassment
• A fear that speaking up will cost one their job or
career
• A need to move jobs rather than report one’s
discomfort with an atmosphere of sexualised
discussion and jokes
• Concern about the ‘blacklisting’ of those who
complain about discrimination or harassment
• Worry that one will be considered a ‘trouble-maker’
or ‘soft’ for reporting incidents
• A view that reporting sexual harassment is ‘not worth
it’ and individuals should instead use strategies to
keep themselves safe
Unsuccessful
attempts to
raise issues
• Inadequate and indifferent responses from the Law
Society and LawCare around incidents of bullying
towards junior staff
• Failure to address bullying by an employer leading to
an individual leaving this place of work
• Experience of senior management protecting an
individual accused of bullying rather than addressing
the issue
• Reporting sexual assault, with no action taken by the
employing organisation

Page 88
Discrimination and harassment in Private practice, amongst sheriffs and clients
Theme Comments included accounts of:
Private practice
• Changing place of employment to avoid the
discrimination, harassment, bullying and sexual
harassment that are seen to be common in Private
practice
• A prevailing culture and acceptance around the bullying of
trainees and junior solicitors in Private practice
• View that Private practice is not a welcoming environment
for gay lawyers
Sheriffs
• Sheriffs bullying junior, mainly female, members of staff
• Bullying in court by sheriffs viewed as a feature of legal
careers which is rarely and inadequately addressed
• View that the way in which sheriffs speak to solicitors
would not be tolerated in other professions
Clients
• Harassment and bullying coming from clients in
circumstances where partners are not willing to challenge
their behaviour
• View that sexual harassment involving clients or contacts
would not be dealt with appropriately by employers
• Employers can encourage sexual harassment by clients or
seek to encourage the victim to tolerate it

Page 89
Actions to address discrimination, bullying, harassment and sexual harassment
Respondents provided suggestions of actions which could address discrimination and
harassment in the legal profession, eg:
Anonymous surveys within an organisation – people can be honest, and problems
can be dealt with appropriately
Training and insight into personal behaviour
Easier whistle-blowing
Education on the ‘grey area of banter’, harassment and unconscious bias
Better advertising of help sources such as helplines
The Law Society to engage in ‘proactive work to educate and prevent unwanted
comments, behaviour and sexual harassment’
Better resources more readily available to help those affected by sexual
harassment deal with the ‘emotional and mental impacts’
Compliance work of the Law Society – ‘Compliance with equalities legislation and
efforts to reduce discrimination, harassment, sexual harassment and bullying
should become as prominent in the compliance work of the Law Society as AML
and peer review’

Page 90
7. Views on future actions by the Law Society of Scotland and others
Respondents were provided with the following information:
Women now make up a majority of the solicitor profession. The gender distribution within the profession, though, is uneven. The route to qualification – LLB, DPLP, traineeship – are now disproportionately female.
At the higher end of the profession, this imbalance inverts. Women make up fewer than 30% of partners in the Scottish legal profession and fewer than 30% of solicitor advocates. We know from our own research that this issue occurs in other legal professions in Scotland (under 30% of advocates are female; under 30% of Senators of the College of Justice are female). Similar imbalances exist in other UK jurisdictions.
Equally, we know that students from Black, Asian and Minority Ethnic (BAME) communities are disproportionately over-represented on the LLB per head of population. We are aware though that there is a perception that comparatively few BAME solicitors make partner or take up judicial appointments.
Reasons for comparatively few women reaching senior positions
96
225
230
276
371
572
691
832
1,388
1,453
2,063
0% 20% 40% 60% 80%
Lack of relevant experience
I do not believe there is an issue
Other
Economic recession and impact upon partnershipopportunities
Active stifling of progression by members of theprofession
Prejudice
Choice
Lack of support in the industry
Traditional networks and routes to promotion aremale-orientated
Unconscious bias
It is difficult to reach senior levels and have afamily
The most frequent reason identified for why comparatively few women reach senior positions was that it is difficult to reach senior levels and have
a family (n=2,735)

Page 91
75% of respondents felt that fewer women reaching senior positions was due to it being
difficult to reach senior levels and have a family (n=2,063). 8% did not believe that there
was an issue with comparatively few women reaching senior positions (n=225).
230 respondents identified an ‘other’ reason why comparatively few women reach
senior positions. These included:
• It is a matter of time – the high proportion of females entering the
profession in the present will lead to balance or their disproportionate
representation in the make-up of senior roles in the future
• Men are more confident, assertive or entitled
• Organisations do not offer flexible working arrangements or, where women
are able to work amended hours they are disadvantaged
• Continuation of an ‘old boys’ club’ mentality
Women leaving the legal profession in their 30s and 40s
Respondents were asked why they felt so many women leave the legal profession in
their 30s and 40s:
127
133
165
190
410
445
1,142
1,705
2,058
2,272
0% 25% 50% 75% 100%
I do not believe there is an issue
Other
Sexual harassment
Lack of access to training and development
More interesting work elsewhere
Higher salary elsewhere
Slow or lack of progression
Detrimental effect and view of maternity leaveand part time working
Starting a family
Better work life balance elsewhere
83% of respondents felt that women leave the legal profession in their 30s and 40s because of a better work-life balance elsewhere (n=2,727)

Page 92
130 respondents described an ‘other’ reason for women leaving the profession in their
30s and 40s, these included:
• Women becoming demotivated, disillusioned or frustrated
• Respondents unsure why women leave the profession, or unaware that this was
the case
• Lack of support for flexible working
Encouraging female solicitors to reach senior levels
Organisations
Respondents were asked about changes that organisations could make to working
practices to encourage more female solicitors to reach senior levels:
205 respondents provided an ‘other’ change which organisations could make to working
practices. These included:
• Support for women during and following maternity leave
• Better provision of flexible working and parental leave for men
• Improved childcare provision eg a creche
• Encouragement of cultural changes
• Encouragement of job sharing
205
637
720
812
829
1,127
1,203
1,246
2,318
0% 25% 50% 75% 100%
Other
Business development coaching
Formal mentoring programme
Make senior lawyers responsible for retention
Leadership skills training programme
Broaden performance metrics to include less visibleactivities including mentoring and recruiting
More gender-neutral networking and client businessdevelopment
Unconscious bias training
Greater acceptance of flexible working
90% of respondents felt that greater acceptance of flexible working would encourage more female solicitors to reach senior levels (n=2,566)

Page 93
Law Society of Scotland
Respondents were asked about changes that the Law Society could make to working
practices to encourage more female solicitors to reach senior levels:
211 respondents provided an ‘other’ change which the Law Society could make to
working practices. These included:
• Improve complaints procedures
• Provide assistance with returns to work after maternity leave or career breaks
• Other forms of training eg identifying and preventing bullying and harassment or
awareness training for male solicitors
• Confidential support for those experiencing discrimination
• Encourage organisations to offer flexible working, amended hours, job sharing
and equal access to parental leave
• Opposition to female-specific events or training
• Require organisations to disclose their gender pay gap and diversity statistics
• The Law Society should not act on this issue
• Opposition to partnership quotas
211
232
451
613
741
755
904
1,050
1,079
1,106
1,283
0% 20% 40% 60%
Other
Equitable briefing policy for solicitor advocates
Partnership quotas
Make senior lawyers responsible for retention
Provide an advisory service
Promote the Society’s mentoring scheme specifically to female solicitors
Training and mentoring for female solicitors seeking judicialappointment
Leadership skills training programmes specifically for femalesolicitors
More gender-neutral networking opportunities
Make equality & diversity training a mandatory part of theCPD requirement
Unconscious bias training
Over half of respondents felt that the Law Society providing unconscious bias training would help to encourage more women solicitors to reach senior levels
(n=2,423)

Page 94
Gender equality
Improvements in gender equality in the legal profession over the past five years
Respondents most frequently felt that gender equality had improved to some extent
over the past five years. However, while 28% of male respondents felt that gender
equality had improved to a great extent, only 10% of female respondents had this view.
In addition, while 28% of female respondents felt there had been no real progress in
gender equality, only 9% of male respondents had this view:
14 34
573
1,624
447
5 25
472
1,002
160
8 8
88
608
277
0%
25%
50%
75%
Regressed to asignificant
extent
Regressed tosome extent
No realprogress
To someextent
To a greatextent
While 28% of male respondents felt that gender equality had improved 'to a great extent' over the past five years, this figure was 10% for female
respondents
All
Female
Male

Page 95
Reasons for comparatively few Black, Asian and Minority Ethnic (BAME) solicitors reaching senior positions in the legal profession
53% of respondents felt that fewer BAME solicitors reaching senior positions was due to
unconscious bias (n=1,394). 22% did not believe that there was an issue with
comparatively few BAME solicitors reaching senior positions (n=573). 5% felt that it was
due to a lack of relevant experience (n=134).
332 respondents identified an ‘other’ reason why comparatively few BAME solicitors
reach senior positions. These included:
• A view that the Scottish population as a whole was not diverse
• A view that BAME solicitors will reach senior positions with time as it is relatively
recent that a higher proportion of BAME solicitors have entered the profession
• Respondents saying that they were not sure or felt unable to comment
• A view that the problem is at school or university level, where BAME young
people are not encouraged or supported to study law
• A lack of role models in the profession
134
188
211
240
332
573
712
775
1,059
1,394
0% 20% 40% 60%
Lack of relevant experience
Economic recession and impact upon partnershipopportunities
Choice
Active stifling of progression by members of theprofession
Other
I do not believe there is an issue
Lack of support in the industry
Prejudice
Traditional networks and routes to promotion canexclude BAME solicitors
Unconscious bias
Respondents most frequently felt that comparatively few BAME solicitors reach senior positions because of unconscious bias (n=2,628)

Page 96
Encouraging BAME solicitors to reach senior levels
Organisations
Respondents were asked about changes that organisations could make to working
practices to encourage more BAME solicitors to reach senior levels:
195 respondents provided an ‘other’ change which organisations could make to working
practices. These included:
• Initiatives which support BAME individuals to study law
• Improve access to the profession for BAME graduates
• Respondents saying that they were not sure or felt unable to comment
• Provide and promote grants or funding
• Address racism in the profession
195
567
601
629
838
911
1,472
0% 25% 50% 75%
Other
Make senior lawyers responsible for retention
Business development coaching
Consider different client origination events
Leadership skills training programme
Formal mentoring programme
Unconscious bias training
69% of respondents felt that unconscious bias training would help to encourage more BAME solicitors to reach senior levels (n=2,118)

Page 97
Law Society of Scotland
Respondents were asked about changes that the Law Society could make to working
practices to encourage more BAME solicitors to reach senior levels:
For both organisations and the Law Society, the provision of unconscious bias training
was most frequently selected as a way to encourage more BAME solicitors to reach
senior levels.
173 respondents provided an ‘other’ change which the Law Society could make to
working practices. These included:
• Initiatives which support BAME individuals to study law and pursue a career in
the profession
• Talks from successful BAME professionals to children and law students
• Training for those in the profession to make appointments based on merit rather
than school attended or parents’ professions
173
258
272
488
652
738
752
804
1,018
1,400
0% 25% 50% 75%
Other
Equitable briefing policy for solicitor advocates
Partnership quotas
Make senior lawyers responsible for retention
Provide an advisory service
Training and mentoring for BAME solicitorsseeking judicial appointment
Promote the Society’s mentoring scheme specifically to BAME solicitors
Leadership skills training programmes specificallyfor BAME solicitors
Make equality & diversity training a mandatorypart of the CPD requirement
Unconscious bias training
66% felt that unconscious bias training by the Law Society would encourage more BAME solicitors to reach senior levels (n=2,108)

Page 98
Recording of ethnicity data of Law Society members
Respondents were asked whether the Law Society should record the ethnicity data of its
members to be able to track progression rates:
Policies and initiatives
Respondents were asked: ‘Thinking about your own (or most recent) employer or, if you
are a sole practitioner, your own firm – which of the following policies or initiatives are in
place?’
Regular performance reviews were most frequently identified as being in place and
consistently applied (55%, n=1,474). The least frequently identified, provided and
consistently applied policy was an annual statement on the composition of roles with
reference to the Protected Characteristics (9%, n=226):
561641
1,512
521593
1,379
1621
59
2427
70
0%
25%
50%
75%
Don't know No Yes
Between 55% and 61% of all groups felt that the Law Society should record ethnicity data of its members
All White - Scottish or British White - Other All other ethnic groups

Page 99
226
357
412
701
765
869
909
968
1,002
1,127
1,260
1,474
80
213
160
242
172
119
324
201
485
290
752
584
1,191
1,347
1,075
930
865
1,037
944
817
548
654
429
412
1,156
742
1,000
776
862
644
483
688
636
604
241
197
0% 25% 50% 75% 100%
An annual statement on the composition of roles with reference to theProtected Characteristics
Unconscious bias training
Equality impact assessments
Reports on E&D objectives
An equal pay audit
Published your gender pay gap
E&D training for all staff
An equality lead
Structures to minimise bullying, harassment and sexual harassment
An equality strategy
Flexible working policies
Regular performance reviews
Regular performance reviews were most frequently identified by respondents as provided and consistently applied
Provision, consistently applied Provision but inconsistently applied No provision Don't know

Page 100
Transparency and fairness of pay and reward structures
Transparency of pay and reward structures within organisations
Respondents most frequently felt that pay and reward structures were not transparent. 41% said
that structures were not transparent (n=1,121), while 32% felt they were transparent to some
extent (n=880) and 26% felt they were transparent (n=710).
Fairness of pay and reward structures within organisations
43% of respondents felt that pay and reward structures were fair to some extent (n=1,160). 33%
felt structures were fair (n=878), while 25% felt pay and reward structures were not fair (n=662).
Leaving the profession
54% of respondents had considered leaving the profession in the past five years (n=1,459).
Respondents most frequently stated ‘work-life balance’ as a reason for considering leaving the
profession, followed by ‘better pay or new opportunities’ elsewhere:
331 respondents provided an ‘other’ factor which had prompted them to consider leaving the
profession. These included:
• Bullying, harassment or sexual harassment
• Poor treatment from employers or management
• Pressure of work and stress
• Discrimination
• Health reasons
• More interesting or fulfilling work elsewhere.
134
148
331
467
723
1,029
0% 25% 50% 75%
Retirement
In an uneconomical position
Other
Lack of opportunities within the profession
Better pay or new opportunities elsewhere
Work life balance
71% of respondents identified work-life balance as a reason for considering leaving the profession (n=1,456)
Top Related