


Languages
Pages
Legal


6
Production of Ammonium Waste L
Sulfate Fertilizer from FGD Liquors
First Quarterly Technical Report, 1995
. Submittedto
U. S . Department of Energy Pittsburgh Energy Technology Center
P. O.,Box 10940 Pittsburgh, PA 15236-0940
bY
USDOE Patent clearance prior to the publication of this document ;
DISCLAIMER
Portions of this document may be illegible in electronic image products. Images are produced from the best available original document.
I
Table of Contents
Progress Summary
List of Figures
List of Tables
1. Introduction
2. Physical-Chemical Analysis of Nitrogen-Sulfur Containing Compounds
3. Hydrolysis of Nitrogen-Sulfur Containing Compounds
3.1. Experimental Procedure
3.2. Results and Discussion
4. Crystallization of (NHJ2S04 from the Hydrolyzed Liquor
4.1. Batch Crystallization of (NH,)$04 from the Hydrolyzed Liquor
4.2. Results and Discussion
5. Optimization of Process Variables by Computer Simulation
3
5
6
7
7
8
9
9
10
11
12
13
References
2
17
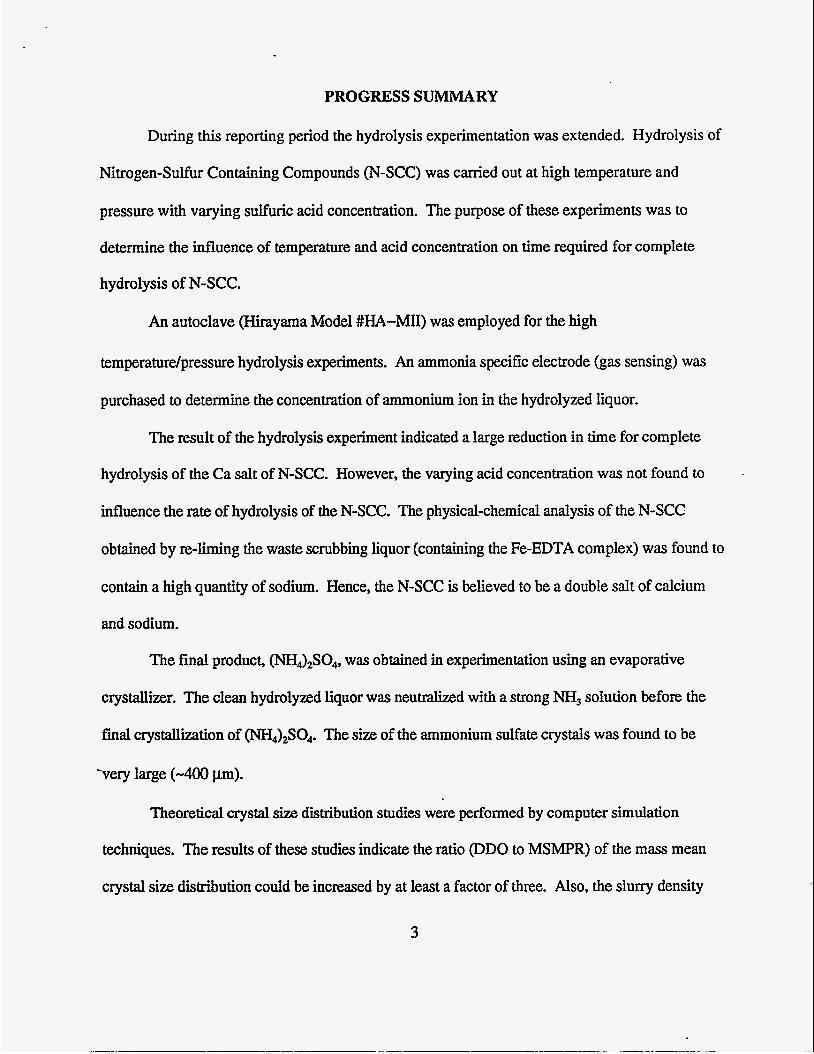
PROGRESS SUMMARY
During this reporting period the hydrolysis experimentation was extended. Hydrolysis of
Nitrogen-Sulfur Containing Compounds (N-SCC) was carried out at high temperature and
pressure with varying sulfuric acid concentration. The purpose of these experiments was to
determine the influence of temperature and acid concentration on time required for complete
hydrolysis of N-SCC.
An autoclave (Hirayama Model #HA-MII) was employed for the high
temperaturdpressure hydrolysis experiments. An ammonia specific electrode (gas sensing) was
purchased to determine the concentration of ammonium ion in the hydrolyzed liquor.
The result of the hydrolysis experiment indicated a large reduction in time for complete
hydrolysis of the Ca salt of N-SCC. However, the varying acid concentration was not found to
influence the rate of hydrolysis of the N-SCC. The physical-chemical analysis of the N-SCC
obtained by re-liming the waste scrubbing liquor (containing the Fe-EDTA complex) was found to
contain a high quantity of sodium. Hence, the N-SCC is believed to be a double salt of calcium
and sodium.
The final product, o\JH,)2so4, was obtained in experimentation using an evaporative
crystallizer. The clean hydrolyzed liquor was neutralized with a strong NH3 solution before the
final crystallization of (NH,)$o.. The size of the ammonium sulfate crystals was found to be
-very large (-400 p).
Theoretical crystal size distribution studies were performed by computer simulation
techniques. The results of these studies indicate the ratio @DO to MSMPR) of the mass mean
crystal size distribution could be increased by at least a factor of three. Also, the sluny density
3
ratio @DO to MSMPR) could be increased by a factor of more than 20. To increase the
accuracy and completeness of these simulations, further DDO and MSMPR crystallizer runs are
necessary.
One obstacle for smooth progress of the present study is the limited supply of waste
scrubbing liquor. No DDO or MSMPR experimentation was conducted due to the lack of waste
scrubbing liquor. To study the influence of many process variables on the optimum mean crystal
size, it is necessary to conduct further tests using the scrubbing liquor.
4
List of Figures
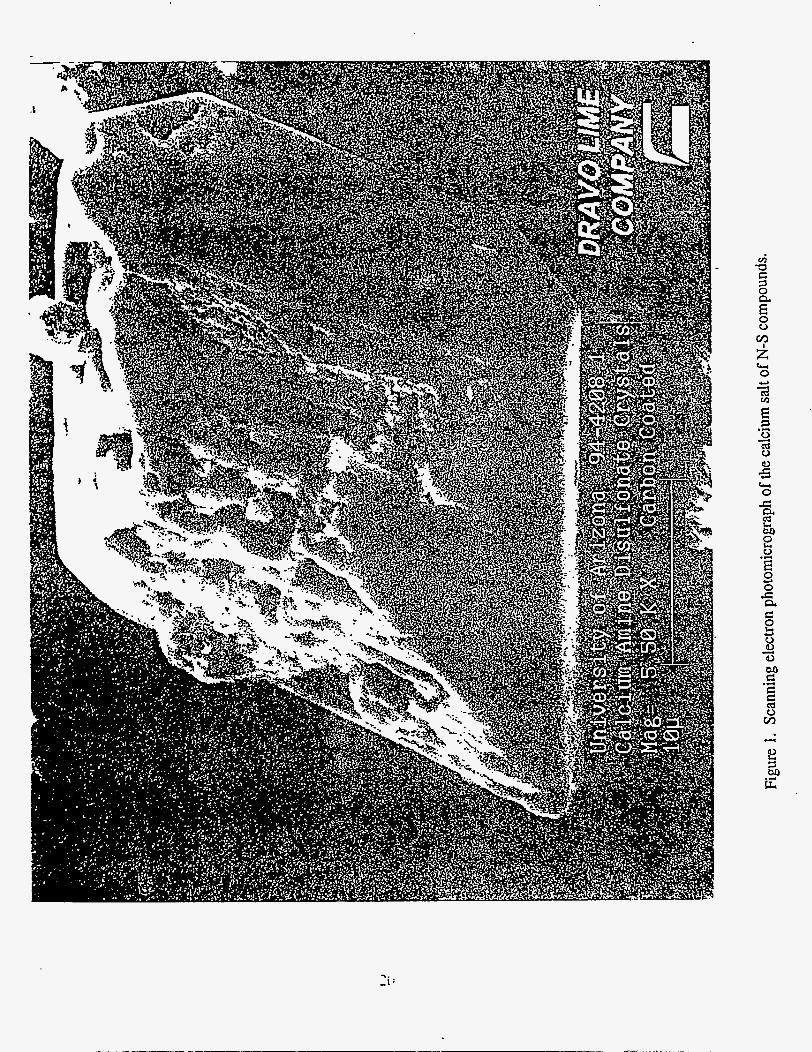
Figure 1. Scanning electron photomicrograph of the calcium salt of N-S compounds
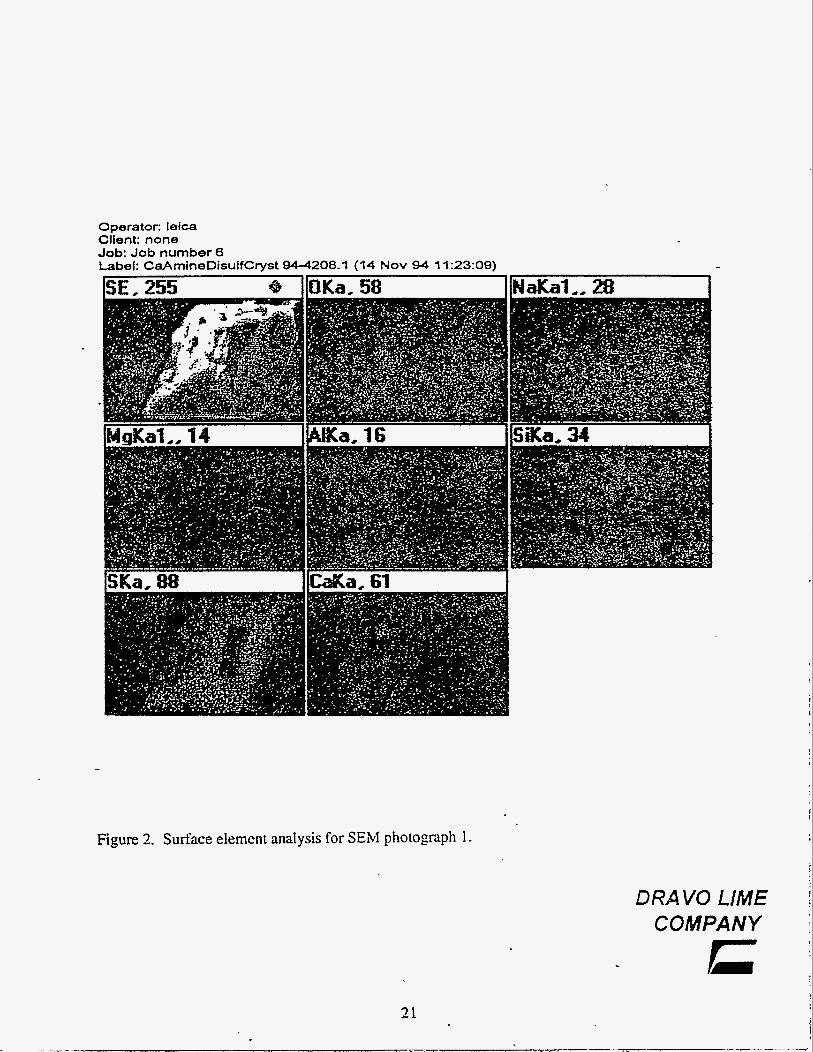
Figure 2. Surface element analysis for SEM photograph 1
Figure 3. X-ray mapping of elements present on the surface of N-S containing compounds
Figure 4. Calibration curve for estimation of NH,+ ion concentration in hydrolyzed liquor
Figure 5. Plot of the high temperatudpressure acid hydrolysis at 0.5 M H2S04
.Figure 6. Plot of the high temperatudpressure acid hydrolysis at 1.0 M H2S04
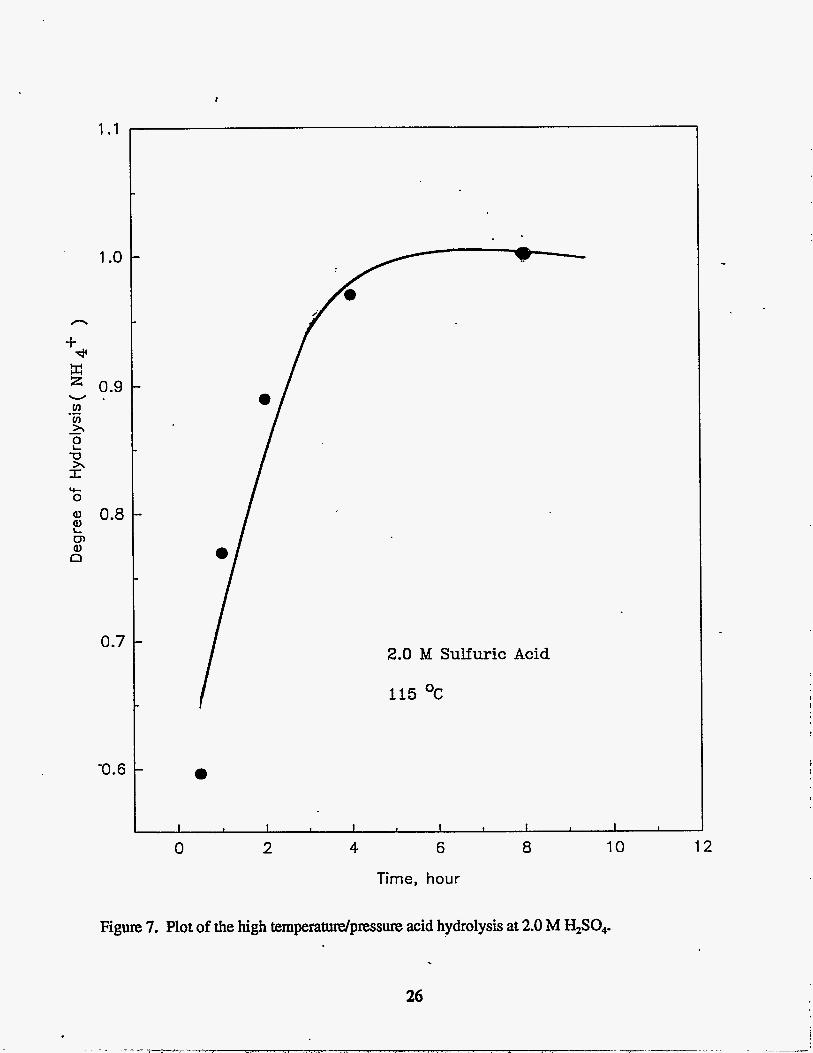
Figure 7. Plot of the high temperatwdpressure acid hydrolysis at 2.0 M H2S04
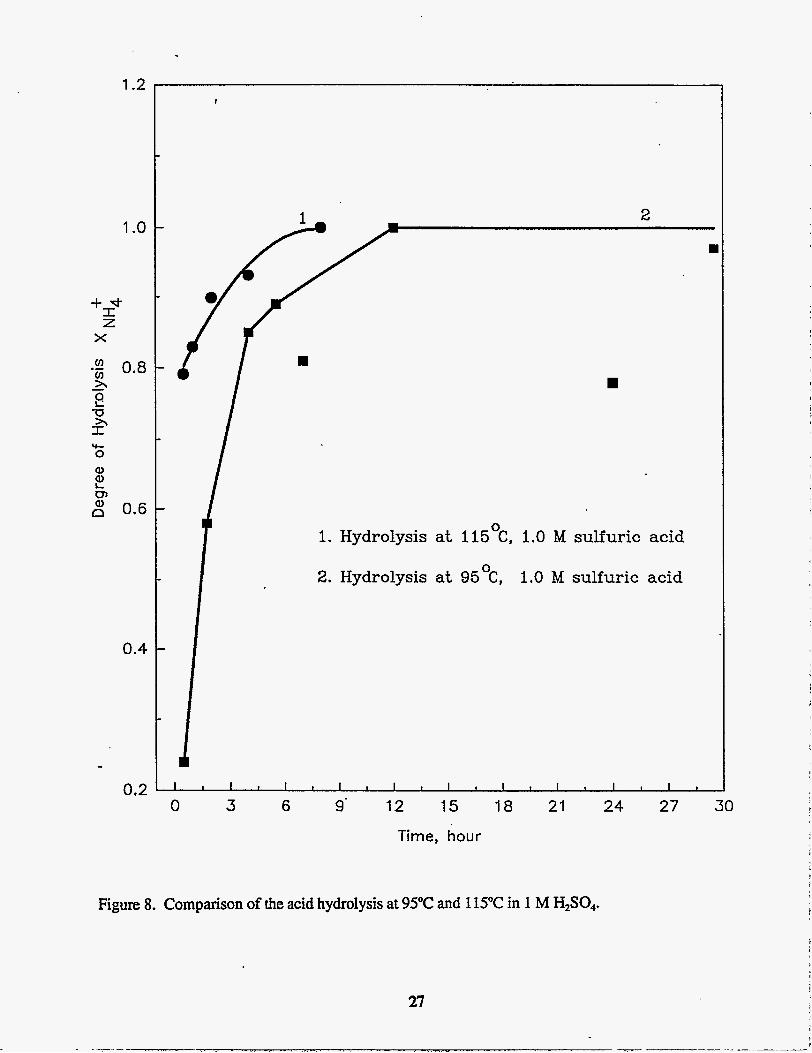
Figure 8. Comparison of the acid hydrolysis at 95°C and 115°C in 1 M H2S04
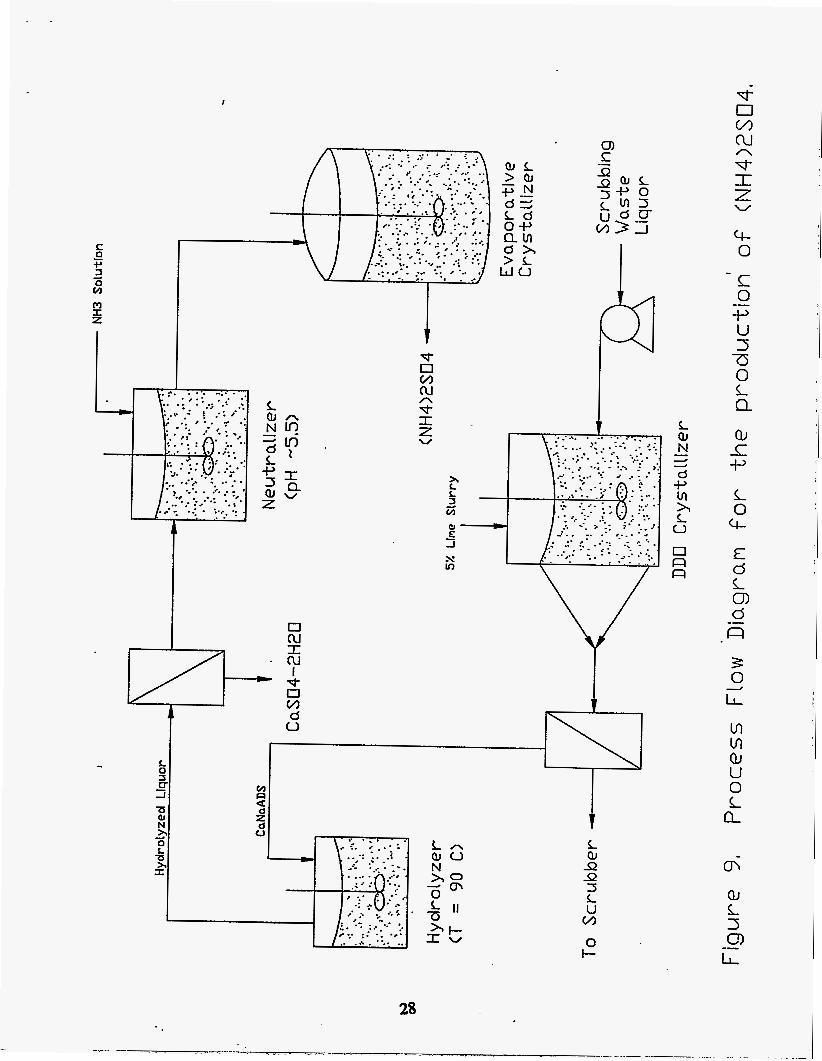
Figure 9. Process Flow Diagram for the production of (Mi4)2so4
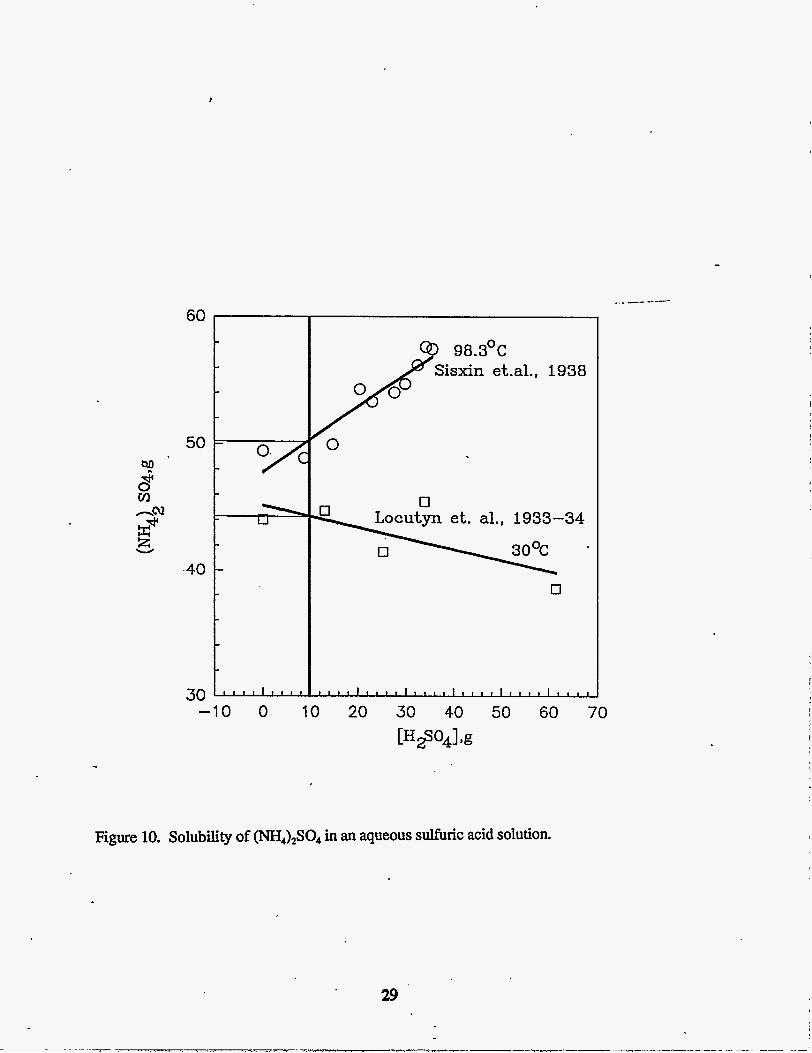
Figure 10. Solubility of (NH,)$o4 in an aqueous sulfuric acid solution
Figure 11. Photomicrograph of gypsum crystals obtained from the hydrolyzed liquor
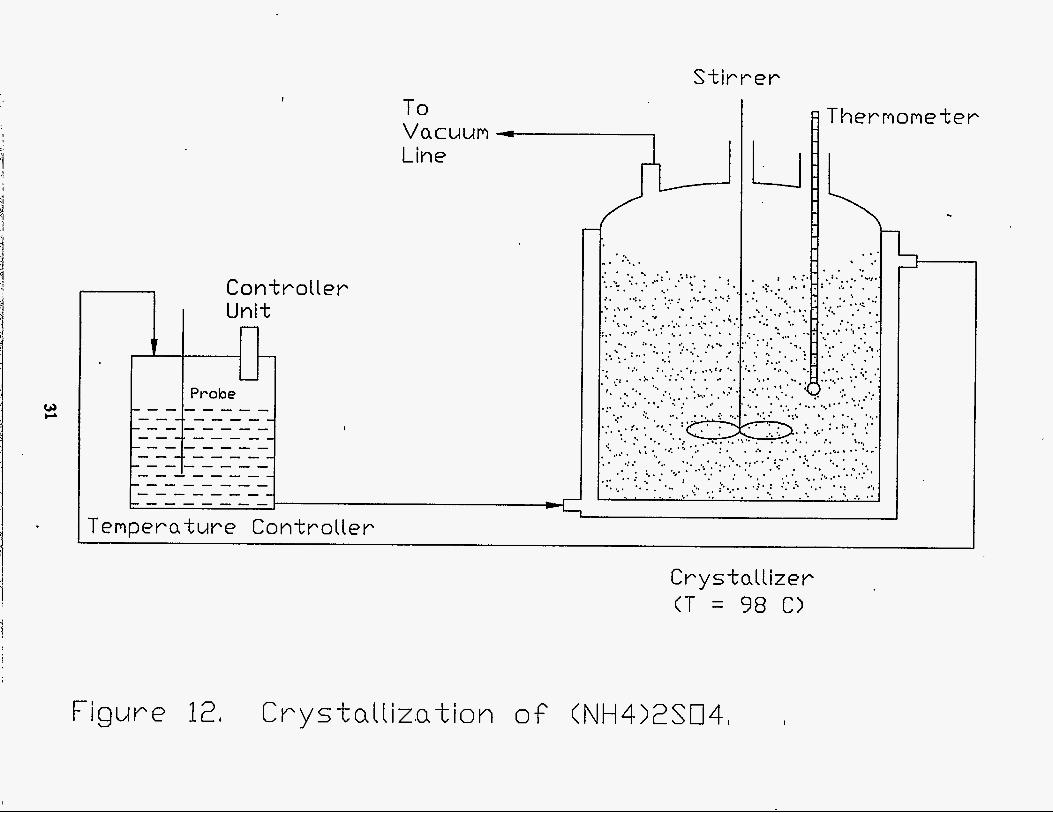
Figure 12. Crystallization of (NH,)2so4 from the neutralized hydrolyzed liquor
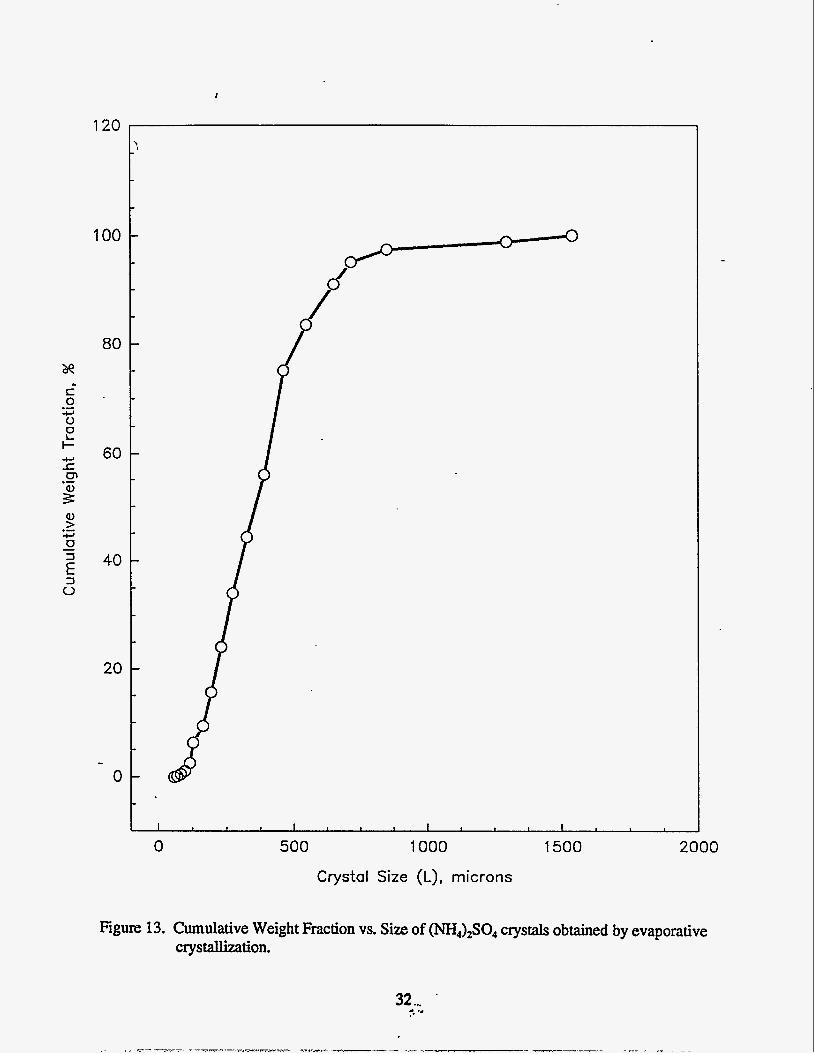
Figure 13. Cumulative Weight Fraction vs. Size of ( m 4 ) 2 s 0 4 crystals obtained by evaporative crystallization
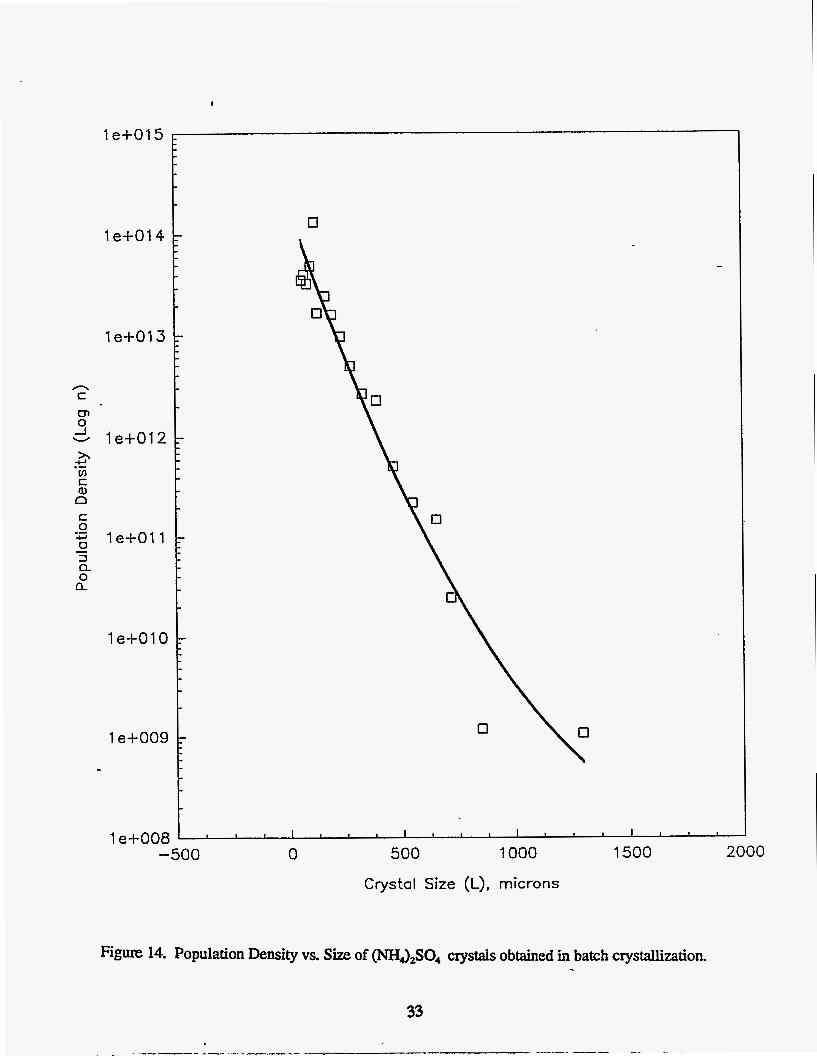
Figure 14. Population Density vs. Size of o\TH,)2so4 obtained in batch crystallization
Figure 15. Photomicrograph of (N&)2s04 crystals at initiation of crystallization; - magnification = 40X
Figure 16. Photomicrograph of (N&)2s04 crystals at initiation of crystallization; magnification = lOOX
Figure 17. Photomicrograph of sieved (NH4)$04 crystals; size = 420 pm; 40X
Figure 18. hhss Mean Size vs. xf; j = 0.5
20
21
22
23
24
25
26
27
28
29
30
31
32
33
34
34
35
! 36
I
5
Figure 19. Mass Mean Size vs. W, j = 0.7
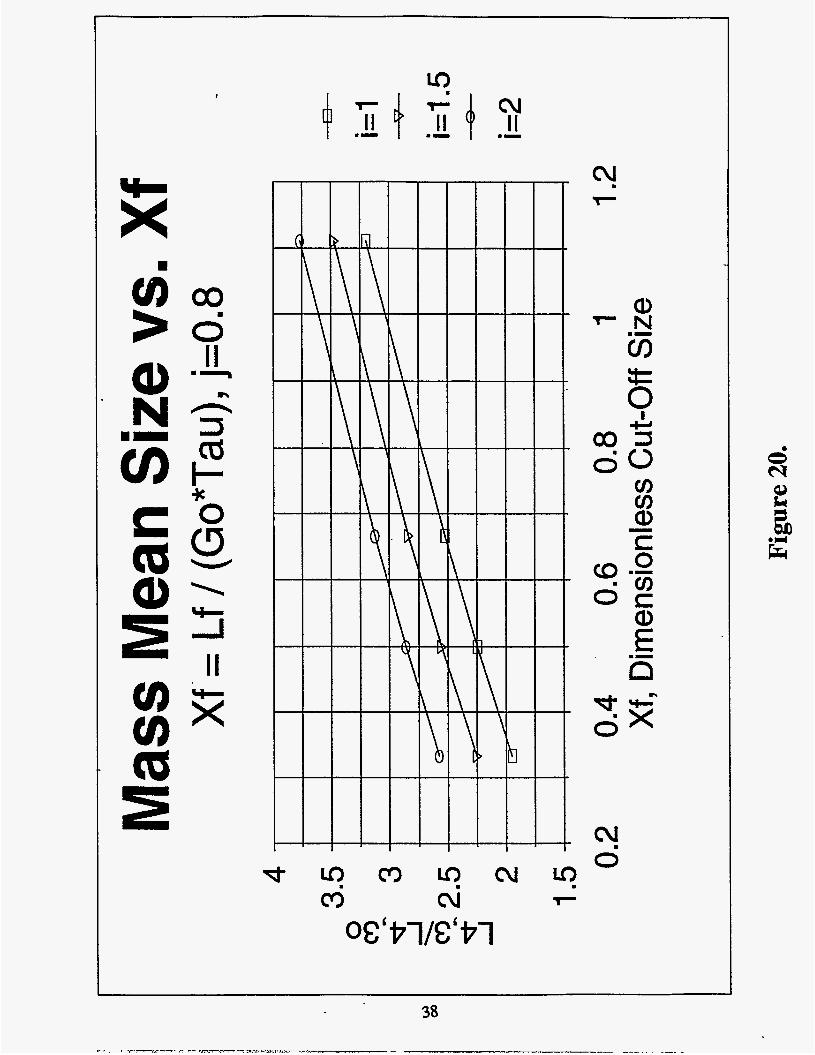
Figure 20. Mass Mean Size vs. Xf; j = 0.8
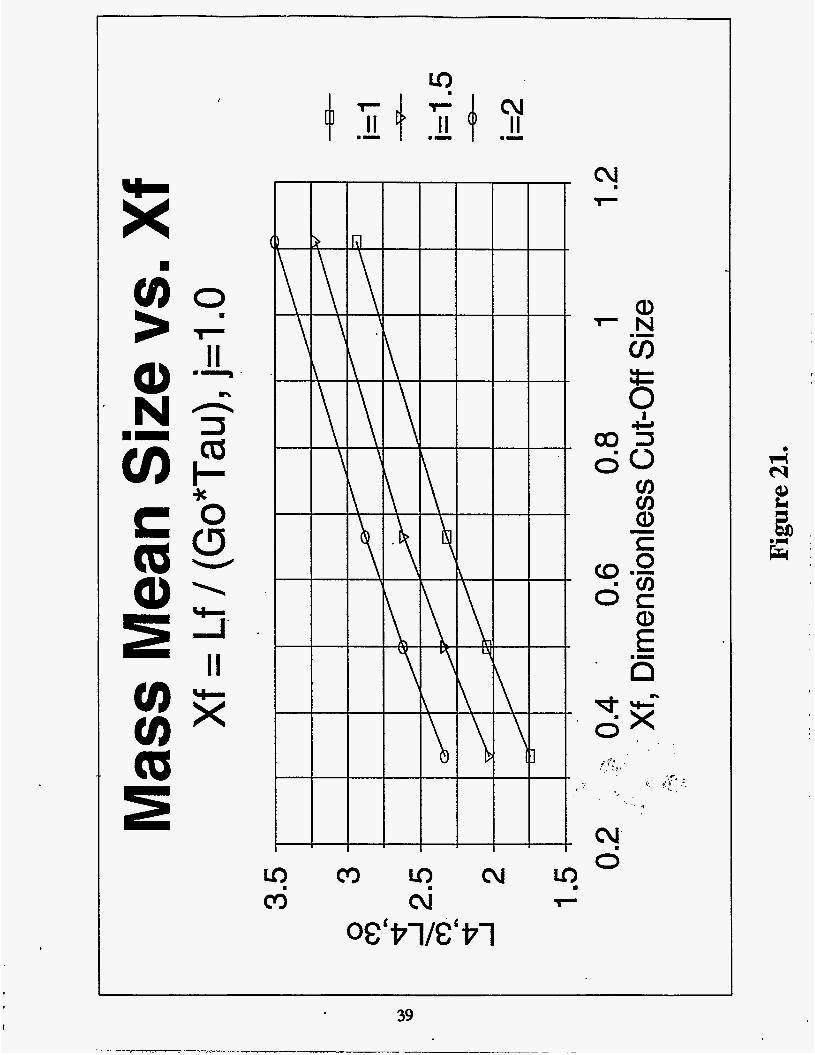
Figure 21. Mass Mean Size vs. Xf; j = 1.0
List of Tables
Table 1. Element analysis for the crystals obtained by re-liming the Dravo waste liquor
Table 2. Comparison of the molar ratios for the theoretical and present experimental salt
37
38
39
18
18
Table 3. Element analysis of final crystalline product obtained by evaporative crystallization 19 of the hydrolyzed liquor.
6
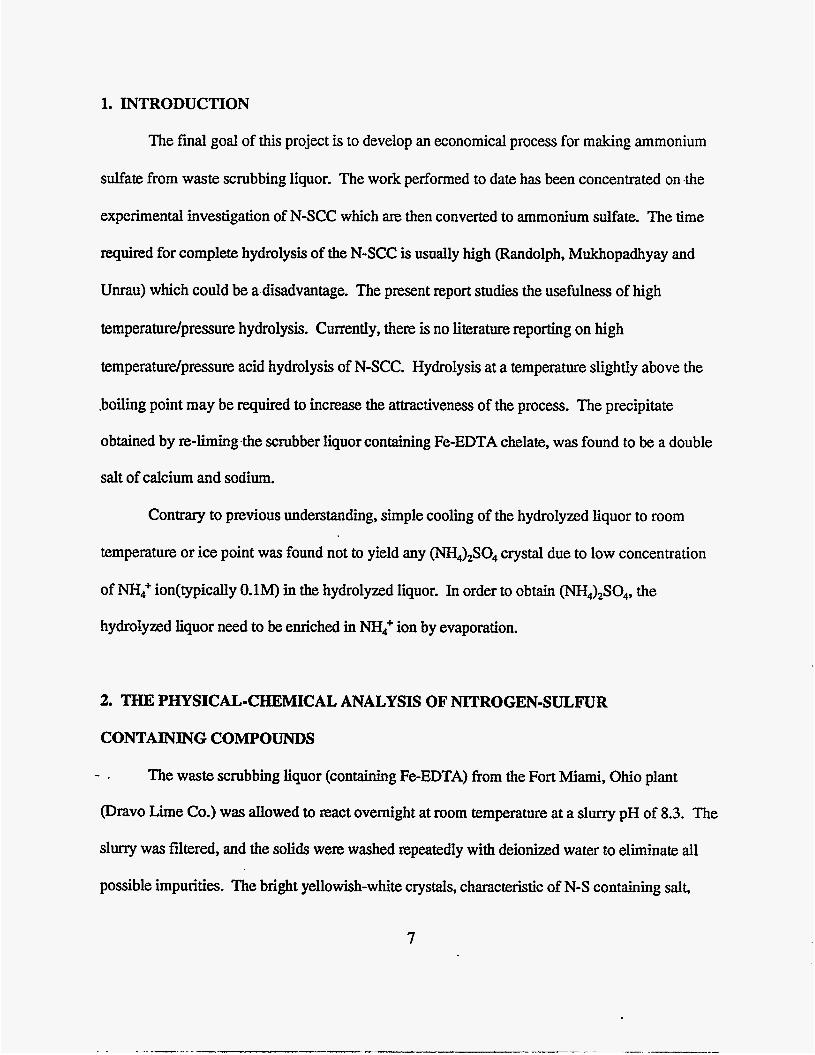
1. INTRODUCTION
The final goal of this project is to develop an economical process for making ammonium
sulfate from waste scrubbing liquor. The work performed to date has been concentrated on the
experimental investigation of N-SCC which are then converted to ammonium sulfate. The time
required for complete hydrolysis of the N-SCC is usually high (Randolph, Mukhopadhyay and
Unrau) which could be a.disadvantage. The present report studies the usefulness of high
temperaturdpressure hydrolysis. Currently, there is no literature reporting on high
temperaturdpressure acid hydrolysis of N-SCC. Hydrolysis at a temperature slightly above the
.boiling point may be required to increase the attractiveness of the process. The precipitate
obtained by re-limingthe scrubber liquor containing Fe-EDTA chelate, was found to be a double
salt of calcium and sodium.
Contrary to previous understanding, simple cooling of the hydrolyzed liquor to room
temperature or ice point was found not to yield any (N&)2s04 crystal due to low concentration
of NH; ion(typicaUy 0.1M) in the hydrolyzed liquor. In order to obtain (NH4)2S04, the
hydrolyzed liquor need to be enriched in NH; ion by evaporation.
2. THE PHYSICAL-CHEMICAL ANALYSIS OF NITROGEN-SULFUR
CONTAINING COMPOUNDS
- . The waste scrubbing liquor (containing Fe-EDTA) from the Fort Miami, Ohio plant
(Dravo Lime Co.) was allowed to react overnight at room temperature at a slurry pH of 8.3. The
slurry was filtered, and the solids were washed repeatedly with deionized water to eliminate all
possible impurities. The bright yellowish-white crystals, characteristic of N-S containing salt,
7
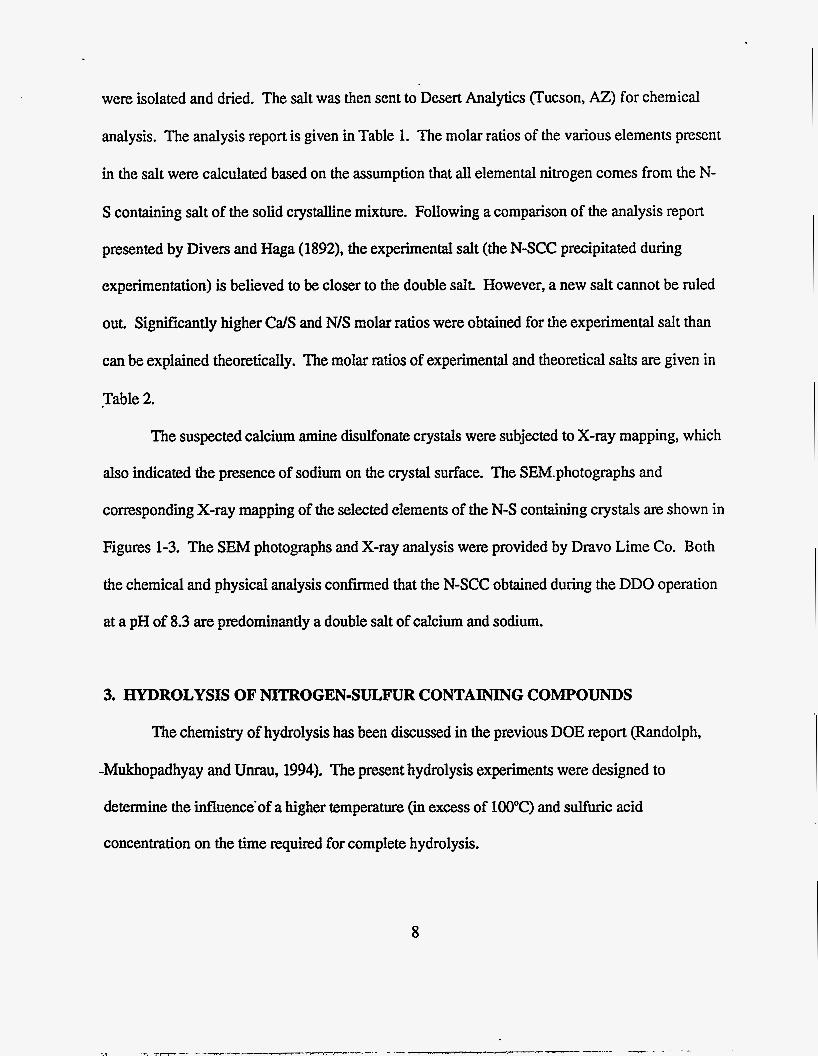
were isolated and dried. The salt was then sent to Desert Analytics (Tucson, AZ) for chemical
analysis. The analysis report is given in Table 1. The molar ratios of the various elements present
in the salt were calculated based on the assumption that all elemental nitrogen comes from the N-
S containing salt of the solid crystalline mixture. Following a comparison of the analysis report
presented by Divers and Haga (1892), the experimental salt (the N-SCC precipitated during
experimentation) is believed to be closer to the double salt. However, a new salt cannot be ruled
out. Significantly higher CdS and N/S molar ratios were obtained for the experimental salt than
can be explained theoretically. The molar ratios of experimental and theoretical salts are given in
.Table 2.
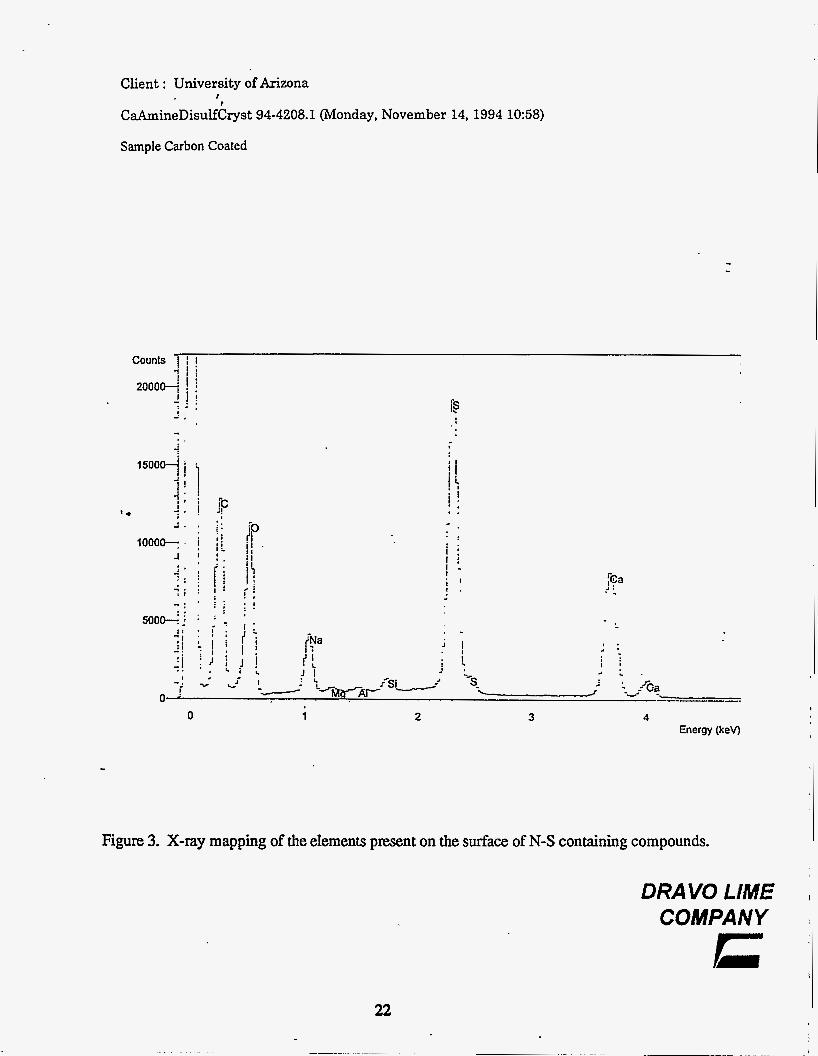
The suspected calcium amine disulfonate crystals were subjected to X-ray mapping, which
also indicated the presence of sodium on the crystal surface. The SEM.photographs and
corresponding X-ray mapping of the selected elements of the N-S containing crystals are shown in
Figures 1-3. The SEM photographs and X-ray analysis were provided by Dravo Lime Co. Both
the chemical and physical analysis confirmed that the N-SCC obtained during the DDO operation
at a pH of 8.3 are predominantly a double salt of calcium and sodium.
3. HYDROLYSIS OF NITROGEN-SULFUR CONTAINING COMPOUNDS
The chemistry of hydrolysis has been discussed in the previous DOE report (Randolph,
-Mukhopadhyay and Unrau, 1994). The present hydrolysis experiments were designed to
determine the influence'of a higher tempera- (in excess of 100°C) and sulfuric acid
concentration on the time required for complete hydrolysis.
8
3.1. Experimental Procedure
High temperature-pressure hydrolysis of N-SCC were carried out using an autoclave
(Hirayama Model #HA-MII). Two grams of uniformly sized N-SCC crystals were placed in a set
of 500 ml Erlenmeyer flasks with 100 ml of sulfuric acid. Three sulfuric acid concentrations (0.5
M, 1.0 M, 2.0 M) were used for the present study. The flasks were closed with autoclavable
silicon sponge closures, which allow alleviation of pressure while reducing evaporation and
preventing the passage of aerosols. The flasks were then placed in the autoclave to hydrolyze the
N-SCC at 115°C (0.75 Kg/cm2 gauge pressure). The experimental run time ranged from 0.5 to 8
hours. A total of fifteen experiments were conducted to accommodate the study. The hydrolyzed
samples were cooled to room temperature, filtered, and then analyzed for the ammonia nitrogen
concentration.
3.2 Results and Discussion
The concentration of NE&+ ion in the hydrolyzed liquor was calculated by monitoring the
dissolved ammonia in aqueous solution with a gas-sensing Orion ammonia electrode (Model No.
95-12). This gas-sensing electrode measures the ammonium ion concentration in solution after
converting it to NH, by the addition of alkali. For accurate measurement of ammonium ion
concentration, a blue color indicator was used to indicate the comct solution pH.
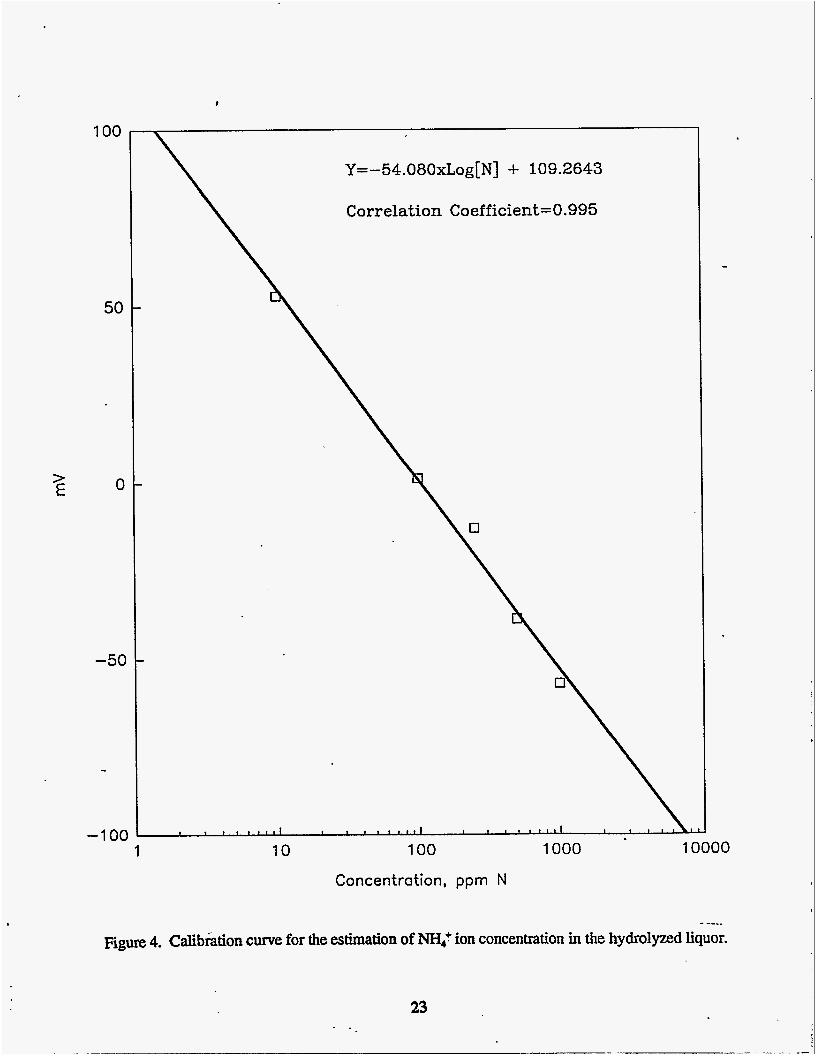
- Before calculating the concentration of NH; ion in the hydrolyzed solution, a calibration
line was established for the electrode by measuring the mV reading at some known concentrations
of "ammonia N (e.g. 10-1OOO ppm N). Figure 4 shows the calibration curve for the estimation of
the NH; ion concentration in hydrolyzed liquor. To measure the concentration of NH; ion, the
9
hydrolyzed liquor was diluted to bring down the concentration of N to between 10-loo0 ppm.
100 ml of the diluted hydrolyzed liquor was placed in a 150 ml beaker, and 2 ml of Ionic
Strength-Adjustor (ISA, Orion Cat. W51211) was added to correct the pH. A blue color
developed at this stage. The solution mixture was then placed on a magnetic stirrer and stirred
gently. The NH, electrode was rinsed with distilled water before being placed in the solution.
The millivolt (mV) value was recorded when a stable reading was reached. The concentration of
the NH,+ ion in the hydrolyzed liquor was calculated from Figure 4.
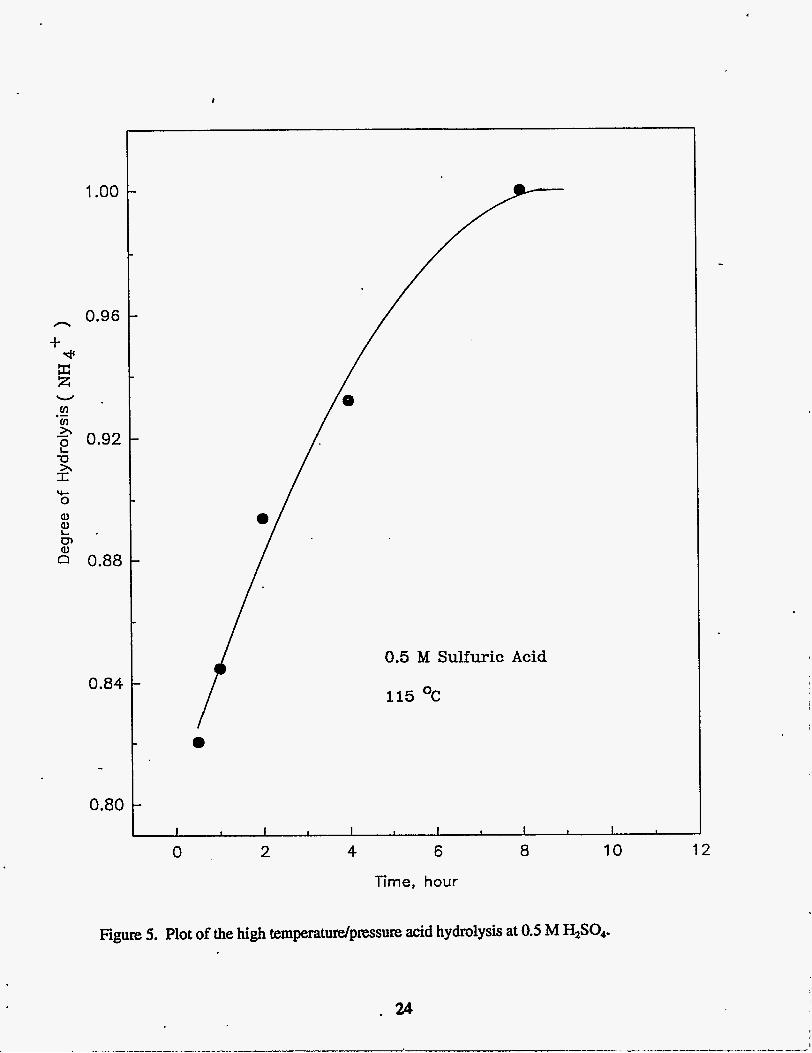
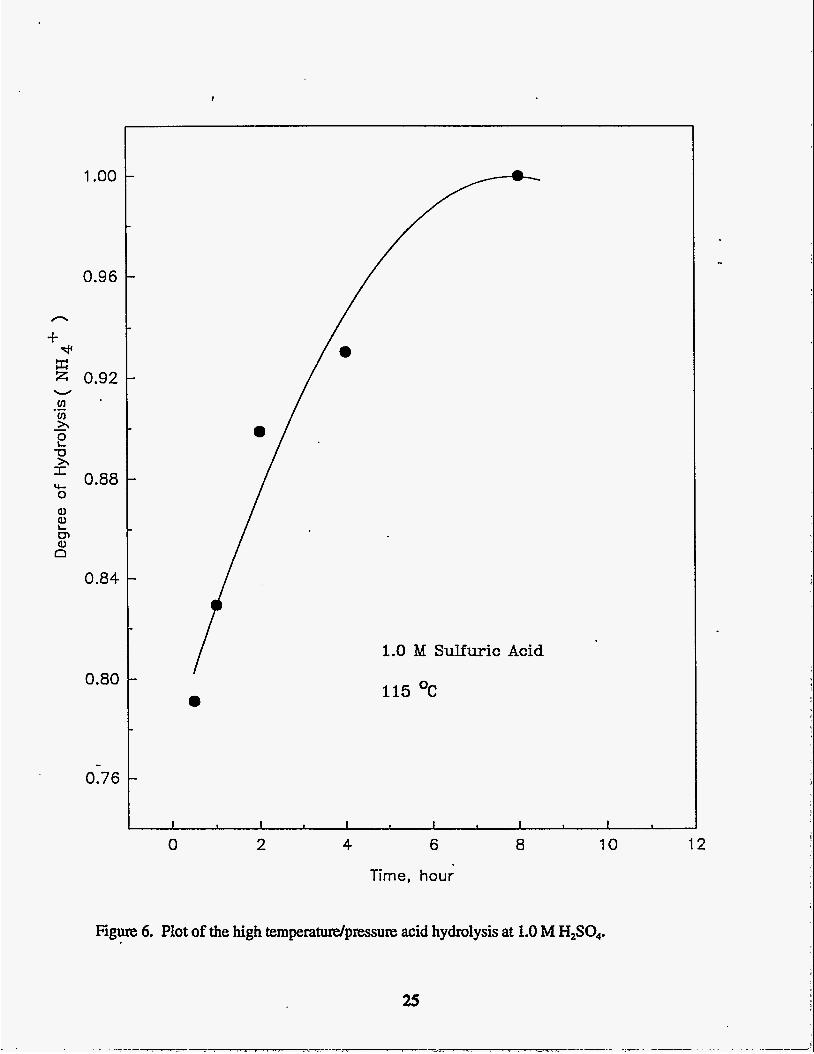
The results of the hydrolysis experiments a ~ e given in Figures 5 through 8. Comparison of
Figure 5 with Figures 6 and 7 indicate that the rate of hydrolysis does not depend on the sulfuric
acid concentration. Thus, for all concentrations (0.5 M, 1.0 M, 2.0 M) in Figures 5 through 7,
90% of the hydrolysis was achieved in approximately 2.5 hours. It is interesting to note that the
temperature has a large effect on the rate of hydrolysis. Figure 8 provides a comparison of the
hydrolysis profile for N-SCC at 95°C and 115°C in 1 M H2S04. At 1 15°C (0.75 Kg/cm2 gauge
pressure), hydrolysis proceeds at a much faster rate than at 95°C. Although the initial rates are
very different at these two temperatures, with time the difference in the rate of hydrolysis
diminishes. About 90% of hydrolysis was accomplished within 2.5 hours at 115"C, while it took
almost 6 hours to attain the same degree of hydrolysis at 95°C (Figure 8).
-4. CRYSTALLIZATION OF AMMONIUM SULFATE FROM THE HYDROLYZED
LIQUOR
Hydrolyzed liquor contains the NH; ion which can be precipitated as (NH4)2S04. First
however, the liquor, which has a very low pH (0.1-l.O), needs to be neutralized partially up to a
10
I
!
pH of approximately 5.5. Next, to initiate (Nk&)$04 crystallization, the NH; ion concentration
in the liquor need to be raised at least to the saturation level by evaporation. The process flow
diagram for the production of (NH4)2S04 from Dravo waste liquor is given in Figure 9.
4.1. Batch Crystallization of Ammonium Sulfate from Hydrolyzed Liquor
The typical concentration of NH; ion in the hydrolyzed liquor is around 0.1-0.2 M. The
solubility of (NH,J2S04 at room temperature is approximately 43 grams per 100 grams of
saturated solution as shown in Figure 10 (Seidell, 1940). Therefore, severe evaporation of the
hydrolyzed liquor is required before crystals of (NH4)2S04 could be precipitated.
500 ml of hydrolyzed liquor is filtered to obtain clean liquor. The solids contain mainly
CaS0,-2H,O. The photomicrograph of these solids is shown in Figure 11. The pH of the liquor
was then adjusted to approximately 5.5 using a 27% strong ammonia solution. The clean
hydrolyzed liquor of pH -5.5 is then transferred into an evaporative crystallizer shown in Figure
12. About 1% (w/V) phosphoric acid is added to the hydrolyzed liquor in order to obtain crystals
of favorable habit. Next, the mixture was heated up to -80°C under vacuum to increase the NH;
ion concentration in solution. A magnetic stirrer bar was used to keep the solution gently
agitated. At the first sign of precipitation, the agitation was stopped in order to minimize
secondary nucleation. The evaporated, concentrated hydrolyzed liquor was subsequently cooled
-down to room temperature slowly. The white crystalline ammonium sulfate was then dried.
11
4.2 Results and Discussion
The dried (N&)$o4 crystals were sieved for size analysis using an Allen-Bradley sonic
sifter, and the average crystal size was found to be high. Figure 13 shows the cumulative weight
percent of ammonium sulfate crystals in various size ranges. From this plot, the mass average size
of the product crystals was 420 pm (Figure 13). The results of this ammonium sulfate
crystallization experiment are satisfactory in terms of the average product crystal size, however,
further study of the continuous precipitation of (NH4)$04 from hydrolyzed liquor is needed. The
population density of the ammonium sulfate crystals in various size ranges is shown in Figure 14.
At the Same time, these crystals were analyzed for chemical composition. The chemical
analysis of the ammonium sulfate crystals obtained by evaporation and cooling of the hydrolyzed
liquor is given in Table 3. This analysis was done by Desert Analytics in Tucson, AZ. The
product composition calculated from the element analysis was 89.7% (r\TH4)$04 (assuming all
nitrogen in the analysis originated from m4)$04), the residual was gypsum and magnesium
sulfate.
A sample of the cooling concentrated hydrolyzed liquor was taken at the first sign of
(NH4)2S04 crystal formation. The Sample was placed on a glass slide and observed under an
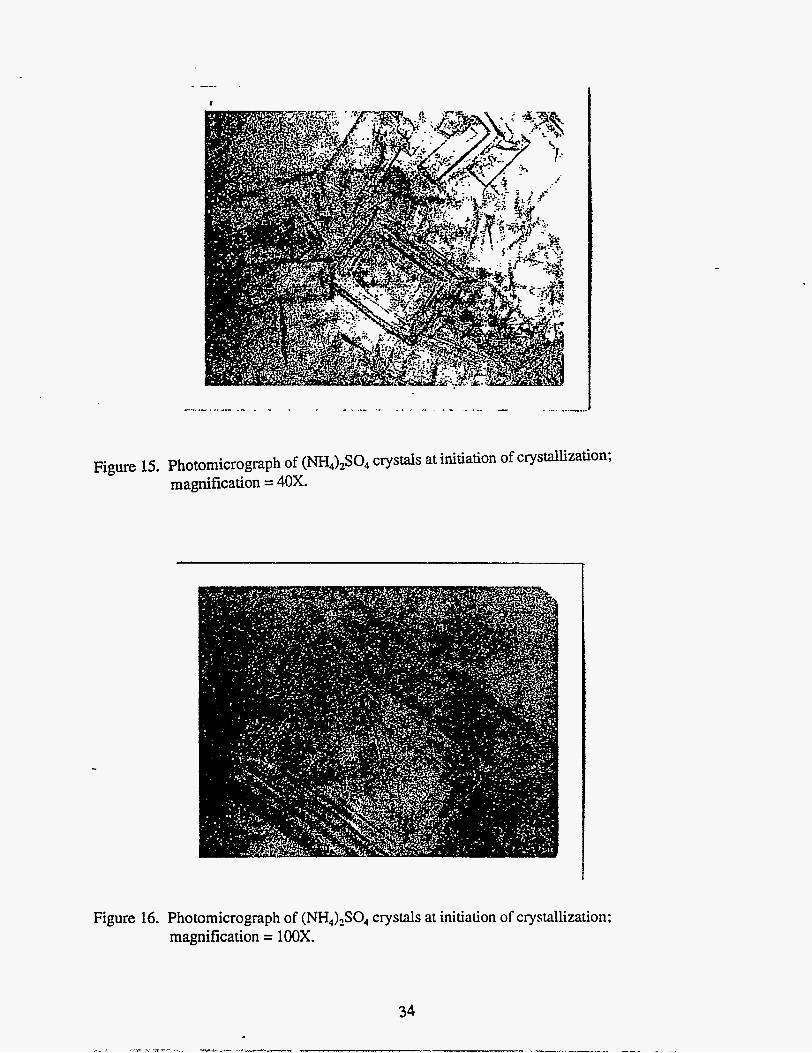
optical microscope. Figures 15 and 16 show the photomicrographs of the (ETH4)2so4 crystals at
the early stage of crystallization. The final product has shown to be quite large in size. The sieve
analysis indicated the mass average size to be -420 pm (Figure 13). The photomicrograph of the
sieved crystals (mass average size -420 pm) is shown in Figure 17.
12
5. OPTIMIZATION OF DESIGN VARIABLES BY COMPUTER SIMULATION
Computer simulations were run to optimize crystal growth and nucleation rate design
variables. All data in this section was obtained solely through theoretical computer simulation;
currently, no experimental data exist to confirm these results. In the following discussion, an
understanding of MSMPR and DDO crystallizer operation by the reader is assumed. The crystal
growth and nucleation rate equations are:
G = ks'
Bo = k,G'M,j,
respectively (White and Randolph, 1989). Where,
G = growth rate
k, = growth rate constant
s = supersaturation
a = exponent linking growth rate to supersaturation
Bo = nucleation rate
kN = nucleation rate constant
i = exponent linking nucleation rate to growth rate
MT = suspension density
j = exponent linking nucleation rate to suspension density, (White and
Randolph, 1989).
The computer program used is entitled DDO.FOR, (Randolph and Sutradhar, 1992). Its
purpose is to estimate ratios of the MSMPR (Mixed Suspension Mixed Product Removal) reactor
output parameters to the DDO (Double Draw Off) reactor output parameters. Imputing values to
13
the computer of the MSMPR per pass yield, a (exponent above), i and j (exponents above), the
DDO ratio, and a dimensionless cut-off size will result in output consisting of the DDO per pass
yield, and ratios @DO to MSMPR) of growth rates (GIGo), slurry densities OVIT/MTo), and mass
mean sizes (L,4,JL,4,30). Note that the MSMPR values are denoted by the subscript "0".
The current system input parameten were calculated or estimated from previous
experiments. The variables throughout the simulations were i and j, the exponents relating the
crystal nucleation rate to the growth rate and the suspension density, respectively. An adjustable
parameter was X, the dimensionless cut-off size:
Where,
Xf = Lf / (G,T).
Lr = crystal fines cut-Off size
Go = MSMPR growth rate
z = reactor residence time, (Randolph and Sutradhar, 1992).
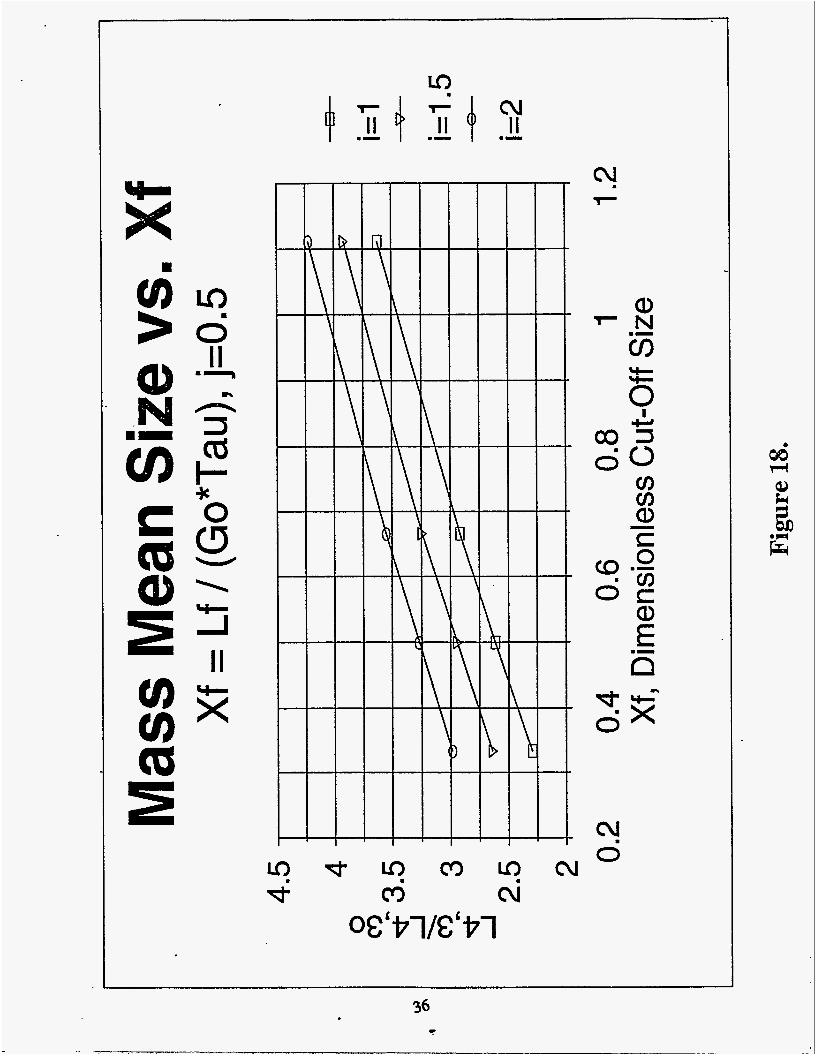
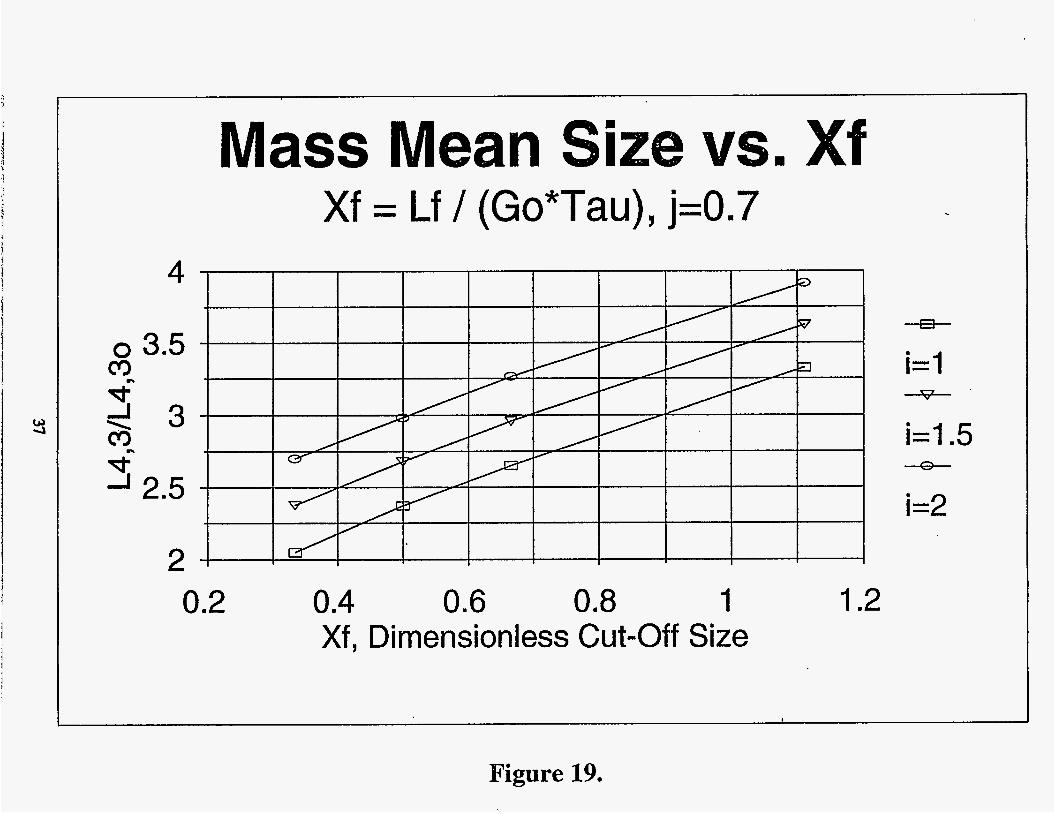
Using crystal fines cut-off sizes of 30,45,60, and 100 pm for DDO operation, plots were
obtained for the mass mean size vs. X, Output data was also obtained for the growth rates, slurry
densities, and DDO per pass yield. In the simulations, i was allowed to vary between 1 and 2,
where j was allowed to vary from 0.5 to 1. For the following discussion, please refer to Figures
18 through 21. In a l l four figures, as i is increased the mass mean size ratio also increases.
However, as j increases, the mass mean size ratio decreases. A large effect is also shown from the
dimensionless cut-off size, &. As Xr is Gcreased, the mass mean size increases. Hence, as bigger
crystals are removed from the reactor, the remaining crystals are of a larger size population. The
average crystal size remaining will be increased, thus the resulting mass mean size ratio is
-
14
i -- -- I---
increased. An optimum for increasing the mass mean size ratio is found at i = 2, j = 0.5, and X, =
1.1 1 (1OOpm). However, the parameters estimated from previous experiments show that the
approximate fines cut-off size is 30-50 p. For X, = 0.33 (30 pm), the optimum is observed to
be L4,”/L4,30 = 2.99 at i = 2 and j = 0.5. For X, = 0.5 (45 pm), the optimum is observed to be
L4,”/L4,% = 3.27 at i = 2 and j = 0.5. These simulation results show the m a s mean size for DDO
operation is estimated to increase by a factor of three over MSMPR operation at the optimum i
and j values. At these same parameter values, i = 2 and j = 0.5, the growth rate ratio, G/Go, is
shown to be 0.25, which is its maximum value for these simulations. This means the DDO crystal
growth rate is only 0.25 times the crystal growth rate during MSMPR operation. Although, at
these i and j values, the per pass yield is not at its maximum, its value is 0.88, which is
approximately 95% of its maximum value of 0.93. The slurry density ratio shows similar
behavior. Although it is not at its maximum value of 24.05, the slurry density ratio has a value of
22.87, which is again 95% of its maximum.
The data for the per pass yield and the slurry density ratio are less sensitive to changes in i
and j as are the growth and mass mean size ratios, which can both vary as much as 40%,
depending on the (i,j) pair chosen.
An advantage of DDO operation is the large increase of slurry density, which even at the
lower factor of 22.87, shows a large increase over the MSMPR slurry density. This large - increase in slurry density comes from the overall increase in crystal size and residence time during
the DDO operation (Le. the DDO operation removes the small crystal sizes from the crystallizer
and leaves the larger sized crystals in the reactor for continued growth). The drop in growth rate
during DDO operation to 0.25 its MSMPR value is also linked to the increase in both residence
15
time and crystal size.
Another advantage of DDO operation is the increase in the mass mean size, which
theoretically can be increased by a factor of three. As the smaller crystal size population is
removed, the mass mean size within the reactor will increase. As i is increased, the effect of
growth rate on nucleation rate is emphasized. For this case, the DDO growth rate is less than 1
pdmin, and the larger emphasis effect will cause the nucleation rate to decmse. Since the
nucleation rate is lowered, fewer crystals will nucleate, leaving more reactant to be consumed by
the growing larger crystals. Similarly, as j is decreased, this removes the influence of the
suspension density from the nucleation rate (Le. here the suspension density is larger than unity).
The nucleation rate is again lowered, and the same effect results.
In conclusion, these simulations show decreasing the nucleation rate will increase the
average mass mean crystal size in solution during DDO operation. The parameters that have been
adjusted to decrease the nucleation rate were the exponents i and j. Different crystal removal cut-
off sizes were also used. Another method to increase the average crystal mass mean she is to
increase the cut-off size. However, if the cut-off size is increased too much, the average mass
mean crystal size will begin to drop (White and Randolph, 1989). For the experimental set up, the
crystal cut-off size could be increased to loat pm. Currently, the crystal cut-off size is 30-45
16
References
Divers, E. and Haga, T. "- 'I, J. Chem SOC. 61,943, 1892.
.. Randolph, A. D., Mukhopadhyay, S. and Unrau, E. "Production of 7
FGD W-, DOE Quarterly Technical Report, October-December 1994.
Randolph, A. D. and Sutradhar, B. C. "Instructions for the Use of Programs DDO.FOR. FD.FOB
&DO.FQB", Dept. of Chem. Eng., University of Arizona, 1992.
Seidell, A. "Solubilities of Inorganic and Organic Compounds", D. Van Nostrand Company, Inc.,
NY, 1940
. . White, E. T. and Randolph, A. D. 'I- for Classificahon m Double Draw-Off"
Qy&&as, Ind Eng. Chem Res., 28,276-284, 1989.
17
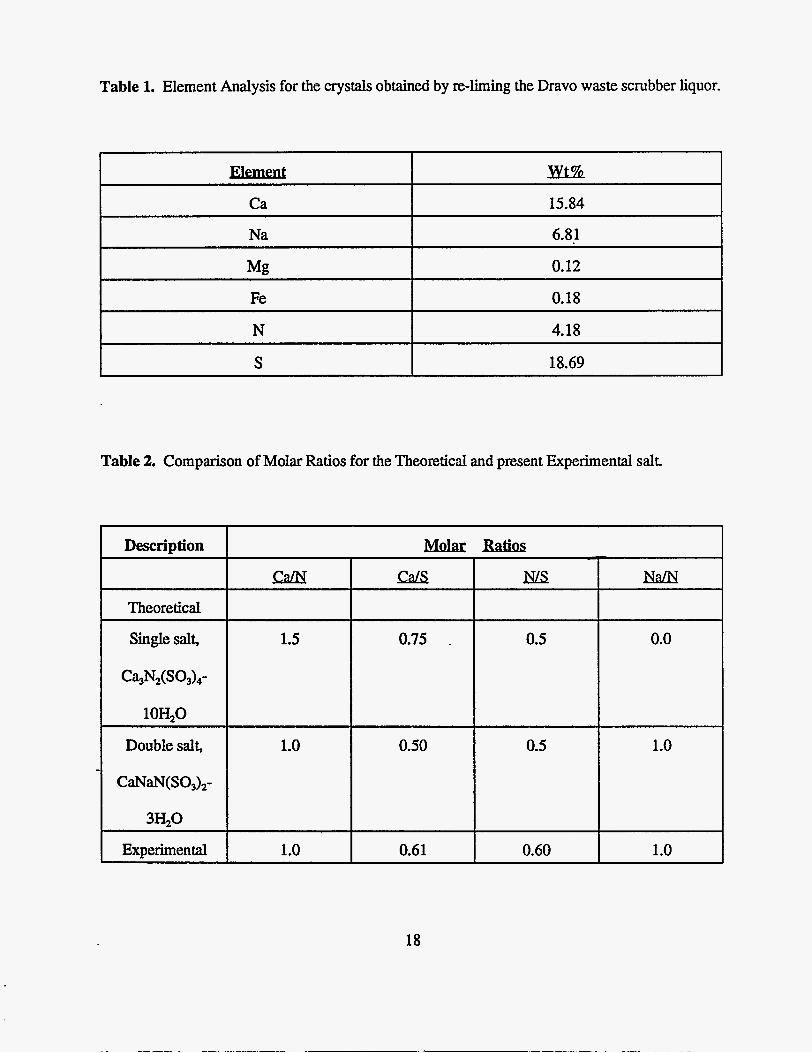
Table 1. Element Analysis for the crystals obtained by re-liming the Dravo waste scrubber liquor.
I Element Wt% Ca
Na
Mg Fe
I N
15.84
6.8 1
0.12
0.18
S
Description
Theore tical
Single salt,
c%N2(s03)4-
10H20
Double salt,
CaNaN( SO3),-
3H20
Experimental
4.18
cam
1.5
1.0
1 .o
18.69
Table 2. Comparison of Molar Ratios for the Theoretical and present Experimental salt,
18

Table 3. Element Analysis of the final crystalline product obtained by evaporative crystallization of hydrolyzed liquor.
ca
Mg
I I
4300 ppm
540 PPm
Element I
Fe
N
so,"-
0.03 ppm
18.46 % '
64.52 %
-
19
. - . . .._ . . . -.
Operator: leica Client: none Job: Job number 6 Label: CaAmineDisutfCryst 94-4208.1 (14 Nov 94 11:23:09) -
0 - 28 1
Figure 2. Surface element analysis for SEM photograph 1.
DRAVO LIME COMPANY r
21
Client : University of Arizona
CaAmineDisulfCryst 94-4208.1 Wonday, November 14, 1994 1058)
Sample Carbon Coated
I t
: - , ! ' - .
- 1 . . . .
. .
4 Energy (keV)
Figure 3. X-ray mapping of the elements present on the surface of N-S containing compounds.
DRAVO LIME COMPANY r
1
22
100
50
0 > E
-5c
-
-1 oc 1000 10000 1 10 100
Concentration, ppm N
- ---. Figure 4. Calibration curve for the estimation of NH: ion concentration in the hydrolyzed liquor.
1 .oo
0.96 n
0.88
0.84
0.80
I
0.5 M Sulfuric Acid
115 OC
1 I I I I I I I I I I
0 2 4 6 a 10 12
Time, hour
Figure 5. Plot of the high temperaturelpressure acid hydrolysis at 0.5 M H,SO,.
n
* x z
3-
W
VI cn .- - h e 73 x I
0 a, a, I cn a,
rc
n
1 .oo
0.96
0.92
0.88
0.84
0.80
017 6
1.0 M Sulfuric Acid
115 OC
4 6
Tim e, hour
8 10 12
Figure 6. Plot of the high temperatudpressure acid hydrolysis at 1.0 M H2S04.
25
1 - -- ---- .~ I
1 . I
1 .o
0.9
0.8
0.7
-0.6
2.0 M Sulfuric Acid
115 OC
4 6
Time, hour
I t I I t I t 1 1 I
0 8 10 12
Figure 7. Plot of the high temperatudpressure acid hydrolysis at 2.0 M H,SO.,.
26
1.2
1 .o
+I?- Z
X
.- a 0.8
2 3
(I) x
-0
-
Y- O Q)
cn 2
0.6
0.4
- 0.2
2
I
1. Hydrolysis at llS°C, 1.0 M sulfuric acid
2. Hydrolysis at 95OC, 1.0 M sulfuric acid
I I I I I I 1 I I I I I I 1 1 I I 1 I 1
0 3 6 9' 12 15 i a 21 24 27 30
Time, hour
Figure 8. Comparison of the acid hydrolysis at 95°C and 115°C in 1 M H2S04.
21
I
, -b /7.:.v;.:;j . . ., . .. ,. . . .-:. .:.*. . .-. - , .. . .- . .. . . ' 5. $ . . > ... ...... \.. .:e., . :: :: . .:...'. :.. :. , -.. . C .. ,.
28
!
~. . c ---
z W
60
50
40
30
et.al., 1938
0
Locutyn et. al., 1933-34 i* 0
-10 0 10 20 30 40 50 60 70
[H$041 sg
Figure 10. Solubility of (NH4)$04 in an aqueous sulfuric acid solution.
29
!
S t i r r e r I
To
Line P Vacuum
I Cont ro l le r I I U n i t
. * e . * .
.* -. . * . , . ...... ,..: . . . . . . . :I.* . . .
:. '* ....... ' . * -2 * .. *i,
.. .. . . . . . . . . . * .. ..:. .... : .......... ,: .. *, ..... .. . . . . . . . .
.. *a:.* ... 1 . . . . . . . .
. . . -.e.
, .
* .. :. . . . . . . . . . . . .... . . . . . . . . .. *. ' : ,. . :. . : :*.: . . . . . . . : . . : : * . . . . 1 , * . . .* . . .: . . . . . . . . .
fl Thermometer
1
Temperature Con t ro l l e r
C rys ta l l i ze r (T = 98 C >
Figure 121 CrystaIIiz.o.tion o f (NH4>2S04,
I
120
100
80
60
40
20
0 500 1000
Crystal Size (L), microns
1500 2000
Figure 13. Cumulative Weight Fraction vs. Size of (NH4),S0, crystals obtained by evaporative crystallization.
32 ... - ..
n C
0, 0 -J W
x v) t= a
c 0
0 3
0 a
4 .- n
.- -w - a
le+015
1 e+014
1 e+013
1 e+012
le+011
1 e+010
1 e+009
-
1 e+008 -500 0 500 1000
Crystal Size (L), microns
2000 1500
Figure 14. Population Density vs. Size of (NH&SO, crystals obtained in batch c r y s e t i o n . -
33
I
Figure 15. Photomicrograph of (m4)$04 crystals at initiation of crystallization; magnification = 40X.
Figure 16. Photomicrograph of (NH,)?SO, crystals at initiation of crystallization; magnification = 1OOX.
34
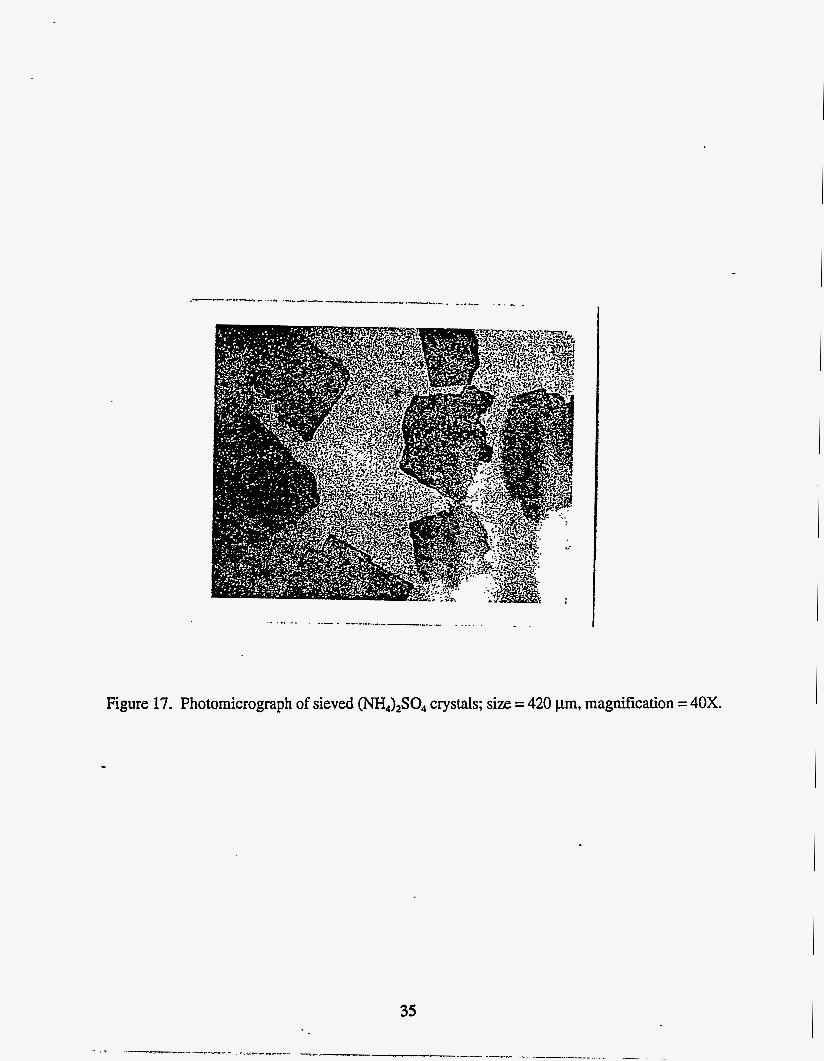
Figure 17. Photomicrograph of sieved (NH,),SO, crystals; size = 420 pm, magnification = 40X.
35
Ln
II n 3 (d I-
0 =.
h
* U s \
5 II
X I.
m -u O€ ' V l E ' Vl
36 r
w 4
Mass Mean Siz Xf = Lf / (Go*Tau), j=0.7
...
CI
d= 2.5
0.2 0.4 0.6 0.8 1 Xf, Dimensionless Cut-Off Size
i=l --B-
i=l.5
i=2
Figure 19.
I.
>
cn
v)
00 0
I
h
n 23
I. I
I.
d-
\ -
t -I
i I
m m m c,j ni
\
I
c\1
38
n
0 m m m cv m c,j 1
O€'Pl/E'Pl
39
Top Related