


Languages
Pages
Legal

t
Production of Ammonium Sulfate Fertilizer from FGD Waste Liquors k-ffi*- 73PG f J a X
Second Quarterly Technical Report, April - June 1995
Submitted to
U. S. Department of Energy Pittsburgh Energy Technology Center
P. 0. Box 10940 Pittsburgh, PA 15236-0940
A. D. Randolph, S. Mukhopadhyay and E. Unrau Department of Chemical and Environmental Engineering
University of Arizona Tucson, Az 85721
5z =":
JSDOE Patent clearance is required prior to the publica
DISCLAIMER
Portions of this document may be illegible in electronic image products. Images are produced from the best available original document.
. I
Table of Contents
Progress Summary
List of Figures
List of Tables
1. Introduction
2. Continuous Precipitation of Nitrogen-Sulfur Containing Compounds (N-SCC) in the Double Draw-Off (DDO) Crystallizer
2.1. Experimental Procedure
2.2. Results and Discussion
3. Hydrolysis of Nitrogen-Sulfur Containing Compounds
3.1. Experimental Procedure
3.2. Results and Discussion
4. Optimization of DDO Parameters by Computer Simulation
References
5
5
6
7
7
8
8
12
DISCLAIMER
This report was prepared as an account of work sponsored by an agency of the United States Government. Neither the United States Government nor any agency thereof, nor any of their employees, makes any warranty, express or implied, or assumes any legal liability or responsi- bility for the accuracy, completeness, or usefulness of any information, apparatus, product, or process disclosed, or represents that its use would not infringe privately owned rights. Refer- en= herein to any specific commercial product, process, or service by trade name, trademark, manufacturer, or otherwise does not necessarily constitute or imply its endorsement, recom-
' mendation, or favoring by the United States Government or any agency thereof. The views and opinions of authors expressed herein do not necessarily state or reflect those of the United States Govetnment or any agency thereof.
2
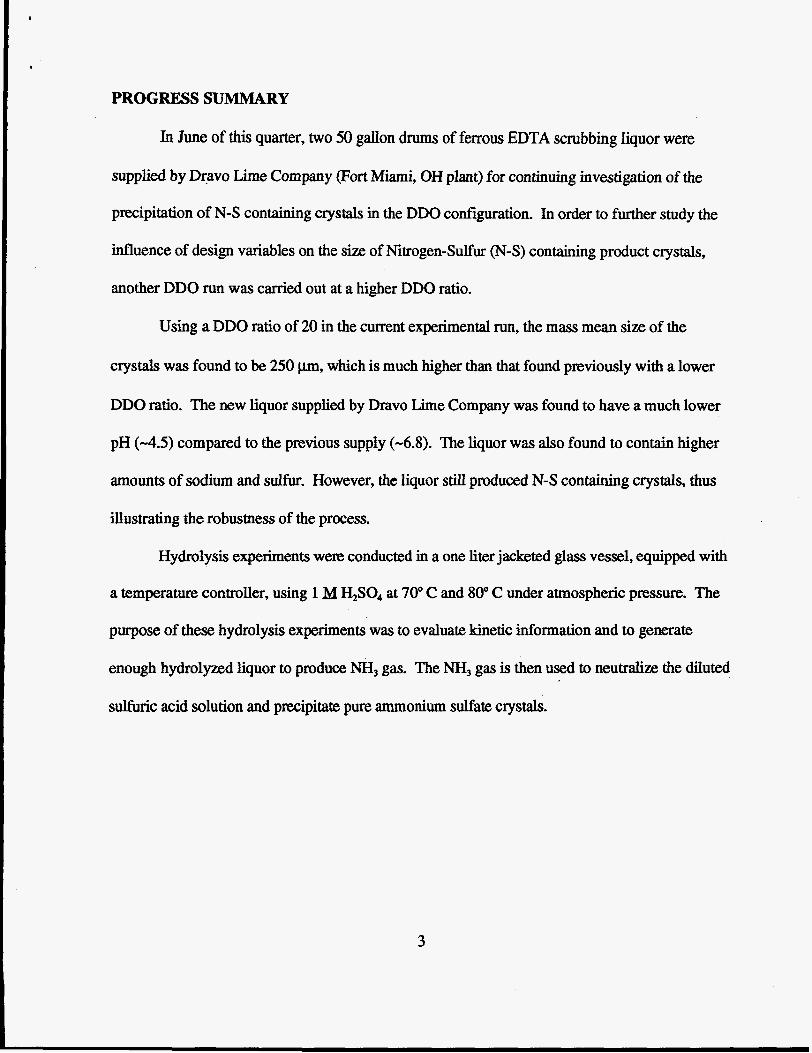
PROGRESS SUMMARY
In June of this quarter, two 50 gallon drums of ferrous EDTA scrubbing liquor were
supplied by Dravo Lime Company (Fort Miami, OH plant) for continuing investigation of the
precipitation of N-S containing crystals in the DDO configuration. In order to further study the
influence of design variables on the size of Nitrogen-Sulfur (N-S) containing product crystals,
another DDO run was carried out at a higher DDO ratio.
Using a DDO ratio of 20 in the current experimental run, the mass mean size of the
crystals was found to be 250 pm, which is much higher than that found previously with a lower
DDO ratio. The new liquor supplied by Dravo Lime Company was found to have a much lower
pH (-4.5) compared to the previous supply (-6.8). The liquor was also found to contain higher
amounts of sodium and sulfw. However, the liquor still produced N-S containing crystals, thus
illustrating the robustness of the process.
Hydrolysis experiments were conducted in a one liter jacketed glass vessel, equipped with
a temperature controller, using 1 M &SO4 at 70" C and 80" C under atmospheric pressure. The
purpose of these hydrolysis experiments was to evaluate kinetic information and to generate
enough hydrolyzed liquor to produce NH, gas. The NH, gas is then used to neutralize the diluted
sulfuric acid solution and precipitate pure ammonium sulfate crystals.
3

List of Figures
Figure 1. Cumulative weight fraction vs. size of the N-S containing crystals
Figure 2. Popylation density vs. size of N-S containing crystals
Figure 3. Photomicrograph of N-S containing crystals in the product slurry
Figure 4. Photomicrograph of 250 pm N-S containing crystals at 40X magnification
Figure 5. Photomicrograph of 250 pm N-S containing crystals at 1OOX magnification
Figure 6. Plot of the progress of hydrolysis at 70" C and 1.0 M H2S04
Figure 7. Plot of the progress of hydrolysis at 80" C and 1.0 M H$04
Figure 8. Comparison of the acid hydrolysis at 70" C, 80" C, and 95" C in 1.0 M H2S04
Figure 9. Mass Mean Ratio vs. DDO Ratio; Cut-Off Size = 30 microns
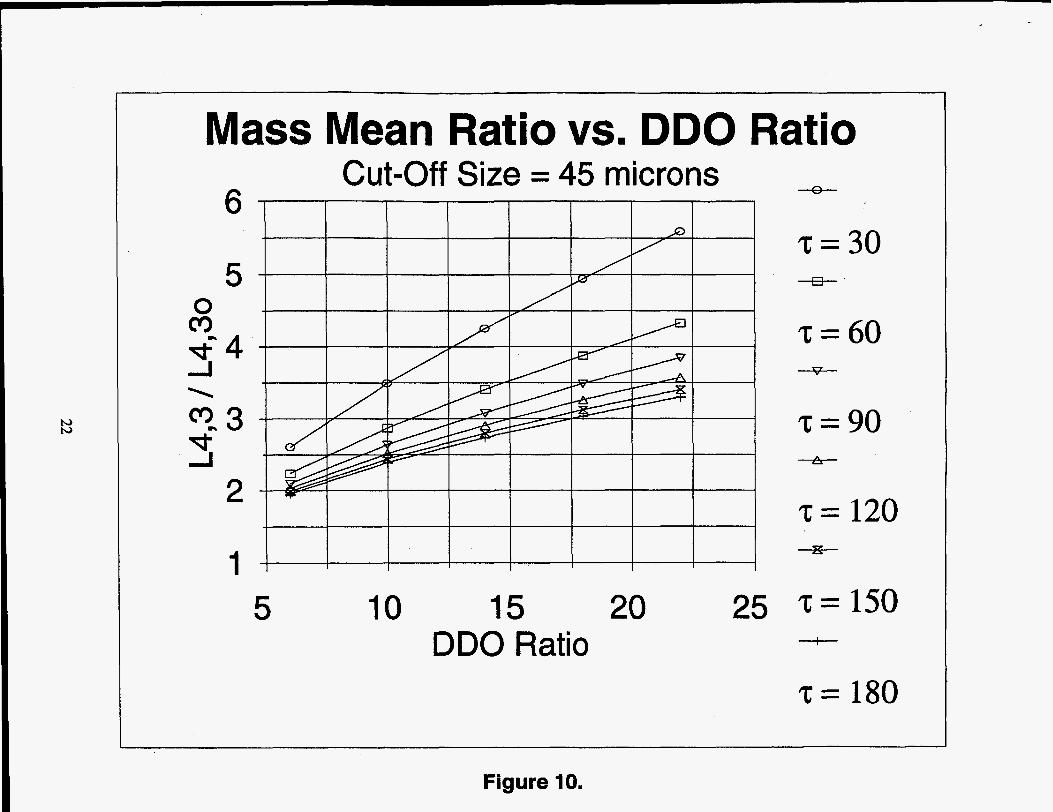
Figure 10. Mass Mean Ratio vs. DDO Ratio; Cut-Off Size = 45 microns
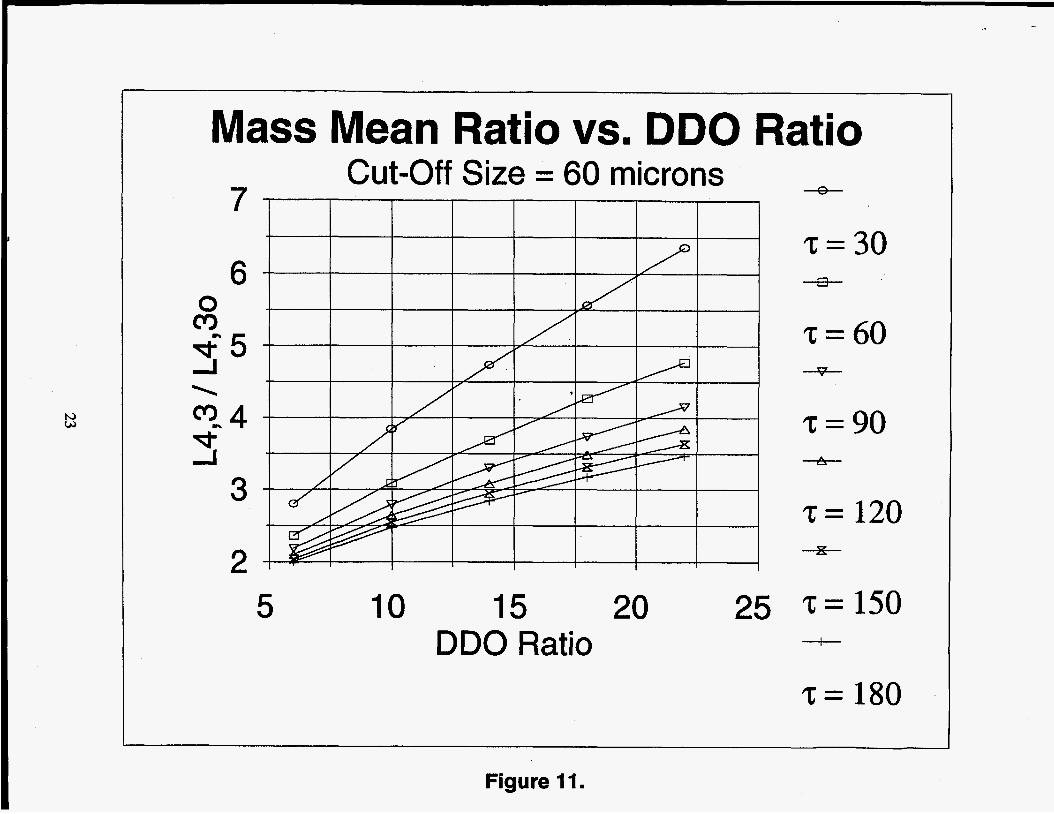
Figure 11. Mass Mean Ratio vs. DDO Ratio; Cut-Off Size = 60 microns
Figure 12. Mass Mean Ratio vs. DDO Ratio; Cut-Off Size = 100 microns
List of Tables
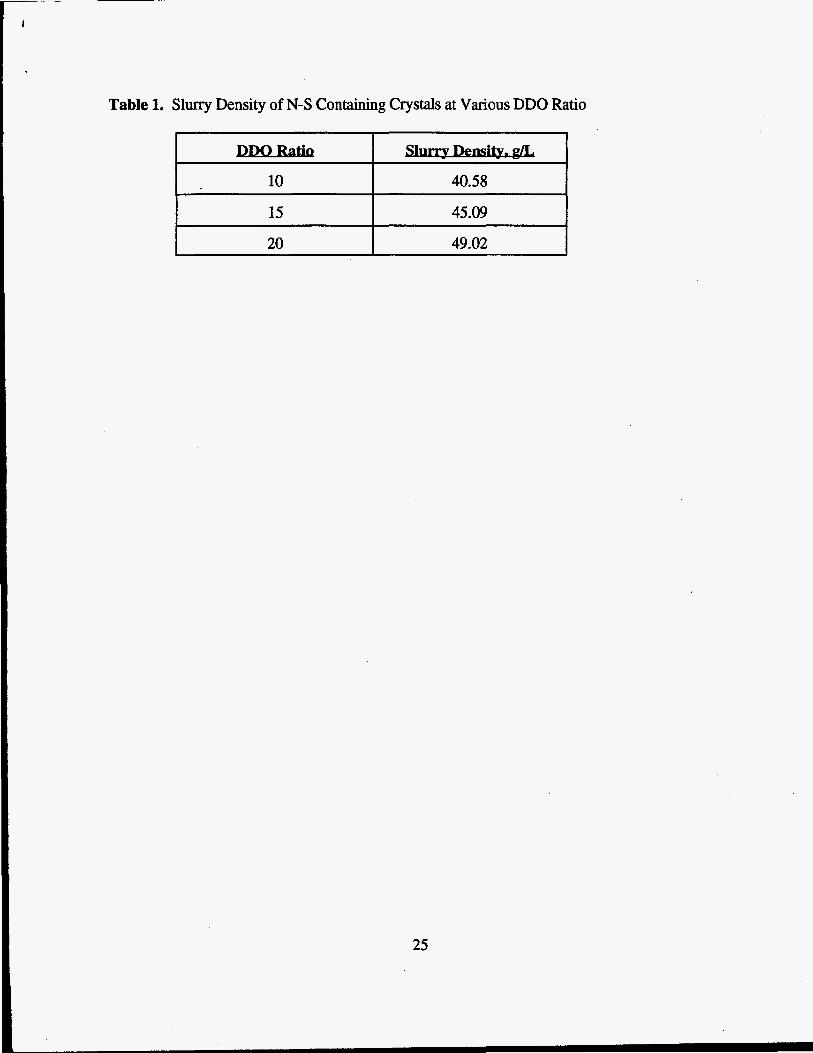
Table 1. Slurry Density of N-S Containing Crystals at Various DDO Ratios
13
14
15
16
17
18
19
20
21
22
23
24
25
4
1. INTRODUCTION
The process of making fertilizer grade ammonium sulfate requires the successful
precipitation of N-S compounds from combining ferrous EDTA scrubbing liquor with a lime
slurry. Following precipitation, the N-S containing double salt is hydrolyzed to generate the NH:
ion. The hydrolyzed liquor could subsequently be neutralized with an ammonia solution to a
desired pH before crystallizing (NH4),S0,. However, considering the current production cost,
another process is being investigated. Instead of neutralizing the hydrolyzed liquor with a
separate ammonia solution, it is possible to generate the ammonia gas by reliming the hydrolyzed
liquor itself, and using this ammonia gas to neutralize the remaining hydrolyzed acid solution for
the subsequent production of ammonium sulfate crystals. This process would lower the yield of
ammonium sulfate, but could greatly lower the production cost.
2. CONTINUOUS PRECIPITATION OF NITROGEN-SULFUR CONTAINING COMPOUNDS (N-SCC) IN THE DOUBLE DRAW-OW (DDO) CRYSTALLIZER
The description of the DDO crystallizer and its advantages are described in the previous
report (Randolph, Mukhopadhyay, Unrau, Oct.-Dec. 1994). The purpose of the present study is
to produce N-SCC from the ferrous EDTA scrubbing liquor for production of (N&),s04, and to
examine the improvement in the crystal size distribution at a higher DDO ratio.
2.1. Experimental Procedure
The experimental set-up of a 7 liter DDO crystallizer is given in the previous report
(Figure 7, Randolph, Mukhopadhyay, Unrau, Oct-Dec. 1994). The feed scrubbing liquor and
lime slurry flow rate were chosen as to retain a residence time of approximately 60 minutes, to be
5
consistent with the previous runs. The present source of scrubbing liquor was found to be more
acidic (pH - 4.5) compared to the previous supply (pH - 6.8). Therefore, the lime flow rate was
increased at the expense of the feed flow rate (to keep the vessel residence time at 60 minutes).
The overflow of the crystallizer was continuously drawn off via an inverted 3.5 x 30 cm glass
cone tube. The underflow from the crystallizer was set to discharge at long time intervals with a
higher flow rate to avoid clogging the discharge line. The mixture of underflow and overflow
represent the true product from the vessel. The product from the DDO crystallizer was filtered,
and dried for evaluation of the slurry density. The crystals were sieved for size analysis by a sonic
sifter. The crystal samples were also examined for their morphology and chemical composition.
2.2. Results and Discussion
The mean vessel residence time (2) for the DDO run was 54.0 minutes. The initial pH of
the reactor slurry was -4.5. During the experiment the pH was controlled around a set point of
8.3. The underflow (QJ and overflow (Qb were controlled to obtain a DDO ratio (R =
(Q,+QJ/QJ of approximately 20. Observations revealed the DDO ratio has a profound influence
on both the slurry density and on the crystal mass mean size. Table 1 displays the slurry density of
crystalline product at various DDO ratios. It is interesting to note that the slurry density inmased
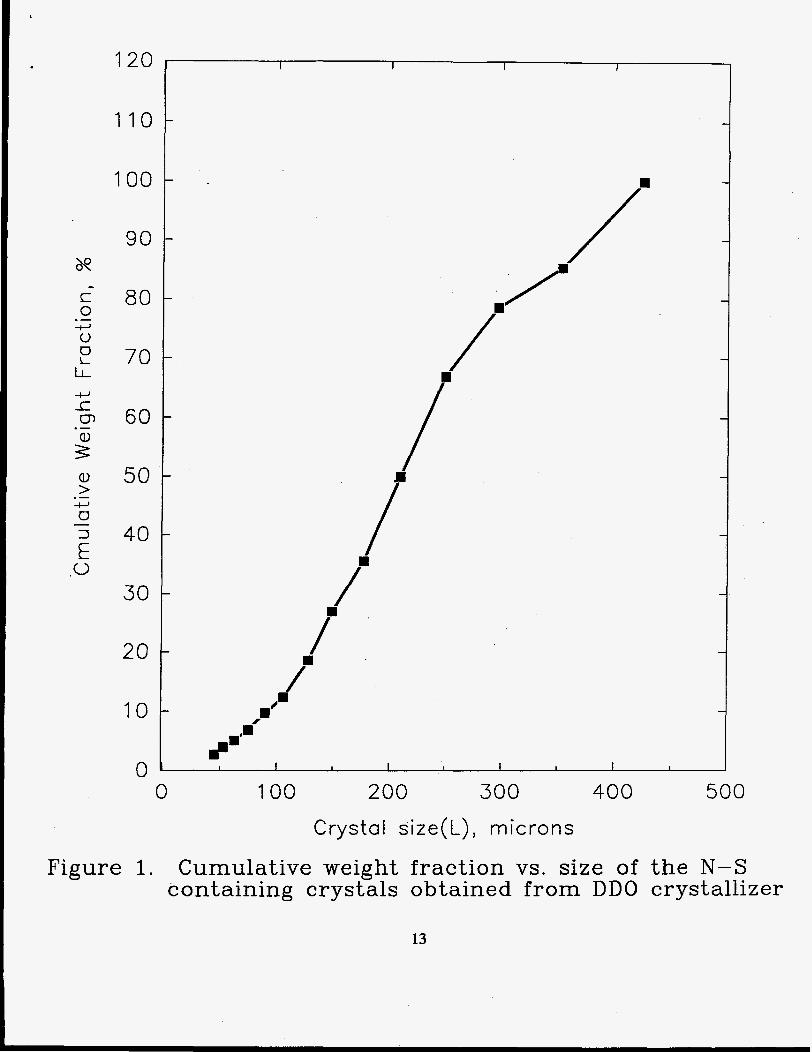
by 10 g/L as the DDO ratio increased from 10 to 20. The cumulative weight of the N-SCC
crystals at various size ranges (as obtained from size analysis) is shown in Figure 1. The mass
mean size of the N-S containing crystals is found to be 250 pm (Figure 1). This is a very
encouraging result which signifies the importance of the DDO crystallizer configuration versus the
use of the MSMPR configuration. However, at the higher DDO ratio of 20, a poor mixing
pattern was observed, most likely due to the increased slurry density.
6
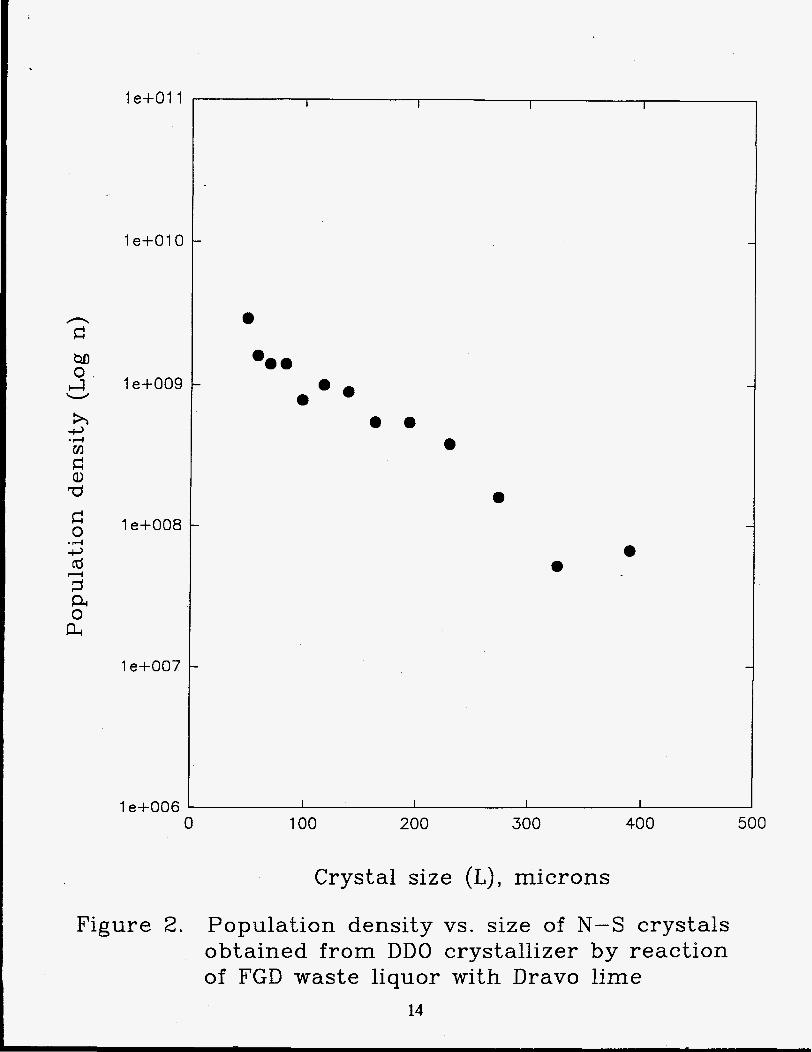
The population density of the N-SCC crystalline precipitates at various size ranges is
given in Figure 2. The photomicrographs of the precipitated N-SCC crystals are shown in Figures
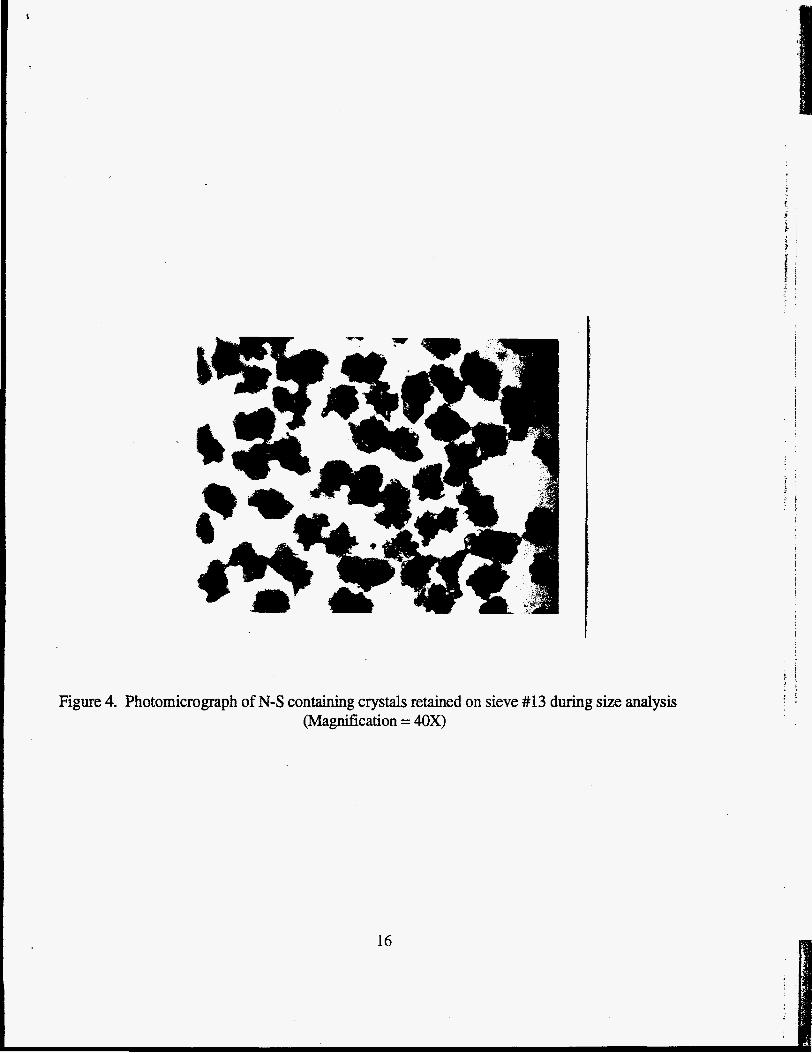
3-5. Figure 3 shows the morphology of N-S containing crystals in the product slurry. A picture
of the crystals on sieve number 13 (size - 250 pm) is shown in Figures 4 and 5 at magnifications
of 4OX and lOOX, respectively. In these pictures, the crystals seem to be in an agglomerated
form.
3. HYDROLYSIS OF NITROGEN-SULFUR CONTAINING COMPOUNDS
The hydrolysis chemistry of N-SCC has been discussed in a previous report (Randolph,
Mukhopadhyay, Unrau, Oct-Dec. 1994). The aim of the present hydrolysis experiments is to
evaluate the kinetics and to generate sufficient liquor for the crystallization of (NH4)2S04.
3.1. Experimental Procedure
The experimental set up for hydrolysis experimentation has been described in a previous
report (Randolph, Mukhopadhyay, Unrau, 0%-Dec. 1994). About 10 grams of uniformly sized
dry N-SCC crystals were added to 500 ml of 1 M H2S04, which had been preheated to the desired
temperature. The hydrolysis experiment was carried out at 70" C and 80" C. Samples were
withdrawn and sent to Copper State Analytical Laboratory in Tucson for analysis of ammonia-
nitrogen. The ammonia-nitrogen concentration was calculated according to EPA method number
4500-NH3F.
3.2. Results and Discussion
The concentration of NH; ion in the solution is calculated from the total ammonia-
7
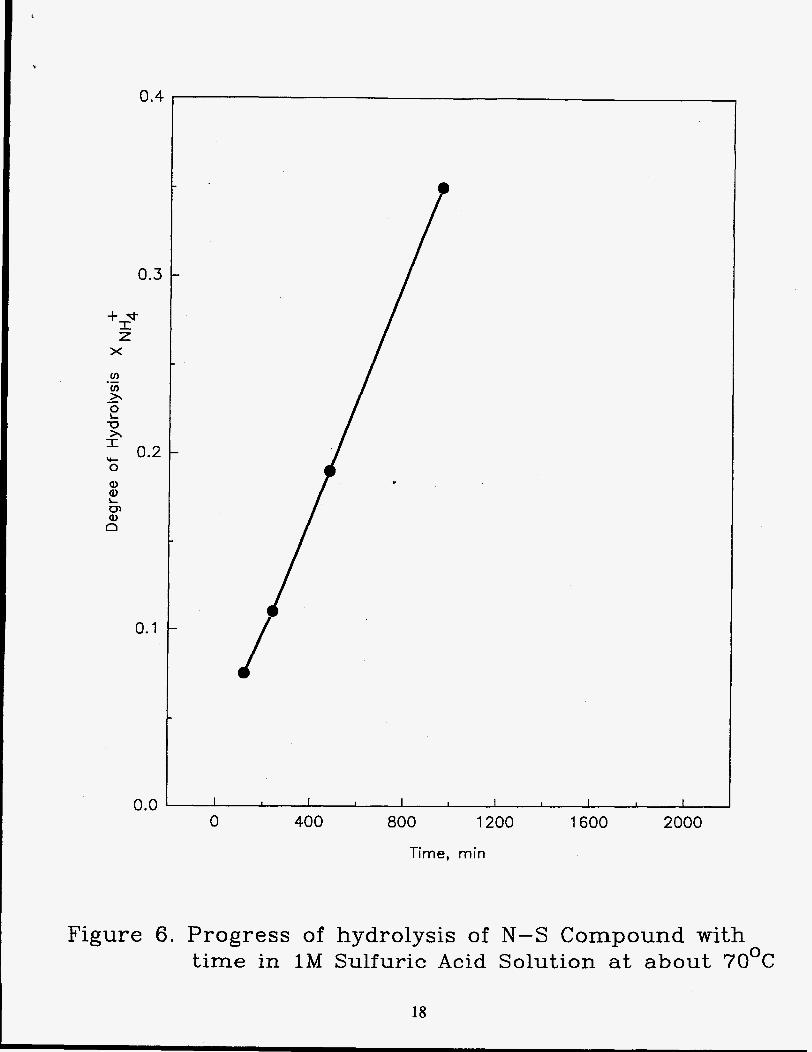
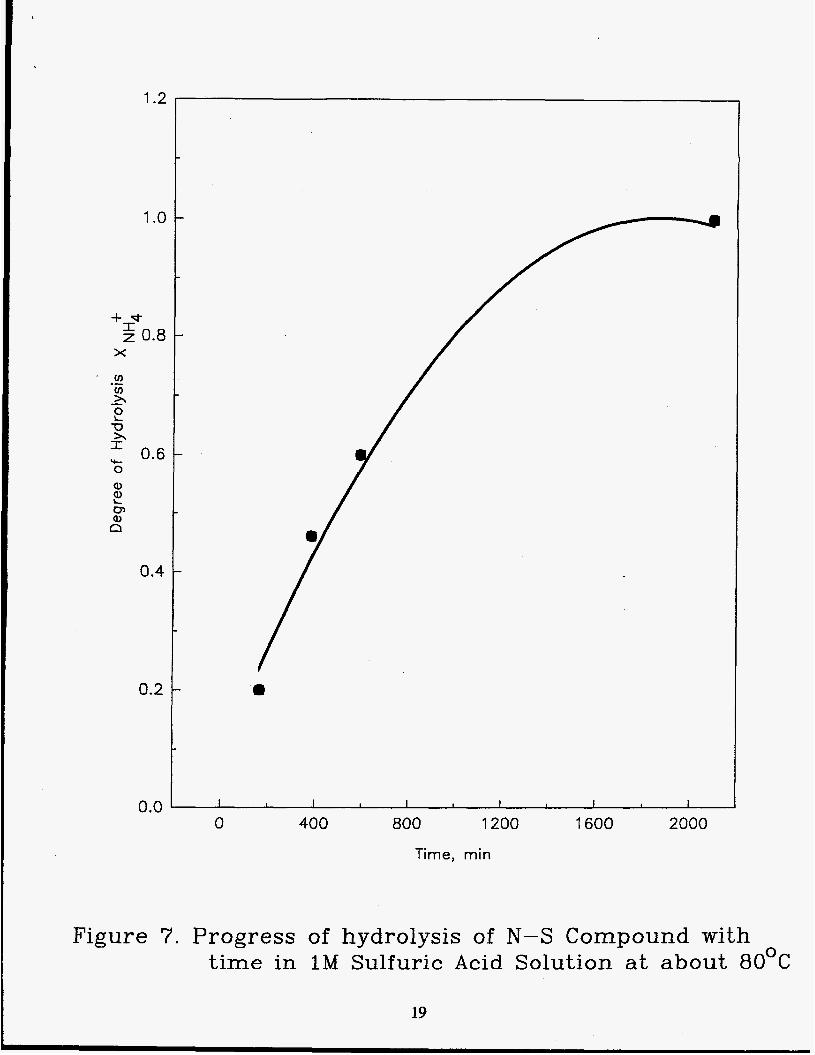
nitrogen concentration. The progress of the hydrolysis reaction versus time has been plotted in
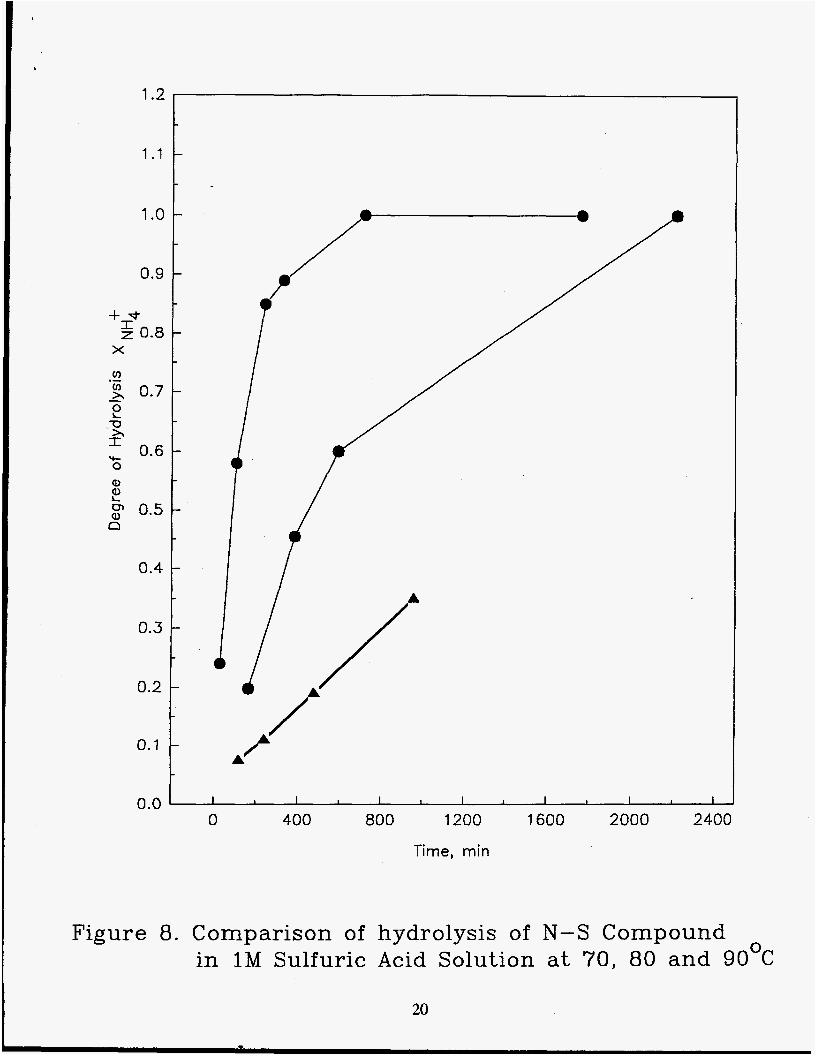
Figures 6 and 7 for each experiment. A comparison of the degree of hydrolysis of N-SCC at 70",
80" and 95°C are given in Figure 8. The hydrolysis data (Figures 6-8) indicate the rate of
hydrolysis is faster at higher temperatures. Hence at 16 hours and 95" C, hydrolysis was
accomplished completely, whereas only 35% hydrolysis could be achieved during the same time at
70 "C.
4. OPTIMIZATION OF DDO PARAMETERS BY COMPUTER SIMULATION
Further computer simulations were run to optimize crystal growth and nucleation rate
DDO parameters. All data in this section were obtained solely through theoretical computer
simulation. In the following discussion an understanding of MSMPR and DDO crystallizer
operation by the reader is assumed. As before (Randolph, Mukhopadhyay, Unrau, Jan. - Mar. 1995), the crystal growth and nucleation rate equations used were:
G = ksa
respectively. Where,
G = growth rate
= growth rate constant
s = supersaturation
a = exponent linking growth rate to supersaturation
Bo = nucleation rate
= nucleation rate constant
8
i = exponent linking nucleation rate to growth rate
MT = suspension density
j = exponent linking nucleation rate to suspension density, (White and Randolph,
1989).
The same computer program was used to simulate these studies (Randolph and Sutradhar,
1992). For these simulation studies, values of i = 2.0 and j = 0.5 from the previous runs were
used. The adjusted parameters include the DDO ratio (R), the residence time in minutes (z), and
the crystal fines cut-off size &). Crystal fines cut-off sizes of 30,45,60, and 100 pm were used
with ranges of 6 to 22 for R, and 30 to 180 minutes for z. Recall the equation used to calculate
the dimensionless cut-off size, X, which was used as an input to the program:
X, = Lf / (Go@.
Where,
L, = crystal fines cut-off size
Go = MSMPR crystal growth rate
z = reactor residence time, (Randolph and Sutradhar, 1992).
Note that X, is affected by both L, and z; this is accounted for in the plotted data. Again, output
was obtained for the mass mean size ratio, crystal growth rates, slurry densities, and DDO per
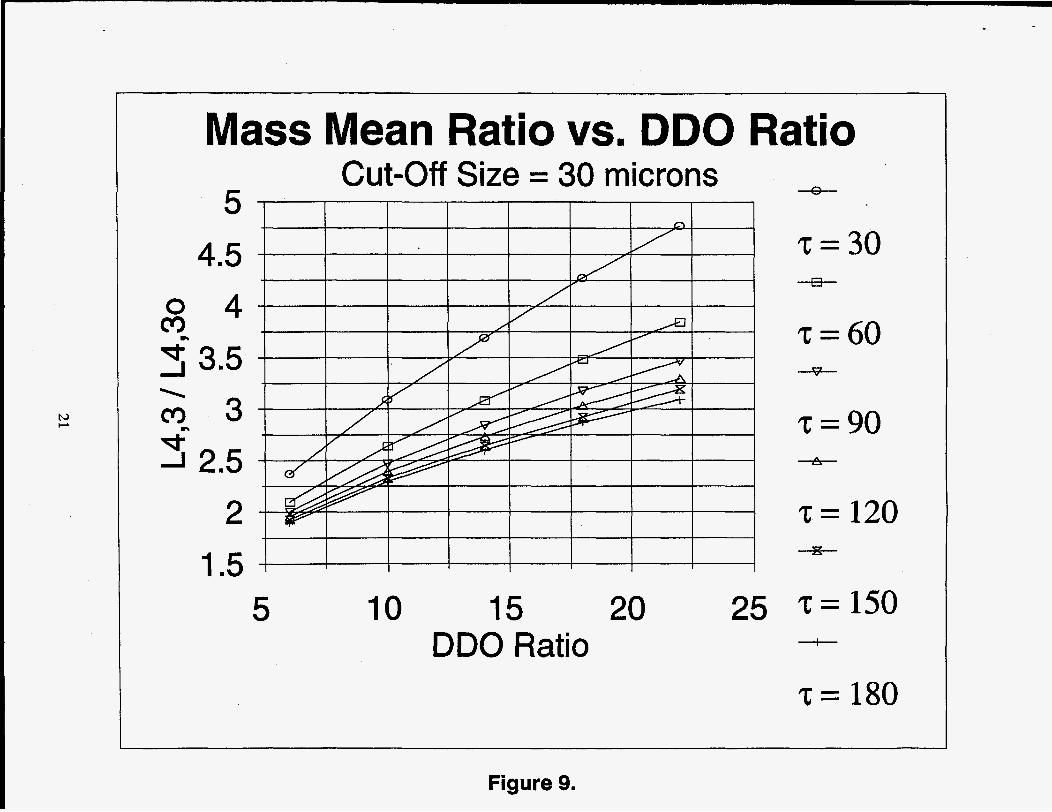
pass yield. Plots were obtained for mass mean size versus DDO ratio for varying residence times
and crystal fines cut-off sizes. In the simulations, the mass mean size ratio, L4,A4,%, is a ratio of
the DDO mass mean size to that of the MSMPR (denoted by the subscript "0") mass mean size.
For the following discussion please refer to Figures 9 through 12.
9
In all four figures, the mass mean size ratio increased as the DDO ratio increased, and as
the residence time decreased. Larger mass mean size ratios resulted when bigger crystal fies cut-
off sizes were used. Hence, the largest mass mean size ratio, 8.04, occurred with a DDO ratio of
22, a residence time of 30 minutes, and a cut-off size of 100 pm. An explanation of these trends
is as follows. The large cut-off size (100 p) means the remaining crystals in the DDO
crystallizer will be of a bigger mass, thus increasing the mass mean ratio. An increase in the DDO
ratio will increase the mass mean size by lengthening the crystal growth time allowed for the
larger crystals, and removing more of the crystal fines.
For the smaller residence times (30 to 60 minutes) there is a large mass mean size ratio,
and for the larger residence times (greater than 60 minutes) the mass mean size ratio decreases.
This is because for small residence times, the DDO configuration results in a large improvement in
crystal mass mean size versus the MSMPR configuration (up to 8 times larger for higher cut-off
sizes). The growth rate is inversely proportional to the residence time, and since the DDO
configuration removes the smaller crystals, the growth continues on the already formed nuclei,
resulting in a larger crystal mass mean size for the DDO crystallizer.
For larger residence times, the DDO configuration still results in a larger crystal mass
mean ratio versus the MSMPR configuration (up to 4 times larger for higher cut-off sizes), but
the large residence time allows more growth to occur in the MSMPR crystallizer, hence the ratio
is lower than for small residence times. A note of clarification, the larger mass mean ratio for
small residence times does not imply larger crystals exist for the smaller residence times, just that
there is a larger difference in crystal mass mean size between the DDO and MSMPR
configurations at smaller residence times.
10
Currently, the DDO set up runs at approximately a 30 to 45 pm crystal fines cut-off size.
With a residence time of one hour, it is seen that a larger DDO ratio will yield a higher mass mean
size versus the MSMPR configuration (see Figures 9-12).
In conclusion, these simulations show increasing the DDO ratio and/or decreasing the
residence time result in increasing the mass mean size ratio (DDO to MSMPR). A larger crystal
fines cut-off size will result in a larger crystal mass mean size ratio. The crystal fines cut-off size
trend (increasing the crystal fines cut-off size increases the crystal mass mean ratio) agrees with
the previously found trend (Randolph, Mukhopadhyay, Unrau, Jan. - Mar. 1995). Furthermore,
some experimental data were used to confirm the computer simulated trends relating an increasing
DDO ratio to an increase in the crystal mass mean size ratio.
The results described in section 4 are strictly from theoretical simulations. All values used
in the simulations were chosen as ranges, not from any experimental data.
11
References
. . Randolph, A. D., Mukhopadhyay, S. and Unrau, E. ' I t
FGD Wast&qum!, DOE Quarterly Technical Report, October-December 1994.
.. Randolph, A. D., Mukhopadhyay, S. and Unrau, E. " P r o d h GD W a s & U @ u d , DOE Quarterly Technical Report, January-Match 1995.
Randolph, A. D. and Sutradhar, B. C. "- the Use of P-O-FOR. FD-FOR &DO.FOR", Dept. of Chem. Eng., University of Arizona, 1992.
. . White, E. T. and Randolph, A. D. 'I- for C l m m DoubleDraw-Off" -, Ind Eng. Chem Res., 28,276-284, 1989.
12
120
110
100
90
80
70
60
50
40
30
20
10
I I I I
0 0 100 200 300 400 500
Crystal size&), microns
Figure 1. Cumulative weight fraction vs. size of the N-S containing crystals obtained from DDO crystallizer
13
1 e+011
1 e+010
n FI M
1 e+009
1 e+008
1 e+007
1 e+006 0
Figure 2.
a
@a a
a
a
a a
100 200 300
Crystal size (L), microns
400
Population density vs. size of N-S crystals obtained from DDO crystallizer by reaction of FGD waste liquor with Dravo lime
14
500
Figure 3. Morphology of N-S containing double salt of Ca and Na obtained from DDO run (Magnification = 4OX)
15
I
16

Figure 5. Photomicrograph of N-S containing crystals retained on sieve #13 during size analysis (Magnification = loOX)
17
0.4
0.3
+I" Z
0.2
0.1
0.0 I I I I I I I I I I I
1200 1600 2000 0 400 800
Time, min
Figure 6. Progress of hydrolysis of N-S Compound wi th time in 1 M Sulfuric Acid Solution a t about 70°C
18
1.2
1 .o
X
Figure 7. Progress of hydrolysis of N-S Compound with time in 1M Sulfuric Acid Solution at about 8OoC
19
0.4
0.2
0.0 0 400 800 1200 1600 2000
Time, min
1.1
1.0
0.9
+I-- z 0.8 X
63 .- E 0.7 2 2
- -0
0.6 Y- O a, a,
a,
L
cn 0.5 n
0.4
0.3
0.2
0.1
/
L
-
-
-
- -
-
-
-
-
-
-
-
\
Figure 8. Comparison of hydrolysis of N-S Compound in 1 M Sulfuric Acid Solution a t 70, 80 and 90°C
20
0.0 I I * I I I I I I I , I
0 400 800 1200 1600 2000 2400
Time, min
5
Mass Mean Ratio vs. DDO Ratio Cut-Off Size = 30 microns
4.5
I
5 I I t I I I I I
10 15 20 25 DDO Ratio
z = 30
z = 60
Z = 90
z = 120
Z = 150 +
Z = 180
Figure 9.
Mass Mean Ratio vs. DDO Ratio Cut-Off Size = 45 microns
5 0 c3
I Ti- 4
5 10 15 20 DDO Ratio
25
z = -E3-
z =
z = *
z = *
+
z =
30
60
90
120
150
180
Figure 10.
Mass Mean Ratio vs. DDO Ratio Cut-Off Size = 60 microns * 7
6
d- I
I I I I I I
5 10 15 20 DDO Ratio
25
~ = 3 0
z =
z =
z = +
z =
60
90
120
150
180
Figure 11

h) P
Mass Mean Ratio vs. DDO Ratio Cut-Off Size = 100 microns
0 7 m m
I
5 I I I I I I I I
10 . I 5 20 DDO Ratio
25
z =
z =
z = *
z =
z -
30
60
90
120
150
180
Figure 12.
I
I
D M Ratio 10
Table 1. Slurry Density of N-S Containing Crystals at Various DDO Ratio
40.58
20 I 15 I 45.09 I
49.02
25
Top Related