


Languages
Pages
Legal


7/27/2019 Preparation of magnetic, macro-reticulated cross-linked chitosan fortetracycline removal from aquatic systems
http://slidepdf.com/reader/full/preparation-of-magnetic-macro-reticulated-cross-linked-chitosan-fortetracycline 1/9
Colloids and Surfaces B: Biointerfaces 117 (2014) 51–59
Contents lists available at ScienceDirect
Colloids and Surfaces B: Biointerfaces
journal homepage: www.elsevier .com/ locate /colsur fb
Preparation of magnetic, macro-reticulated cross-linked chitosan for
tetracycline removal from aquatic systems
N.A. Oladoja a,∗, R.O.A. Adelagun b, A.L. Ahmad c, E.I. Unuabonah d, H.A. Bello a
a Department of Chemistry, Adekunle Ajasin University, Akungba Akoko,Nigeriab Department of Chemistry, The Federal University,Wukari, Nigeriac School of Chemical Engineering, Universiti SainsMalaysia, Penang, Malaysiad Environmental and Chemical Processes Research Laboratory, Department of Chemical Sciences, Redeemer’sUniversity,Nigeria
a r t i c l e i n f o
Article history:
Received 9 August2013
Received in revised form 3 February 2014
Accepted 6 February 2014
Available online 14 February 2014
Keywords:
Chitosan
Tetracycline
Magnetite
Cross-linked chitosan
Pore forming agent
a b s t r a c t
A novel adsorbent, magnetic, macro-reticulated cross-linked chitosan (MRC) was synthesised for the
removal of tetracycline (TC) from water using a source of biogenic waste (gastropod shells) as a pore-
forming agent. The insertion of crosslinks into the chitosan frame was confirmed by FTIR analysis, while
the stability of the MRC was demonstrated via a stability test performed in an acidic solution. The
enhanced porosity of the MRC was confirmed by the evaluation of its porosity, a swelling test and the
determination of its specific surface area. The time–concentration profile of the sorption of TC onto the
MRC demonstrated that equilibrium was attained relatively quickly (120 min), and the data obtained
fitted a pseudo second order (r 2 > 0.99) kinetic equation better than a pseudo first order or reversible
first order kinetic equation. The optimisation of process variables indicated that the sorption of TC onto
the MRC was favoured at a low solution pH and that the presence of organics (simulated by the addi-
tion of humic acid) negatively impacted the magnitude of TC removal. The area of coverage of TC onthe
MRC (2.51 m2/g) was low compared to the specific surface area of the MRC (47.95 m2/g). The value of
the calculated energy of adsorption of TC onto the MRC was 100 kJ/mol, which is far above the range of
1–16 kJ/mol stipulated for physical adsorption.
© 2014 Elsevier B.V. All rights reserved.
1. Introduction
Globally, pharmaceuticals are among the most widely con-
sumed materials, and tetracycline (TC) is one such widely
consumed pharmaceutical. TC comprises a suite of antibiotics that
exhibit broad-spectrum antimicrobial activity against a variety
of disease-producing bacteria. TC, chlortetracycline and oxytet-
racycline are antibiotics that are commonly used in animal
feed as growth promoters and prophylactics for swine and cat-
tle production [1]. Pharmaceutically active compounds undergo
metabolic processes within organisms, and significant portions of
the metabolised compounds are absorbed into the physiological
systems of these organisms. Nevertheless, significant fractions of
the parent compounds are also excreted in their unmetabolised
form and ultimately find their way into wastewater systems.
Considering recent reports from different parts of the world
[2,3] that conventional wastewater treatment plants (WWTP) are
∗ Corresponding author. Tel.: +234 8055438642.
E-mail address: [email protected] (N.A. Oladoja).
inadequately equipped to remove TC from their aquatic matrices,
efforts are now being focused on the occurrence and behaviour
of pharmaceuticals in WWTPs, which are considered as a sink for
these compounds. Consequently, advanced treatment procedures
are currently beingevaluatedas tertiary treatment options thatcan
improve the performance of the WWTPs in this regard. Ozonation
has beenreportedto be effective for theremovalof pharmaceuticals
from municipalWWTPsin Japan [4,5] and Germany [6]. Nanofiltra-
tion (NF) and reverse osmosis (RO) membrane filtration, applied at
the bench, pilot and full treatment plant scales [7–12], have also
been found to be effective options. Amongst the tertiary treatment
options being assessed, adsorption has been found to be an eco-
nomic, effective and attractive technology that can be employed
effectively due to the operational simplicity and the ubiquity of
potentialsorbents. Theadsorption of TC on sorbents based on metal
or metal oxides [1,13], magnesium–aluminium hydrotalcite [14],
hydrous oxides of aluminium and iron [15], iron oxides and iron
oxide-rich soils [16] have been reported.
In environmental engineering, polymers have been used
for different purposes, but the use of natural polymers has
attracted considerable attention from the perspectives of cost,
http://dx.doi.org/10.1016/j.colsurfb.2014.02.006
0927-7765/© 2014 Elsevier B.V. All rights reserved.

7/27/2019 Preparation of magnetic, macro-reticulated cross-linked chitosan fortetracycline removal from aquatic systems
http://slidepdf.com/reader/full/preparation-of-magnetic-macro-reticulated-cross-linked-chitosan-fortetracycline 2/9
52 N.A. Oladoja et al. / Colloids andSurfaces B: Biointerfaces 117 (2014) 51–59
environmental concern, and safety. Chitosan is one of the most
prominently studied natural polymers because of its interest-
ing inherent properties, such as its hydrophilicity, non-toxicity,
biodegradability, and excellent adsorption capacity. Caroni et al.
[17], while assessing the potential use of chitosan particles as
a controlled drug release system, did a kinetic analysis of the
sorption of TC on chitosan and reported that it is a promising
sorbent for TC. In its original form, chitosan is a relatively weak
base (pK a∼6.2) and thus soluble in acidic media (pH<6.0), which
limits its use as a sorbent in acidic media.
The chemical modification of chitosan by inserting crosslinks
has been used to decrease its solubility in acidic media [15,18].
However, while the insertion of crosslinks into the chitosan frame
confers stability in acidic media, this modification significantly
reduces its adsorption capacity because of the reaction of the
crosslinkerwith the aminegroup of chitosan [19,20], whichreduces
the number of binding sites for available sorption. The porosity
of the cross-linked adsorbent is also negatively impacted because
of the new three-dimensional structure, which increases the mass
transfer resistanceduring the sorption process. It is our opinion that
the reduction in the porosity of the adsorbent could be avoided by
incorporating a pore-forming agentduring the synthesis of this chi-
tosan sorbent. Theincrease in porosity that is derived from thehigh
void space of the pores formed, which offers a promising approach
for increasing the specific surface area and the diffusion coefficient
for substance transfer, has been confirmed previously [21]. It is
also noteworthy that a plethora of inexpensive adsorbents with
high porositieshave been developed,but manysuffer the disadvan-
tage of requiring tedious centrifugation and filtration steps in the
separation and reuse processes [22,23]. Thetediousnessof this pro-
cess has been reduced by the incorporation of magnetic particles
into this material during synthesis [13,24,25]. The resulting mag-
netic resins have been found to be easily recoverable by applying
an external magnetic field after the sorption process, operationally
inexpensive andare often highlyscalableand amenableto automa-
tion [26].
This current study explored a novel and economical method for
the preparation of magnetic macro-reticulated cross-linked chi-tosan (MRC) adsorbent for the removal of TC from aquatic systems.
Gastropod shells (GS) are used as the pore-forming agent, mag-
netite as the magnetic-inducing particle and glutaraldehyde (GA)
as thecrosslinker. The TC sorption parameters were derived during
the optimisation of the kinetic, isothermal and process variables of
the procedure.
2. Materials and methods
2.1. Materials
The GS used as a pore-forming agent was derived from the
shells of the African land snail (SS) ( Achatina achatina). Some of
the physicochemical parameters of the SS have been determined
and reported in an earlier treatise, and the SS were prepared
as described previously [27,28]. Samples of chitosan flakes with
average molecular weights of 105–106 g/mol and a deacetylation
percentage of approximately 87.94% that were prepared from the
shells of prawns were purchased from Chito-Chem (M) Sdn. Bhd.,
Malaysia. A TC hydrochloride (Fig. 1) that was purchased from a
registered pharmacy was used as the source of TC.
2.2. Magnetite preparation
The modified Massart method [20,29] was adopted for the
preparation of magnetite, viz: 250mL ofa 0.2M FeCl3 solution was
mixed with 250mL ofa 1.2M FeSO4 solution, and 200 mL o fa 1 . 5 M
Fig.1. (a)Chemicalstructureof TCin thehydrochlorideform.(b) Chemicalstructure
of glutaraldehyde cross-linked chitosan.
NH4OH solution was addedwhile stirring vigorously.The black pre-
cipitate that formed was allowed to crystallise for 30min under
magnetic stirring. The precipitate was filtered off and washed with
deoxygenated water by magnetic decantation until the pH of the
suspension decreased to below 7.5. The precipitate was dried in
an oven and tested with a magnetic bar to confirm its magnetic
property.
2.3. Preparation of macro-reticulated cross-linkedmagnetic
chitosan
A gram of chitosan was dissolved in 50mL of 25% aqueous
acetic acid. 12mL of a 25% glutaraldehyde solution was added toa known amount of magnetite and SS powder in a round bot-
tom flask and the mixture was heated in a water bath for 2 h at
50 ◦C. The contents of the flask were then added to the chitosan
solution and stirred until the solution became homogenous; the
solution was then heated at 70◦C for 6 h. The gel produced from
this process was washed repeatedly with a 0.5 M NaOH solution
followed by distilled water and dried at 70◦C for 8h before being
ground and sieved. The sieved material was then soaked in 0.5M
HCl to dissolve the SS and produce air bladders (CO2). The MRC
that was produced was collected by filtration, washed thoroughly
with deionised water, dried in the oven and stored until its use.
For the characterisation of the MRC, a reference sample was also
prepared following the same process, except for the HCl soaking
step.

7/27/2019 Preparation of magnetic, macro-reticulated cross-linked chitosan fortetracycline removal from aquatic systems
http://slidepdf.com/reader/full/preparation-of-magnetic-macro-reticulated-cross-linked-chitosan-fortetracycline 3/9
N.A. Oladoja et al. / Colloids and Surfaces B: Biointerfaces 117 (2014) 51–59 53
2.4. Characterisation of the MRC
The surficial functional groups were examined using Fourier
transform infra-red spectrophotometery (FTIR), and the point of
zero charge(PZC) was determined using the solid addition method.
The porosity was determined by adopting the method of Chat-
terjee et al. [30], viz: A gram of the MRC was added to a beaker
containing 100mL of distilled water and allowed tosit for 24h. The
weight of the wet sorbent after 24h was determined, and then the
MRC wasdriedto constant weightto determinethe dryweight. The
porosity (, %)ofthe MRCwasdetermined using Eq. (1), accounting
for the water content within the pores of the MRC
ε =
(W w−W D)w
wDmat
+ (W w−W D)
w
× 100% (1)
where W W (g) is the weight of the wet MRC before drying; W D (g)
is the weight of the MRC after drying; w is the density of water,
1.0g/cm3, andMat is the density of the MRC in g/cm3. Thistestwas
performed for both the MRC and the MC.
The swelling rate of the sorbent in distilled water was deter-
mined by monitoring the weight gain of the sorbent in water. Dry
samples were immersed in distilledwater for24 h at room temper-
ature. The degree of swelling (S w) at equilibrium was calculated asfollows [31]:
Sw =W −W 0
W 0(2)
where W and W 0 denote the weight of wet MRC and the dry MRC,
respectively.
The stability of the MRC in an acidic medium was assessed via a
protocol described by Khoo and Ting [32], viz: Three acid solutions
with a pH of 1.99, 3.65 and 6.12, respectively, were prepared using
HCl, and a gram of the MRC was soaked in each of the solutions
for 24h at room temperature. Thereafter, the sorbent was thor-
oughly rinsed with deionised water and dried in a desiccator until
no further change in weight was detected.
Thespecific surface areasof theMRC andthe MCwere comparedvia a modified method of measuring specific surface based on the
theory of the single-layer molecular absorption of methylene blue
(MB) on a solid surface. The monolayer sorption capacity (qmax)
derived from a linear plot of the Langmuir equilibrium isotherm
model was used to determine the specific surface area by multiply-
ing the value of the saturation adsorption capacity (qmax) by 2.45
[33].
2.5. Sorption studies
A stock 2000mg/L TC solution was prepared with laboratory-
grade water, and working solutions of different TC concentrations
(25–200mg/L) were prepared from the stock by serial dilution.
The kinetic parameters of the sorption of TC onto MRC werederived by adding 2.0g of TC into a litre of a TC solution for con-
centrations that ranged between 25 and 200 mg/L. Samples were
withdrawn at intervals between 0 and 4h of sorption. The sor-
bent was separated by using an external magnetic field, and the
supernatant TC concentration was determined in each case.
The equilibrium isotherm analysis of the sorption process was
evaluated by initiating contact between 50mL of a solution of
a known TC concentration (within the range between 25 and
200 mg/L) and 0.1 g of sorbent. The mixture was stirred at 200rpm
in a thermostatic shaker for 2h. After shaking, the samples were
removed and the sorbent was separated by using an external mag-
netic field. The supernatant was then analysed for residual TC.
The influence of some process variables on the sorption process
were evaluated. The effect of pH on the sorption process was
Fig. 2. FTIR analysis of rawchitosan(↓) and MRC (↑).
investigated by varying the pH of the initial phosphate solution
between pH 3 and pH 10. An organic interference was simulated
by the addition of humic acid (HA) at concentrations that ranged
between 10 and 80mg/L.
The method of Caroni [17] was adopted for the quantification of
the residual TC concentration in the supernatant by using a UV–Vis
spectrophotometer at a wavelength of 276nm. A calibration curve
created fromanalysingTC solutions of different concentrations was
used. All of the concentrations considered in this work resulted in
absorbance values that were <2 and followed Lambert–Beer’s law.
The amount of TC sorbed per unit mass of adsorbent (in mg/g) was
calculated using the mass balance equation, viz:
qe =(C I − C f )v
m (3)
where, C I and C f are the initial and final sorbate solution concen-
trations, respectively; v is the sorbate volume and m is the mass of
sorbent used.
3. Results and discussion
3.1. Sorbent characterisation
The FTIR analysis of the chitosan powder (Fig. 2) showed a char-
acteristic band at 3404.47cm−1 that was attributed to the –OH and
–NH2 groups overlaying each other and the stretching vibrations
of C=O groups were observed at 1755.28cm−1 [34]. The bending
vibrations of the C–H bond in –CH2 were located at 2922cm−1
and those of the –CH3 group were located at 2877cm−1 [34]. The
band at 1656.91 cm−1 wasattributed to the stretching vibrations of
amide group carbonyl bonds C=O, and the band at 1558.540cm−1
was ascribed to the stretching vibrations of amine groups [35]. The
bending vibrationsof methylene andmethyl groups were located at
1377.22 and 1421.58cm−1
, respectively. Thespectrum in the range
7/27/2019 Preparation of magnetic, macro-reticulated cross-linked chitosan fortetracycline removal from aquatic systems
http://slidepdf.com/reader/full/preparation-of-magnetic-macro-reticulated-cross-linked-chitosan-fortetracycline 4/9
54 N.A. Oladoja et al. / Colloids andSurfaces B: Biointerfaces 117 (2014) 51–59
of 1153–1030cm−1 was attributed to stretching vibrations of C=O
groups [36].
Vibrations similar to those observed in theraw chitosan particle
were detected in the MRC, but with different intensities and shifts
in peak positions (Fig. 2). There was a substantial reduction in the
number of peaks, but a few new peaks were also detected in the
MRC spectra. The absorption band of the –NH2 and –OH groups
that overlayed each other at 3404.47 were shifted to 3441.12 in
the MRC. The spectrum of the MRC displayed peaks at 2856.67 and1635.69 cm−1, which were ascribed to the C–H stretching of the
secondary alcoholic groups and the C=N stretching of the imine
groups, respectively. This result clearly indicates that the cross-
linking reaction with glutaraldehydeoccurredon the NH2 groups in
the chitosan [37]. The peak at 1712.85 wasascribed to the presence
of free aldehydes group, which did not react with amino groups
in the raw chitosan. It is known that bifunctional glutaraldehyde
molecules do not necessarily have both aldehyde groups reacted
with chitosan, and unreacted aldehyde functions may be available
in the final cross-linked matrix [38].
The porosity increased from 21.34% for the chitosan particle
to 44.26% for the MRC, which demonstrates the increase in the
porosity of the material caused by the addition of the pore-forming
agent (SS) and its incorporation into the MRC when soaked in
dilute HCl. The insertion of crosslinks into the chitosan framework
is expected to cause a substantial reduction in the ability of the
material to swell because of the presence of three-dimensional
networks should now hold the linear polymer chains tightly in
place andrestrictchain motion. Consequently, the swelling rates of
the MRC and the chitosan particles were found to be 1.83 and 0.82,
respectively. Theincrease in theswellingrate of theMRC compared
with the chitosan particle was caused by the increase in porosity,
which promotes fluid transfer and the movement of water into the
MRC.
The effects of the insertion of crosslinks on the stability of the
MRC were tested against that of the raw chitosan particles. A min-
imal loss in the weight of the MRC (<10%) was observed, whereas
a complete dissolution of the chitosan particle was obtained. The
minimal loss in the weight of the MRC was ascribed to the inser-tion of crosslinks in the chitosan framework, which hindered its
dissolution in acidic media. The observed minimal loss in weight
could have arisen from the migration of some of the constituents
of the MRC (magnetite and residual SS) from the solid phase into
the acidic medium.
The surface charge density of the MRC, tested via the determi-
nationof thePZC, revealed that the PZCvalue was7.30.The specific
surface area of the MRC was 47.95 m2/g while that of the chitosan
particle was 23.98m2/g. The larger specific surface area of the MRC
shouldbe attributed tothe inclusionof thepore-forming step in the
MRC preparation process, which endows the MRC with a greater
porosity than the chitosan particle, which was prepared without
the pore-forming step.
3.2. Time–concentration profile of TC sorption on MRC
The time–concentration profile of the sorption of TC by MRC
(Supplementary Fig. 1(SIF. 1)) was studied for 4 h at different ini-
tial solution TC concentrations (25–200 mg/L). The removal of TC
by the MRC occurred gradually until equilibrium was approached
at 120 min in all the initial solution TC concentrations studied. The
relatively short duration until theattainment of equilibrium (2 h) is
an indication that sorption of TC is a kinetic rather than a diffusion-
controlled process [39]. Consequently, the time–concentration
profile data of the sorption process were tested with differ-
ent kinetic models to derive the sorption kinetic parameters,
viz:
The uptake of TC by the MRC is represented by
MRC + TC k1−→k2
MRC ≡ TC (4)
where k1 is the forward reaction rate constant andk2 the backward
reaction rate constant.
To obtain the reversible-first-order kinetic parameters, the
equation for the sorption rate of TC by MRC is represented as
[40,41]:
d[TC]
dt = k1[TC]t + k2[MRCTC]t (5)
The [TC] and [MRCTC] represent the aqueous TC concentration
and solid phase (i.e., the MRC adsorbed) TC concentrations, respec-
tively, at time t . The migration of the TC moieties from the liquid
phase to the MRC surface, which caused a reduction in the aqueous
TC concentration, can be represented by: [MRCTC]t = [TC]0 − [TC]t .
Consequently, the integration of Eq. (5) yields
[TC]t − [TC]e = [TC]0 − [TC]e exp[−(k1 + k2)t ] (6)
where [TC]e is the concentration of aqueous TC at equilibrium.
Given that, under equilibrium conditions, d[TC]/dt = 0 , we may
define an equilibrium constant,K , and rewrite Eq. (5) thus:
K =k1
k2=
TC0 − TCe
TCe(7)
Rearranging Eq. (5) in terms of k2 and substituting it into Eq. (4)
results in the following:
k1t =
TC0 − TCe
TC0
ln
TC0 − TCe
TCt − TCe
(8)
The gradient of a plot of the term on the right hand side of Eq.
(8) versus time affords an estimate of the first order forward rate
constant for the reaction. Thus, an estimate of the reverse reac-
tion constant may be obtained from Eq. (7). The linearity of the
reversible first order kinetic model was relatively high (r 2 range:
0.9519–0.9872) (Table 1). The overall reaction rate, K (min−1),
decreased from 0.508 to 0.172 with an increase in the TC solution
concentration, and the rate of forward reaction,k1,was slower thanthat of the backward reaction, k2 (min−1), at all the concentrations
studied (Table 1). The results show that the uptake of TC by the
MRC is a reversible process.
The system response time ( I resp), defined as the reciprocal of
the summed rate constants, was used to evaluate the impact of
concentration on attaining equilibrium.
(9)
where I resp represents the time required for the system to reach
the new equilibrium with varying concentrations [42]. When the
initial TC concentration increased from 25 to 200mg/L, I resp
increased from 29.50 to 42.55min (Table 1). This indicates that the
extent of sorption increased with an increase in the solution TCconcentration. The tendency of the response time to increase with
an increase in concentration is an indication that theincreasein the
concentration gradient of the TC at higher solution concentrations
promotes themigration of TC towards the binding sites on the MRC
and causes an increase in the sorption potential.
To further elucidate the kinetics of the sorption process, the
inclusion of the instantaneous uptake of sorbate as a precursor to
the first-order reaction, as suggested by Martino et al. [42], was
employed to analyse the kinetic data viz:
MRC + TCK D0−→MRC ≡ TC; MRC + TC
k1−→k2
MRC ≡ TC
In this case, sorption sites, MRC, on the MRC are immediately
occupied as MRC particles are introduced into the system, an effect
7/27/2019 Preparation of magnetic, macro-reticulated cross-linked chitosan fortetracycline removal from aquatic systems
http://slidepdf.com/reader/full/preparation-of-magnetic-macro-reticulated-cross-linked-chitosan-fortetracycline 5/9
N.A. Oladoja et al. / Colloids and Surfaces B: Biointerfaces 117 (2014) 51–59 55
T a b l e
1
R e s u
l t s o
f t h e
k i n e t i c m o
d e
l a n a
l y s i s o
f s o r p t i o n o
f T C o n M R C
.
I n i t i a l c o n c .
( m g
/ L )
R e v e r s i b
l e fi r s t o r d e r
P s e u
d o
fi r s t o r d e r
P s e u
d o s e c o n
d o r d e r
K
( m i n −
1 )
k 1
( m i n −
1 )
k 2
( m i n −
1 )
I r e s p
K D 0
( m L / g )
r 2
q e 1
( m g
/ g )
k 1
( g / ( m g m
i n ) )
r
2
q e 2
( m g
/ g )
k 2
( g / ( m g m
i n ) )
h ( m g
/ ( g m
i n ) )
r 2
2 5
0 . 5
0 6
0 . 0
1 1 4
0 . 0
2 2 5
2 9
. 5 0
1 1
. 4 3 3
0 . 9 5 1 9
3 . 9
0 3
0 . 0
3 4
0
. 9 5 1 9
4 . 4
6 0
0 . 0
7 7
1 . 5
3 2
0 . 9
9 9 6
5 0
0 . 3
7 6
0 . 0
0 5 3
0 . 0
1 4
5 1
. 8 1
6 . 9
1 8
0 . 9 5 7 1
4 . 3
4 8
0 . 0
1 9
0
. 9 5 7 1
7 . 3
0 5
0 . 0
6 0
3 . 2
0 2
0 . 9
9 9 7
1 0 0
0 . 2
3 3
0 . 0
0 3 3
0 . 0
1 4
5 7 . 8
0
4 . 5
0 7
0 . 9 5 4 8
7 . 5
6 3
0 . 0
1 8
0
. 9 5 4 8
1 0
. 5 4 9
0 . 0
3 4
3 . 7
8 4
0 . 9
9 1 7
1 5 0
0 . 2
1 3
0 . 0
0 5
0 . 0
2 3
3 5 . 7
1
2 . 0
5 2
0 . 9 8 2 7
1 3
. 0 8 9
0 . 0
2 9
0
. 9 8 2 7
1 5 . 0
8 3
0 . 0
3 5
7 . 9
6 2
0 . 9
9 1 6
2 0 0
0 . 1
7 2
0 . 0
0 3 5
0 . 0
2 0
4 2
. 5 5
2 . 4
0 1
0 . 9 8 7 2
1 1
. 7 0 0
0 . 0
2 3
0
. 9 8 7 2
1 6
. 3 4 0
0 . 0
4 4
1 1
. 7 4 8
0 . 9
9 7 7 thatis quantified by an instantaneous distribution coefficient,(K D)0
(mL/g). This constant is calculated from the difference between the
aqueous concentration of the sorbate at the start of the experi-
ment, [TC]0 and the concentration at the “effective” start of the
experiment, [TC]
0, which is defined as the first measurement in
the adsorption time course.
K D0 =[TC]0 − [TC]0
[TC]0[m] (10)
where [m] represents the amount of MRC particles in the reac-
tor in g/mL. The value of the instantaneous distribution coefficient,
(K D)0 (mL/g), decreases with an increase in the initial concentration
of TC (Table 1).
The Lagergren pseudo first-order model [43] represented by Eq.
(11) and the pseudo second-order model [44] represented by Eq.
(12) were also employed to analyse the time–concentration data.
log[qe − qt ] = log[qe] −
k1
2.303
t (11)
t
qt =
1
kqe+
1
qet (12)
where the initial sorption rate, h, for the pseudo second-order
kinetic model is represented by
h = k2q2e (13)
The results from fitting the data obtained from the sorption
process into the aforementioned kinetic models are presented in
Table 1. The values of the pseudo first-order equilibrium capac-
ity (qe) and the pseudo first-order sorption rate increased with
an increase in initial solution concentrations of TC (Table 1). The
results of the pseudo second-order parameters (Table 1) also
demonstrated that the amount of TC uptake (qe) and the initial
sorption rate (h) increased with an increase in the initial TC con-
centration. The qe value increased from 4.460 to 16.340 (mg/g) and
the k2 value decreased from 0.077 to 0.044 (g/(mg min)), while h
increased from 1.532 to 11.748 (mg/(g min)). According to Ho and
McKay, [45] if the sorbate uptake is chemically rate controlled, thepseudo second-order constants will be independent of the particle
diameter andflow rate andwill depend on the concentration of the
ions in a solution.
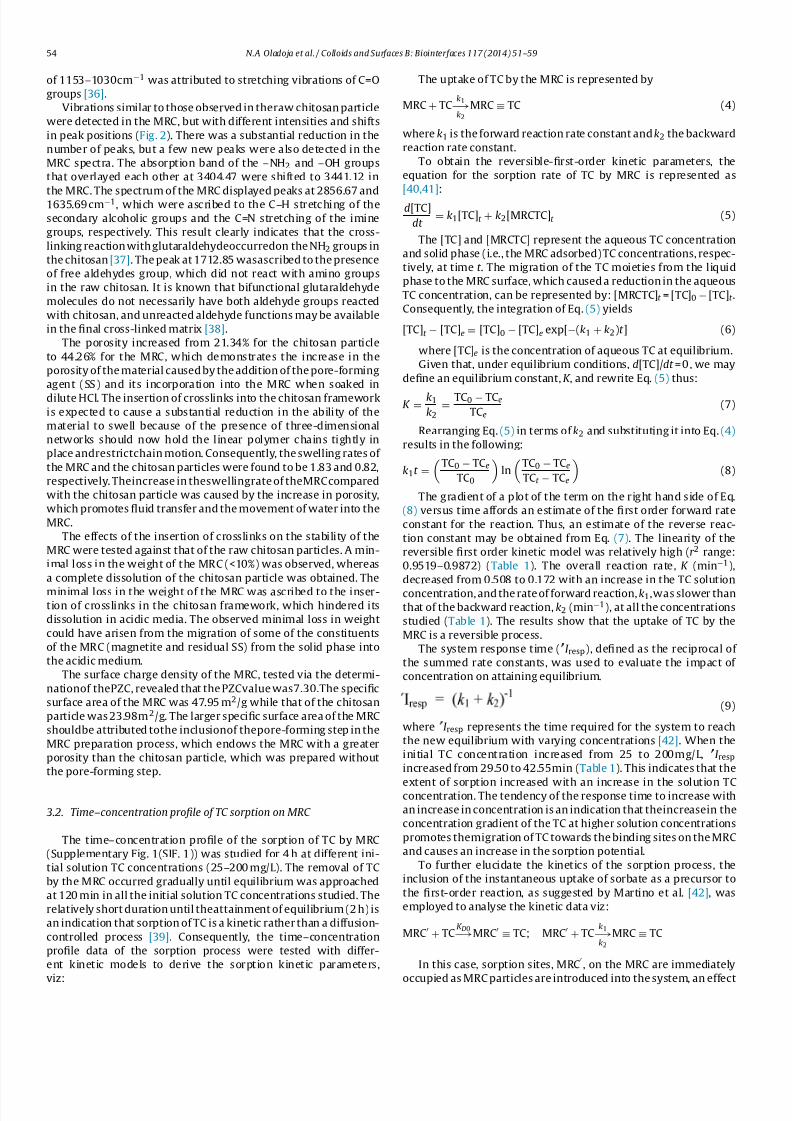
3.3. Effects of pH on TC sorption onto MRC
The results presented in Fig. 3 show that the magnitude of the
TC sorbed by the MRC decreased as the initial solution pH (pHi)
increased from 3 to 10. This revealed that the sorption of TC onto
the MRC was favoured at lower values of pHi. The determination of
the equilibrium pH (pHe), at different pHi levels, revealed a slight
0
1
2
3
4
5
6
7
8
9
10
0
5
10
15
20
25
30
30 1 2 4 5 6 7 8 9 10 11
E q u i l i b r i u m p
H
q e ( m g / g )
Inial pH
qe final pH
Fig. 3. Effect of pH onthe sorptionof TC onto MRC.
7/27/2019 Preparation of magnetic, macro-reticulated cross-linked chitosan fortetracycline removal from aquatic systems
http://slidepdf.com/reader/full/preparation-of-magnetic-macro-reticulated-cross-linked-chitosan-fortetracycline 6/9
56 N.A. Oladoja et al. / Colloids andSurfaces B: Biointerfaces 117 (2014) 51–59
increase in the pHe at pHi 3 and pHi 4, whereas a reduction in the
values of pHe was recorded at higher pHi levels (pH = 6–10) (Fig. 3).
A previous examination of the sorption of TC onto different
sorbents has revealed that the process is pH dependent because
the speciation of TC in an aquatic system and the surface chemistry
of the sorbent, which both strongly influence the chemistry of
sorbate–sorbent interactions, are both pH dependent (SIF 2) [46].
Reports [46] have shown that TC exists predominantly as a cation
(+00) below pH3.3 because the dimethyl ammonium group is
protonated, as a zwitterion (+−0) between pH 3.3 and 7.3 due to
the loss of protons from the phenolic diketone moiety, and as an
anion, (+−−) o r ( 0−−), above pH 7.3 because of the loss of protons
from the tricarbonyl system and phenolic diketone moiety. In
addition to the speciation profi le of TC, Caroni et al. [17] also
opined that the hydrochloride form (Fig. 1) of TC (HTC), the species
of TC used in the present study,also deprotonates in aquatic media.
The high tendency of the amino groups on the chitosan parti-
cle to become protonated at low pH has been reported previously
[37]. Consequently, the proton obtained from the deprotonation
of the HTC is beneficial for the protonation of the amino group on
the chitosan phase of the MRC, as presented in Eq. (15). The higher
sorption capacity exhibited by the MRC for TC at a low solution pH
(pH = 3.0) was ascribed to concurrent adsorption of TC moiety via
interactions based on hydrogen bonding, permanent and induced
dipoles [17], electrostatic interactions and cation exchange. The
occurrence of electrostatic interactions, despite the existence of
TC as a cationic species at pH< 3.33, and the value of the pHPZC
of the MRC obtained (pHPZC = 7.30), which is expected to preclude
anyform of electrostatic interaction, is illustrated in Eqs. (14)–(16),
viz:
R-NH2 +TC-HCl = R-NH3+Cl−+TC+ (14)
R-NH3+Cl−+ TC++R-NH3
+Cl− TC+ (15)
and/or
R-NH3+Cl−+ TC++R-NH3
+Cl hydrogen bonding TC+ (16)
The electrostatic interactions between the Cl− species, whichare partly released by the deprotonation of the HTC, and posi-
tively charged protonated amino groups on MRC can occur (Eq.
(14)), which ultimately create avenues for another possible elec-
trostatic interaction between the negative Cl− end and the cationic
TC species in solution (Eq. (15)).
The possibility of cation exchange (Eq. (17)) between the pro-
tons of the protonated amino groups on the MRC and the cationic
TC species present in solution at the initial solution pH (pH = 3.0)
that resulted in the greatest TC removal from the solution was
tested via the determination of the pHe. This test was premised on
the assumption that, if cation exchange actually occurred, a reduc-
tion in the pHe value is imminent because of the increase in the
hydrogen ion concentration of the solution that would result from
the contribution of the exchangeable protons (H+) from the MRCsurface to the aquatic system, viz:
R-NH2 +TC-HCl = R-NH3++TC+ +Cl− (17)
R-NH3++TC++R-NH2 TC++H+ (18)
An increase in solution pH was observed from a pHi of 3.0 to a
pHe of 3.26, not a reduction in the pH value. This increase in the
pH value could be ascribed to the low solution pH, which promotes
the release of some of the residual Ca2+, which is a constituent of
the SS used as a pore forming agent, from the MRC. The released
Ca2+ ions counteract the effect of the contribution from the H+ ions
contributed from the cation exchange process and, depending on
the amount of Ca+ released, could cause an increase in the pH of
the solution.
Fig. 4. FTIR spectra of MRC (↓) and MRC–TC(↑).
Above a pH of 3.26, a reductionoccurredin themagnitude of the
TC removal bythe MRC (Fig.3), buta significant drop in the amount
of TC sorption occurred above pH 6.0. The decrease in the amount
of TC removal was attributed to the reduction in the number of
removal mechanisms in operation as the value of pHi increases,
a result of the change in the species of TC in the aquatic system
from a cationic to a zwitterionic form. It is also noteworthy that
the decrease in the amount of TC removed, which was of greater
significance at pHi > 6, could also be attributed tothe predominance
of TCin the anionic format a pH> 7.3.Thishigher pHsystem, which
coincides with the pH region above the isoelectric point of chargeof the MRC, promotes the repulsion between the predominantly
negatively charged surface and the predominantly anionic species
present in solution.
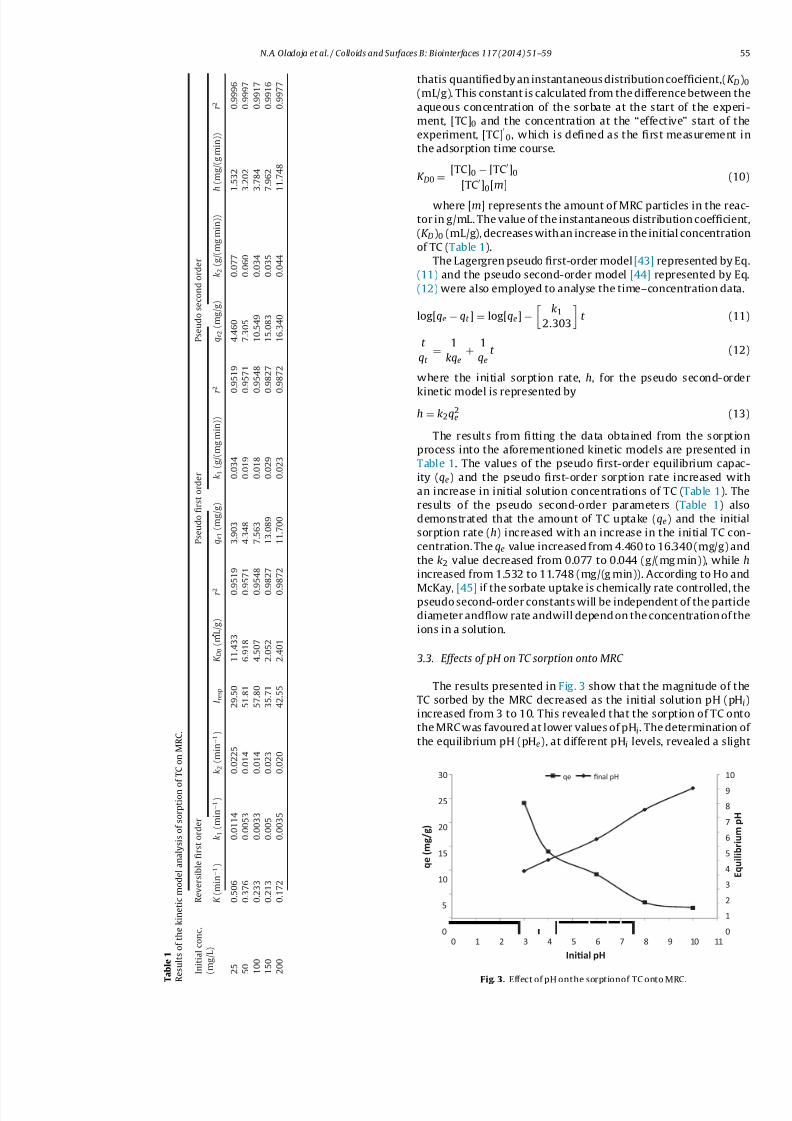
The evidence for an interaction between the MRC and the sor-
bate (i.e., the TC) was acquired using FTIR, and the results obtained
are presented in Fig. 4. Premised on the report that the most char-
acteristic peaks of TC are those in 1200–1800cm−1 [15], peaks
synonymous with TC were sought within this region of the TC
laden MRC (i.e., MRC–TC) FTIR spectra. The identifiable TC peaks
withinthis regionare theamide I peak at 1641.48cm−1 andthe C–C
stretching vibration at 1442.8 cm−1. Some of the peaks observed in
theMRC also appeared in theMRC–TC,but there wasa slightshiftin
the peaks from 1712, 2359, 2939 and 3441cm−1 in the MRC spec-
tra to 1722, 2343, 2937 and 3416cm−1 in the MRC–TC, which is an
indication of an interaction between the MRC surface and the TC
molecule.
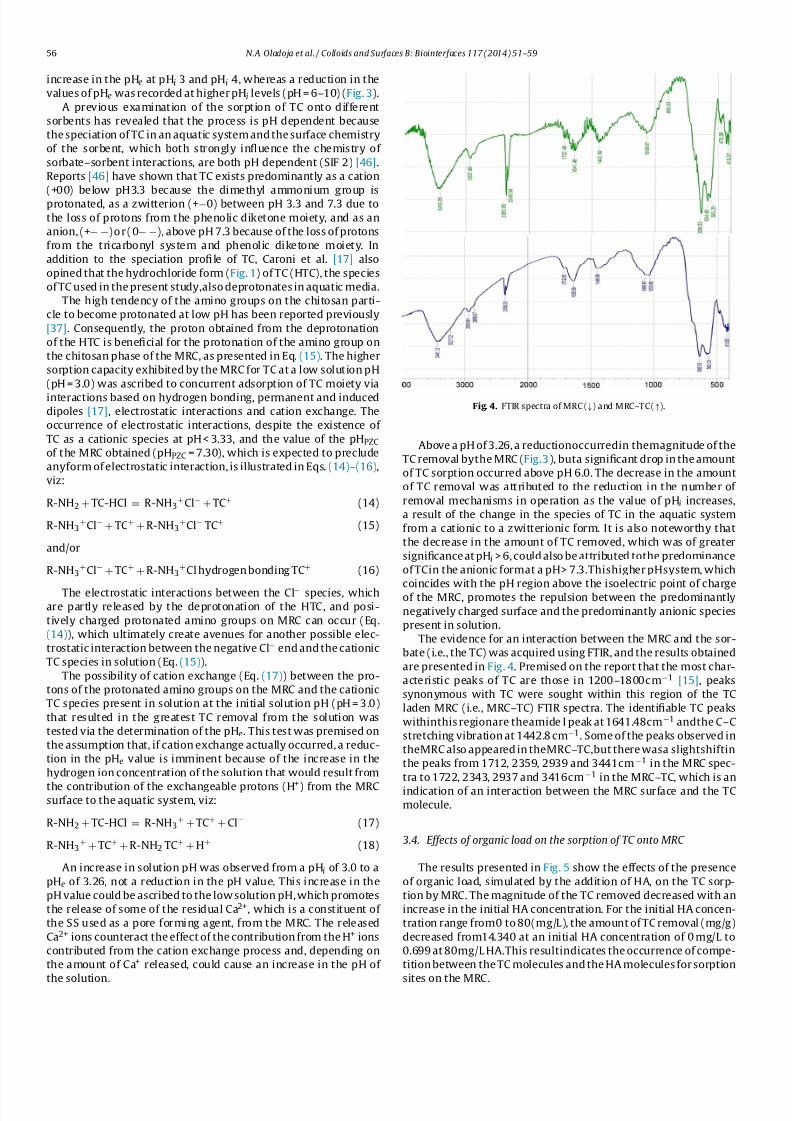
3.4. Effects of organic load on the sorption of TC onto MRC
The results presented in Fig. 5 show the effects of the presence
of organic load, simulated by the addition of HA, on the TC sorp-
tion by MRC. The magnitude of the TC removed decreased with an
increase in the initial HA concentration. For the initial HA concen-
tration range from0 to 80(mg/L), the amount of TC removal (mg/g)
decreased from14.340 at an initial HA concentration of 0 mg/L to
0.699 at 80mg/L HA.This resultindicates the occurrence of compe-
tition between the TC molecules and the HA molecules for sorption
sites on the MRC.

7/27/2019 Preparation of magnetic, macro-reticulated cross-linked chitosan fortetracycline removal from aquatic systems
http://slidepdf.com/reader/full/preparation-of-magnetic-macro-reticulated-cross-linked-chitosan-fortetracycline 7/9
N.A. Oladoja et al. / Colloids and Surfaces B: Biointerfaces 117 (2014) 51–59 57
0
2
4
6
8
10
12
14
16
0 10 20 30 40 50 60 70 80 90
q e
( m g / g )
Humic Acid conc. (mg/L)
Fig. 5. Effect of organic load on the sorption of TContoMRC.
A typical humic substanceis a mixture ofmany moleculeslinked
together, and some of these molecules are based on a motif of aro-matic nuclei with phenolic and carboxylic substituents. Anirudhan
etal. [37] concluded that the carboxylic andphenolic groupson the
HA are deprotonated in weakly acidic to basic media, thereby, con-
ferring a negative charge to the HA molecule. Depending upon the
PZC value of the MRC, the negatively charged HA species can inter-
act electrostatically with the predominantly positively charged
MRC surface at the solution pH studied, which was below PZC of
the MRC. This electrostatic interaction thus caused a reduction in
the magnitude of TC uptake by the MRC.
3.5. Equilibrium isotherm analysis of the sorption of TC onto the
MRC
The results of theLangmuirand Freundlich isotherm analyses of the equilibrium isotherm studies are presented in Table 2. The lin-
ear form of both the Langmuir and Freundlich isotherm equations
are presented in Eqs. (19) and (20), respectively:
C eqe
=1
qmC e +
1
K aqm (19)
where C e is the equilibrium concentration of TC in solution (mg/L),
qe is the amount of TC adsorbed at equilibrium (mg/g), qm is the
theoretical maximum monolayer sorption capacity (mg/g), and K ais the Langmuir constant (L/mg). When C e/qe is plotted against C e,
a straight line with a slope of 1/qm and an intercept of 1/qmK a is
obtained.
log qe = log K f +1
n
log C e (20)
where C e and qe have been previously defined, K f is the Freundlich
constant (mg/g)(L/mg)1/n and1/n is the heterogeneity factor. There-
fore, a plot of log(qe) versus log(C e) enables the determination of
the constant K f and the exponent 1/n.
The conformity of the experimental data to the two isotherm
equations tested, as indicated by the values of the correlation
Table 2
Equilibrium isotherm parameters for theremoval of TC by MRC.
Langmuir isotherm Freundlich isotherm
qm =20.704 n=1.872
K a =0.0133 K f = 1.111
r 2 = 0.963 r 2 =0.9916
0
2
4
6
8
10
12
14
16
18
20
0 20 40 60 80 100 120 140 160 180
q e
( m g / g )
Ce (mg/L)
qeLang qeFreund qeexp
Fig. 6. Equilibrium isotherm modelling of thesorptionof TC onto MRC.
coefficients (r 2) of the linear plots, indicate that the Freundlichisotherm model provides a better description (r 2 =0.9916) of the
sorption of TC onto the MRC, as compared to Langmuir isotherm
model (r 2 =0.963), which is an indication of the heterogeneous
nature of the MRC surface available for TC binding. The hetero-
geneous surface, with varying affinities of the MRC for TC, could
be ascribed to the multicomponent nature of the adsorbent (i.e.,
the presence of SS, chitosan, and magnetite) and the contribu-
tion of each of the constituents to TC sorption. The roles of these
different components of the MRC in TC abstraction from aquatic
systems have beenreported.Differentiron rich materialshave been
reported to remove TC from aquatic systems [15,16] and the mech-
anism has been attributed to a surface complexation mechanism
that is attributed to the interaction between divalent anion species
and the oxide surface. The presence of Ca in soil matrices has alsobeen reported toenhance TC removal viacation bridging andcation
exchange [24].
To further assess the correspondence between different
isothermsand the experimental data, the theoretical plotsobtained
fromeach isotherm analysis were fittedwith the experimental data
for the sorption of TC ontothe MRC (Fig. 6). The graph is plotted as
theamountofTCsorbedperunitmassofsorbent,qe (mg/g)graphed
against the concentrationof TC remainingin solution,C e (mg/L). The
results indicate that the two isotherm models provide fair predic-
tions of the experimental data, but the Langmuir isotherm model
provides a better fit to the experimental data than the Freundlich
isotherm model. This result indicates that the mechanism for the
interactions between the TC and the MRC surface did not strictly
follow one particular isotherm model butcould be describedas the
monolayersorption of TC taking placeupon heterogeneous surfaces
or that MRC surfaces support sites with varying affinities for TC.
3.6. Estimation of area of coverage of TC on MRC
Duarte et al. [47] opined that TC is a very adaptive molecule,
capable of easily modifying itself through tautomerism in response
to various chemical environments. The generally accepted con-
formations are extended and twisted ones. In neutral to acidic
solutions, TC adopts a twisted conformation, while in basic solu-
tions the equilibrium is shifted to the extended conformations
[47–50]. Considering the medium in which our experiment was
carried out, the reported dimensions of entirely protonated TC in
a twisted conformation are 12.9 A long, 6.2 A high and 7.5 A thick,

7/27/2019 Preparation of magnetic, macro-reticulated cross-linked chitosan fortetracycline removal from aquatic systems
http://slidepdf.com/reader/full/preparation-of-magnetic-macro-reticulated-cross-linked-chitosan-fortetracycline 8/9
58 N.A. Oladoja et al. / Colloids andSurfaces B: Biointerfaces 117 (2014) 51–59
and this form of the TC molecule occupies a cross sectional area of
97 A2 [49]. Considering the monolayer coverage of TC on the MRC
particle surface, (estimated from the Langmuir equation), the pro-
jected cross sectional area of the TC molecule ( A), N , is theAvogadro
number (6.02×10²³); m is the molecular weight of the adsorbate
(in this case 480.93 for TC hydrochloride), and the TC coverage per
unit gram of MRC (S , m2/g) can be calculated using Eq. (21):
S =
qmNA
m (21)
Based on the equation shown above, the area occupied by the
TCon theMRC was 2.51m2/g, which is an indication that the max-
imum specific surface area of MRC occupied by TC binding was far
below the MRC specific surface area (47.95m2/g).
3.7. Estimation of energy of sorption of TC on MRC
The energy of sorption of TC onto the MRC was estimated by
using the data obtained from the equilibrium isotherm studies to
solve the Dubinin–Radushkevick (D–R) equation [51,52].
lnqe = lnqm − kDR ε2 (22)
ε = RTln
1 +
1
c e
where ε is the Polanyi potential, qm is the D–R adsorption capac-
ity (mol/kg), andK DR is a constant related to the adsorption energy
(mol2/kJ2). The qm and K DR parameters, evaluated from the inter-
cepts and slopes of the plots of ln qe versus ε2, were 11.62 and
5×10⁻⁵. Themeanfreeenergy ofadsorption(E DR )isthefreeenergy
change when 1 mol of ion is transferred to the surface of the adsor-
bent from infinity in thesolution[51,52] and it wascalculated using
Eq. (23):
E DR = (−2K DR )−1/2 (23)
The E DR (kJ/mol) value of the sorption of TC by the MRC was100 kJ/mol. Akkaya, and Ozer [53] suggested that the magnitude of
E DR could be used for estimating the type of adsorption reaction
and, if the value of E DR is between 1 and 16kJ/mol, then physi-
cal adsorption prevails. If the value is more than 16kJ/mol, then
chemisorption prevails. The value of the EDR obtained from the
present sorption process is far above the range given for a phys-
ical adsorption mechanism and, thus, indicates that chemisorption
was the dominant mechanism for the interactions between the TC
and the MRC surface. The dominant effect of chemisorption as the
mechanism for interaction between TC and MRC is also confirmed
by the conformance of the time–concentration profile data to the
pseudo second-order kinetic model.
4. Conclusions
• MRC can be prepared using gastropod shell as a pore-forming
agent.• The sorption of TC onto MRC is more a kinetic- than a diffusion-
controlled process.• The interactions between TC and the MRC surface occurred via a
monolayer sorption of TC onto heterogeneous surfaces of varied
affinities.• TC removal by the MRC was favoured at lower pH values, and the
presence of organics had a negative impact on TC sorption.• TheareaoccupiedbyTContheMRC wasverylowwhen compared
with the specific surface area of the MRC.• Chemisorption wasthe dominant mechanismof TC sorption onto
the MRC.
Appendix A. Supplementary data
Supplementary data associated with this article can be
found,in theonline version, at http://dx.doi.org/10.1016/j.colsurfb.
2014.02.006.
References
[1] P. Kulshrestha, R.F. Giese Jr., D.S. Aga, Environ. Sci. Technol. 38 (15) (2004)
4097–4105.[2] A. Gulkowska, H.W. Leung, M.K. So, S. Taniyasu, N. Yamashita, L.W.Y. Yeung,
B.J. Richardson, A.P. Lei, J .P. Giesy, P.K.S. Lam, Water Res. 42 (1–2) (2008)395–403.
[3] N. Nakada, T. Tanishima, H. Shinohara, K. Kiri, H. Takada, Water Res. 40 (17)(2006) 3297–3303.
[4] N. Nakada, H. Shinohara, A. Murata, K. Kiri, S. Managaki, N. Sato, H. Takada,Water Res. 41 (19) (2007) 4372–4382.
[5] T. Okuda,Y. Kobayashi, R. Nagao,N. Yamashita, H. Tanaka, S. Tanaka, S. Fujii, C.Konishi, I. Houwa, Water Sci. Technol. 57 (1) (2008) 65–71.
[6] T.A. Ternes, J. Stuber, N. Herrmann, D. Mcdowell, A. Ried, M. Kampmann, B.Teiser, Water Res. 37 (8) (2003) 1976–1982.
[7] S.J. Khan, T. Wintgens, P. Sherman, J. Zaricky, A.I. Schafer, Water Sci. Technol.50 (5) (2004) 15–22.
[8] L.D. Nghiem, A.I. Schafer, M. Elimelech, Environ. Sci. Technol. 39 (19) (2005)7698–7705.
[9] J.E. Drewes, C. Bellona, M. Oekekoven, P. Xu, T.U. Kim, G. Amy, Environ. Prog.24 (4) (2005) 400–409.
[10] J.H. Al-Rifai, C.L. Gabelish, A.I. Schafer, Chemosphere 69 (5) (2007) 803–815.[11] A.J.Watkinson,E.J. Murby, S.D.Costanzo, WaterRes. 41 (18)(2007) 4164–4176.[12] A.M. Comerton, R.C. Andrews, D.M. Bagley, C.Y. Hao, J. Membr. Sci. 313 (1–2)
(2008) 323–335.[13] R.A. Figueroa, A. Leonard, A.A. Mackay, Environ. Sci. Technol. 38 (2) (2004)
476–483.[14] Z. Y. Xu, J . Fan, S. R. Zh en g, F. F. Ma, D.Q. Yin, J. Environ. Qual. 38 (3) (2009)
1302–1310.[15] C. Gu,K.G. Karthikeyan, Environ. Sci. Technol. 39 (8) (2005) 2660–2667.[16] R.A. Figueroa, A.A. Mackay, Environ. Sci. Technol. 39 (17) (2005) 6664–6671.[17] A.L.P.F. Caroni, C.R.M. de Lima, M.R. Pereira, J.L.C. Fonseca, J. Colloid Interface
Sci. 340 (2009) 182–191.[18] M.J. Avena, C.E. Giacomelli, C.D. Garcia, C.P. DePauli, Langmuir 12 (1996)
6659–6664.[19] M.S. Dzul Erosa,T.I. Saucedo Medina, R. Navarro Mendoza, M. Avila Rodriguez,
E. Guibal, Hydrometallurgy 61 (2001) 157–167.[20] A.M. Donia, A.A. Atia, K.Z. Elwakeel, J. Hazard. Mater.151 (2008) 372–379.[21] R.V.Almeida,R.V. Branco, B. Peixoto,C.D. Lima,S.M. Alqueres, O.B.Martins,O.A.
Antunes, D.M. Freire, Biochem. Eng. J. 39 (2008) 531–537.
[22] M.N.V.R. Kumar, R.A.A. Muzzarelli,C. Muzzarelli,H. Sashiwa, A.J. Domb, Chem.Rev. 104 (2004) 6017–6084.
[23] M. Hasan, A.L. Ahmad, B.H. Hameed, Chem. Eng. J. 136 (2008) 164–172.[24] J.R. Pils, D.A. Laird, Environ. Sci. Technol. 41 (2007) 1928.[25] L.S. Porubcan, C.J. Serna, J.L. White,S.L. Hem, J. Pharm. Sci. 67 (1978) 1081.[26] X. An, Z. Su,H. Zeng, J. Chem. Technol. Biotechnol. 78 (2003) 596–600.[27] N.A. Oladoja, Y.D. Aliu, J. Hazard. Mater.164 (2009) 1494–1502.[28] N.A. Oladoja, Y.D. Aliu, A.E. Ofomaja, Environmental Technology 32 (6) (2011)
639–652.[29] Y.K. Sun, M. Ma, Y. Zhang,N. Gu, Colloids Surf., A 245(2004) 15–19.[30] S.Chatterjee,D.S.Lee, M.W.Lee,S.H.Woo,J.Hazard.Mater.166(2009)508 –513.[31] X. Bai, Z. Ye, Y. Li, L. Yang, Y. Qu, X. Yang, Biochem. Eng. J. 49 (2010) 264–270.[32] K.M. Khoo, Y.P. Ting, Biochem. Eng.J. 8 (2001) 51–59.[33] P.T. Hang, Clays Clay Miner. 18 (1970) 203–212.[34] T. Wang, M. Turhan, S. Gunasekaran,Polym. Int. 53 (2004) 911–918.[3 5] J. Grant, C. Allen, Chi tosan as a Biomaterial for Preparation of Depot-
Based Delivery Systems, in: R.H. Marchessault, F. Ravenelle, X.X. Zhu (Eds.),Polysaccharides for drug delivery and pharmaceutical applications, 934, 2006,pp. 201–225, http://dx.doi.org/10.1021/bk-2006-0934.ch010, Am. Chem. Soc.
Symposium Series.[36] M.L.Duarte,M.C.Ferreira, M.R.Marvao,J. Rocha, Int.J. Biol.Macromol.31 (2002)
1–8.[37] T.S. Anirudhan, S. Rijith, Colloids Surf., A 351 (2009) 52–59.[38] R.S. Vieira, M.M. Beppu,Colloids Surf A 279 (2006) 196–207.[39] N.K . Lazaridis, T.D. K arapant sios, D. Geo rg ant as, Wate r Res. 37 (2003)
3023–3033.[40] J.M. Garnier, M.K. Pham, P. Ciffroy, J.M. Martin, Environ. Sci. Technol. 31 (1997)
1597–1606.[41] A. Turner, M. Crussel, G. Millward, A.C. Garcia, A. Fischer, Environ. Sci. Technol.
40 (2006) 1524–1531.[42] M. Mart in o, A . Tur ner , G .E . Millward, En viron . Sci. Techno l. 37 (2003)
2383–2388.[43] S. Lagergren, About the theory of so-called adsorptionof soluble substances, K.
Sven.Vetenskapsakad Handl. Band 24 (1898) 1–39.[44] G.McKay, Chem. Eng. Sci. 39 (1) (1984) 129–138.[45] Y.S. Ho, G. Mckay, Chem. Eng.J. 70 (1998) 115–124.[46] Z.Li, P.H.Chang,J.S.Jean,W.T. Jiang, C.J.Wang,J. ColloidInterface Sci.341 (2010)
311–319.

7/27/2019 Preparation of magnetic, macro-reticulated cross-linked chitosan fortetracycline removal from aquatic systems
http://slidepdf.com/reader/full/preparation-of-magnetic-macro-reticulated-cross-linked-chitosan-fortetracycline 9/9
N.A. Oladoja et al. / Colloids and Surfaces B: Biointerfaces 117 (2014) 51–59 59
[47] H.A. Duarte, S. Carvalho,E.B. Paniago, A.M. Simas, J. Pharm.Sci. 88 (1999) 111.[48] O.G. Othersen,F. Beierlein, H.Lanig, T. Clark,J. Phys. Chem.B 107(2003) 13743.[49] J.M. Wessels, W.E. Ford, W. Szymczak,S. Schneider, J. Phys.Chem.B 102(1998)
9323.[50] F. Gambinossi, B. Mecheri, M. Nocentini, M. Puggelli, G. Caminati, Biophys.
Chem. 110 (2004) 101.
[51] A .M. E l-K amash, A. A. Zaki, M.A. El Ge lee l, J. H azard. Mat er . 127 (2005)211–220.
[52] B.S. Krishna, D.S.R. Murty, B.S. Jai Prakash, J. Colloid Interface Sci. 229 (2000)230–236.
[53] G. Akkaya, A. Ozer, Process Biochem. 40 (2005) 3559–3568.
Top Related