


![[PPT]PowerPoint Presentation - World Banksiteresources.worldbank.org/CSO/Resources/Africa_Trade... · Web viewPotential Impact of the Global Financial Crisis on Sovereign Debt of](https://static.fdocuments.net/doc/165x107/5ab809bb7f8b9ad3038c5946/pptpowerpoint-presentation-world-viewpotential-impact-of-the-global-financial.jpg)
Languages
Pages
Legal


March 2016
1

Table of Contents
• it’s The Season for Tax Investments
• Background
• Why ELSS?
• Why HDFC TaxSaver?
• The Economy & Equity Market outlook
• Product Features
• Asset Allocation Pattern
• Scheme Performance
• Disclaimer
2

It’s the Season For Tax Saving Investments
• Its that time of the year when planning fortax saving investments takes the front seat
• ELSS (Equity Linked Savings Schemes) areone of the most popular Sec 80Cinvestments wherein investors enjoy boththe benefits of equity investing, as well astax benefits.
• The lock in for these schemes is 3 Years,comparatively shorter as compared to otherSec 80C investment products
• The lock-in is also in line with the long termnature of equities as an asset class wherestaying invested for long durations pays off(See slide 7)
Unlike other Sec 80C investment products, investments in Mutual Funds are subject to market risks. HDFC Mutual Fund/AMC is not guaranteeing returns oninvestments made in this scheme. Investors should be aware that the fiscal rules/ tax laws may change and there can be no guarantee that the current taxposition may continue indefinitely.
3

BackgroundSalient Features of Section 80C of the Income – tax Act, 1961
• Section 80C of Income Tax Act, 1961 W.e.f. April 1, 2014 (A.Y. 2015-16) provides for deduction from gross total income in respect of specified sums paid or deposited
• Aggregate amount of deductions under Section 80C shall not exceed Rs. 1,50,000/-
• Section 80C generally has no sectoral limits
• Eligible investments u/s 80C, inter alia, include:
– Life Insurance Premiums
– Unit Linked Insurance Plans (ULIP)
– Public Provident Fund (PPF)
– National Saving Certificate (NSC)
– Subscription to ‘eligible issue of capital’
– Equity Linked Savings Schemes (ELSS)
– Fixed Deposits with Scheduled / Commercial Banks with 5 years lock-in
4
ELSS are formulated as per the Notification dated December 28, 1992 as amended on December 22, 1998 and Notification dated November 3, 2005 asamended on December 13, 2005 issued by the Department of Economic Affairs, Ministry of Finance, Government of India.

The following example illustrates Tax Saving:
Assume Gross Total Income for the year is Rs. 12,00,000
Investment in HDFC TaxSaver Rs. 1,50,000
Income on which tax will be paid Rs. 10,50,000
Tax Saved on Rs. 1,50,000/- (Highest tax bracket assumed) Rs. 46,350*
* Including education Cess @ 2% and secondary and higher education cess @ 1%
This implies that you can avail benefit of Rs. 46,350 in tax savings under Section 80C (assuming highest taxbracket) on investments. This is apart from the returns your investment would possibly earn in the fund
Investors should be aware that the fiscal rules/ tax laws may change and there can be no guarantee that the current tax position may continueindefinitely. HDFC Mutual Fund/AMC is not guaranteeing returns on investments made in this scheme. In view of individual nature of taxconsequences, each investor is advised to consult his/her own professional tax advisor.
5

So Why ELSS?
• Exposure to equities with a long term horizon.
• 3 Year lock in ensures money remains invested without taking into account volatility in equity markets.
• Lock in period lower than other investment options like PPF, NSC or Bank FD`s
• Options to Invest, Options to earn
• Investments can be made in lump sums or in regular investments by way of SIP`s as small as Rs 500/-
• Income can be earned by way of dividend or through capital appreciation based on the investors need
• Incomes are completely tax exempt
• Dividends earned on equity oriented mutual fund units are exempt from taxation
• Long term capital gains earned by way of capital appreciation are exempt from capital gains tax
• Deduction U/s 80C
– Maximum deduction claimable is Rs 1,50,000/- in a financial year
6
HDFC Mutual Fund/AMC is not guaranteeing returns on investments made in this scheme. Unlike PPF, NSC & Bank FD`s investments in Mutual Funds are subjectto market risks. Hence, the performances are not strictly comparable. There is no assurance or guarantee to unit holders as to the rate/quantum of dividenddistribution nor that the dividends will be paid regularly. In view of individual nature of tax consequences, each investor is advised to consult his/her ownprofessional tax advisor.

5,32,927
8,38,304
7,30,179
10,000
35,49,643
0
5,00,000
10,00,000
15,00,000
20,00,000
25,00,000
30,00,000
35,00,000
40,00,000
45,00,000
50,00,000
PPF@ Nifty 500 Index# Nifty 50 Index## HDFC TaxSaver Fund*$$
Short term drops have been compensated with relative outperformance in the long term
Why HDFC TaxSaver?A comparison of Rs 10,000 invested every financial year on the specified date
*Past performance may or may not be sustained in the future. # Benchmark Index of HDFC TaxSaver. ## Additional Benchmark Index for HDFC TaxSaver.$$ Alldividends declared prior to the splitting of the Scheme into Dividend & Growth Options are assumed to be reinvested in the units of the Scheme at the thenprevailing NAV (ex-dividend NAV). @ Year end balances have been arrived at by adding interest at the rates notified by the competent authorities from time to time.NAV as on 29th February 2016. HDFC Mutual Fund/AMC is not guaranteeing returns on investments made in this scheme.Unlike PPF, investments in Mutual Funds are subject to market risks. Hence, the performances are not strictly comparable. 7
Staying invested in equities pays off…

Public Provident Fund v/s HDFC TaxSaverThis is how an amount of Rs 10,000 invested on Mar 31, 1996 would have performed on Feb 29, 2016
* Past performance may or may not be sustained in future.The above simulation is for illustration purpose only. @ Year end balance has been arrived at by adding interest at the rates notified by the Competent authorities
from time to time. # Benchmark Index of HDFC TaxSaver. ## Additional Benchmark Index for HDFC TaxSaver. $$ All dividends declared prior to the splitting of theScheme into Dividend & Growth Options are assumed to be reinvested in the units of the Scheme at the then prevailing NAV (ex-dividend NAV).Unlike PPF, investments in Mutual Funds are subject to market risks. Hence, the performances are not strictly comparable. 8
Year EndedPPF
(Rs) @NSC
(Rs) @HDFC TaxSaver *
(Rs) $$Nifty 500 Index
(Rs) #Nifty 50 Index
(Rs) ##Mar-96 10,000 10,000 10,000 10,000 10,000
Mar-97 11,200 11,240 9,040 9,018 9,827
Mar-98 12,544 12,630 12,400 10,220 11,336
Mar-99 14,049 14,190 23,190 10,830 10,941
Mar-00 15,706 15,940 62,430 18,895 15,513
Mar-01 17,409 17,910 39,650 10,772 11,653
Mar-02 19,052 20,150 50,100 11,076 11,464
Mar-03 20,746 22,004 47,020 10,017 9,928
Mar-04 22,406 24,029 1,01,210 20,817 17,983
Mar-05 24,198 26,239 1,70,420 25,321 20,660
Mar-06 26,134 28,653 3,31,020 41,569 34,533
Mar-07 28,225 31,291 3,37,730 44,925 38,786
Mar-08 30,483 34,170 3,83,483 54,645 48,051
Mar-09 32,921 36,859 2,44,849 32,777 30,660
Mar-10 35,555 39,976 5,18,840 61,606 53,274
Mar-11 38,399 43,239 5,87,527 66,080 59,208
Mar-12 41,539 46,769 5,62,526 60,300 53,746
Mar-13 45,195 50,586 5,68,413 63,393 57,673
Mar-14 49,127 54,714 6,98,236 74,627 68,042
Mar-15 53,401 59,178 10,04,396 99,669 86,177
Feb-16 57,660 63,952 7,80,366 83,269 70,913

Investment Rationale & Fund Suitability
Investment Rationale
• Well diversified equity fund
• Fund ideally positioned to take advantage of impending growth phase in the Indian economy
• Has given investors a superior post tax return as compared to traditional tax saving instruments^
Fund Suitability
• Considering to invest for tax planning and avail benefit of tax deduction u/s 80C of the Income – TaxAct, 1961
• Looking for an alternative to traditional tax saving instruments
• Willing to invest in a diversified equity fund with minimum lock-in period of three years
^Past performance may or may not be sustained in the future. Refer slide 17 for complete scheme performanceHDFC Mutual Fund/AMC is not guaranteeing returns on investments made in this scheme. The current investment strategy is subject to changedepending on the market conditions
9

Current Portfolio Strategy
• In order to provide long term capital appreciation, the scheme will invest mainly in growthcompanies
• The companies selected under this portfolio would generally consist of medium to large sizedcompanies which:
– Are likely to achieve above average growth than the industry
– Enjoy distinct competitive advantages; and
– Have superior financial strengths
• The aim will be to create a portfolio, which represents a cross-section of strong growth companies inthe prevailing market
• In order to reduce the risk, the portfolio will target reasonable diversification
10
HDFC Mutual Fund/AMC is not guaranteeing returns on investments made in this scheme. The current investment strategy is subject to change dependingon the market conditions
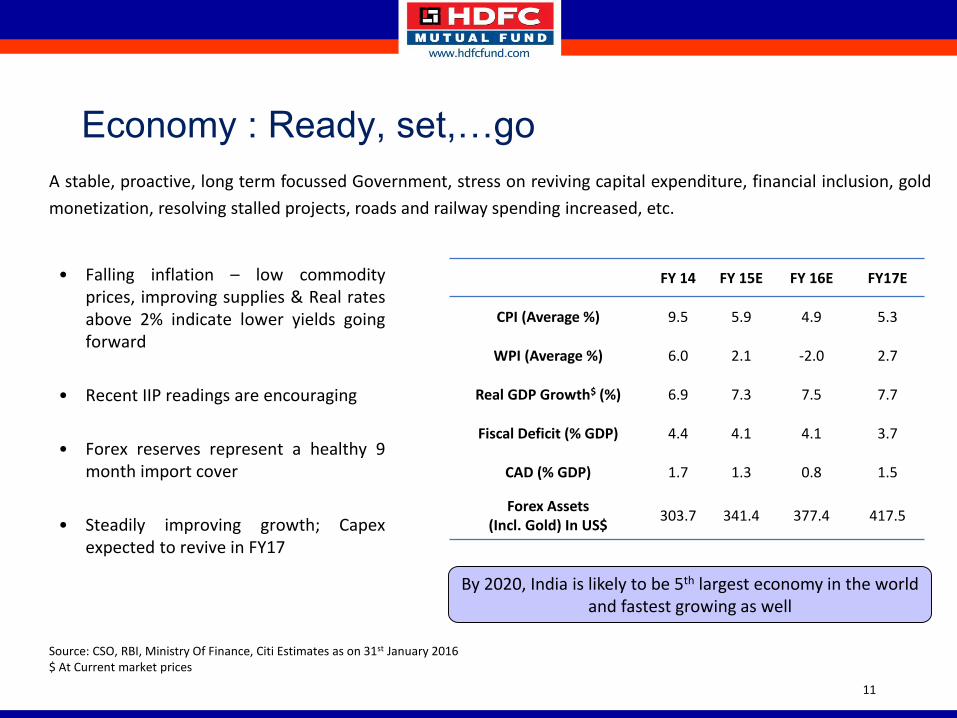
Economy : Ready, set,…go
• Falling inflation – low commodityprices, improving supplies & Real ratesabove 2% indicate lower yields goingforward
• Recent IIP readings are encouraging
• Forex reserves represent a healthy 9month import cover
• Steadily improving growth; Capexexpected to revive in FY17
By 2020, India is likely to be 5th largest economy in the world and fastest growing as well
Source: CSO, RBI, Ministry Of Finance, Citi Estimates as on 31st January 2016$ At Current market prices
A stable, proactive, long term focussed Government, stress on reviving capital expenditure, financial inclusion, gold
monetization, resolving stalled projects, roads and railway spending increased, etc.
FY 14 FY 15E FY 16E FY17E
CPI (Average %) 9.5 5.9 4.9 5.3
WPI (Average %) 6.0 2.1 -2.0 2.7
Real GDP Growth$ (%) 6.9 7.3 7.5 7.7
Fiscal Deficit (% GDP) 4.4 4.1 4.1 3.7
CAD (% GDP) 1.7 1.3 0.8 1.5
Forex Assets (Incl. Gold) In US$
303.7 341.4 377.4 417.5
11

Reasonable P/E’s at cyclically low margins lead to positive outlook for equities
12
Equity Markets – A Positive Outlook
• Low oil prices driving down CAD, steadily falling fiscal deficit and low inflation have set the stage for lower interest rates.
• Steps taken in the key areas of roads, railways, mining, power and housing should start yielding results now and lead to faster economic growth.
• Economy and equity markets appear to be in transition from consumption to capex. Improving margin outlook of corporates, likely lower interest rates, soft commodity prices and reasonable valuations lead to a positive outlook for equity markets over the medium to long term.
• In our opinion therefore, post the sharp correction there is merit in increasing allocation to equities (for those with a medium to long term view) and to stay invested.
Source: CSO, CLSAHDFC Mutual Fund/AMC is not guaranteeing returns on investments made in this scheme. The reference to the S&P BSE Sensex is purely for understandingpurposes and should not be compared to the scheme. The benchmark for the scheme is Nifty 500 Index.
0
5,000
10,000
15,000
20,000
25,000
30,000
35,000
5
10
15
20
25
30
Mar-
96
Mar-
97
Mar-
98
Mar-
99
Mar-
00
Mar-
01
Mar-
02
Mar-
03
Mar-
04
Mar-
05
Mar-
06
Mar-
07
Mar-
08
Mar-
09
Mar-
10
Mar-
11
Mar-
12
Mar-
13
Mar-
14
Mar-
15
Mar-
16
Market Valuations Remain Below Long Term Averages
Roll PE (LHS) average (LHS) BSE (RHS)

Consistent dividends
• The Scheme has paid dividends in each of last 18 years
• Total dividends paid in last 18 years aggregate to Rs. 115.2 per unit
In last 18 years 1999 1999 2000 2001 2002 2003 2004 2004 2005 2006 2007 2008 2009 2010 2011 2012 2013 2014 2015 2016Total/
Average
Dividend per unit (Rs.) (A) 3.6 5.0 21.0 1.6 2.0 2.0 2.0 2.0 5.0 7.5 7.5 8.0 5.0 6.0 6.0 6.0 6.0 6.0 7.0 6.0 115.2
NAV (Record Date) (B) 25.7 35.4 41.6 15.7 17.9 19.9 28.4 26.7 40.6 67.1 60.4 66.1 31.2 61.9 62.7 56.7 53.6 52.7 73.7 53.6
Dividend Yield (%) ( A / B ) 14 14 51 10 11 10 7 7 12 11 12 12 16 10 10 11 11 11 10 11 15
^Past performance may or may not be sustained in the future. All dividends are on face value of Rs. 10 per unit. After payment of the dividend, the per Unit NAV falls to the extent of the payout and statutory levy (if applicable.). There is no assurance or guarantee to unit holders as to the rate/quantum of dividend distribution nor that the dividends will be paid regularly. 13

* As a % of net assets** Average AUM for the month ended February 29th , 2016. For complete portfolio details refer www.hdfcfund.com.
Portfolio Facts(As on February 29, 2016)
Top 10 equity and equity related holdings (%) 47.13
Top 15 equity and equity related holdings (%) 59.25
Top Sector Weighting Banks – 25.98%
Top 5 Sector Holdings (Total %) 58.85%
Portfolio Turnover Ratio (%) 36.55%
Total Equity & Equity Related Holdings(%) 95.75
Cash, Cash Equivalents and Net Current Assets (%) 4.25
Average AUM (Rs. In crore) ** 4,153.82
Portfolio Beta 1.138
Standard Deviation (%) 5.356
14

Product Features
Type of Scheme Open-ended Equity Linked Savings Scheme with a lock-in period of 3 years
Inception Date
(Date of allotment)March 31, 1996
Investment Objective To achieve long term growth of capital
Fund Manager $ Vinay Kulkarni
Investment Plans Direct Plan, Regular Plan
Investment Option Under Each Plan: Growth & Dividend. The Dividend Option offers Dividend Payout and Reinvestment facility
Minimum Application Amount (Under Each Plan/Option)
Purchase & Additional Purchase: Rs. 500 and in multiples of Rs. 500 thereafter
Load Structure
Entry Load: Not Applicable. Upfront commission shall be paid directly by the investor to the ARN Holder(AMFI registered Distributor) based on the investors’ assessment of various factors including the servicerendered by the ARN holder.
Exit Load: NilNo entry / exit load shall be levied on bonus units and units allotted on dividend reinvestment.
Lock-in period 3 Years from the date of allotment of the respective units
Tax BenefitU/s 80C of the Income-tax Act, 1961, an individual / HUF is entitled to a deduction up to Rs. 1.5 Lakh (alongwith other prescribed investments) for amounts invested in HDFC TaxSaver while computing the totalincome
Benchmark Nifty 500 Index
15
$ Dedicated Fund Manager for Overseas Investments: Mr. Rakesh VyasFor further details on load structure, please refer to the Scheme Information Document.

Asset Allocation Pattern
Types of InstrumentsNormal Allocation
(% of Net Assets)Risk Profile
Equities & Equity related instruments
Minimum 80 Medium to High
Debt and money market instruments*
Maximum 20 Low to medium
*Investment in Securitized debt, if undertaken, would not exceed 20% of the net assets of the Scheme.
Under normal circumstances, the asset allocation of the scheme’s portfolio will be as follows:
16
The scheme may seek investment opportunity in the ADR / GDR / Foreign Securities (max. 40% of net assets) subject to SEBI (Mutual Funds)Regulations, 1996. The scheme may use derivatives mainly for the purpose of hedging and portfolio balancing (max 25% of net assets) based on theopportunities available subject to SEBI (Mutual Funds) Regulations, 1996. For further details refer SID.

Past performance may or may not be sustained in the future. Returns greater than 1 year period are compounded annualised (CAGR). The above returns are ofgrowth option. #The Scheme is co - managed by Vinay Kulkarni (Equities) and Anil Bamboli (Debt). Load is not taken into consideration for computation ofperformance. 1. Benchmark 2. Additional Benchmark. On account of difference in the type of the Scheme, asset allocation, investment strategy, inception dates,the performance of these schemes is strictly not comparable. Top 3 and bottom 3 schemes managed by the Fund Manager have been derived on the basis of sinceinception returns.
Scheme Performance Summary
17
31 Dec 2014 to
31 Dec 2015
31 Dec 2013 to 31
Dec 2014
31 Dec 2012 to 31
Dec 2013
Since Inception
CAGR (in %)
HDFC TaxSaver$$ 31-Mar-1996 375.880 -6.24 56.36 5.09 25.90 9,48,188
Nifty 500 Index1 -0.72 37.82 3.61 12.13 96,050
Nifty Index2 -4.06 31.39 6.76 NA NA
HDFC Core & Sattelite Fund 17-Sep-2004 61.821 4.99 51.45 -2.26 17.50 61,821
S&P BSE 200 Index1 -1.48 35.47 4.38 14.60 46,601
S&P BSE SENSEX2 -5.03 29.89 8.98 14.68 46,964
HDFC Large Cap Fund# 18-Feb-1994 94.993 -4.84 27.46 4.54 10.84 94,993
Nifty 50 Index1 -4.06 31.39 6.76 8.89 64,491
S&P BSE SENSEX2 -5.03 29.89 8.98 9.06 66,711
HDFC Premier Multicap Fund# 6-Apr-2005 42.948 -1.21 52.07 -0.11 14.53 42,948
Nifty 500 Index1 -0.72 37.82 3.61 13.01 37,215
Nifty Index2 -4.06 31.39 6.76 13.34 38,401
HDFC CPO - II - 36M February 2014 # 29-Jan-2014 11.556 4.00 - - 8.26 11,556
CRISIL MIP Blended Index1 6.79 - - 12.04 12,302
CRISIL 1 Year T - Bill Index2 8.22 - - 8.50 11,602
HDFC CPO - III - 1100D October 2014 # 28-Oct-2014 11.037 4.51 - - 5.16 10,609
CRISIL MIP Blended Index1 6.79 - - 8.61 11,019
CRISIL 1 Year T - Bill Index2 8.22 - - 8.33 10,986
HDFC CPO - II - 36M January 2014 # 6-Mar-2014 11.757 4.10 - - 8.80 11,757
CRISIL MIP Blended Index1 6.79 - - 12.02 12,436
CRISIL 1 Year T - Bill Index2 8.22 - - 8.43 11,638
Performance of Top 3 schemes managed by Vinay Kulkarni
Performance of Bottom 3 schemes managed by Vinay Kulkarni
Scheme
NAV as
on 31 Dec
2015
Discrete Returns in % Value of investment
of Rs. 10,000 Since
Inception (Rs.)
Vinay Kulkarni manages 6 open ended schemes including HDFC Taxsaver and 11 close ended schemes.
Inception
Dates

Disclaimer
This presentation dated 10th March 2016 has been prepared by HDFC Asset Management Company Limited (HDFC AMC)based on internal data, publicly available information and other sources believed to be reliable. Any calculations made areapproximations, meant as guidelines only, which you must confirm before relying on them. The information contained inthis document is for general purposes only. The document is given in summary form and does not purport to be complete.The document does not have regard to specific investment objectives, financial situation and the particular needs of anyspecific person who may receive this document. The information/ data herein alone are not sufficient and should not beused for the development or implementation of an investment strategy. The statements contained herein are based onour current views and involve known and unknown risks and uncertainties that could cause actual results, performance orevents to differ materially from those expressed or implied in such statements. Past performance may or may not besustained in future. Neither HDFC AMC and HDFC Mutual Fund nor any person connected with them, accepts any liabilityarising from the use of this document. The recipient(s) before acting on any information herein should make his/her/theirown investigation and seek appropriate professional advice and shall alone be fully responsible / liable for any decisiontaken on the basis of information contained herein.
Disclaimer of NSE/ BSE: It is to be distinctly understood that the permission given by NSE/ BSE should not in any way bedeemed or construed that the Scheme Information Document (SID) has been cleared or approved by NSE/ BSE nor does itcertify the correctness or completeness of any of the contents of the SID. The investors are advised to refer to the SID forthe full text of the Disclaimer clause of NSE/ BSE.
MUTUAL FUND INVESTMENTS ARE SUBJECT TO MARKET RISKS, READ ALL SCHEME RELATED DOCUMENTS CAREFULLY.
18

Thank You
19
Top Related