


Languages
Pages
Legal


Planning the Pathology workforce
How to use the model
September 2009

Contents
1 Introduction 1
1.1 Who should use this document? 1
1.2 What do the spreadsheets do? 1
1.3 When should I use the spreadsheets? 1
2 Gather data 2
2.1 What data will I need? 2
2.2 How are the data collected? 4
3 Record data in the spreadsheets 6
3.1 Initial data entry for main_model.xls 6
3.2 Completing task_entry.xls 9
3.3 Complete the data entry for main_model.xls 13
4 Simulate different scenarios 16
4.1 Changing the mix of bands for each task, and the mix of tasks for each band 16
4.2 Changing the volume of work 20
Appendices
Appendix 1 Processes, activities and tasks
Appendix 2 Flowchart for initial data entry
Appendix 3 Quick step by step guides
Version 2.02 1
1 Introduction
This document explains how to gather data and how to use the spreadsheets. Collecting and analysing the right data lies at the heart of good workforce planning. All the analysis you will
do depends upon the quality of these data. So it is worth spending time to get this stage
right.
This document makes reference to the ‘main guide’. By ‘main guide’ we mean the document
entitled, Planning the pathology workforce – A guide for pathology managers, which came with your pack.
1.1 Who should use this document?
It is intended that this document should be used by the person responsible for overseeing the
collation and analysis of the data. It should ideally be the person fulfilling the role of project manager (who is most likely to be the business manager of the pathology service). If you
have not agreed on the structure of your project team, please refer back to Section 2.1 of the
main guide.
1.2 What do the spreadsheets do?
There are two spreadsheets – task_entry.xls and main_model.xls.
Task_entry.xls
This spreadsheet is used to collect data on the structure of your workforce. You will produce
multiple copies of this spreadsheet – one for each band of the staff in each department. In
each copy you will apportion the time of the staff to tasks.
Main_model.xls
This is the master document that performs the analysis. The data from task_entry.xls are recorded in this spreadsheet along with data that describe the volume of work done and
some basic cost information. Outputs are then calculated so that you can see the structure, activity and productivity of your workforce and compare it with an optimum profile (an
idealised profile of the workforce determined by you).
At this point, you will be able to simulate the effects of changes to the service – increases and decreases in volumes of work – and the workforce requirements that result.
1.3 When should I use the spreadsheets?
You should turn to the appropriate section of this booklet when instructed to do so by the
main guide.
Version 2.02 2
2 Gather data
This section describes the types of data you will need and how you should go about collecting
them. Appendix 2 contains a summary of the steps described. Appendix 3 provides quick step by step guides for the project manager and department managers.
2.1 What data will I need?
You need to collect data that describe your workforce, its costs and activities and the volume
of tests done. The types of data are described in more detail below. The sections that follow describe who should provide the data and how they should provide them.
Data about the workforce
Ideally, you should capture data for all the people who work in the departments you plan to
review. You should include all scientific personnel, from trainees to senior practitioners. But you can also include medical personnel and those in managerial and administrative roles – if
they work within a pathology department and not in the central pathology management function.
For each person you need to record
� Name
� Department
� Contracted hours of work per week
� An estimate of mean overtime hours per week
� Band under Agenda for Change (AfC)
Costs
You do not need to collect detailed cost information about your workforce. But you will need an average or indicative cost for each band (£16,000 for band 1, £18,000 for band 2, for
instance). You could use the value at the midpoint of the pay band, or use a real average.
The latter will obviously take longer to calculate. You should ensure that the figure is ‘fully loaded’. In other words, it must include:
� Basic pay
� Employer’s National Insurance contributions
� Employer’s pension contributions
� Supplements (such as overtime, bonuses, benefits, London Weighting and merit awards)
Time allocated to processes, activities and tasks
The pathology service can, like any organisation or business, be described in terms of its
processes. Each process is, in turn, characterised by the activities that define it. And each activity will comprise discreet tasks. So tasks define activities, which define processes, which
define the service. The spreadsheets enable you to profile the work of your staff in these

Version 2.02 3
terms. But you will not be expected to do this from scratch. A process, activity and task (or
PAT) list has been defined for you and validated by colleagues in the service.
The PAT list is presented in full with some additional explanatory notes at Appendix 1. It is advisable to familiarise yourself with this now. When you start collecting data, your
respondents will apportion the time of the staff at each band to these processes, activities
and tasks. The method for doing this is explained below.
Please note that the PAT list is not intended to reflect the competences used in the Job Evaluation Scheme. These competences are generic in nature and used to determine bands
in Agenda for Change (AfC). The PAT list relates specifically to pathology and has evolved
through consultation with people in the service.
Subgroups of the staff
At any given AfC band, you are likely to have people doing different types of work. You will
find it easier to allocate the time of the staff to tasks in the PATs list if people who do similar work are grouped together. For instance, suppose you have 12 people at band 4 in
Biochemistry. Of these, 7 people do the same or very similar jobs. These 7 people will form a subgroup.
Volumes
You need to know the annual volume of work done by each department for which you are
collecting data. You should count
� the number of tests done
� the number of samples received (for Sample Reception)
Different labs have different conventions for counting volumes. The measurement of profiles of tests is a good example. So use whatever measure is most convenient for you. This is not
a benchmarking exercise, so it does not matter if you count volumes differently from another
lab.
If, however, you are using this tool to profile a network of labs, it is essential that you first
agree on a common currency for volumes. Otherwise, comparisons between labs could be misleading.
In order to add some differentiation of the types of tests done, you should subdivide your
volumes into four categories:
� Fully automated (including tracked systems)
� Semi-automated (including some automation, but not tracked systems)
� Routine manual
� Complex manual

Version 2.02 4
2.2 How are the data collected?
Data will be added to the spreadsheets main_model.xls (the master spreadsheet) and
task_entry.xls (one copy for each band of the staff in each department).
Tasks for the project manager
The project manager should be responsible for main_model.xls. He/She will also be required to record some of the data in the ‘Respondent’ worksheet in task_entry.xls. Gather the following information (as described in Section 2.1):
� Data about the workforce
� Indicative costs for each band in each department
� Volume of tests done and, for Central Sample Reception, samples received
Collect these data now and then refer to Section 3 for instructions on where to put the values in the spreadsheets.
Tasks for the department managers
The collection of activity data (time allocated to processes, activities and tasks, as described
in Section 2.1) should be delegated to the department managers. They will be responsible for task_entry.xls. The pack contains a separate document called Guidance for department managers that summarises the relevant parts of this document.
Department managers can respond on behalf of the staff in their department. Alternatively, they can discuss the apportionment of time to tasks with representatives of the staff. We
suggest that you follow these steps:
� Before any data collection starts, department managers should ensure that they are familiar with the PATs list. The list is reproduced in Guidance for department managers and at Appendix 1 in this document
� Divide the personnel at each AfC band into subgroups (groups of people who work in similar ways), as described in Section 2.1. Some people may rotate jobs at varying
intervals throughout the year. You might, for instance, have three teams who rotate
with each other every 4 months. You could regard this as a single subgroup (rather than 3 subgroups) as over a year they all do similar work
� Using one printed copy of the PATs list for each subgroup, clearly highlight the
processes, activities and tasks that they do
� Choose the one task that the subgroup spends most of its time doing (a ‘foundation
task’). Record the percentage of complete working time (contracted plus additional
time) that is spent on the foundation task. You will find it easier if you consider the apportionment of time over a full year, especially if you have people rotating jobs
within any of your subgroups
� Then go through all the other tasks that you have highlighted. Using percentages, apportion the time of the subgroup to each task in turn. Do this by comparing each
task with the foundation task

Version 2.02 5
� Add up the total percentage time for each task. If the total is more (or less) than
100%, then review each task and adjust accordingly. You could possibly round all the tasks down (or up) proportionally
� Once you have done this, refer to Section 3 for details of how to add these data to
the spreadsheet
The following flowchart illustrates the process:

Version 2.02 6
3 Record data in the spreadsheets
This section describes how to populate the spreadsheets with data. The steps described are
summarised in the flowchart at Appendix 2 and the quick step by step guide at Appendix 3. Before you begin, you should make backup copies of the two original Excel files.
A useful tip: You might want to create a number of different scenarios. You can do this by
creating multiple copies of Main_model.xls.
3.1 Initial data entry for main_model.xls
When opening main_model.xls, make sure to enable macros when prompted. The following tasks should be done by the project manager.
Current depts & volumes – input
The model gives you the flexibility to define departments in the way that is most meaningful
for you. By default, the yellow cells in column A will contain the six main departments, plus twelve spare rows (‘Other (1)’ to ‘Other (12)’). But you can redefine these to reflect the way
you work. Simply type new names in the yellow cells. There is also a row for Central Sample Reception (CSR).
You need to record the number of tests done. Tests should be categorised by the level of
complexity (fully automated, semi-automated, routine manual, complex manual). This helps to relate the activity of the staff to the work done. Use columns D to G to record volumes of
tests.
Please note: Your volumes for CSR should reflect the number of samples you receive, NOT
the total number of tests done. Only record a number here if you have a single, centralised reception for all departments. Record the number of samples in cell B11.
Name the departments you plan to review
Record the volumes for each department

Version 2.02 7
A useful tip: You might want to do separate analyses of the workforce during core hours and the workforce during out-of-hours. You could do this by creating two departments in
Main_model.xls. For instance, you could define ‘Biochemistry – day’ and ‘Biochemistry –
night’ as separate departments.
Staff details – input
First, complete the contact details at the top of the page.
Next, fill in the name, department and AfC band for each person working in the laboratory
(columns A, C and D). You might find it helpful to group people together by department, and
within departments by band – this will make it easier when you come to paste data into task_entry.xls. You should perform a check to ensure that everyone has been accounted for.
Finally, for each employee, add details of the standard weekly working hours and an estimate
for average weekly out-of-hours and overtime (columns E and F). Whole time equivalents (WTEs) are calculated automatically. The completed worksheet will look something like this:
Current workforce – input
The PAT list contains a number of user-definable tasks (column C in ‘Current workforce –
input’). Tasks 041001 to 041010 are ‘direct’ tasks. Direct tasks describe effort that is applied directly to creating results so that the service meets its patients’ and customers’
requirements. Direct work adds value. You can add direct tasks of your own in cells C65 to C74. You might, for instance, want to add a task that is not done now, but will be in the
future.
Tasks 090101 to 090105 are ‘support’ tasks. Support tasks describe effort that supports the direct work, enabling the service to continue its day-to-day operations and improve its
performance. You can add support tasks of your own in cells C91 to C95.
Version 2.02 8
You must now consider how each task in the PAT list (including any user-defined tasks) is
affected by the volume of tests that is done. Direct tasks are highly sensitive to changes in the volume of work. In other words, changes in the volume of tests translate by direct
proportion to changes in the activity of the workforce. Support tasks, on the other hand, are
highly insensitive to changes in volume – the volumes have to change by a very large amount to justify a change in support activity.
In column D you can indicate how each task should behave in response to changes in
volume. Default values have been set. And the model will work perfectly well if you omit this step. You can restore the default values at any time by clicking the button ‘Click to reset
default values for the sensitivity of tasks to changes in volume’.
But you can amend values by recording any whole number between 0 and 100 (to indicate a percentage) in column D. In the example below, tasks with 0 are deemed to be insensitive to
changes in volume (the effort required will not change if volumes change). Tasks with 100
are deemed to be highly sensitive to changes in volume (the effort required will change in direct proportion to any change in volume).
As a rough guide:
� Support tasks that are completely independent of the number of tests that are done should be given a sensitivity of 0
� No support task should be given a sensitivity greater than 10
� Tasks whose effort must increase and decrease in line with the number of tests done
should be given a sensitivity of at least 75.
You can add tasks of
your own by typing in the yellow cells in column C
You can indicate how sensitive each task is
to changes in the volume of tests

Version 2.02 9
3.2 Completing task_entry.xls
Copies of task_entry.xls must be completed for each department. Each copy will contain
data for people at a single AfC band. There are 9 bands, with band 8 being split into four sub-bands (A to D), so up to 12 copies of task_entry.xls will be required by each department.
The spreadsheet contains several worksheets that require data entry. One worksheet is used
to add user-defined tasks to the PAT list (‘Output’). One lists the staff in the department (‘Respondent’). The remaining worksheets (initially hidden) are for recording the activities of
the staff by subgroup (‘Sub1’ through to ‘Sub12’). A separate worksheet should be completed for every subgroup of the staff within each AfC band. Remember, a subgroup is
simply a group of people within an AfC band who do similar work.
Add user-defined tasks
Open a fresh copy of task_entry.xls. Make sure to enable macros when prompted. On the ‘Output’ worksheet, the project manager should start by adding any user-defined tasks. You
can copy these from the ‘Current workforce – input’ worksheet in main_model.xls.
Put in details of the staff
On the ‘Respondent’ worksheet, record the name of the department manager in cell B3. Now populate columns D and E with the names and whole time equivalence of the staff at band 1
(this assumes that you have any staff at band 1). Remember, the ‘Respondent’ worksheet must only contain details of people at a single AfC band. These can be
copied and pasted from the ‘Staff details – input’ worksheet in main_model.xls. Here is an example:
Make sure that you add
any user-defined tasks from main_model.xls
Version 2.02 10
It is advisable to use the ‘Paste special…’ function on the ‘Edit’ menu when pasting data into
the ‘Respondent’ worksheet. Make sure you select ‘Values’ in the window that opens, as
shown below:
Once these data have been added, save the workbook. We suggest you give it a name that indicates the department and band, such as biochem_task_entry_band1.xls. Now repeat the process, creating task_entry.xls spreadsheets for each band in which the department has
people. Once the project manager has done this, he/she should send the files to the department manager.
Version 2.02 11
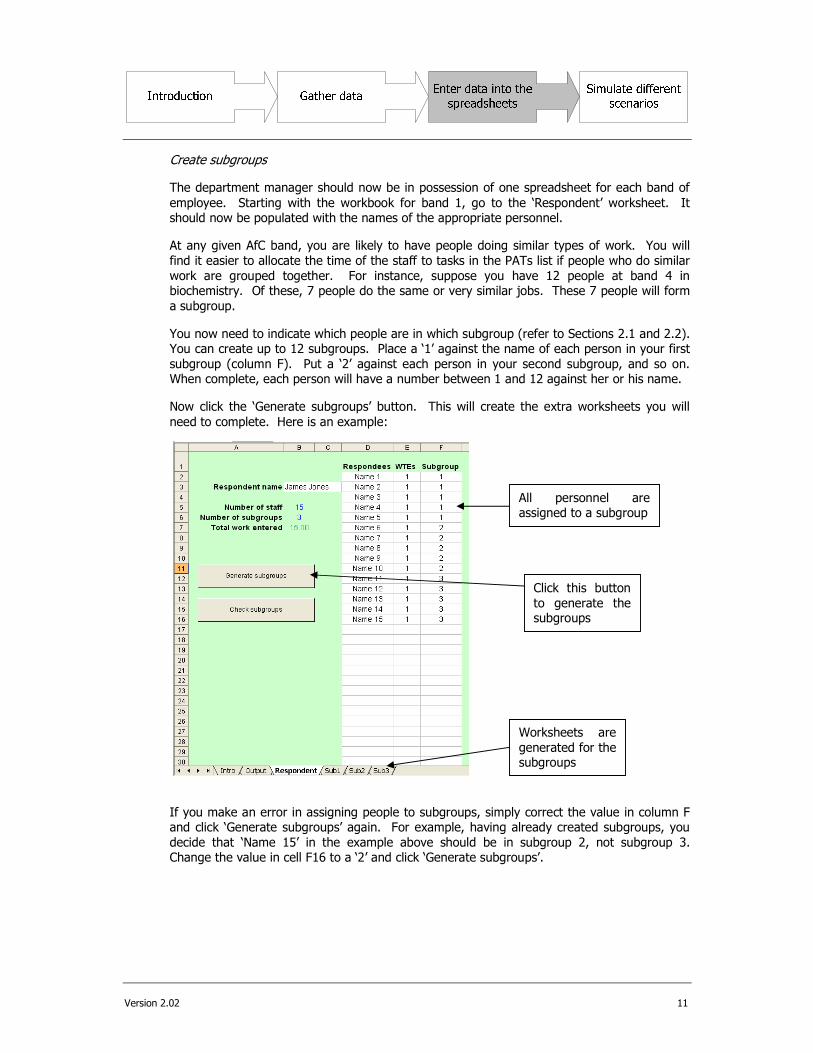
Create subgroups
The department manager should now be in possession of one spreadsheet for each band of
employee. Starting with the workbook for band 1, go to the ‘Respondent’ worksheet. It should now be populated with the names of the appropriate personnel.
At any given AfC band, you are likely to have people doing similar types of work. You will
find it easier to allocate the time of the staff to tasks in the PATs list if people who do similar
work are grouped together. For instance, suppose you have 12 people at band 4 in biochemistry. Of these, 7 people do the same or very similar jobs. These 7 people will form
a subgroup.
You now need to indicate which people are in which subgroup (refer to Sections 2.1 and 2.2). You can create up to 12 subgroups. Place a ‘1’ against the name of each person in your first
subgroup (column F). Put a ‘2’ against each person in your second subgroup, and so on. When complete, each person will have a number between 1 and 12 against her or his name.
Now click the ‘Generate subgroups’ button. This will create the extra worksheets you will
need to complete. Here is an example:
If you make an error in assigning people to subgroups, simply correct the value in column F and click ‘Generate subgroups’ again. For example, having already created subgroups, you
decide that ‘Name 15’ in the example above should be in subgroup 2, not subgroup 3. Change the value in cell F16 to a ‘2’ and click ‘Generate subgroups’.
All personnel are assigned to a subgroup
Worksheets are
generated for the subgroups
Click this button
to generate the subgroups
Version 2.02 12
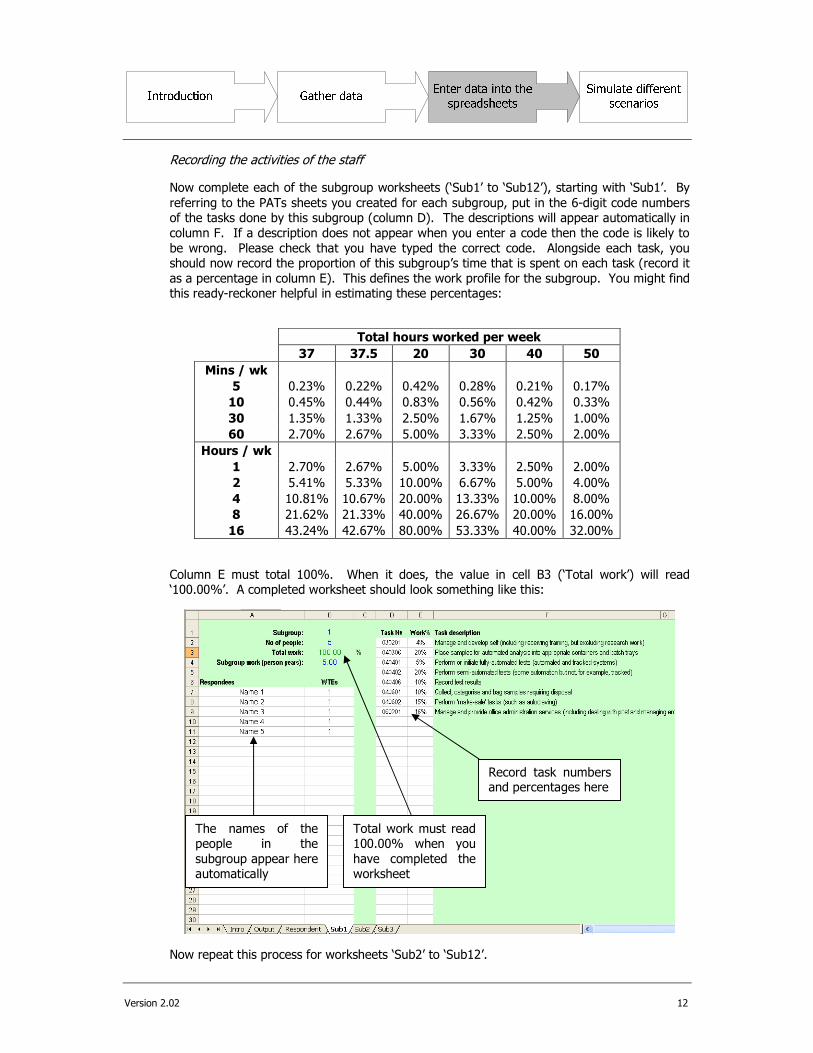
Recording the activities of the staff
Now complete each of the subgroup worksheets (‘Sub1’ to ‘Sub12’), starting with ‘Sub1’. By
referring to the PATs sheets you created for each subgroup, put in the 6-digit code numbers of the tasks done by this subgroup (column D). The descriptions will appear automatically in
column F. If a description does not appear when you enter a code then the code is likely to
be wrong. Please check that you have typed the correct code. Alongside each task, you should now record the proportion of this subgroup’s time that is spent on each task (record it
as a percentage in column E). This defines the work profile for the subgroup. You might find this ready-reckoner helpful in estimating these percentages:
Total hours worked per week
37 37.5 20 30 40 50
Mins / wk
5 0.23% 0.22% 0.42% 0.28% 0.21% 0.17%
10 0.45% 0.44% 0.83% 0.56% 0.42% 0.33%
30 1.35% 1.33% 2.50% 1.67% 1.25% 1.00%
60 2.70% 2.67% 5.00% 3.33% 2.50% 2.00%
Hours / wk
1 2.70% 2.67% 5.00% 3.33% 2.50% 2.00%
2 5.41% 5.33% 10.00% 6.67% 5.00% 4.00%
4 10.81% 10.67% 20.00% 13.33% 10.00% 8.00%
8 21.62% 21.33% 40.00% 26.67% 20.00% 16.00%
16 43.24% 42.67% 80.00% 53.33% 40.00% 32.00%
Column E must total 100%. When it does, the value in cell B3 (‘Total work’) will read ‘100.00%’. A completed worksheet should look something like this:
Now repeat this process for worksheets ‘Sub2’ to ‘Sub12’.
The names of the people in the
subgroup appear here automatically
Record task numbers and percentages here
Total work must read 100.00% when you
have completed the worksheet
Version 2.02 13
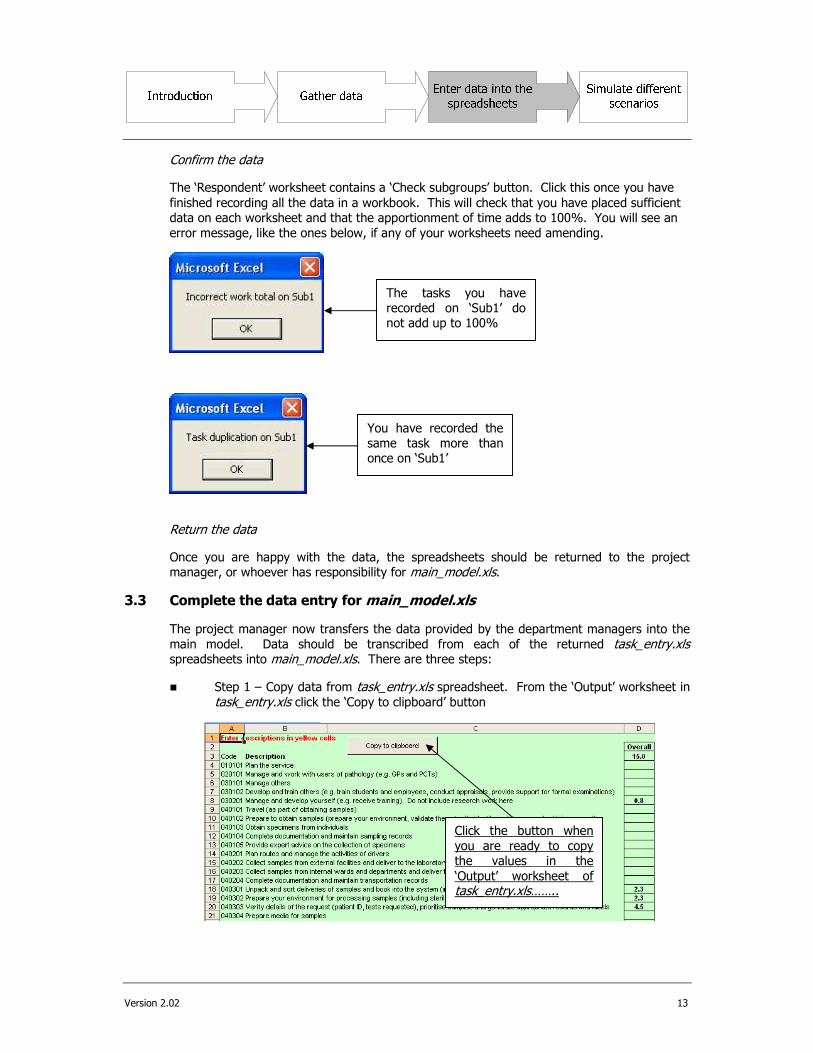
Confirm the data
The ‘Respondent’ worksheet contains a ‘Check subgroups’ button. Click this once you have
finished recording all the data in a workbook. This will check that you have placed sufficient data on each worksheet and that the apportionment of time adds to 100%. You will see an
error message, like the ones below, if any of your worksheets need amending.
Return the data
Once you are happy with the data, the spreadsheets should be returned to the project manager, or whoever has responsibility for main_model.xls.
3.3 Complete the data entry for main_model.xls
The project manager now transfers the data provided by the department managers into the
main model. Data should be transcribed from each of the returned task_entry.xls spreadsheets into main_model.xls. There are three steps:
� Step 1 – Copy data from task_entry.xls spreadsheet. From the ‘Output’ worksheet in
task_entry.xls click the ‘Copy to clipboard’ button
Click the button when
you are ready to copy the values in the
‘Output’ worksheet of task_entry.xls……..
The tasks you have recorded on ‘Sub1’ do not add up to 100%
You have recorded the same task more than once on ‘Sub1’

Version 2.02 14
� Step 2 – Paste data to ‘Current workforce – input’ sheet in main_model.xls. Go to the ‘Current workforce – input’ sheet in main_model.xls and locate the column where the values need to go. Select any cell in this column. In our example, if you are
transcribing the data for AfC band 2 in biochemistry, select any cell in column F.
Now click the button ‘Paste data into the same column as the selected cell’
� Step 3 – Replicate the data in ‘Revised workforce – input’ sheet in main_model.xls. Once you have completed all relevant AfC bands for a department in ‘Current
workforce – input’, you must replicate the data in ‘Revised workforce – input’. To do this, go to the ‘Revised workforce – input’ sheet, locate the section for the
department whose data you want to replicate, and click the button to ‘Copy and paste data for this department from current workforce’
Select a cell in the
appropriate column of ‘Current workforce – input’ in main_model.xls. . .
. . . then click the
button to paste the values

Version 2.02 15
Once the data from each department have been recorded, ‘Current workforce – input’ and
‘Revised workforce – input’ should be identical.
Current Depts – input
Use this worksheet to record average or indicative costs for each band in each department.
These should be fully-loaded costs, as described in Section 2.1. You need to record values only in the yellow cells in column D. These will already be populated with default values:
You have now completed the data collection phase. Return to Section 2.4 of the main guide.
Click the button to
replicate the values in
the ‘Current workforce – input’ worksheet for this department

Version 2.02 16
4 Simulate different scenarios
The main_model.xls spreadsheet can be used to remodel the composition of the workforce
and make predictions of the likely workforce profile if the volume of work changes. This Section describes how different scenarios can be simulated.
In Sections 4.1 and 4.2, you will be shown how to model changes in
� the mix of bands for each task, and the mix of tasks for each band and
� the volume of work done
4.1 Changing the mix of bands for each task, and the mix of tasks for each band
Once you have completed gathering data, the ‘Current workforce – input’ worksheet in
main_model.xls will reveal how the effort devoted to each task is spread across the nine bands. By reading down each column, you can see how the work of each band is split between the tasks. By reading across each row, you can see how each task is split between
the different bands. The values are WTEs.
The header for each department also reveals the amount of support work being done. In the
example above, the header in row 2 reveals that 38% of the work of the biochemistry
department is support. The differences between direct and support work are described in Section 3.4 of the main document.
Having established a baseline, you might want to remodel this profile. The ‘Revised
workforce – input’ worksheet allows you to do this. If you have transcribed the data from all
the task_entry.xls workbooks correctly, this worksheet will start as a duplicate of ‘Current workforce – input’.
Row 11 shows the profile of task 030201 by band
Column F shows the profile of work for staff at band 2
Version 2.02 17
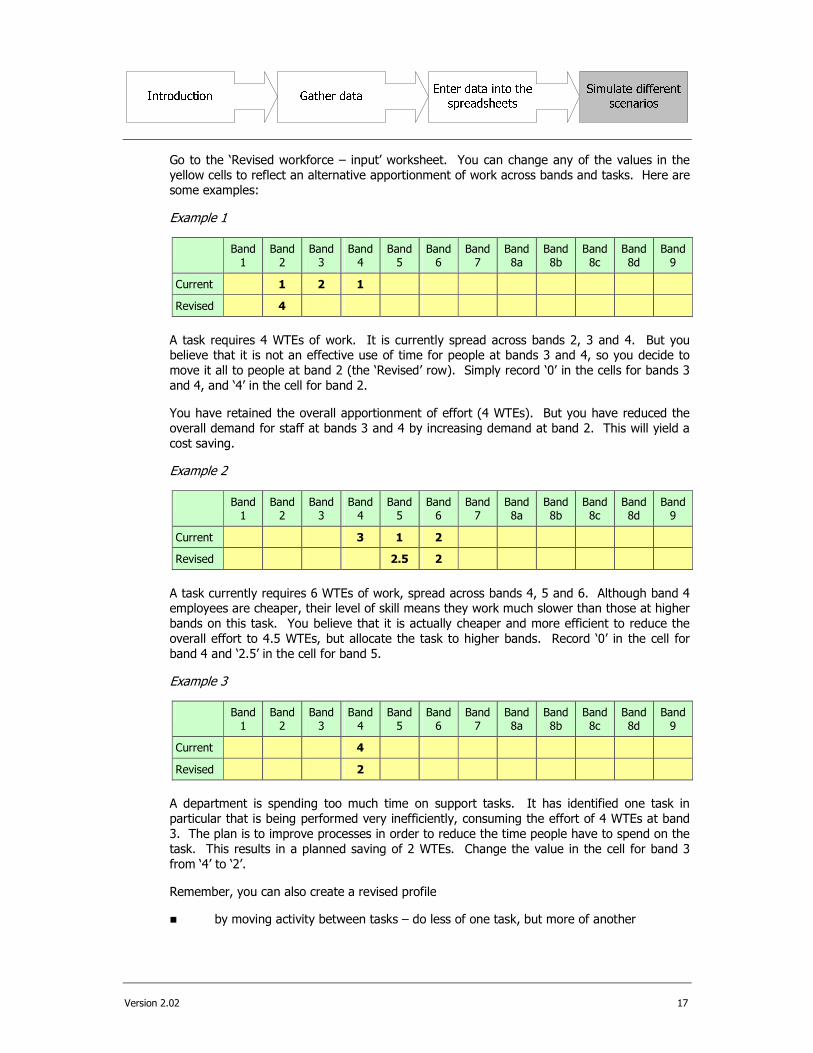
Go to the ‘Revised workforce – input’ worksheet. You can change any of the values in the
yellow cells to reflect an alternative apportionment of work across bands and tasks. Here are some examples:
Example 1
Band 1
Band 2
Band 3
Band 4
Band 5
Band 6
Band 7
Band 8a
Band 8b
Band 8c
Band 8d
Band 9
Current 1 2 1
Revised 4
A task requires 4 WTEs of work. It is currently spread across bands 2, 3 and 4. But you believe that it is not an effective use of time for people at bands 3 and 4, so you decide to
move it all to people at band 2 (the ‘Revised’ row). Simply record ‘0’ in the cells for bands 3
and 4, and ‘4’ in the cell for band 2.
You have retained the overall apportionment of effort (4 WTEs). But you have reduced the
overall demand for staff at bands 3 and 4 by increasing demand at band 2. This will yield a
cost saving.
Example 2
Band 1
Band 2
Band 3
Band 4
Band 5
Band 6
Band 7
Band 8a
Band 8b
Band 8c
Band 8d
Band 9
Current 3 1 2
Revised 2.5 2
A task currently requires 6 WTEs of work, spread across bands 4, 5 and 6. Although band 4 employees are cheaper, their level of skill means they work much slower than those at higher
bands on this task. You believe that it is actually cheaper and more efficient to reduce the
overall effort to 4.5 WTEs, but allocate the task to higher bands. Record ‘0’ in the cell for
band 4 and ‘2.5’ in the cell for band 5.
Example 3
Band 1
Band 2
Band 3
Band 4
Band 5
Band 6
Band 7
Band 8a
Band 8b
Band 8c
Band 8d
Band 9
Current 4
Revised 2
A department is spending too much time on support tasks. It has identified one task in
particular that is being performed very inefficiently, consuming the effort of 4 WTEs at band
3. The plan is to improve processes in order to reduce the time people have to spend on the
task. This results in a planned saving of 2 WTEs. Change the value in the cell for band 3
from ‘4’ to ‘2’.
Remember, you can also create a revised profile
� by moving activity between tasks – do less of one task, but more of another
Version 2.02 18
� by adding user-defined tasks (in the ‘Current workforce – input’ worksheet) to reflect
new ways of working (as a result of new technology, for instance).
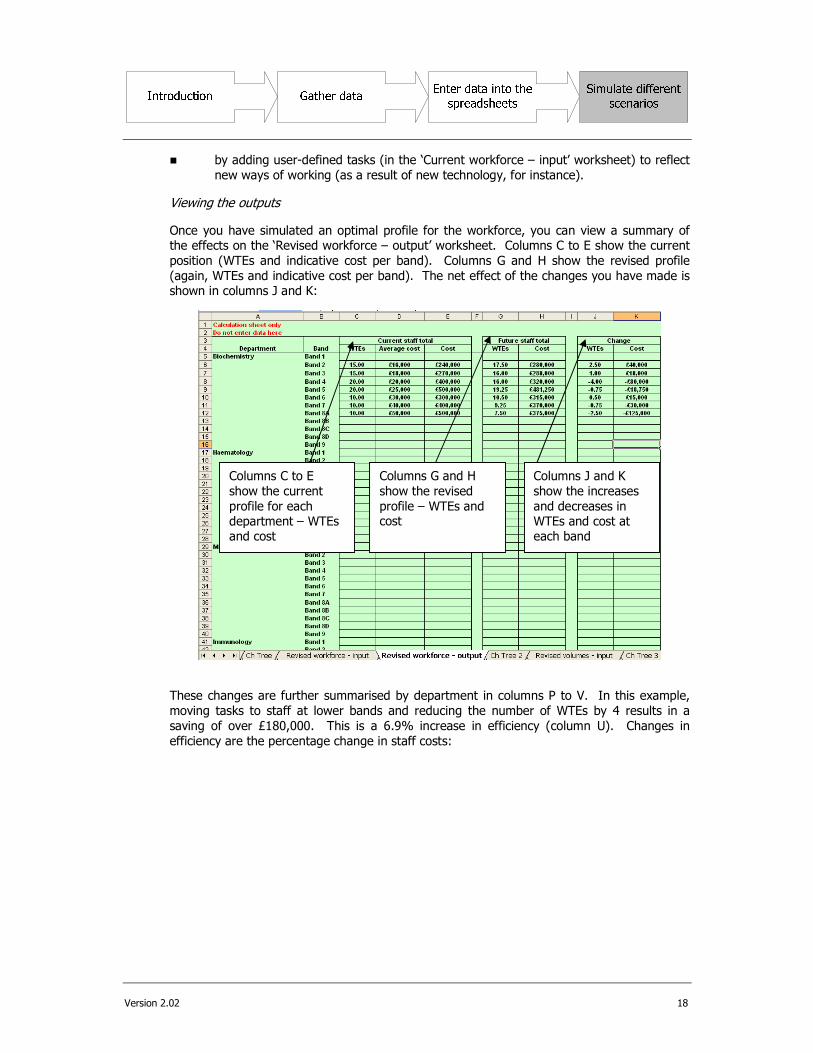
Viewing the outputs
Once you have simulated an optimal profile for the workforce, you can view a summary of the effects on the ‘Revised workforce – output’ worksheet. Columns C to E show the current
position (WTEs and indicative cost per band). Columns G and H show the revised profile
(again, WTEs and indicative cost per band). The net effect of the changes you have made is shown in columns J and K:
These changes are further summarised by department in columns P to V. In this example,
moving tasks to staff at lower bands and reducing the number of WTEs by 4 results in a
saving of over £180,000. This is a 6.9% increase in efficiency (column U). Changes in
efficiency are the percentage change in staff costs:
Columns C to E
show the current
profile for each department – WTEs and cost
Columns G and H
show the revised
profile – WTEs and cost
Columns J and K
show the increases
and decreases in WTEs and cost at each band

Version 2.02 19

Version 2.02 20
4.2 Changing the volume of work
Refer to the ‘Revised volumes – input’ worksheet. Columns D to G show your current
volumes. But you can place different volumes in the yellow cells (columns K to N) to reflect changes in the profile of the lab’s work. First, you should replicate your current volumes in
the yellow cells. To do this, click the button ‘Copy and paste data from current to future.’
Please note, if you leave yellow cells blank the future volumes will be treated as zero. You can now overwrite the values in yellow cells to reflect future volumes. In this
example, we have increased the volume of fully automated biochemistry tests by 1,200,000:
Please note: If you include CSR in your analysis, you must remember to adjust its volumes if volumes change in other departments.
Viewing the outputs
The model now calculates a future workforce based on these revised volumes. You can view
the outputs on the ‘Revised workforce & vols – out’ worksheet:
The information is further summarised in columns R to AP. In this example, the 55% increase in biochemistry tests (from 2,165,000 to 3,365,000) requires a 22% increase in
WTEs, yielding a 26% improvement in efficiency:
Columns C to G show
the current profile for
each department – WTEs, cost and the amount of direct work
Columns I to L show the
revised profile, where
the workforce has been optimised for current volumes of work
Columns N to Q show
the revised profile if
changes in volumes are taken into account

Version 2.02 21
This ‘Summary of effect’ output also gives indicative costs per test. The costs per test ONLY
SHOW DIRECT PEOPLE COSTS. In other words, there are no marginal costs, indirect costs or trust overheads included. The relative change in cost per test is shown as an
efficiency change in columns AE and AO.
To see the detail of these changes, go to the ‘Revised workforce with volumes’ worksheet.
This looks like ‘Current workforce – input’. It shows how each band of the increased workforce should ideally be deployed across the tasks (and how the tasks should be
resourced across the bands). As before, the header gives an indication of the predicted amount of direct work:
Appendix 1 i
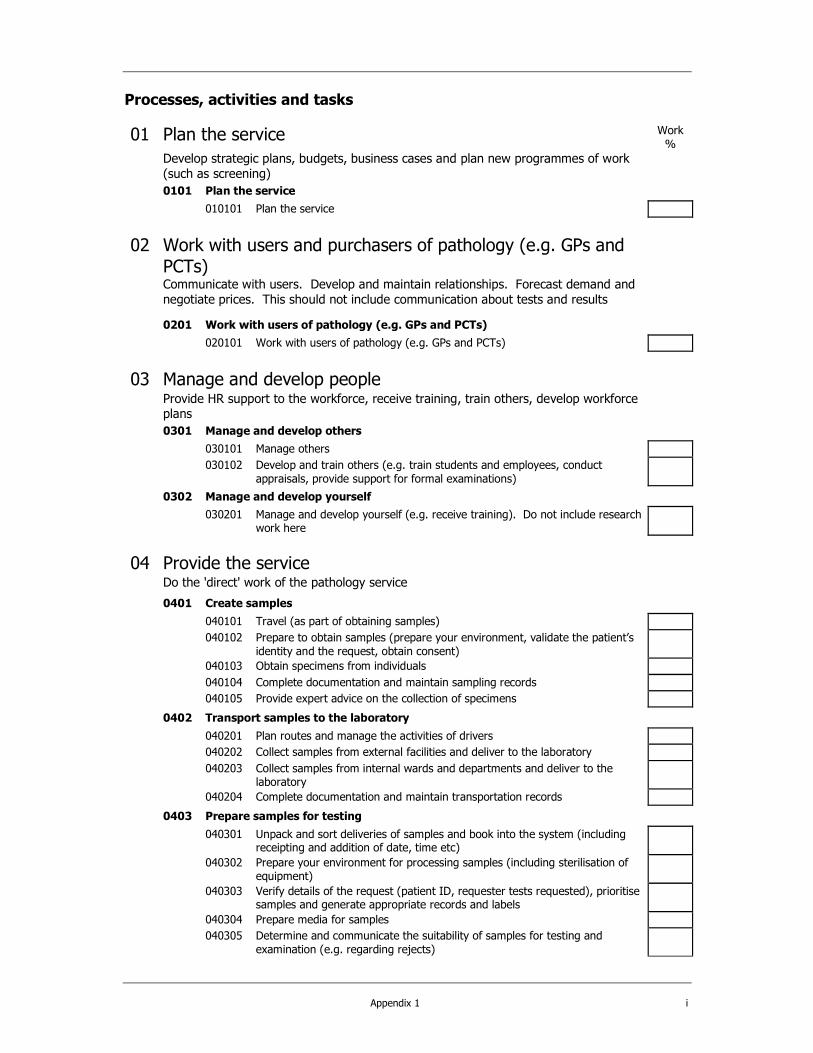
Processes, activities and tasks
01 Plan the service Work
%
Develop strategic plans, budgets, business cases and plan new programmes of work
(such as screening)
0101 Plan the service
010101 Plan the service
02 Work with users and purchasers of pathology (e.g. GPs and PCTs)
Communicate with users. Develop and maintain relationships. Forecast demand and
negotiate prices. This should not include communication about tests and results
0201 Work with users of pathology (e.g. GPs and PCTs)
020101 Work with users of pathology (e.g. GPs and PCTs)
03 Manage and develop people Provide HR support to the workforce, receive training, train others, develop workforce
plans
0301 Manage and develop others
030101 Manage others
030102 Develop and train others (e.g. train students and employees, conduct
appraisals, provide support for formal examinations)
0302 Manage and develop yourself
030201 Manage and develop yourself (e.g. receive training). Do not include research work here
04 Provide the service Do the 'direct' work of the pathology service
0401 Create samples
040101 Travel (as part of obtaining samples)
040102 Prepare to obtain samples (prepare your environment, validate the patient’s
identity and the request, obtain consent)
040103 Obtain specimens from individuals
040104 Complete documentation and maintain sampling records
040105 Provide expert advice on the collection of specimens
0402 Transport samples to the laboratory
040201 Plan routes and manage the activities of drivers
040202 Collect samples from external facilities and deliver to the laboratory
040203 Collect samples from internal wards and departments and deliver to the laboratory
040204 Complete documentation and maintain transportation records
0403 Prepare samples for testing
040301 Unpack and sort deliveries of samples and book into the system (including receipting and addition of date, time etc)
040302 Prepare your environment for processing samples (including sterilisation of equipment)
040303 Verify details of the request (patient ID, requester tests requested), prioritise samples and generate appropriate records and labels
040304 Prepare media for samples
040305 Determine and communicate the suitability of samples for testing and
examination (e.g. regarding rejects)
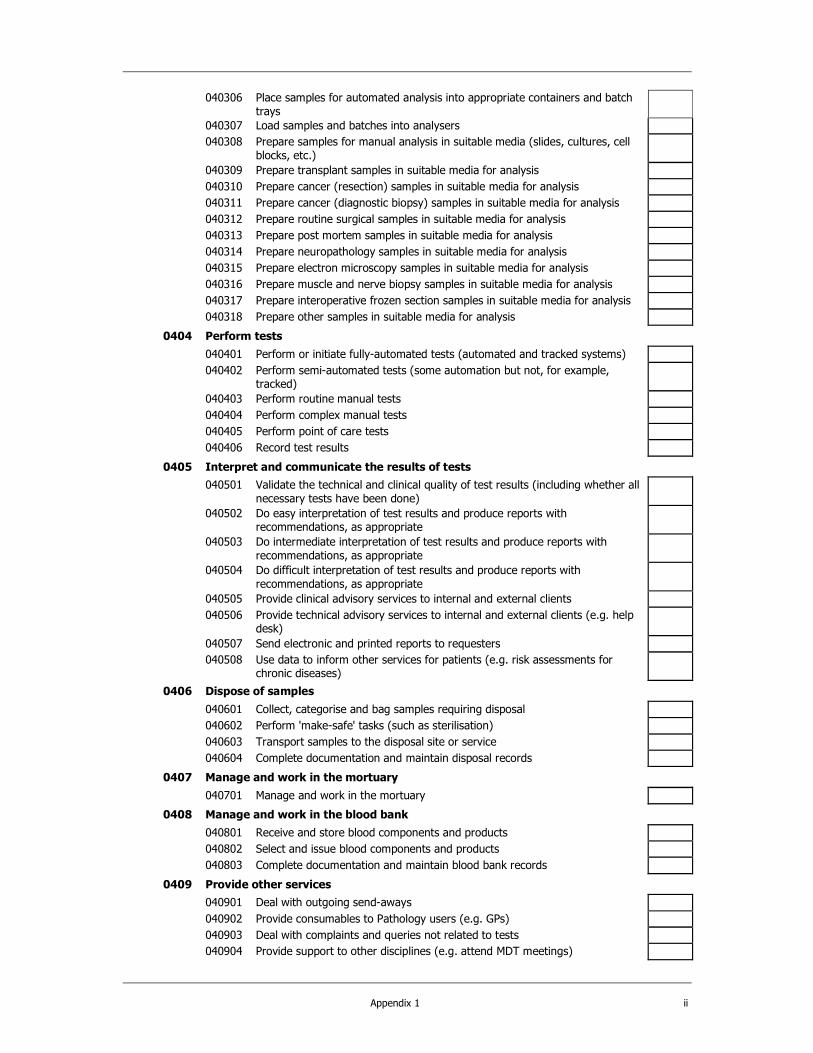
Appendix 1 ii
040306 Place samples for automated analysis into appropriate containers and batch
trays
040307 Load samples and batches into analysers
040308 Prepare samples for manual analysis in suitable media (slides, cultures, cell
blocks, etc.)
040309 Prepare transplant samples in suitable media for analysis
040310 Prepare cancer (resection) samples in suitable media for analysis
040311 Prepare cancer (diagnostic biopsy) samples in suitable media for analysis
040312 Prepare routine surgical samples in suitable media for analysis
040313 Prepare post mortem samples in suitable media for analysis
040314 Prepare neuropathology samples in suitable media for analysis
040315 Prepare electron microscopy samples in suitable media for analysis
040316 Prepare muscle and nerve biopsy samples in suitable media for analysis
040317 Prepare interoperative frozen section samples in suitable media for analysis
040318 Prepare other samples in suitable media for analysis
0404 Perform tests
040401 Perform or initiate fully-automated tests (automated and tracked systems)
040402 Perform semi-automated tests (some automation but not, for example, tracked)
040403 Perform routine manual tests
040404 Perform complex manual tests
040405 Perform point of care tests
040406 Record test results
0405 Interpret and communicate the results of tests
040501 Validate the technical and clinical quality of test results (including whether all
necessary tests have been done)
040502 Do easy interpretation of test results and produce reports with recommendations, as appropriate
040503 Do intermediate interpretation of test results and produce reports with
recommendations, as appropriate
040504 Do difficult interpretation of test results and produce reports with
recommendations, as appropriate
040505 Provide clinical advisory services to internal and external clients
040506 Provide technical advisory services to internal and external clients (e.g. help desk)
040507 Send electronic and printed reports to requesters
040508 Use data to inform other services for patients (e.g. risk assessments for chronic diseases)
0406 Dispose of samples
040601 Collect, categorise and bag samples requiring disposal
040602 Perform 'make-safe' tasks (such as sterilisation)
040603 Transport samples to the disposal site or service
040604 Complete documentation and maintain disposal records
0407 Manage and work in the mortuary
040701 Manage and work in the mortuary
0408 Manage and work in the blood bank
040801 Receive and store blood components and products
040802 Select and issue blood components and products
040803 Complete documentation and maintain blood bank records
0409 Provide other services
040901 Deal with outgoing send-aways
040902 Provide consumables to Pathology users (e.g. GPs)
040903 Deal with complaints and queries not related to tests
040904 Provide support to other disciplines (e.g. attend MDT meetings)

Appendix 1 iii
0410 Other direct tasks
041001 Other direct task 1:
041002 Other direct task 2:
041003 Other direct task 3:
041004 Other direct task 4:
041005 Other direct task 5:
040106 Other direct task 6:
041007 Other direct task 7:
041008 Other direct task 8:
041009 Other direct task 9:
041010 Other direct task 10:
05 Manage other resources (not people) Develop, manage and maintain suppliers, contractors, IT and other physical resources
0501 Manage other resources
050101 Manage other resources
06 Manage and administer the service Provide managerial and administrative support to the pathology service
0601 Manage estates and facilities
060101 Manage estates and facilities
0602 Provide office administration services
060201 Provide office administration services (including dealing with post and
managing email for others)
0603 Produce protocols and other documentation
060301 Produce protocols and other documentation
0604 Provide support to other parts of the organisation (including other pathology departments)
060401 Provide support to other parts of the organisation
0605 Manage external relationships (e.g. with the Department of Health). Do not include relationships with users of the service
060501 Manage external relationships
0606 Produce reports and submit statutory returns
060601 Produce reports and submit statutory returns
0607 Administer screening programmes (excluding testing)
060701 Administer screening programmes (excluding testing)
0608 Administer financial transactions
060801 Administer financial transactions
0609 Administer and undertake travel
060901 Administer and undertake travel
07 Manage and administer quality, health and safety Manage and administer quality, health and safety (including quality assurance, audit,
accreditation, risk management and governance)
0701 Manage and administer quality, health and safety
070101 Manage and administer quality, health and safety

Appendix 1 iv
08 Improve the service Improve the service through specific projects and research work
0801 Improve the service
080101 Improve the service through formal projects
080102 Investigate and develop new tests and techniques
080103 Undertake your own research work
080104 Provide assistance to others' research work
080105 Prepare and present material (e.g. for conferences or peer review). Do not include work associated directly with your own research
09 Other support tasks Use the spaces provided to add up to five extra tasks to apportion time to
0901 Other support tasks
090101 Other support task 1:
090102 Other support task 2:
090103 Other support task 3:
090104 Other support task 4:
090105 Other support task 5:

Appendix 1 v
The structure of the task list
The task list is split into eight processes, each with a two-digit code. For example, process 04 is
‘Provide the service’. For some processes there are no additional levels of detail (into activities and tasks). Such a process should be treated as a ‘catch-all’ for any work that best fits the description of
the process.
Some processes are broken down into activities, each with a four-digit code. For example, activity
0401 is ‘Create samples’ (within process 04).
Some activities are broken down into tasks, each with a six-digit code. For example, task 040103 is ‘Obtain specimens from individuals’ (within activity 0401).
In the list above, each process is given a brief explanation. And some tasks have a very short description of what might be included. Further details of what to include or exclude from specific
tasks, activities or processes are provided below.
Guidance on what to include or exclude from specific processes, activities or tasks
People will often spend a significant amount of time in meetings. This should be allocated to the
process, activity or task that best describes the work being done in the meeting. As an example, attendance at MDT meetings should be allocated to activity 040904.
Process 01
Work associated with planning new programmes should be included here. However, work associated
with the technology or science behind new programmes or tests should be recorded in process 8,
‘Improve the Service’.
Process 02 This should include communications about the business of the pathology service. Work related to the
development of contracts or relationships should be included. But communications about specific
tests should not appear here (it should be within process 4, ‘Provide the service’).
Process 03
This should include the management of people, the provision and receipt of training and also work normally associated with the Human Resources function.
All work related to the provision of training for others should be included in 030102. This could be
the provision of ‘on the job’ training, organising and attending external training courses, and any
training of medical students. Presentations at conferences should not be included here (it should be allocated to 080105).
Process 04
Task 040101, ‘Travel (as part of obtaining samples)’. This should include the return journey after
taking a sample and/or any onward journeys to take further samples.
Activity 0402, ‘Transport samples to the laboratory’. People, such as phlebotomists, who take
samples and transport them to the laboratory, should record their travelling time in task 040101. Activity 0402 should be used to record the work of people whose dedicated role is transportation.
You can also record the effort involved in managing these people in this section.

Appendix 1 vi
Activity 0404, ‘Perform tests’. This should include tests done for the blood bank, such as compatibility
and antibody testing. But the loading of samples into machines should be excluded (it should be allocated to an appropriate task in activity 0403).
Process 05
The pathology service will make use of a wide range of physical resources, from consumables and stationery to major capital items. In process 05 you should record time spent managing the
procurement of these items and businesses that supply them.
Process 06
This process covers activities that directly support the work of the pathology departments.
Process 07 Do not record time spent on testing samples for Internal Quality Assurance (IQA). This should be
recorded in activity 0404, ‘Perform tests’. Process 07 should be used to record the organisational
aspects of quality management and health and safety.
Process 08
Some activities help to improve the service – its range of tests, core capabilities, and so on. And some activities add value to the wider pathology community – research, presenting at conferences,
for instance. Record the work on these activities here. Do not include work on quality improvement
initiatives here. This belongs in process 07.

Appendix 2 i
Flow chart for initial data entry
Familiarise with the PATs list
Issue guidance notes to department managers
Make a list of the staff at each band
Apportion the time of each subgroup to the tasks
Make a note of the tasks that are done by each
subgroup
Create subgroups of the staff at each band
Preparation Action
Project manager
Project managerDepartment managers
Department managers
Department managers
Department managers
Department managers
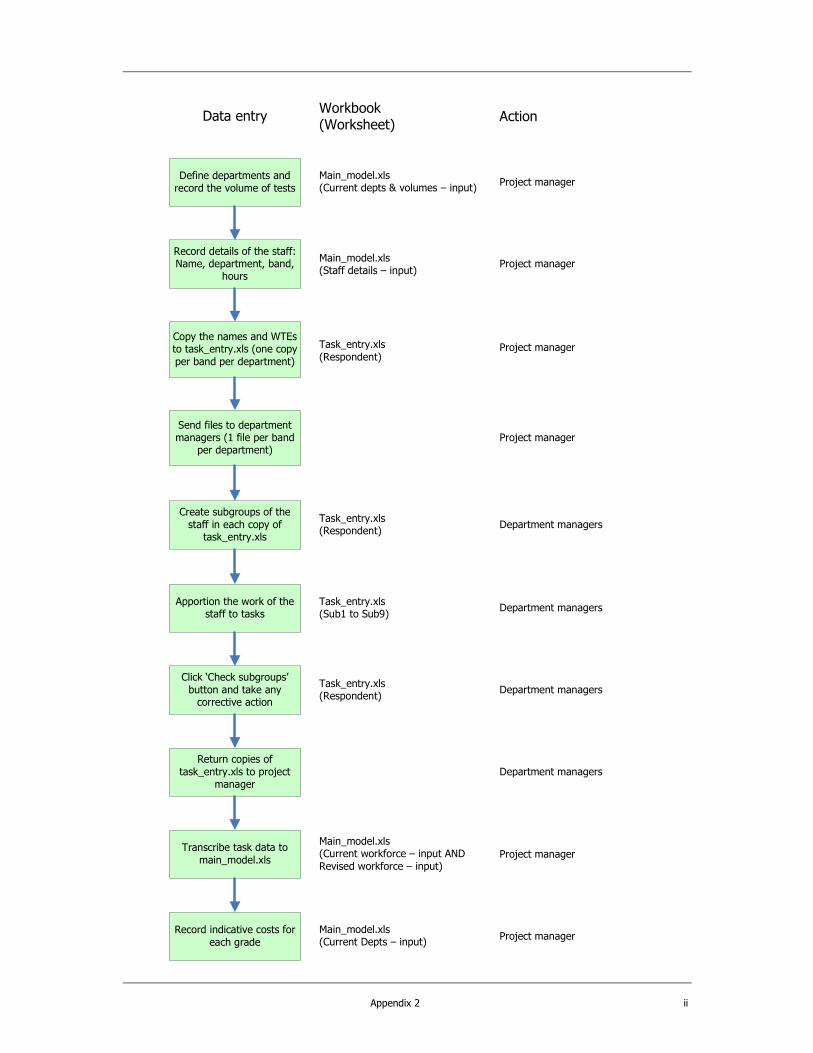
Appendix 2 ii
Record details of the staff: Name, department, band,
hours
Apportion the work of the staff to tasks
Create subgroups of the
staff in each copy of task_entry.xls
Transcribe task data to
main_model.xls
Return copies of
task_entry.xls to project manager
Copy the names and WTEs to task_entry.xls (one copy
per band per department)
Send files to department managers (1 file per band
per department)
Define departments and
record the volume of tests
Data entryWorkbook (Worksheet)
Action
Task_entry.xls
(Respondent)
Department managers
Main_model.xls(Staff details – input)
Project manager
Project manager
Project manager
Task_entry.xls(Respondent)
Task_entry.xls(Sub1 to Sub9)
Department managers
Click ‘Check subgroups’
button and take any corrective action
Task_entry.xls(Respondent)
Department managers
Department managers
Project manager
Main_model.xls(Current workforce – input AND
Revised workforce – input)
Project managerMain_model.xls(Current depts & volumes – input)
Record indicative costs for
each gradeProject manager
Main_model.xls(Current Depts – input)

Appendix 3 i
Quick step by step guides
Project Manager
The project manager should be responsible for main_model.xls. He or she will also be required to record some of the data in task_entry.xls.
1 Familiarise yourself with the PATs list
2 Gather the following information:
- Data about the workforce
- Indicative costs for each band in each department - Number of diagnostic tests done
3 Define departments and record the number of diagnostic tests done in main_model.xls
(‘Current depts. & volumes – input’)
4 Record details of the staff (name, department, band, hours) in main_model.xls (‘Staff details – input’)
5 Add any user-defined tasks to ‘Current workforce – input’ and define each task’s sensitivity to
changes in the volume of tests
6 Copy the names and WTEs to task_entry.xls (‘Respondent’). Make one copy of task_entry.xls per band of AfC per department. Remember to add any user-defined tasks
7 Send the files (from 6 above) to department managers
8 Once the completed files are returned from department managers, transcribe data to main_model.xls. From the ‘Output’ worksheet in task_entry.xls click the ‘Copy to clipboard’ button. Go to the ‘Current workforce – input’ sheet in main_model.xls and locate the column where the values need to go. Select any cell in this column. Now click on the button ‘Paste
data into the same column as the selected cell’
9 Replicate these data in main_model.xls (‘Revised workforce – input’) by clicking on the button
to ‘Copy and paste data for this department from current workforce’
10 Record indicative costs for each grade in main_model.xls (‘Current Depts – input'). These will already be populated with default values
11 Reprofile the workforce (‘Revised workforce – input’) and predict future volumes of work (‘Revised volumes – input’)
Appendix 3 ii
Department Manager
The collection of activity data (time allocated to tasks, as described in Sections 2.2 and 3.2) should be
delegated to the department managers. They will be responsible for task_entry.xls.
1 Familiarise yourself with the PATs list
2 Create subgroups of the staff in each copy of task_entry.xls (‘Respondent’) 3 Using one printed copy of the PATs list for each subgroup, apportion the time of each
subgroup to the tasks. This could be done by the department manager or delegated to a representative for each subgroup. Either way, follow these steps:
a Go through the list and clearly mark the tasks that the subgroup does
b Choose the one task that the subgroup spends most of its time doing (a ‘foundation task’). Record the percentage of complete working time (contracted plus additional
time) that is spent on the foundation task
c Then go through all the other tasks that you have highlighted. Using percentages,
apportion the time of the subgroup to each task in turn. Do this by comparing each task with the foundation task
d Add up the total percentage time for each task. If the total is more (or less) than
100%, then review each task and adjust accordingly. You could possibly round all the
tasks down (or up) proportionally
e Check again that all tasks total 100%
4 Add these data to the spreadsheet on task_entry.xls (Sub 1 to Sub 12) 5 Click on the 'Check subgroups' button on task_entry.xls (‘Respondent’) and take any
corrective action
6 Return copies of task_entry.xls to the project manager

Top Related