


Languages
Pages
Legal

ISCTM~ECNP Joint Conference ▪29 August 2015 ▪Amsterdam The Netherlands
Placebo response in MDD/Bipolar studies
Eduard Vieta
University of Barcelona
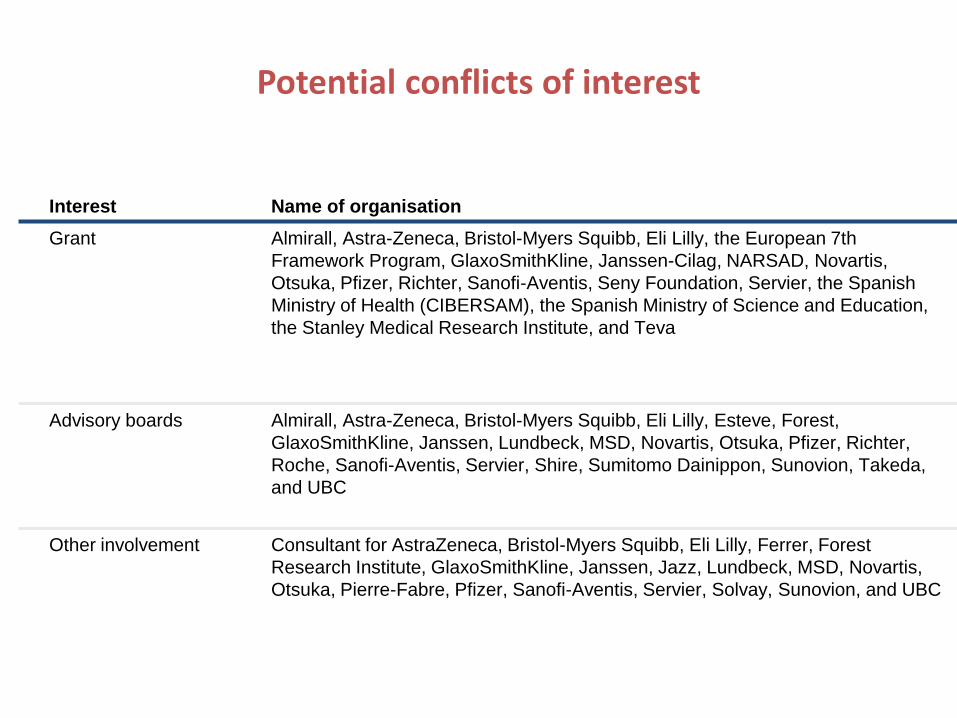
Interest Name of organisation
Grant Almirall, Astra-Zeneca, Bristol-Myers Squibb, Eli Lilly, the European 7th
Framework Program, GlaxoSmithKline, Janssen-Cilag, NARSAD, Novartis,
Otsuka, Pfizer, Richter, Sanofi-Aventis, Seny Foundation, Servier, the Spanish
Ministry of Health (CIBERSAM), the Spanish Ministry of Science and Education,
the Stanley Medical Research Institute, and Teva
Advisory boards Almirall, Astra-Zeneca, Bristol-Myers Squibb, Eli Lilly, Esteve, Forest,
GlaxoSmithKline, Janssen, Lundbeck, MSD, Novartis, Otsuka, Pfizer, Richter,
Roche, Sanofi-Aventis, Servier, Shire, Sumitomo Dainippon, Sunovion, Takeda,
and UBC
Other involvement Consultant for AstraZeneca, Bristol-Myers Squibb, Eli Lilly, Ferrer, Forest
Research Institute, GlaxoSmithKline, Janssen, Jazz, Lundbeck, MSD, Novartis,
Otsuka, Pierre-Fabre, Pfizer, Sanofi-Aventis, Servier, Solvay, Sunovion, and UBC
Potential conflicts of interest
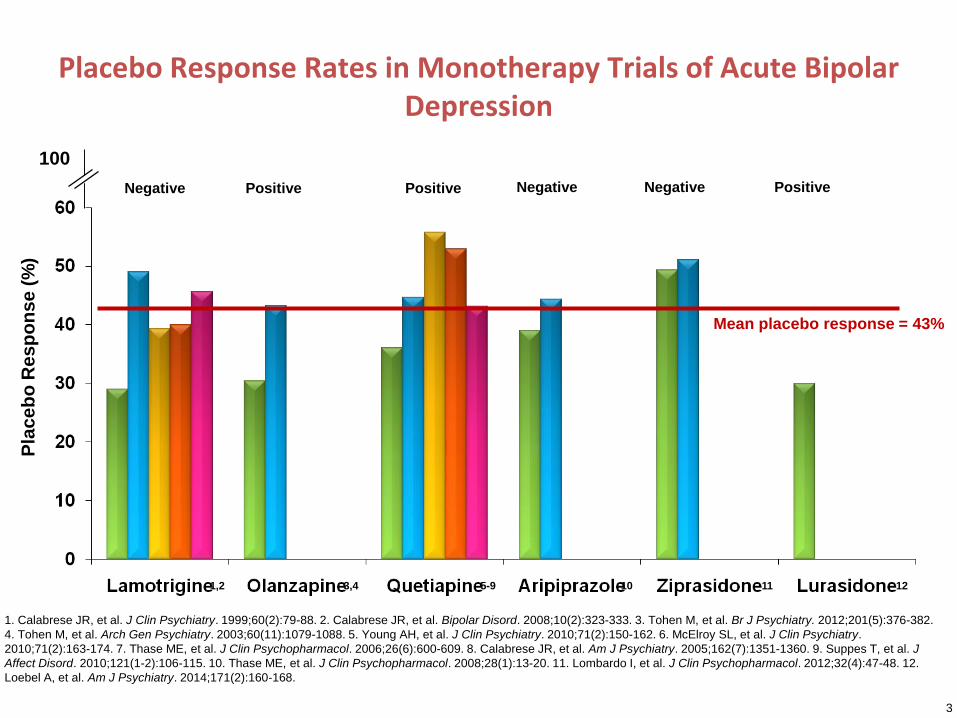
Placebo Response Rates in Monotherapy Trials of Acute Bipolar Depression
Mean placebo response = 43%
3
1. Calabrese JR, et al. J Clin Psychiatry. 1999;60(2):79-88. 2. Calabrese JR, et al. Bipolar Disord. 2008;10(2):323-333. 3. Tohen M, et al. Br J Psychiatry. 2012;201(5):376-382.
4. Tohen M, et al. Arch Gen Psychiatry. 2003;60(11):1079-1088. 5. Young AH, et al. J Clin Psychiatry. 2010;71(2):150-162. 6. McElroy SL, et al. J Clin Psychiatry.
2010;71(2):163-174. 7. Thase ME, et al. J Clin Psychopharmacol. 2006;26(6):600-609. 8. Calabrese JR, et al. Am J Psychiatry. 2005;162(7):1351-1360. 9. Suppes T, et al. J
Affect Disord. 2010;121(1-2):106-115. 10. Thase ME, et al. J Clin Psychopharmacol. 2008;28(1):13-20. 11. Lombardo I, et al. J Clin Psychopharmacol. 2012;32(4):47-48. 12.
Loebel A, et al. Am J Psychiatry. 2014;171(2):160-168.
1,2
Negative
3,4
Positive
5-9
Positive
10
Negative
11 12
Negative Positive
Pla
ce
bo
Re
sp
on
se
(%
)
100
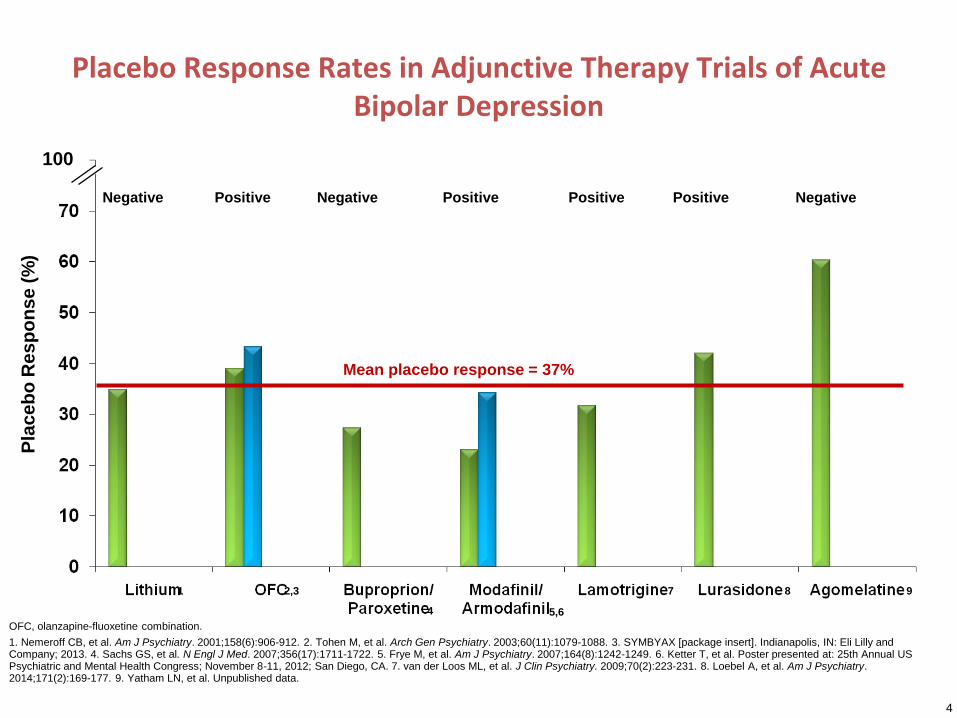
Placebo Response Rates in Adjunctive Therapy Trials of Acute Bipolar Depression
Mean placebo response = 37%
4
OFC, olanzapine-fluoxetine combination.
1. Nemeroff CB, et al. Am J Psychiatry. 2001;158(6):906-912. 2. Tohen M, et al. Arch Gen Psychiatry. 2003;60(11):1079-1088. 3. SYMBYAX [package insert]. Indianapolis, IN: Eli Lilly and Company; 2013. 4. Sachs GS, et al. N Engl J Med. 2007;356(17):1711-1722. 5. Frye M, et al. Am J Psychiatry. 2007;164(8):1242-1249. 6. Ketter T, et al. Poster presented at: 25th Annual US Psychiatric and Mental Health Congress; November 8-11, 2012; San Diego, CA. 7. van der Loos ML, et al. J Clin Psychiatry. 2009;70(2):223-231. 8. Loebel A, et al. Am J Psychiatry. 2014;171(2):169-177. 9. Yatham LN, et al. Unpublished data.
1 2,3
4 5,6
7 8 9
Negative Positive Negative Positive Positive Positive Negative
Pla
ce
bo
Re
sp
on
se
(%
)
100
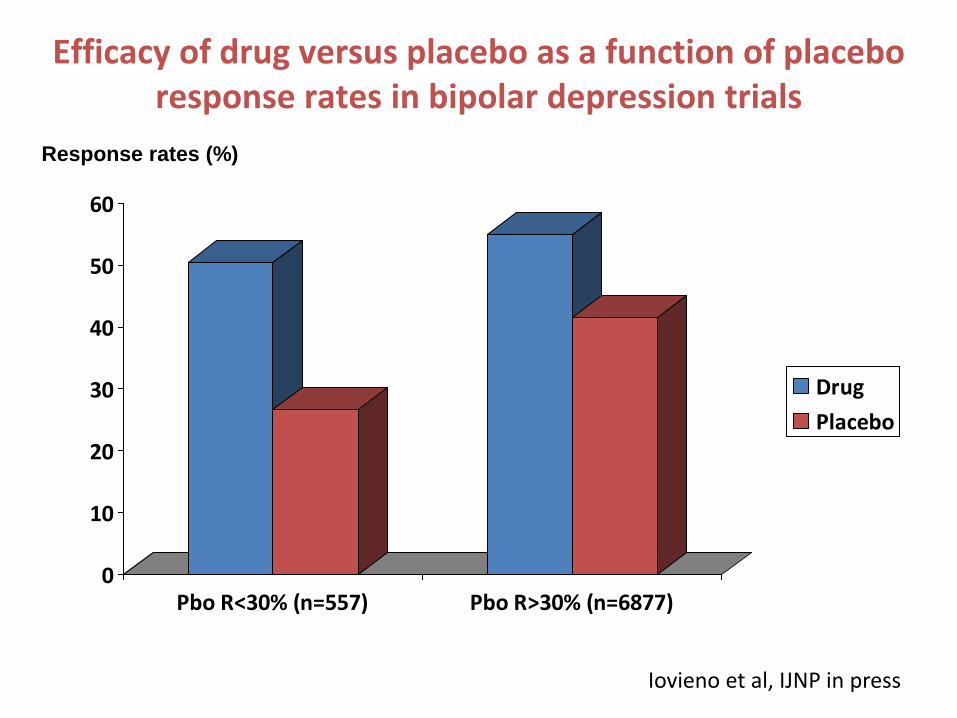
Efficacy of drug versus placebo as a function of placebo response rates in bipolar depression trials
0
10
20
30
40
50
60
Pbo R<30% (n=557) Pbo R>30% (n=6877)
Drug
Placebo
Iovieno et al, IJNP in press
Response rates (%)
6
Placebo Active Treatment
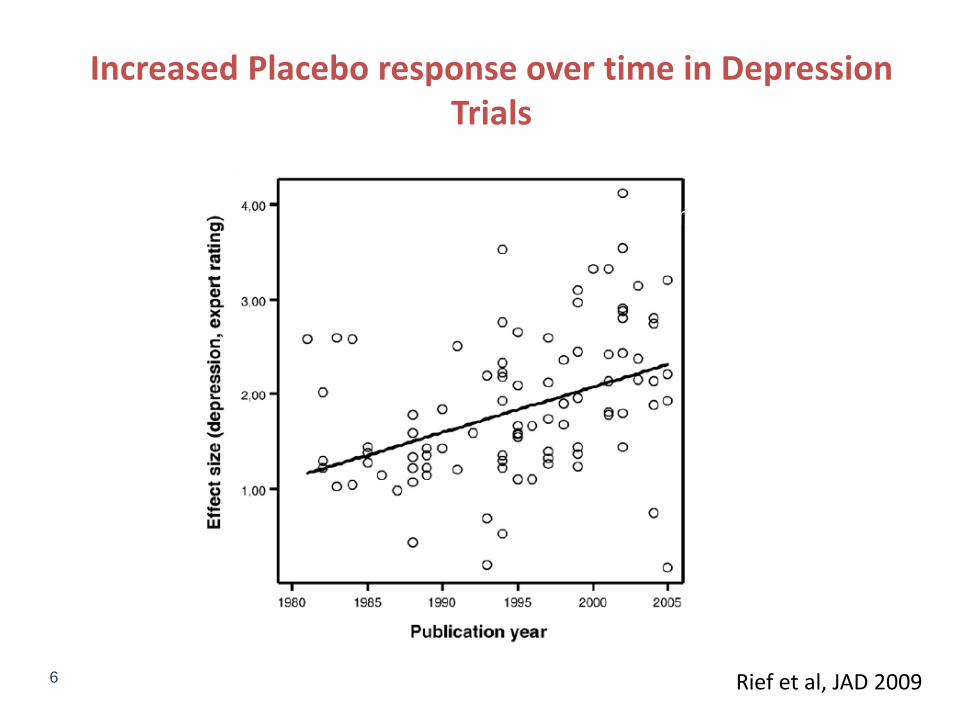
Increased Placebo response over time in Depression Trials
Rief et al, JAD 2009
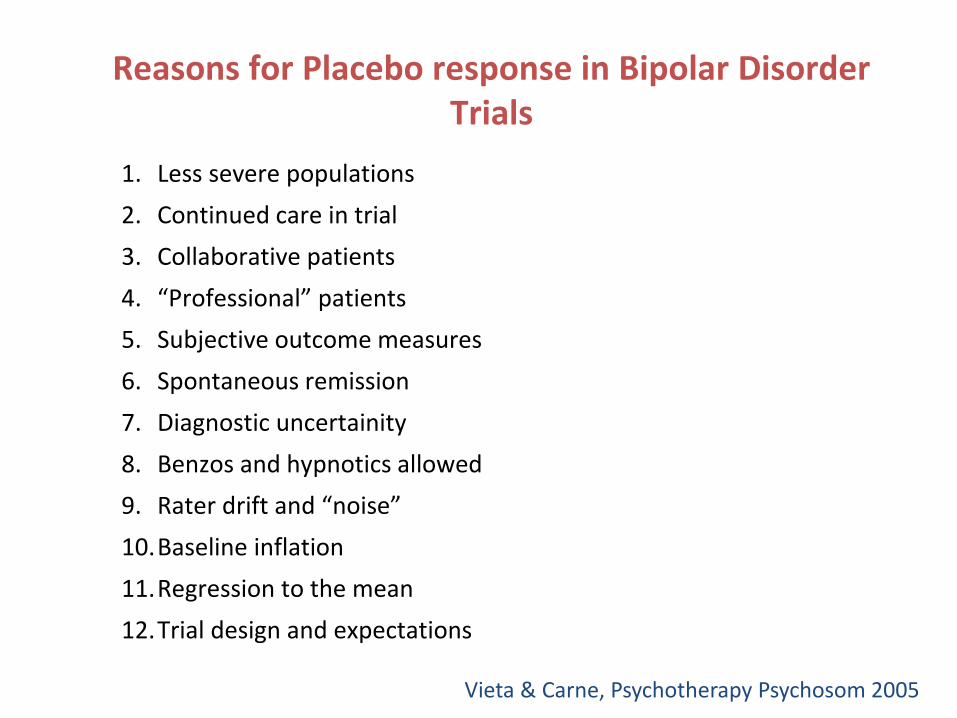
Reasons for Placebo response in Bipolar Disorder Trials
1. Less severe populations
2. Continued care in trial
3. Collaborative patients
4. “Professional” patients
5. Subjective outcome measures
6. Spontaneous remission
7. Diagnostic uncertainity
8. Benzos and hypnotics allowed
9. Rater drift and “noise”
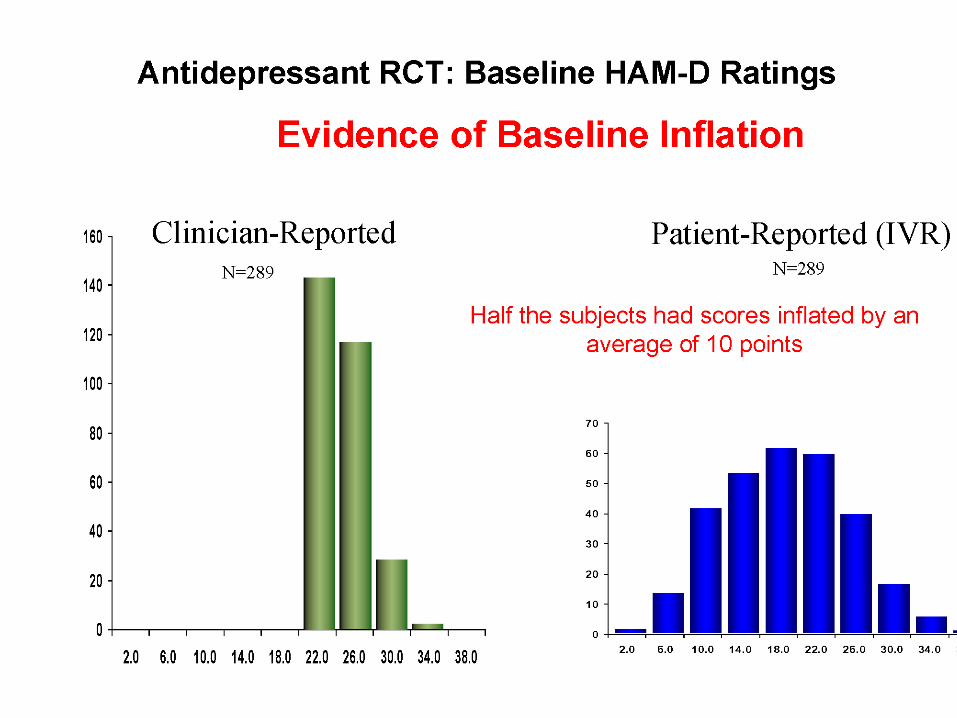
10.Baseline inflation
11.Regression to the mean
12.Trial design and expectations
Vieta & Carne, Psychotherapy Psychosom 2005
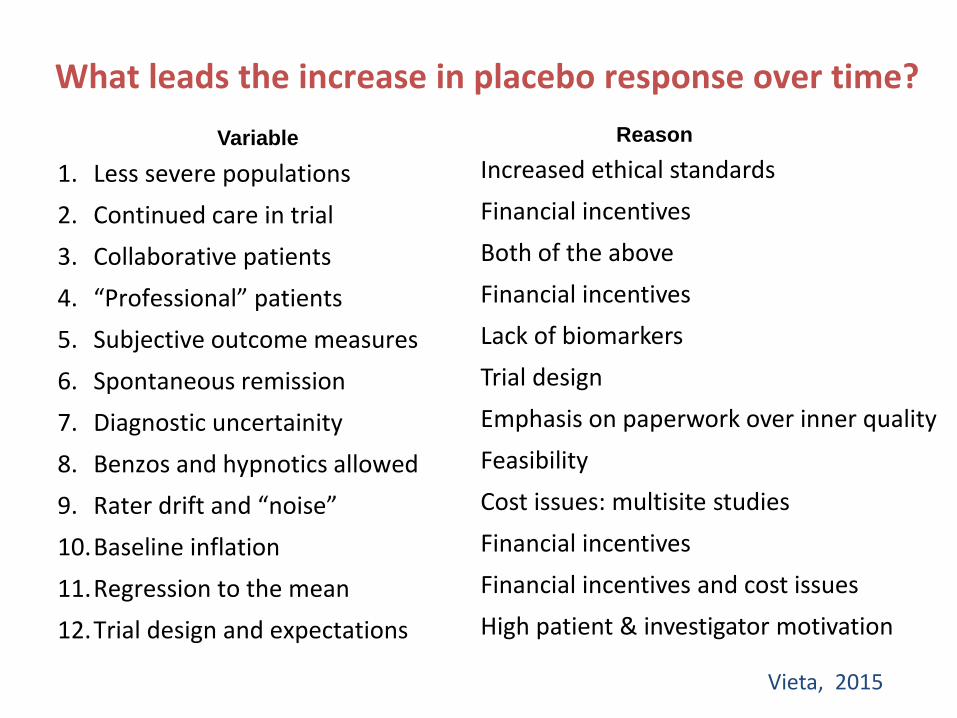
What leads the increase in placebo response over time?
1. Less severe populations
2. Continued care in trial
3. Collaborative patients
4. “Professional” patients
5. Subjective outcome measures
6. Spontaneous remission
7. Diagnostic uncertainity
8. Benzos and hypnotics allowed
9. Rater drift and “noise”
10.Baseline inflation
11.Regression to the mean
12.Trial design and expectations
Vieta, 2015
Increased ethical standards
Financial incentives
Both of the above
Financial incentives
Lack of biomarkers
Trial design
Emphasis on paperwork over inner quality
Feasibility
Cost issues: multisite studies
Financial incentives
Financial incentives and cost issues
High patient & investigator motivation
Variable Reason
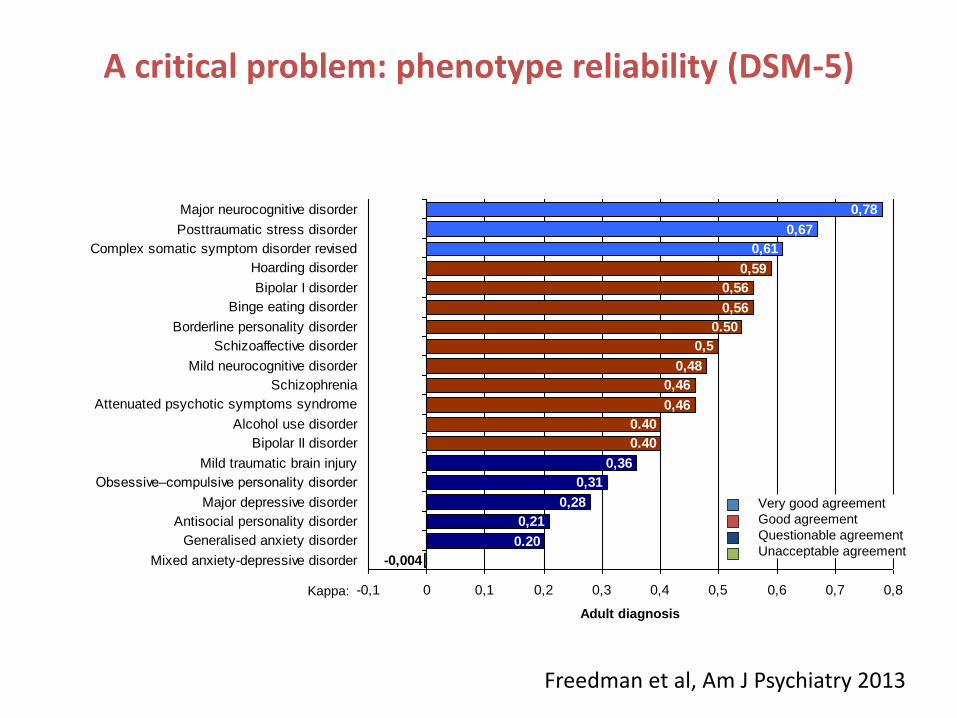
Kappa
0,21
0,28
0,31
0,36
0,46
0,46
0,48
0,5
0,56
0,56
0,59
0,61
0,67
0,78
0.50
0.40
0.40
0.20
-0,004
-0,1 0 0,1 0,2 0,3 0,4 0,5 0,6 0,7 0,8
Mixed anxiety-depressive disorder
Generalised anxiety disorder
Antisocial personality disorder
Major depressive disorder
Obsessive–compulsive personality disorder
Mild traumatic brain injury
Bipolar II disorder
Alcohol use disorder
Attenuated psychotic symptoms syndrome
Schizophrenia
Mild neurocognitive disorder
Schizoaffective disorder
Borderline personality disorder
Binge eating disorder
Bipolar I disorder
Hoarding disorder
Complex somatic symptom disorder revised
Posttraumatic stress disorder
Major neurocognitive disorder
Adult diagnosis
Kappa:
Very good agreement
Good agreement
Questionable agreement
Unacceptable agreement
Freedman et al, Am J Psychiatry 2013
A critical problem: phenotype reliability (DSM-5)
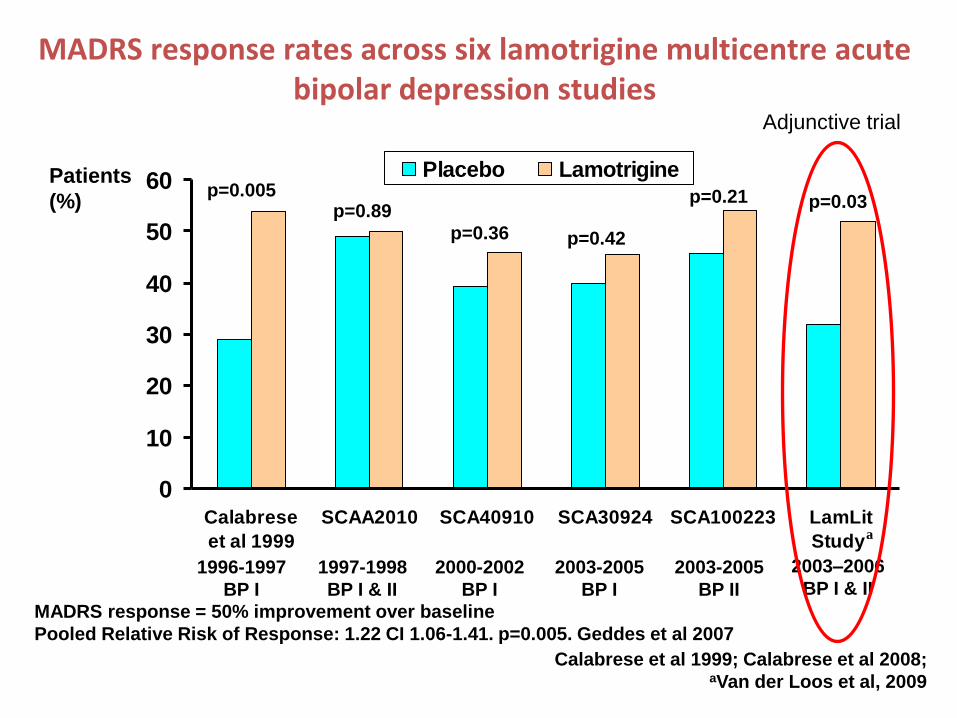
MADRS response rates across six lamotrigine multicentre acute bipolar depression studies
0
10
20
30
40
50
60
Calabrese
et al 1999
SCAA2010 SCA40910 SCA30924 SCA100223 LamLit
Study
Placebo Lamotrigine
p=0.42p=0.36
p=0.89p=0.005 p=0.21 p=0.03
Calabrese et al 1999; Calabrese et al 2008; aVan der Loos et al, 2009
a
Patients
(%)
2003-2005
BP I
2000-2002
BP I
1997-1998
BP I & II
1996-1997
BP I
2003-2005
BP II
2003–2006
BP I & II
MADRS response = 50% improvement over baseline
Pooled Relative Risk of Response: 1.22 CI 1.06-1.41. p=0.005. Geddes et al 2007
Adjunctive trial
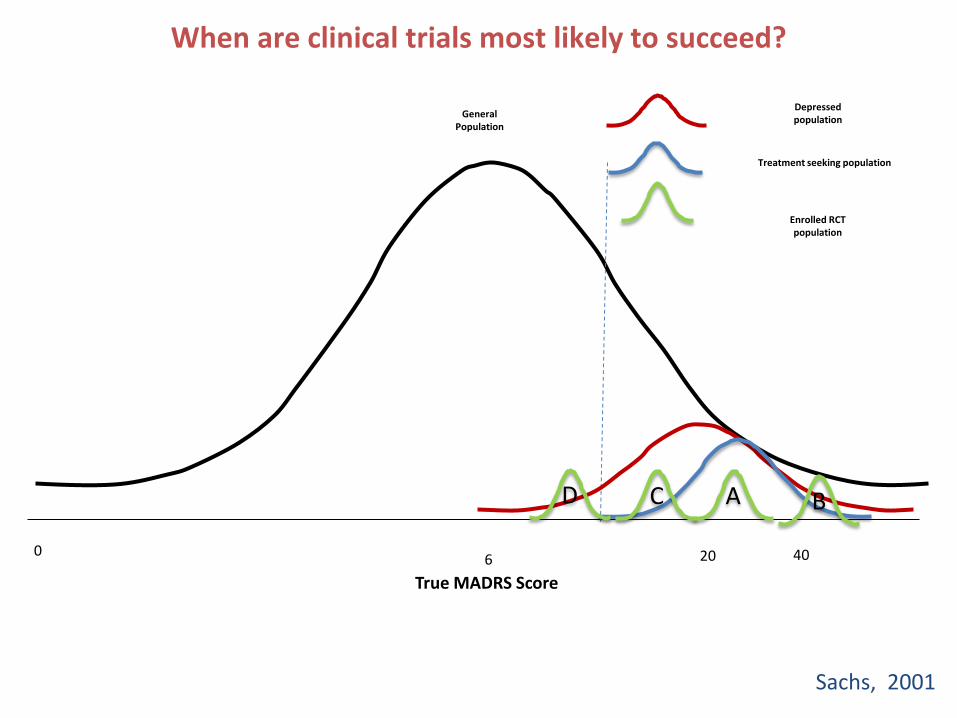
When are clinical trials most likely to succeed?
True YMRS Score
GeneralPopulation
Manic population
6 20 40
CD A B
Treatment seeking population
Enrolled RCTpopulation
0
True MADRS Score
Depressed population
Sachs, 2001
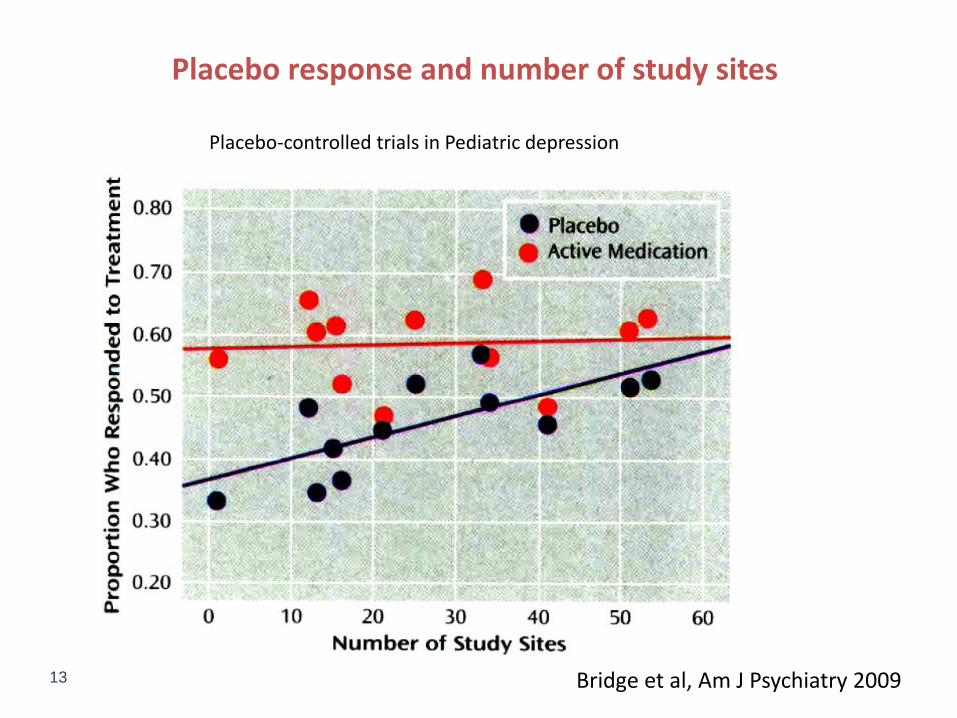
13 Bridge et al, Am J Psychiatry 2009
Placebo response and number of study sites
Placebo-controlled trials in Pediatric depression
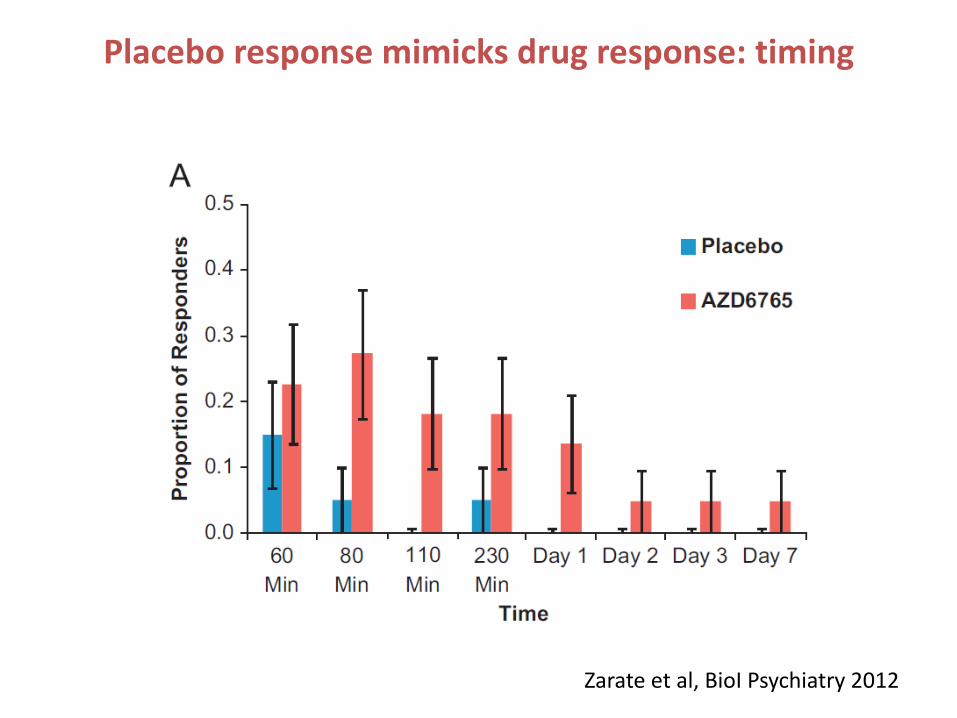
Zarate et al, BioI Psychiatry 2012
Placebo response mimicks drug response: timing
40 50 60 70 80 90
100
5
0
5-
10-
15-
20-
25-
30-
35-
40-
45-
body weight (kg)
HA
MD
17-
score
change a
t th
e e
nd p
oin
t
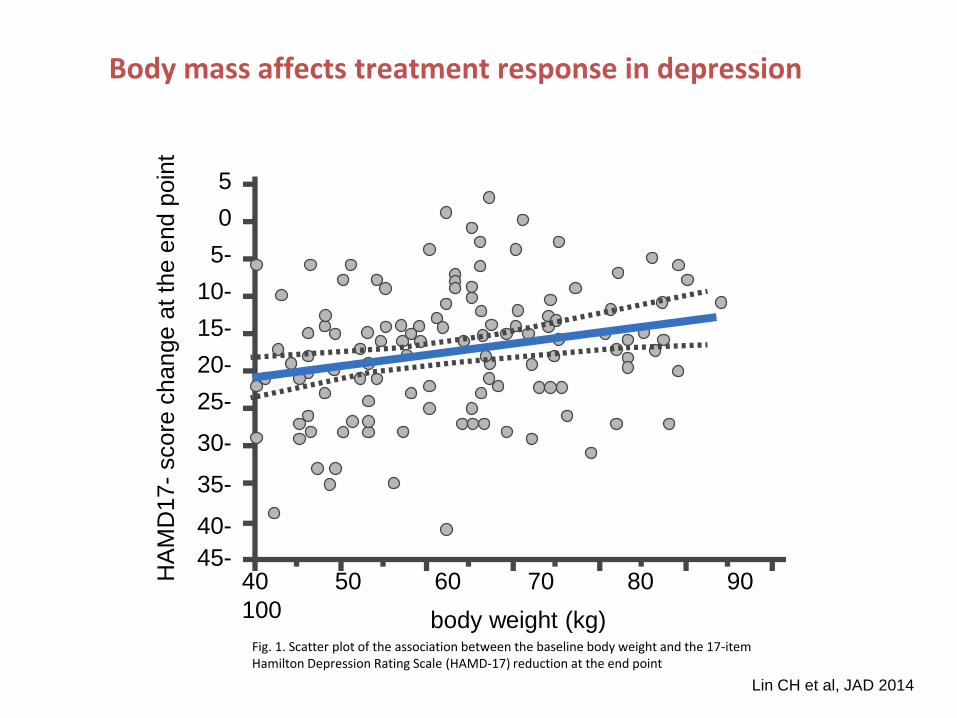
Fig. 1. Scatter plot of the association between the baseline body weight and the 17-item Hamilton Depression Rating Scale (HAMD-17) reduction at the end point
Lin CH et al, JAD 2014
Body mass affects treatment response in depression
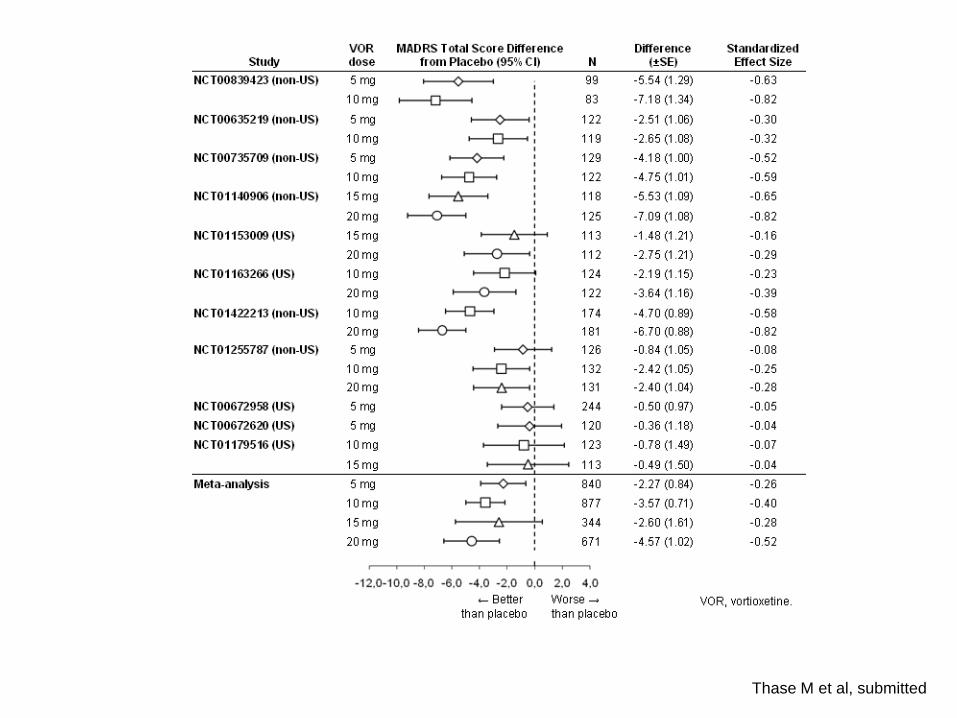
Thase M et al, submitted
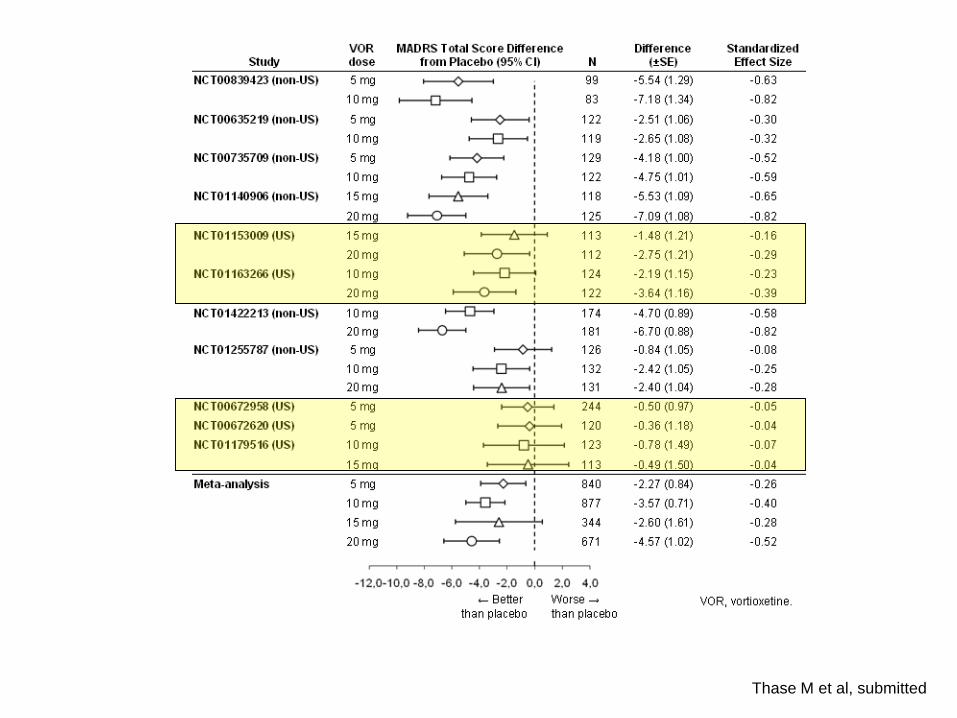
Thase M et al, submitted
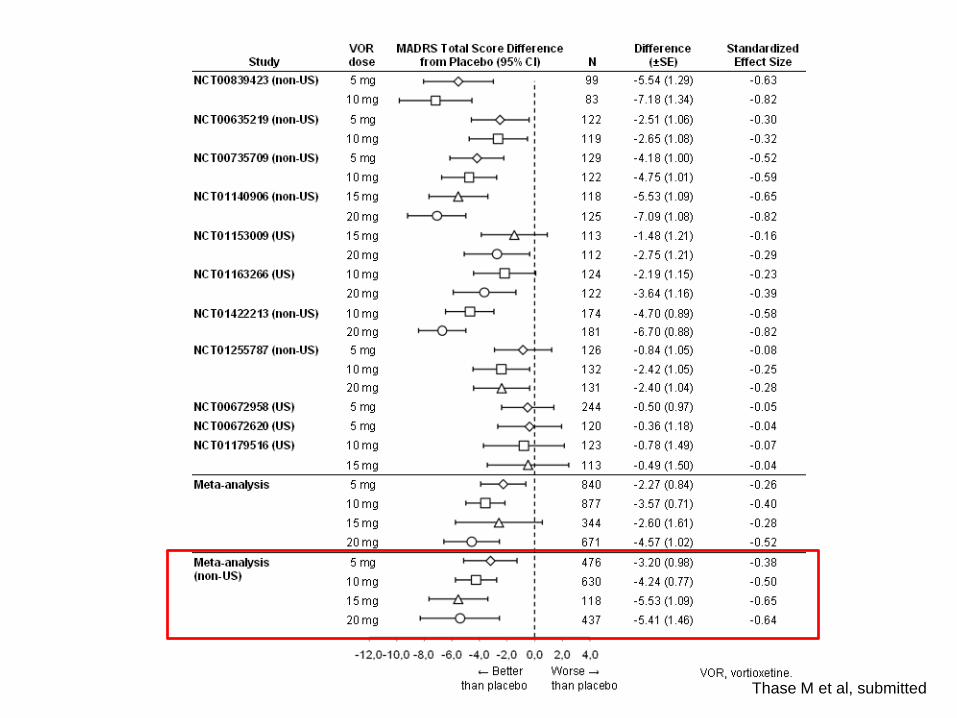
Thase M et al, submitted

Antoni BenabarreC. Mar Bonnín
Francesc ColomMercè Comes
Marina GarrigaJosé M. Goikolea
Íria GrandeDiego Hidalgo-Mazzei
Esther JiménezAnabel Martínez-Arán
Andrea MurruIsabella Pacchiarotti
Rosa PalausDina Popovic
Maria ReinaresJose Sánchez-Moreno
Brisa SoléCarla TorrentImma TorresMarc ValentíCristina VaroEduard Vieta