


Languages
Pages
Legal


UNCLASSIFIED
UNCLASSIFIED
PILOT FIELD DEMONSTRATION OF ALTERNATIVE FUELS IN FORCE PROJECTION PETROLEUM AND
WATER DISTRIBUTION EQUIPMENT
INTERIM REPORT TFLRF No. 449
by
Adam C. Brandt Edwin A. Frame
Robert R. Warden Peter J. Wostarek
U.S. Army TARDEC Fuels and Lubricants Research Facility
Southwest Research Institute® (SwRI
®)
San Antonio, TX
for
Mr. Eric Sattler U.S. Army TARDEC
Force Projection Technologies Warren, Michigan
Contract No. W56HZV-09-C-0100 (WD21)
UNCLASSIFIED: Distribution Statement A. Approved for public release
September 2014
ADA

UNCLASSIFIED
UNCLASSIFIED
Disclaimers Reference herein to any specific commercial company, product, process, or service by trade name, trademark, manufacturer, or otherwise, does not necessarily constitute or imply its endorsement, recommendation, or favoring by the United States Government or the Department of the Army (DoA). The opinions of the authors expressed herein do not necessarily state or reflect those of the United States Government or the DoA, and shall not be used for advertising or product endorsement purposes.
Contracted Author As the author(s) is(are) not a Government employee(s), this document was only reviewed for export controls, and improper Army association or emblem usage considerations. All other legal considerations are the responsibility of the author and his/her/their employer(s).
DTIC Availability Notice Qualified requestors may obtain copies of this report from the Defense Technical Information Center, Attn: DTIC-OCC, 8725 John J. Kingman Road, Suite 0944, Fort Belvoir, Virginia 22060-6218.
Disposition Instructions Destroy this report when no longer needed. Do not return it to the originator.

UNCLASSIFIED
UNCLASSIFIED
PILOT FIELD DEMONSTRATION OF ALTERNATIVE FUELS IN FORCE PROJECTION PETROLEUM AND
WATER DISTRIBUTION EQUIPMENT
INTERIM REPORT TFLRF No. 449
by
Adam C. Brandt Edwin A. Frame
Robert R. Warden Peter J. Wostarek
U.S. Army TARDEC Fuels and Lubricants Research Facility Southwest Research Institute
® (SwRI
®)
San Antonio, TX
for
Mr. Eric Sattler U.S. Army TARDEC
Force Projection Technologies Warren, Michigan
Contract No. W56HZV-09-C-0100 (WD21) SwRI® Project No. 08.14734.21.(301-304)
UNCLASSIFIED: Distribution Statement A. Approved for public release
September 2014
Approved by:
Gary B. Bessee, Director U.S. Army TARDEC Fuels and Lubricants
Research Facility (SwRI®)

UNCLASSIFIED
UNCLASSIFIED
iv
REPORT DOCUMENTATION PAGE Form Approved
OMB No. 0704-0188 Public reporting burden for this collection of information is estimated to average 1 hour per response, including the time for reviewing instructions, searching existing data sources, gathering and maintaining the data needed, and completing and reviewing this collection of information. Send comments regarding this burden estimate or any other aspect of this collection of information, including suggestions for reducing this burden to Department of Defense, Washington Headquarters Services, Directorate for Information Operations and Reports (0704-0188), 1215 Jefferson Davis Highway, Suite 1204, Arlington, VA 22202-4302. Respondents should be aware that notwithstanding any other provision of law, no person shall be subject to any penalty for failing to comply with a collection of information if it does not display a currently valid OMB control number. PLEASE DO NOT RETURN YOUR FORM TO THE ABOVE ADDRESS.
1. REPORT DATE (DD-MM-YYYY)
09/04/2014 2. REPORT TYPE
Interim Report 3. DATES COVERED (From - To)
September 2012 – September 2014 4. TITLE AND SUBTITLE
Pilot Field Demonstration of Alternative Fuels in Force Projection Petroleum and Water
Distribution Equipment
5a. CONTRACT NUMBER
W56HZV-09-C-0100
5b. GRANT NUMBER
5c. PROGRAM ELEMENT NUMBER
6. AUTHOR(S)
Brandt, Adam C.; Frame, Edwin A.; Warden, Robert R; Wostarek, Peter J. 5d. PROJECT NUMBER
SwRI 08.14734.21.(301-304)
5e. TASK NUMBER
WD 21
5f. WORK UNIT NUMBER
7. PERFORMING ORGANIZATION NAME(S) AND ADDRESS(ES) 8. PERFORMING ORGANIZATION REPORT NUMBER
U.S. Army TARDEC Fuels and Lubricants Research Facility (SwRI®)
Southwest Research Institute®
P.O. Drawer 28510
San Antonio, TX 78228-0510
TFLRF No. 449
9. SPONSORING / MONITORING AGENCY NAME(S) AND ADDRESS(ES) 10. SPONSOR/MONITOR’S ACRONYM(S)
U.S. Army RDECOM
U.S. Army TARDEC 11. SPONSOR/MONITOR’S REPORT
Force Projection Technologies NUMBER(S)
Warren, MI 48397-5000
12. DISTRIBUTION / AVAILABILITY STATEMENT
UNCLASSIFIED: Dist A
Approved for public release; distribution unlimited 13. SUPPLEMENTARY NOTES
14. ABSTRACT
To evaluate the potential impact of Army wide use of a volumetric 50/50 blend of JP-8 and Fischer Tropsch derived synthetic paraffinic kerosene (FT-
SPK), three petroleum and water distribution systems were identified for compatibility testing by the U.S. Army Tank Automotive Research Development
and Engineering Center (TARDEC). They included two Force Projection Technology (FPT) diesel driven pumping assemblies of 350 and 600 gallons per
minute (GPM), and the Advanced Aviation Forward Area Refueling System (AAFARS). The 350 and 600 GPM units were tested by recirculating water in
a 20,000 gallon collapsible tank, while the AAFARS system was evaluated recirculating the FT-SPK/JP-8 fuel blend throughout the entire AAFARS
modular fuel distribution system. Both were evaluated in a 400 hr test cycle at rated conditions, and both were operated successfully on the FT-SPK/JP-8
fuel blend, without experiencing any engine related performance issues or material compatibility problems.
15. SUBJECT TERMS
Fischer Tropsch, synthetic fuel, alternative fuel, FT-SPK, synthetic paraffinic kerosene, Force Projection Technology, Advanced Forward
Area Refueling System
16. SECURITY CLASSIFICATION OF: 17. LIMITATION OF ABSTRACT
18. NUMBER OF PAGES
19a. NAME OF RESPONSIBLE PERSON
a. REPORT
Unclassified
b. ABSTRACT
Unclassified
c. THIS PAGE
Unclassified
Unclassified
43
19b. TELEPHONE NUMBER (include area code)
Standard Form 298 (Rev. 8-98) Prescribed by ANSI Std. Z39.18

UNCLASSIFIED
UNCLASSIFIED
v
EXECUTIVE SUMMARY
To evaluate the potential impact of Army wide use of a volumetric 50/50 blend of JP-8 and
Fischer Tropsch derived synthetic paraffinic kerosene (FT-SPK), three petroleum and water
distribution systems were identified for compatibility testing by the U.S. Army Tank Automotive
Research Development and Engineering Center (TARDEC). They included two Force Projection
Technology (FPT) diesel driven pumping assemblies of 350 and 600 gallons per minute (GPM),
and the Advanced Aviation Forward Area Refueling System (AAFARS). Both consist of a small
compression ignition engine driven pumping assembly which was operated for 400 hours under
rated load conditions to assess the performance and compatibility of the systems with the use of
alternative fuels. The 350 and 600 GPM units were tested by recirculating water in a 20,000
gallon collapsible tank, while the AAFARS system was evaluated recirculating the FT-SPK/JP-8
fuel blend throughout the entire AAFARS modular fuel distribution system.
Both systems were successfully operated using the FT-SPK/JP-8 fuel blend over their respective
400 hr tests. Each system yielded satisfactory performance when operated on the FT-SPK/JP-8
test fuel, and each system was able to be operated to their full capacity as dictated by the test
facility and hardware it was evaluated with. No fuel related engine performance, or material
compatibility issues were noted with hardware components that came into contact with the test
fuel itself (i.e., fuel engine supply and return lines, AAFARS suction/discharge lines and
fittings). Minor leaks were experienced from various fittings during the AAFARS testing
portion, but were ultimately attributed to mechanically damaged o-rings and fittings prior to
testing, not as a result of material compatibility of the FT-SPK/JP-8 fuel blend.
It is expected that these two systems, assuming proper starting function, can be operated on FT-
SPK blends by the Army in the future without experiencing any major compatibility problems or
performance shortcomings.

UNCLASSIFIED
UNCLASSIFIED
vi
FOREWORD/ACKNOWLEDGMENTS
The U.S. Army TARDEC Fuel and Lubricants Research Facility (TFLRF) located at Southwest
Research Institute (SwRI), San Antonio, Texas, performed this work during the period of
September 2012 through August 2014 under Contract No. W56HZV-09-C-0100. The U.S. Army
Tank Automotive RD&E Center, Force Projection Technologies, Warren, Michigan
administered the project. Mr. Eric Sattler (RDTA-SIE-ES-FPT-FLT) served as the TARDEC
contracting officer’s technical representative, and the project technical monitor.
The authors would like to acknowledge the contribution of the TFLRF technical and
administrative support staff.

UNCLASSIFIED
UNCLASSIFIED
vii
TABLE OF CONTENTS
Section Page
EXECUTIVE SUMMARY .............................................................................................................v FOREWORD/ACKNOWLEDGMENTS ...................................................................................... vi LIST OF TABLES ....................................................................................................................... viii
LIST OF FIGURES ..................................................................................................................... viii ACRONYMS AND ABBREVIATIONS ...................................................................................... ix 1.0 Background and Introduction .................................................................................................1 2.0 Synthetic Fuel Blend ...............................................................................................................2 3.0 Force Projection Technology Pump-Engine Testing ..............................................................3
3.1 TEST FACILITY ...........................................................................................................3
3.1.1 Recirculation Loop.............................................................................................3
3.1.2 Pump-Engine Location (Environmental Conditions) ........................................5
3.1.3 Instrumentation ..................................................................................................7
3.2 600 GPM PUMP ASSEMBLY ......................................................................................7
3.2.1 Installation and Set Up .......................................................................................8
3.2.2 600 GPM Test Results .......................................................................................9
3.3 350 GPM PUMP ASSEMBLY ....................................................................................16
3.3.1 Installation and Set Up .....................................................................................16 3.3.2 350 GPM Test Results .....................................................................................18
4.0 Advanced Aviation Forward Area Refuleing System TESTING .........................................23
4.1 TEST FACILITY .........................................................................................................24
4.2 INSTALLATION AND SET UP.................................................................................25
4.3 AAFARS TEST RESULTS .........................................................................................28 4.4 ENGINE DRIVEN PUMP ASSEMBLY TESTING SUMMARY .............................33
5.0 Conclusion ...........................................................................................................................33

UNCLASSIFIED
UNCLASSIFIED
viii
LIST OF TABLES
Table Page
Table 1 . AF7117 Test Fuel Chemical & Physical Analysis ......................................................... 2 Table 2 . 600 GPM Operational Summary .................................................................................... 9 Table 3 . 350 GPM Operational Summary .................................................................................. 18 Table 4 . AAFARS Operating Condition Summary .................................................................... 29
LIST OF FIGURES
Figure Page
Figure 1 . FPT pump-engine recirculation loop ............................................................................. 4
Figure 2 . 20,000 gallon collapsible recirculation tank (bladder) .................................................. 4 Figure 3 . FPT pump-engine discharge flow meter and pressure safety switch ............................ 5 Figure 4 . FPT testing enclosure .................................................................................................... 6
Figure 5 . FPT exhaust discharge from enclosed testing area ........................................................ 6 Figure 6 . Data Acquisition and Control System ........................................................................... 7
Figure 7 . 600 GPM Instrumentation Locations ............................................................................ 8 Figure 8 . 600 GPM Engine Speed .............................................................................................. 10 Figure 9 . 600 GPM Fuel Temperature ........................................................................................ 11
Figure 10 . 600 GPM Intake Air Temperature ............................................................................. 12 Figure 11 . 600 GPM Pump Water Flow ..................................................................................... 13
Figure 12 . 600 GPM Pump Inlet Pressure .................................................................................. 14 Figure 13 . 600 GPM Pump Outlet Pressure ............................................................................... 14
Figure 14 . 600 GPM Hose Inlet Pressure ................................................................................... 15 Figure 15 . 350 GPM Instrumentation Locations ........................................................................ 17
Figure 16 . 350 GPM Fuel Temperature ...................................................................................... 19 Figure 17 . 350 GPM Intake Air Temperature ............................................................................. 20 Figure 18 . 350 GPM Pump Water Flow ..................................................................................... 21
Figure 19 . 350 GPM Pump Inlet Pressure .................................................................................. 21 Figure 20 . 350 GPM Pump Outlet Pressure ............................................................................... 22
Figure 21 . 350 GPM Hose Inlet Pressure ................................................................................... 23 Figure 22 . AAFARS final test set-up .......................................................................................... 26 Figure 23 . AAFARS test configuration diagram ........................................................................ 27 Figure 24 . AAFARS system fuel inlet temperature .................................................................... 29
Figure 25 . AAFARS system ambient air temperature ................................................................ 30 Figure 26 . AAFARS system overall fuel flow rate..................................................................... 31 Figure 27 . AAFARS system pump inlet and discharge pressure................................................ 32
Figure 28 . AAFARS 500 gallon fuel drum pressure .................................................................. 32

UNCLASSIFIED
UNCLASSIFIED
ix
ACRONYMS AND ABBREVIATIONS
AAFARS – Advanced Aviation Forward Area Refueling System
BTU – British Thermal Unit
°C – Degrees Celsius
cSt - Centistoke
°F – Degrees Fahrenheit
FIA – Fluorescent Indicator Absorption
FPT – Force Projection Technology
FT – Fischer Tropsch
FT-SPK – Fischer Tropsch Synthetic Paraffinic Kerosene
g - Gram
GPM – Gallon Per Minute
hr - Hours
JP-8 – Jet Propellant 8
lb - Pound
mL – Milliliters
mm - Millimeters
NEMA – National Electrical Manufacturers Association
psi – Pounds per Square Inch
psiA – Pounds per Square Inch Absolute
rpm – Revolutions per Minute
SAE – Society of Automotive Engineers
SwRI – Southwest Research Institute
TARDEC – Tank Automotive Research Development and Engineering Center
TFLRF – TARDEC Fuels and Lubricants Research Facility
vol% - Volume Percent
wt% - Weight Percent
µm - Micrometers

UNCLASSIFIED
UNCLASSIFIED
1
1.0 BACKGROUND AND INTRODUCTION
The future use of alternative fuels by the U.S. Army requires extensive compatibility and impact
checks across a wide range of equipment. One critical area of that is the petroleum product and
water distribution equipment. Without a knowledge of how these components will perform on
alternative fuels, issues could arise in the transport and distribution of fuel for military
operations, and the security of water supply used on the battle field.
To evaluate the potential impact of Army wide use of a volumetric 50/50 blend of JP-8 and
Fischer Tropsch derived synthetic paraffinic kerosene (FT-SPK), three unique petroleum and
water distribution systems were identified for compatibility testing by the U.S. Army Tank
Automotive Research Development and Engineering Center (TARDEC). These systems were
specifically chosen due to their fueling and cooling systems that are unique compared to other
military ground equipment systems that have been tested during past research programs. The first
two systems identified were Force Projection Technology (FPT) diesel-driven pumping
assemblies of 350 and 600 gallons per minute (GPM) capacity. These systems consisted of two
different capacity centrifugal pump assemblies direct driven by a small displacement
compression ignition engine. These systems were operated on the FT-SPK/JP-8 fuel blend, and
utilized water as the working fluid to load the pumping assembly. The third system identified
was the Advanced Aviation Forward Area Refueling System (AAFARS). Similar to the FPT
systems, it consisted of a small compression ignition engine driven pumping assembly, with the
entire system being made of numerous hoses, fittings, distribution nozzles, and storage drums
which make up the “modular” petroleum distribution system. During its testing, not only was the
engine itself operated on the FT-SPK/JP-8 blend, but the blended fuel was also used as the
working fluid to load the pumping assembly, being pumped through all the various modular
components to assess material compatibility with the blended fuel. Each of these systems were
operated for 400 hours at elevated temperature conditions to challenge the fuel injection system
and distribution equipment that came in contact with the blended fuel.

UNCLASSIFIED
UNCLASSIFIED
2
All testing was completed by the U.S. Army TARDEC Fuels and Lubricants Research Facility
(TFLRF), located at Southwest Research Institute (SwRI) in San Antonio, TX. All tested
hardware was provided by the U.S. Army TARDEC Force Projection Technology Team (FPT).
2.0 SYNTHETIC FUEL BLEND
The fuel blend tested in the FPT and AAFARS systems was a 50/50 volumetric blend of FT-SPK
and a commercially sourced JP-8. The fuel blend contained 22.5 mg/L of DCI-4A CI/LI. Table 1
below shows select chemical and physical analysis results of the fuel that was used to evaluate
each system. Specific notation was included for key properties for JP-8 in general, as well as the
key resulting properties of the finished blend of FT-SPK/JP-8 as per MIL-DTL-83133H. As seen
in the table, the finished fuel did meet the minimum requirements for aromatic content,
distillation range, and derived cetane number as called out by the specification. The tested fuel is
a good representation of what could be expected from a 50/50 fuel blend of FT-SPK/JP-8 in real
world operation.
Table 1. AF7117 Test Fuel Chemical & Physical Analysis
Property Test MethodTEST FUEL AF-
7117
FT-SPK Blend
Specific
(MIL-DTL-83133H)
Specifications
JP8
(MIL-DTL-83133H)
Specifications
Density, 15C (g/mL) D4052 0.7741 0.775, min
Kinematic Viscosity, 40C (cSt) D445 1.23
Sulfur (wt%) D2622 0.0044
Hydrocarbons by FIA D1319
Aromatic (vol%) 9.3 8, min 25, max
Olefin (vol%) 1
Saturates (vol%) 89.7
Heat of Combustion D240
GROSS (BTU/lb) 20,005
NET (BTU/lb) 18,695 18,400, min
Flash Point (°F) D93 119.3
(°C) 48.5 38, min
SLBOCLE (g) D6078 1900
BOCLE (mm) D5001 0.55
HFRR (µm) D6079 684
Distillation (°C) D86
IBP 161.4
10 169.9 205, max
20 172.8
50 184.9
90 219.1
FBP 239 300, max
T90-T10 49.2 40, min
T50-T10 15.0 15, min
Cetane Number D613 48.8
Calculated Cetane D976 46.6
IQT D6890 48.8 40, min

UNCLASSIFIED
UNCLASSIFIED
3
3.0 FORCE PROJECTION TECHNOLOGY PUMP-ENGINE TESTING
The first systems tested were the FPT pump-engine assemblies. This section covers the FPT
testing, and includes an overview of the test facility and equipment constructed and utilized to
operate both of the systems, as well as individual discussions of results for each unit.
3.1 TEST FACILITY
A dedicated test area was prepared at TFRLF for the evaluation of the FPT pump-engine
assemblies. Due to the large volume of fluid being moved by both pumps, the testing area
selected was located at the rear side of an onsite covered storage building that contained a
partially enclosed concrete slab, and was positioned next to a natural drainage area for the
surrounding terrain. This allowed for location of the pump-engine module to be protected from
any extreme weather conditions, while the adjacent drainage area would be capable of handling
excess water in the unlikely event of a major leak, as both systems tested utilized a partially
filled 20,000 gallon bladder of water as the primary recirculation reservoir. Additional details of
each subsystem is discussed below.
3.1.1 Recirculation Loop
Both the 600 GPM and 350 GPM pump assemblies utilized the same recirculation loop to apply
loading to the pump-engine assembly for testing. This loop consisted of a partially filled 20,000
gallon collapsible tank (i.e., bladder) of water, and 4″ supply and return hoses that interfaced
between the tank to the pump-engine assembly. A basic line diagram of the recirculation loop is
shown in Figure 1.

UNCLASSIFIED
UNCLASSIFIED
4
Figure 1. FPT pump-engine recirculation loop
Due to an uneven grade, the bladder was surrounded with large concrete blocks to prevent any
potential movement of the tank that could result in damage to it or the nearby driveway. Figure 2
shows a photo of the 20,000 gallon tank and the makeshift retaining wall. Note the supply and
return lines attached at the opposite ends of the tank (supply shown right, return shown far left).
Figure 2. 20,000 gallon collapsible recirculation tank (bladder)

UNCLASSIFIED
UNCLASSIFIED
5
Pressure safety switches were installed at various locations on the discharge side of the
recirculation loop to provide the ability to safely shutdown pump-engines in the event of a major
leak. An example of this can be seen downstream of the high-volume flow meter piping shown
below in Figure 3 (safety switch circled in red).
Figure 3. FPT pump-engine discharge flow meter and pressure safety switch
3.1.2 Pump-Engine Location (Environmental Conditions)
Desired intake air temperature for testing was between 100 to 120 °F, to replicate conditions
expected in desert type operation. To accomplish this, waste engine heat from the exhaust and
engine cooling discharge was retained in the immediate testing area by enclosing the openings of
the covered structure immediately surrounding the test rig. One side of the enclosure was formed
by the main storage building wall which provided an impervious barrier to airflow. The opposite
wall consisted of pre-existing sheet metal panels with approximately two foot air gaps at the top
and bottom forming a natural breeze way. During testing the top gap was covered using heavy
canvas tarps to prevent air flow, but the bottom gap was left open to allow for the passage of the
4″ supply and discharge water hoses at the pump-engine. The remaining two sides of the test area
consisted of canvas covered gates at one end that enabled the large equipment to be moved in
and out of the testing area, while the other utilized the same heavy canvas tarps as curtains to

UNCLASSIFIED
UNCLASSIFIED
6
retain the heat while still allowing for technician passage during testing. The data acquisition
console was positioned outside of the immediate testing area. This arrangement can be seen in
Figure 4.
Figure 4. FPT testing enclosure
The exhaust of each engine was connected to flexible exhaust tubing and routed safely outside of
the enclosed test area. This allowed for heat to be emitted into the immediate testing area by the
pump-engine’s exhaust manifold and piping, while preventing the build-up of toxic gases within
the test area. The exhaust discharge for the test area can be seen below in Figure 5.
Figure 5. FPT exhaust discharge from enclosed testing area

UNCLASSIFIED
UNCLASSIFIED
7
3.1.3 Instrumentation
A mobile data acquisition and control system was utilized to operate the FPT pump-engine
evaluation. This allowed for real-time monitoring and data collection over the entire 400 hr test,
and added the capability of installing additional mechanical safeties to protect the test hardware,
recirculation loop, and personnel. Data acquisition and control was provided by PRISM, an
SwRI in-house developed software suite used throughout TFLRF for test cell data acquisition
and control purposes. The mobile cart used can be seen Figure 6. It consists of the PRISM
operator interface (i.e., main computer), the machine interface computer (additional DAQ
computer), and all necessary data acquisition hardware (modules, power supplies, back planes,
etc). All components were mounted inside a weatherproof mobile NEMA-4 enclosure for all
weather outdoor operation.
Figure 6. Data Acquisition and Control System
3.2 600 GPM PUMP ASSEMBLY
The following section includes discussion and results related to the testing of the 600 GPM
pump-engine assembly.

UNCLASSIFIED
UNCLASSIFIED
8
3.2.1 Installation and Set Up
The 600 GPM pump-engine was tested first ensuring that the recirculation loop was capable of
the highest nominal flow rate, as the smaller 350 GPM pump-engine was expected to use the
same basic test arrangement. (It is worth noting that the actual 600 GPM rating of the first pump-
engine tested was not able to be achieved due to suction side restrictions inherent of the bladder
and supply line sizes. Despite that, the 600 GPM label is still used in reporting to differentiate
between the two FPT pump-engines tested.) The 600 GPM pump-engine was placed into the
testing area and connected to the recirculation loop using the previously mentioned 4″ supply
and discharge hoses. Instrumentation installed for testing included engine speed, pump inlet
pressure, pump discharge pressure, water flow rate, and a variety of temperatures to monitor the
entire system. Select locations for key instrumentation is shown in Figure 7.
Pump Inlet Temp/Pressure Pump Discharge Temp/Pressure
Hose Inlet Temp/Pressure Water Flow Rate
Figure 7. 600 GPM Instrumentation Locations

UNCLASSIFIED
UNCLASSIFIED
9
Prior to testing, fuel and oil filters on the 600 GPM pump unit were replaced, and the engine was
charged using MIL-PRF-2104H SAE 15W-40 oil. Once complete, the pump and lines were
primed with water, and the 600 GPM pump engine test setup was operated to conduct a brief
shake-down to assess the flow loop performance, and identify any problems prior to testing.
Apart from the previously mentioned suction side flow restriction limiting overall flow rate, no
operational issues were noted, and testing was initiated.
3.2.2 600 GPM Test Results
Over the course of the 400 hr test, the pump-engine was shut down once daily to check the oil
level and make any additions as necessary to maintain a safe oil sump level. Aside from this brief
shutdown and daily checks, the test successfully ran the total 400 hr test duration continuously.
A summary of the operational data recorded during testing is provided in Table 2.
Table 2. 600 GPM Operational Summary
Parameter Average Minimum Maximum Standard Deviation
Median Value
Engine RPM 2302 2211 2545 7 2302
Water Flow, GPM 201 121 330 23 192
Pump Outlet Pressure, psi 138.5 122.0 144.4 0.9 138.5
Hose Inlet Pressure, psi 8.1 3.9 19.3 1.8 7.5
Pump Inlet Pressure, psiA 12.7 8.3 13.7 0.8 12.9
Fuel Temperature, ° F 102.2 95.7 115.2 3.3 101.6
Intake Air, °F 99.9 68.8 121.9 8.1 100.4
Water at Pump Inlet, °F 126.5 75.3 136.8 10.7 129.6
Water at Pump Discharge, °F 127.2 75.7 138.1 10.7 130.2
Water at Hose Inlet, °F 127.7 76.0 138.4 10.7 130.8
Engine Oil Sump, °F 214.4 202.2 230.5 4.9 213.4
Air Outside Test Area, °F 65.1 46.5 87.9 10.0 64.8

UNCLASSIFIED
UNCLASSIFIED
10
The speed of the pump-engine during testing is shown in Figure 8. This speed was controlled by
the pump rig manual throttle lever, which was kept at the full open position throughout testing.
Momentary spikes in the plot were a result of startup and shutdown, when changing back
pressure changed the loading on the pump outlet.
Figure 8. 600 GPM Engine Speed
In addition to the elevated air temperature, the fuel inlet temperature was desired to be
maintained above 100 °F minimum, again to replicate desert type operation. The fuel inlet
temperature profile over the course of the 400 hr test is shown in Figure 9.
0
500
1000
1500
2000
2500
3000
0 50 100 150 200 250 300 350 400
Engi
ne
Sp
ee
d, R
PM
Test Hour
600 GPM Engine Speed

UNCLASSIFIED
UNCLASSIFIED
11
Figure 9. 600 GPM Fuel Temperature
As seen in the plot, there were a few instances of the fuel temperature dropping below the
desired level. This was due to night time ambient temperatures cooling rapidly as a result of low
humidity levels. Since overall fuel temperature control was performed through the use of a hot
water bath, there was some lag time in the controller response to temperature change, resulting in
the brief dips below 100 °F. This was also the cause of overshoots as the controller attempted to
correct for these temperature changes. As previously shown in Table 2, outside ambient air
temperatures experienced during testing ranged from approximately 90 °F, and down to an
unseasonably cool 46 °F. This was due to a cold weather front that moved through the local area
during testing. Every attempt was made to mitigate these fluctuations, but some dips outside of
desired ranges were unavoidable. Despite this, the majority of operation was maintained at or
above the 100 °F level.
The impact of the cooling effect of ambient air and wind from the cold front can also be seen in
the intake air temperature of the engine. There was extensive deviation from the desired
temperature of 100 °F, and the 24 -hour cyclical effect of day time heating and night time
cooling is shown in Figure 10. Many adjustments were made to the test rig enclosure to offset
0
20
40
60
80
100
120
140
0 50 100 150 200 250 300 350 400
Fue
l Te
mp
era
ture
, De
g F
Test Hour
600 GPM Fuel Temperature

UNCLASSIFIED
UNCLASSIFIED
12
these changes. Although not 100% successful, intake air temperature was maintained as high as
possible, and it did not see as large of a temperature swing as observed in the ambient
temperature outside the surrounding test area.
Figure 10. 600 GPM Intake Air Temperature
The overall water flow rate of the FPT pump-engine system is shown in Figure 11. The flow rate
gradually changed over the course of the test as the pump output restriction was adjusted and as
water temperatures stabilized in the entire system. As the rig was brought down for oil level
checks, the position of the back pressure valve was manually adjusted to a slightly different
position when brought back up to rated conditions. This was purely a function of operator
variability. Like the pump speed, the spikes visible at various points are due to the shutdown
process for oil level checks.
0
20
40
60
80
100
120
140
0 50 100 150 200 250 300 350 400
Air
Te
mp
era
ture
, De
g F
Test Hour
600 GPM Intake Air Temperature

UNCLASSIFIED
UNCLASSIFIED
13
Figure 11. 600 GPM Pump Water Flow
While a high flow rate was most desirable, the initial 300 GPM rate was found to not be
sustainable due to instability in conditions at the pump inlet. As previously mentioned, a single
4″ line was used for suction due to the limited fittings available on the water bladder. This is less
than the 600 GPM Technical Manual recommendation of a single 6″ hose, or two 4″ hoses for
suction side supply, thus resulting in suction side limitations (evident by engine speed
fluctuations as suction side pressure went too low). After adjustment, a flow rate below 250
GPM was found to result in a suction side pressure of above 10 psiA, and provided stable engine
operation. The remainder of the test was operated at that condition The resulting suction side
pressure is shown in Figure 12. It should be noted that this value is reported in absolute pressure
units.
0
50
100
150
200
250
300
350
0 50 100 150 200 250 300 350 400
Flo
w R
ate
, GP
M
Test Hour
600 GPM Pump Water Flow

UNCLASSIFIED
UNCLASSIFIED
14
Figure 12. 600 GPM Pump Inlet Pressure
Water pressure at the outlet of the pump was less dependent upon fluid flow rate. This is shown
in Figure 13. This pressure was measured prior to the backpressure valves on the discharge
manifold. Despite the inlet pressure variation with flow changes through the system, the outlet
pressure produced by the pump remained largely stable.
Figure 13. 600 GPM Pump Outlet Pressure
0
2
4
6
8
10
12
14
16
0 50 100 150 200 250 300 350 400
Wat
er
Pre
ssu
re, p
siA
Test Hour
600 GPM Pump Inlet Pressure
0
20
40
60
80
100
120
140
160
0 50 100 150 200 250 300 350 400
Wat
er
Pre
ssu
re, p
siG
Test Hour
600 GPM Pump Outlet Pressure
UNCLASSIFIED
UNCLASSIFIED
15
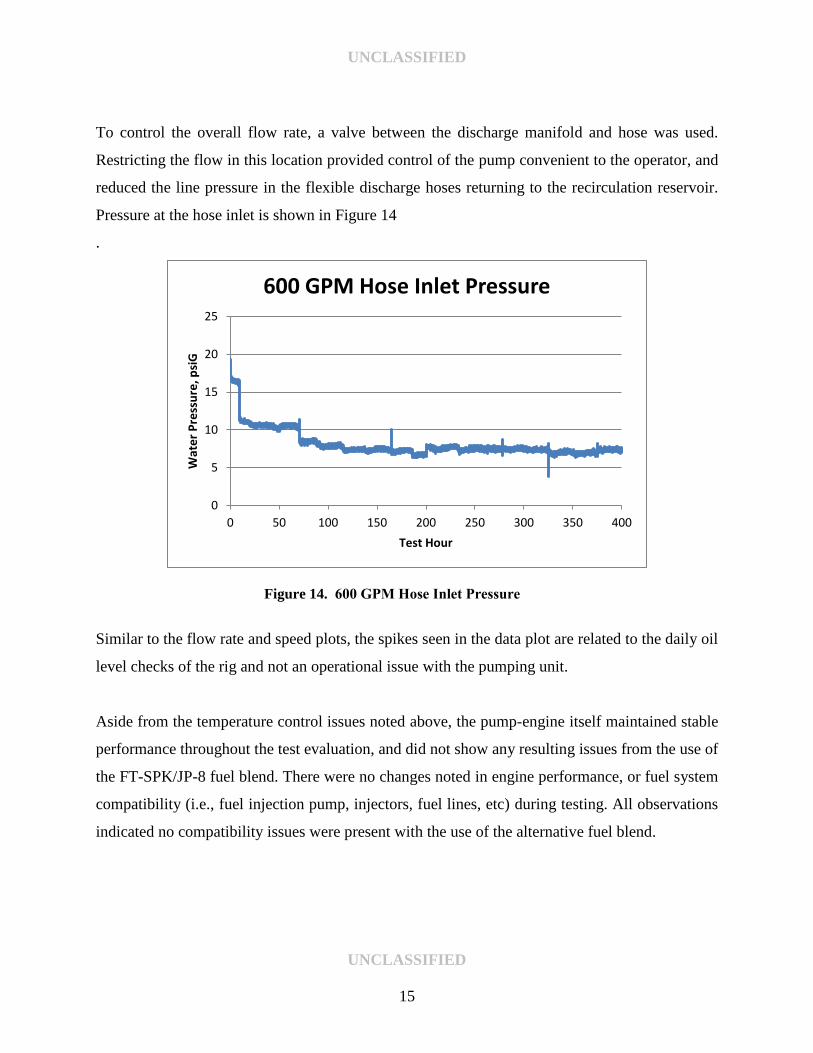
To control the overall flow rate, a valve between the discharge manifold and hose was used.
Restricting the flow in this location provided control of the pump convenient to the operator, and
reduced the line pressure in the flexible discharge hoses returning to the recirculation reservoir.
Pressure at the hose inlet is shown in Figure 14
.
Figure 14. 600 GPM Hose Inlet Pressure
Similar to the flow rate and speed plots, the spikes seen in the data plot are related to the daily oil
level checks of the rig and not an operational issue with the pumping unit.
Aside from the temperature control issues noted above, the pump-engine itself maintained stable
performance throughout the test evaluation, and did not show any resulting issues from the use of
the FT-SPK/JP-8 fuel blend. There were no changes noted in engine performance, or fuel system
compatibility (i.e., fuel injection pump, injectors, fuel lines, etc) during testing. All observations
indicated no compatibility issues were present with the use of the alternative fuel blend.
0
5
10
15
20
25
0 50 100 150 200 250 300 350 400
Wat
er
Pre
ssu
re, p
siG
Test Hour
600 GPM Hose Inlet Pressure

UNCLASSIFIED
UNCLASSIFIED
16
3.3 350 GPM PUMP ASSEMBLY
The following section discussion and results relate to the testing of the 350 GPM pump-engine
assembly.
3.3.1 Installation and Set Up
After completion of testing on the 600 GPM pump-engine, it was replaced with the 350 GPM
pump-engine in the existing test loop configuration. Similar instrumentation was installed to
monitor pump inlet pressure, pump discharge pressure, water flow rate, and various temperatures
to monitor testing. Specific locations for the key measurement parameters are shown in Figure
15.
In addition, an initial attempt was made to monitor engine speed to be consistent with the
600 GPM testing. This was attempted by using the pulsed output from the engine alternator
during operation. However, it was found that once the batteries were fully recharged after start-
up, the signal from the alternator became erratic and unusable for data acquisition. Other options
were considered, but it was ultimately decided to run without monitoring the actual engine speed,
as sufficient safeties were able to be programmed in from other measured parameters, and speed
measurement would have required physical modification to the 350 GPM pump-engine
assembly.
Consistent with testing completed on the 600 GPM pump-engine, both the fuel-water separator
and final fuel filters were replaced prior to testing, and the system was flushed with the FT-
SPK/JP-8 test fuel. The pump-engine oil filter was also replaced, and the system was charged
with MIL-PRF-2104H SAE 15W-40. The MIL-PRF-2104H engine oil was also flushed into the
intermediate shaft bearing as per startup instructions indicated on the 350 GPM pump-engine.
Once complete, the pump was primed with water and operated to conduct a brief shake-down
prior to testing.

UNCLASSIFIED
UNCLASSIFIED
17
Pump Inlet Temp/Pressure Pump Discharge Temp/Pressure
Hose Inlet Temp/Pressure Intake Air Temperature
Oil Sump Temperature Water Flow Rate
Figure 15. 350 GPM Instrumentation Locations
UNCLASSIFIED
UNCLASSIFIED
18
During this initial shakedown, it was found that the original 350 GPM unit sent from TARDEC
for testing had some internal issues which prevented pump operation for any duration of time.
After starting the engine, the engine immediately behaved as if it were under load. Any
additional load applied to the pump would then have a dramatic impact on the overall engine
speed of the assembly. Eventually this phenomenon would completely stall the engine, indicating
that there may have been an issue with a bearing or other component inside the pump or engine
creating excessive drag in the system. As a result, a second 350 GPM pump-engine was located
by TARDEC staff, and sent to TFLRF for testing from Ft. Campbell, KY. This pump-engine was
determined to be fully functional upon arrival, and the same preparation steps were taken on the
replacement system prior to test start-up. Once completed, proper operation was confirmed
through a second shakedown attempt, which was immediately followed by test initiation.
3.3.2 350 GPM Test Results
As with the 600 GPM pump-engine test, the 350 GPM pump-engine was shut down once per day
to check the oil level and make any additions necessary. Other than this daily check, the test ran
the full 400 hours continuously. Table 3 provides a summary of critical operational parameters
over the entire test duration.
Table 3. 350 GPM Operational Summary
Parameter Average Minimum Maximum Standard Deviation
Median Value
Water Flow, GPM 278 33 437 40 289
Pump Outlet Pressure, psi 122.3 50.9 129.2 5.4 123.6
Hose Inlet Pressure, psi 6.3 2.2 13.3 1.1 6.3
Pump Inlet Pressure, psiA 10.5 6.1 14.2 1.1 10.4
Fuel Temperature, ° F 94.9 76.7 106.7 4.7 95.3
Intake Air, °F 107.5 86.0 126.1 7.7 108.0
Water at Pump Inlet, °F 110.1 62.5 125.2 13.9 115.3
Water at Pump Discharge, °F 110.7 63.1 126.2 13.9 115.9
Water at Hose Inlet, °F 110.8 63.6 126.0 13.9 116.1
Engine Oil Sump, °F 219.2 181.6 225.8 2.9 219.7
Air Outside Test Area, °F 63.1 44.4 85.5 7.7 63.2

UNCLASSIFIED
UNCLASSIFIED
19
Like the 600 GPM test, the fuel inlet temperature was desired to be at 100 °F minimum. This
temperature response over the test duration is shown in Figure 16.
Figure 16. 350 GPM Fuel Temperature
Like the 600 GPM test, inlet fuel temperature again followed ambient air conditions which saw
similar extremes, and the average temperature over the 400 hr test fell short of the 100 °F target,
resulting in an average value of 94.9 °F. The low return fuel flow volume of this particular
engine impacted the heat build-up in the small day tank the rig was running off of, which
combined with ambient air temperature variation, ultimately prevented the desired control over
fuel inlet temperature, despite the water bath heating.
Intake air temperature was measured at the inlet to the air filter on the engine, and is shown in
Figure 17. The insulation around the pumping rig was able to keep the air temperature elevated
above 100 °F throughout the majority of testing. Air drawn past the radiator by the cooling fan
resulted in a high recirculation rate within the enclosure. This prevented gusts of wind from the
outside area from having as large an impact on intake temperature as seen in the 600 GPM
testing.
0
20
40
60
80
100
120
0 50 100 150 200 250 300 350 400
Fue
l Te
mp
era
ture
, De
g F
Test Hour
350 GPM Fuel Temperature

UNCLASSIFIED
UNCLASSIFIED
20
Figure 17. 350 GPM Intake Air Temperature
The flow rate of water through the system is shown in Figure 18. Unlike the 600 GPM testing,
the 350 GPM pump-engine was designed for operation using a single 4″ supply hose, and as a
result was able to flow closer to its specified nameplate volume. The changes in flow seen
throughout testing were again due to the rig being stopped daily for oil level checks, and
resulting backpressure valves reset to a different location upon resumption of testing. The rapid
increase in overall water flow seen after the first two daily checks was a result of a calculated
function of pumping power being added to the test program. This provided operator feedback
when starting the system so that valves could be adjusted to produce the highest possible
pumping load on the engine, ultimately providing more consistent setting of the equipment at the
desired operational conditions.
0
20
40
60
80
100
120
140
0 50 100 150 200 250 300 350 400
Air
Te
mp
era
ture
, De
g F
Test Hour
350 GPM Intake Air Temperature

UNCLASSIFIED
UNCLASSIFIED
21
Figure 18. 350 GPM Pump Water Flow
The suction side pressure is shown in Figure 19. The adjustment of flow rate and discharge
restriction can also be seen in this recorded data. As the overall flow of the system increased, a
larger suction was placed on the supply hose resulting in a lower inlet pressure.
Figure 19. 350 GPM Pump Inlet Pressure
0
50
100
150
200
250
300
350
0 100 200 300 400
Flo
w R
ate
, GP
M
Test Hour
350 GPM Water Flow
0
2
4
6
8
10
12
14
16
0 50 100 150 200 250 300 350 400
Wat
er
Pre
ssu
re, p
siA
Test Hour
350 GPM Pump Inlet Pressure
UNCLASSIFIED
UNCLASSIFIED
22
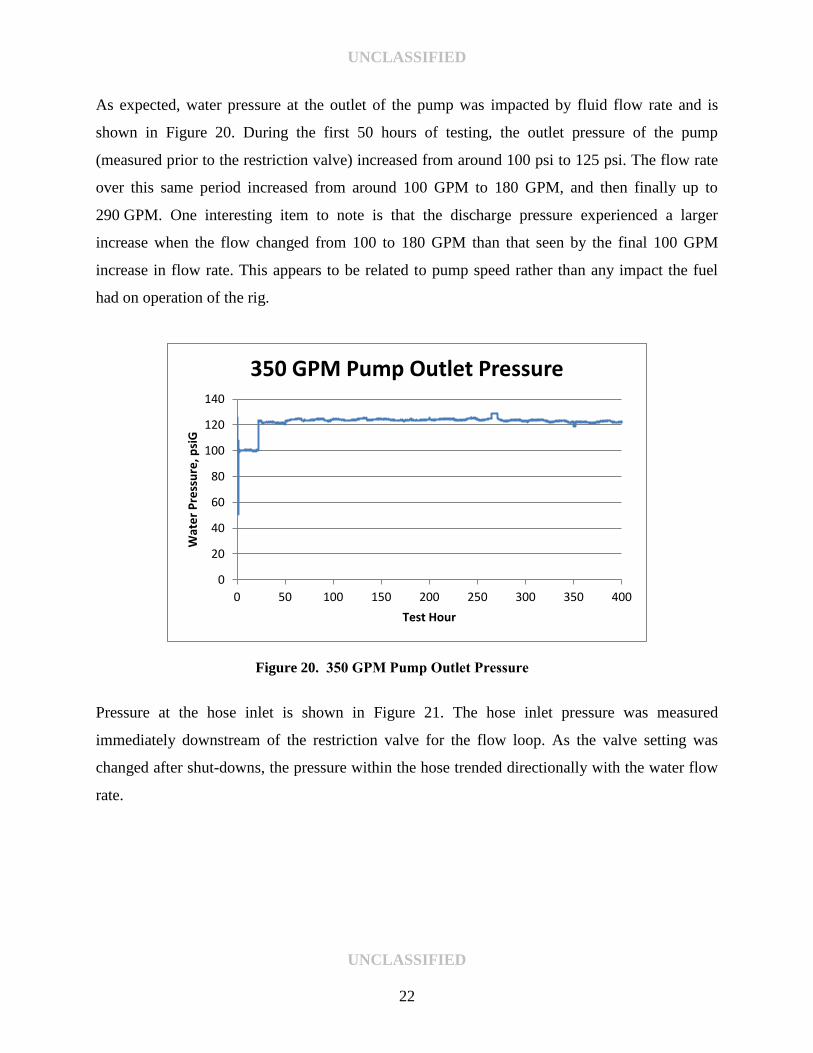
As expected, water pressure at the outlet of the pump was impacted by fluid flow rate and is
shown in Figure 20. During the first 50 hours of testing, the outlet pressure of the pump
(measured prior to the restriction valve) increased from around 100 psi to 125 psi. The flow rate
over this same period increased from around 100 GPM to 180 GPM, and then finally up to
290 GPM. One interesting item to note is that the discharge pressure experienced a larger
increase when the flow changed from 100 to 180 GPM than that seen by the final 100 GPM
increase in flow rate. This appears to be related to pump speed rather than any impact the fuel
had on operation of the rig.
Figure 20. 350 GPM Pump Outlet Pressure
Pressure at the hose inlet is shown in Figure 21. The hose inlet pressure was measured
immediately downstream of the restriction valve for the flow loop. As the valve setting was
changed after shut-downs, the pressure within the hose trended directionally with the water flow
rate.
0
20
40
60
80
100
120
140
0 50 100 150 200 250 300 350 400
Wat
er
Pre
ssu
re, p
siG
Test Hour
350 GPM Pump Outlet Pressure

UNCLASSIFIED
UNCLASSIFIED
23
Figure 21. 350 GPM Hose Inlet Pressure
As with the 600 GPM pump-engine testing, no operational issues in the 350 GPM pump-engine
were observed as a result of the use of the FT-SPK/JP-8 blend. The engine maintained a
satisfactory level of performance over the 400 hr test duration, and no compatibility issues were
noted with the pump-engine fuel system (i.e. fuel injection pump, injectors, fuel lines, filters,
etc), or output performance. All observations indicated no compatibility issues were present with
the use of the alternative fuel blend.
4.0 ADVANCED AVIATION FORWARD AREA REFULEING SYSTEM
TESTING
This section covers the evaluation of the Advanced Aviation Forwards Area Refueling System
(AAFARS) using the FT-SPK/JP-8 blend. The AAFARS system is a modular petroleum handing
and distribution system consisting of an engine powered pumping module, 500 gallon collapsible
fuel storage tanks, various fuel distribution nozzles, and dry brake uni-sex hoses and fittings for a
flexible/modular configuration.
0
1
2
3
4
5
6
7
8
9
0 50 100 150 200 250 300 350 400
Wat
er
Pre
ssu
re, p
siG
Test Hour
350 GPM Hose Inlet Pressure
UNCLASSIFIED
UNCLASSIFIED
24
4.1 TEST FACILITY
Unlike the FPT pump-engines, the AAFARS was evaluated not only using the FT-SPK/JP-8
blend in the engine pumping module, but also in the remaining components of the AAFARS fuel
distribution and handling system, to assess material compatibility with all of the various
components. As a result, additional preparations were made to ensure safe and proper handling
of the fuel being used to operate the system and recirculate in the flow loop.
The use of the fuel blend in all components of the system dictated that testing had to be
conducted in a liquid containment area, so that any fuel leaks would be controlled in the event of
a system malfunction or general spill. To achieve this, a portable/collapsible 5,000 gallon
containment berm was purchased for testing, and all components of the AAFARS system were
setup within the contained area. In addition, the entire AFFARS test setup and portable
containment berm were located within a larger existing earthen berm containment area at TFLRF
for an added level of protection.
Multiple safeties were included in the AAFARS installation to help prevent spills, or minimize
them in the event of a component failure. This included:
Monitoring of pressures before and after every AAFARS component to sense any
unusual pressure drops or changes (in absolute and delta pressure), which would indicate
a leak or malfunction
Pressure safety switches installed in key locations in the recirculation loop
Installation of the supply tank and the AAFARS pumping module within smaller steel
containments for additional spill capacity
Mechanical locking of all cam-lock fuel fittings to prevent accidental separation due to
vibration
In addition to the steps taken for fuel spills, the entire system was bonded and grounded to
prevent any potential charge build up in the system, and the test fuel was additized as required
with a static dissipater from the JP-8 approved products list. All mechanical grounding

UNCLASSIFIED
UNCLASSIFIED
25
connections were verified for continuity by a certified electrician prior to testing as a final check,
and the electrical conductivity of the fuel blend was routinely monitored throughout testing to
ensure acceptable conductivity levels to prevent static buildup. All of these steps provided the
safest test possible when using the fuel blend itself in the experimental setup.
4.2 INSTALLATION AND SET UP
The same basic data acquisition and control system used in the FPT pump-engine testing was
reused for the AAFARS system evaluation. Direction was given by TARDEC to install as many
of the AAFARS components in the test loop as feasibly possible. In the end, all components of
the AAFARS system provided by TARDEC were represented in the system, with the exception
of the CCR and Fuel/Oil servicing nozzles. These nozzles were not included due to limited
means to incorporate them into the sealed system recirculation loop in a safe manner. As a result,
only the D1 nozzle with appropriate adapters to the uni-sex and cam-lock components of the
system was incorporated.
The original system layout developed and approved by TARDEC consisted of a single large
recirculation loop tied to a 3,000 gallon collapsible bladder provided by an outside supplier. It
was connected in such a manner that the pump module pulled its fuel supply from the
3,000 gallon bladder, and the pump then discharged through the flow meter, D1 nozzle, and the
500 gallon collapsible fuel drum, returning fuel back to the bladder in a serial manner.
Instrumentation was setup to monitor the pump and fuel drum pressures, fuel flow, and various
temperatures throughout the system. Initial shakedown was completed to test the overall flow
arrangement, and two problems became readily apparent. The first issue noted was the inability
to recirculate the fuel back to the 3,000 gallon bladder. The bladders original configuration was
provided by the outside supplier in a one port configuration. This limited the ability to connect
the required supply and return hoses to the system, so an adapter was made to return fuel at the
same location as the bladder air vent. Ultimately it was found that the air vent could not be
prevented from releasing fuel while the system was being operated, thus the bladder would have
to be replaced. Secondly it was apparent that the 500 gallon AAFARS fuel drum was
experiencing fuel supply pressures from the pumping module nearing its rated test pressure as

UNCLASSIFIED
UNCLASSIFIED
26
per its design parameters called out in MIL-D-23119G. For safety reasons, the system was then
shut down to determine possible solutions to these noted issues.
Several adjustments and test attempts were made, with the final solution consisting of the
replacement of the 3,000 gallon bladder with a smaller 500 gallon rigid fuel storage tank, and the
split of the single path flow loop into two flow paths using the AAFARS 4-port recirculation
manifold. This allowed the modification of the 500 gallon rigid recirculation tank to achieve the
proper supply, return, and vent fittings to allow proper recirculation. In addition this provided
limitation in pressures being subjected to the AAFARS 500 gallon collapsible tank without
restricting volume flow through the remaining hoses and D1 nozzle loop. Figure 22 and Figure
23 show the final test operating configuration, and a diagram of the flow loop with indication of
locations for the measured parameters.
Figure 22. AAFARS final test set-up

UNCLASSIFIED
UNCLASSIFIED
27
In effect, the pumping module pulled fuel from the 500 gallon rigid tank and discharged into the
3 inch port on the recirculation manifold. From the recirculation manifold, the 2 inch open port
then connected to the flow meter through the D1 nozzle and returned to the storage tank, while
the 2 inch orifice port of the recirculation manifold was connected to the 500 gallon collapsible
fuel drum, which then returned to the storage tank. This configuration provided the 500 gallon
collapsible fuel drum with pressures less than 5 psi, but still maintained some nominal flow
through the components. The pump module engine itself was supplied fuel by a float level
controlled “day tank” to prevent operators from having to manually fill the onboard fuel tank
over the test duration. The “day tank” used was provided fuel at regulated pressures from the
discharge of the pump module in the recirculation loop, essentially creating a self contained
system.
Figure 23. AAFARS test configuration diagram
Fittings F7,F8, and F9 represent the AAFARS recirculation manifold.

UNCLASSIFIED
UNCLASSIFIED
28
After successfully completing shake down with the new system layout, operating limits were set
within the PRISM data acquisition and control system to ensure safe operation of the system for
the 400 hr test.
4.3 AAFARS TEST RESULTS
Consistent with the FPT pump-engine testing, a daily shutdown was performed to check engine
oil level and top off as needed. Apart from this, the system ran non-stop for the 400 hr test
duration with the exception of a few system malfunctions. These malfunctions included:
A shutdown at 98 hours as a result of a failed pump drive coupling. Failure was attributed
to the high temperature environment, and a new coupler was installed and testing
resumed.
Fuel leaks were noted at approximately 3-4 unisex couplers on multiple occasions during
system shutdowns at daily oil level checks. Most were easily repaired with replacement
uni-sex seals, with removed seals being found with some sort of mechanical damage
(pinch or roll in the body). Couplings, F1 and F2 shown in Figure 23 were found to have
pitting from corrosion around the seal in the seal seating groove. Even after the seals
were replaced at these locations, minor leaking reoccurred during system shutdowns
daily. No leaks were attributed to the fuel being tested itself, as all appeared to be a result
of the age of the seals and corrosion of the couplers. Since no leaks were present during
system operation, testing was continued.
A shutdown at 205 hours as a result of a fuel leak that occurred on the engine fuel supply
hose between the injector pumps. The hose was found to have multiple cracks on the
OUTER layer of the hose. The failure was attributed to exposure to heat from the engine
compartment, and not a result of interaction with the test fuel. A replacement section of
bulk hose was installed and testing was resumed.
Table 4 shows the operational parameters for the 400 hr test. Like the FPT testing, the desired
fuel temperature was specified at a minimum of 90 °F. Fuel temperatures in the system were

UNCLASSIFIED
UNCLASSIFIED
29
measured at the suction side of the pump, and again at approximately 4 feet after the discharge at
the inlet to the flow meter (See T_PmpIn and T_PmpOut in Figure 23). Unlike the FPT testing,
the AAFARS tests were completed during the summer months, which resulted in no issues in
achieving the desired fuel temperatures.
Table 4. AAFARS Operating Condition Summary
Parameter Average Minimum Maximum Standard Deviation
Median Value
Fuel Flow Out of Pump, gpm 86.7 74.8 92.8 3.6 88.1
Pressure at Pump Outlet, psig 6.2 5.1 8.2 0.4 6.2
Pressure at Pump Inlet, psia 10.1 8.8 11.3 0.3 10.1
Pressure at Fuel Drum, psig 0.9 -0.1 2.5 0.6 0.7
Fuel Temperature at Pump Outlet, deg F 116.9 90.3 137.3 9.3 115.4
Fuel Temperature at Pump Inlet, deg F 116.4 90 136.7 9.3 115
As expected, the bulk fuel temperature did fluctuate with ambient air temperature. The pump unit
inlet fuel temperature is shown in Figure 24.
Figure 24. AAFARS system fuel inlet temperature
The ambient air temperature was also recorded near the engine and pump unit. A small frame
with doors and covers was constructed around the AAFARS pump unit itself prior to testing to
80
90
100
110
120
130
140
150
0 50 100 150 200 250 300 350 400
Fue
l Te
mp
era
ture
, De
g F
Test Hour
AAFARS Fuel Temperature

UNCLASSIFIED
UNCLASSIFIED
30
help control ambient air temperatures as much as possible. Air temperature immediately around
the pump unit still varied with the time of day, but with the doors and covers around the pump
engine, ambient air temperature was easily maintained between 91.5 and 137 °F throughout
testing. When air temperature was lower, the doors were closed to maintain the engine
temperature, and when temperatures were higher, they were reopened. The ambient air
temperature is shown in Figure 25.
Figure 25. AAFARS system ambient air temperature
The overall fuel flow in the recirculation loop was measured just after the discharge of the pump
and ahead of the D1 nozzle (see Flow_LP in Figure 23). The fuel flow data shows a slight
increase near 91 hours of operation. The exact cause of this is unknown, but has been identified
to have occurred after a routine shutdown and restart early in the test. After this shift, the fuel
flow remained consistent for the remainder of the test. The flow rate data for the system is shown
in Figure 26.
70
80
90
100
110
120
130
140
150
0 50 100 150 200 250 300 350 400
Fue
l Te
mp
era
ture
, De
g F
Test Hour
AAFARS Air Temperature

UNCLASSIFIED
UNCLASSIFIED
31
Figure 26. AAFARS system overall fuel flow rate
The fuel inlet and outlet pressures of the AAFARS pump was measured at the inlet suction side
of the pump, and after the pump prior to the flow meter. The fuel pressure at the pump inlet
shows a slight decrease near the 91 hours, while the outlet shows a slight increase. Both are a
result of the increased system flow rate that was previously noted. In addition, daily fluctuation
of pressure can be seen in the plot as a result of heating and cooling of the fuel in the
recirculation loop which affected the fuels viscosity and resulting pressure generated by the
pump. Inlet and outlet pressures are shown in Figure 27.
60
70
80
90
100
110
0 50 100 150 200 250 300 350 400
Flo
w R
ate
, GP
M
Test Hour
AAFARS Fuel Flow

UNCLASSIFIED
UNCLASSIFIED
32
Figure 27. AAFARS system pump inlet and discharge pressure
The 500 gallon fuel drum pressure was measured at the drum inlet after the 2 inch orifice port
from the recirculation manifold to ensure the drum was not exposed to excessive pressures that
could rupture the tank. The fuel drum pressure remained below 2.5 psiG for the entire test
ensuring safe operation. The fuel drum pressure is shown in Figure 28.
Figure 28. AAFARS 500 gallon fuel drum pressure
0
2
4
6
8
10
12
14
0
2
4
6
8
10
12
14
0 50 100 150 200 250 300 350 400
Ou
tle
t P
ress
ure
, psi
G
Inle
t P
ress
ure
, psi
A
Test Hour
AAFARS Pump Inlet Pressure
Pump In Pressure
Pump Outlet Pressure
0
2
4
6
8
10
0 50 100 150 200 250 300 350 400
Pre
ssu
re, p
siG
Test Hour
AAFARS 500 Gallon Fuel Drum Pressure

UNCLASSIFIED
UNCLASSIFIED
33
4.4 ENGINE DRIVEN PUMP ASSEMBLY TESTING SUMMARY
Similar to the FPT testing results, the 400 hr AAFARS test showed that the FT-SPK/JP-8 fuel
blend had no direct impact on the operation of the equipment. While some minor leaks were
noted at various fittings during testing, all were attributed to mechanically failed o-rings from
previous seal deformation and corrosion/pitting in the fitting groove where the seal was seated.
The remainder of the AAFARS system demonstrated satisfactory performance with the fuel
blend, and would not be expected to demonstrate compatibility problems with future use.
5.0 CONCLUSION
Results from both the FPT and AAFARS testing yielded satisfactory performance when operated
on the FT-SPK/JP-8 test fuel blend. Each system was able to be operated to their full capacity as
dictated by the test facility and hardware used in the evaluation. No engine related performance
issues were noted in either component as a result of operating the engine on the synthetic blend
fuel, and no fuel related material compatibility issues were noted with hardware components that
came into contact with the test fuel itself (i.e., fuel engine supply and return lines, AAFARS
suction/discharge lines and fittings). Some performance issues were experienced in testing, but
all were related to incorrectly assembled test hardware, or age/previous wear or damage of the
equipment. It is expected that these two systems, assuming proper starting function, can be
operated on FT-SPK blends by the Army in the future without experiencing any major
compatibility problems or performance shortcomings.
Top Related