


Languages
Pages
Legal

1
Abstract—The photophoretic force may impact planetary
formation by sorting the dust in protoplanetary disks (PPDs) by
composition. This numerical simulation studied the
photophoretic force on fractal dust aggregates of μm-scale radii.
In general, the force on the aggregates (and the corresponding
drift velocity) was less than the force on comparable spheres, an
unexpected result that may be due to experimental error.
However, the force (on the order of 10-32 to 10-24 N) and resulting
drift velocity (0.005 mm/s to 80 mm/s) are sufficient to establish
photophoresis as a possible factor in the behavior of dust
aggregates with radii of a few micrometers in PPDs.
Index Terms—aggregates, astrophysics
I. INTRODUCTION
BSERVATIONS of Mercury and rocky exoplanets close to
their stars, notably CoRoT-7b and Kepler-10b, indicate
that these inner planets tend to be denser than outer planets in
similar systems [1]. Mercury, for instance, has an average
density of 5300 kg/m3, significantly greater than Earth’s
average density of 4100 kg/m3 or Mars’ average density of
3800 kg/m3 [2]. This indicates that Mercury and other
innermost planets are comparatively rich in metals [1], which
suggests that during the early stages of planetary formation, a
mechanism exists to sort the dust in a PPD by composition,
moving silicates outward but not affecting metal grains.
The photophoretic force, which occurs due to the
interactions of gas particles with an unevenly heated dust
grain, is an excellent candidate for this sorting mechanism [1],
[3]. This long-studied phenomenon, which has been
extensively described elsewhere (for example, [4], [5], [6],
[7]), was proposed as a factor in astrophysical environments
only in 2005 [3]. Since then, however, it has been suggested
as an explanation for the concentration of particular sizes,
ages, and compositions of chondrules in asteroids and similar
bodies [8] and for the formation of almost dust-free voids in
PPDs [9]. In addition, recent experimental work examined the
photophoretic force on aggregates and chondrules in
laboratory and microgravity conditions and found that it
Manuscript received August 6, 2013. This work was supported in part by
NSF Grant #1002637.
J. B. Kimery is with Rice University, Houston, TX 77005 USA. (phone: 325-998-6501; e-mail: [email protected]).
L. S. Matthews is with the Department of Physics, Baylor University,
Waco, TX 76798 USA. (e-mail: [email protected])
produced a significant acceleration of the aggregates [7]. In
view of these experiments, it is logical to assume that
photophoresis may play a role in the sorting of dust in a PPD.
The photophoretic force arises from a temperature gradient
across a grain. This gradient may develop if the radiation
from a young star heats one side of the grain without heating
the other. The gradient can form even if the particle is
rotating, provided that the rotation is slow enough for the
gradient to move across the grain, which is generally the case
in a PPD [9]. After this gradient forms, the photophoretic
force is directly caused by the collisions of gas particles with
the dust grain. These gas particles collide from all directions
with velocities corresponding to the ambient temperature.
Some of the gas is adsorbed and heats to the surface
temperature before rebounding again at a speed given by
(1)
with vrms the root-mean-square speed of the gas particles, R the
ideal gas constant, T the surface temperature in Kelvin, and
Mm the molar mass of the gas, in kilograms. Since this speed
depends on the surface temperature of the collision point, gas
rebounds from the hotter side with a greater velocity than from
the cold side. By the conservation of momentum, this creates
a net force on the dust grain, accelerating it away from its
heated side, and thus (usually) away from the light source [5].
Since the photophoretic force depends on the difference in
velocity of the rebounding gas particles, and thus on the
temperature difference across the grain, it is an ideal
mechanism for sorting dust in a PPD. Silicates, with
comparatively low thermal conductivity, experience a stronger
photophoretic force than metals. Thus, photophoresis could
sort the compounds in a PPD such that metals remained near a
star, while silicates moved outward [1]. As the dust
coagulates to aggregates and then planetesimals, eventually
forming planets [10], this sorting effect could produce metal-
rich inner planets and rockier outer planets [1].
Many studies have already examined the photophoretic
force on spheres and chondrules. Most theoretical treatments,
such as those analyzing the photophoretic force at different
Knudsen numbers [4] or the effect of differences in the grain’s
surface properties [6], have assumed spherical monomers.
Other studies work with irregular chondrules, but use radii of
mm, rather than the μm-scale of early dust aggregates. In [8],
the photophoretic force was found to be several orders of
magnitude larger than the other main forces in a solar nebula
Photophoretic Force on Fractal Aggregates in a
Protoplanetary Disk
Jesse B. Kimery, Lorin S. Matthews, Member, IEEE
O
2
(radiation pressure, Poynting-Robertson drag, and the
Yarkovski effect), giving drift velocities on the order of 10-1
m/s. Similarly, [7] studied photophoresis on aggregates and
chondrules in drop-tower experiments, finding aggregate
accelerations of mm/s2. Finally, [1] analyzed spherical
monomers to find drift velocities of 0.3 mm/s for metal grains
compared to 15 mm/s for silicates, establishing photophoresis
as a possible sorting mechanism in PPDs.
This study focuses on micrometer-sized dust aggregates. A
numerical simulation is used to examine the photophoretic
force on irregular aggregates built from spherical monomers.
These behave differently from spherical particles in two
significant ways. First, since it is assumed that there is little or
no heat transfer between the monomers [3] and since one
monomer may shadow another, the temperature gradient
across the aggregate is irregular. Second, gas particles
rebounding from the surface may collide with other areas of
the aggregate. Simulating the gas flux to the aggregate and
these unique aspects (temperature gradient and gas rebounds)
was the main challenge in this numerical simulation, described
in Section II. Results follow in Section III; Section IV
presents a discussion of the results, while Section V offers a
conclusion and recommendations for future work.
II. METHODS
A. Numerical Code
This simulation is based on the OML_LOS (Orbital Motion
Limited-Line of Sight) code, which has been used to model
the charging in various plasma environments [12], [13] of
aggregates built from monomers of varying sizes [11] and
shapes [14]. The flux of incoming gas particles is modeled in
a manner analogous to that used to find the current density of
charged plasma particles to the surface of the grains [12], [13],
[15]. Gas molecules approaching the surface are assumed to
move on straight–line paths along vectors which are not
blocked by other monomers within the aggregate (open lines
of sight, LOS). The number of gas molecules impacting a
surface per unit area per unit time is given by the flux, I
(1)
where n is the number density of the gas, v is the velocity of a
gas molecule, v cos is the component of the velocity normal
to the surface, and f(v) is the Maxwellian velocity distribution
. (2)
Here m is the mass of the gas molecule, k is the Boltzmann
constant, and T is the temperature of the gas. The integral over
the angles in (1) may be separated into an integral over the
magnitude of the velocity and an integral over the angles
(3)
Performing the integration over v, (3) becomes
. (4)
The integral , the LOS_factor, depends on the
open lines of sight at the surface. For points on an isolated
sphere, no lines of sight are blocked except by the monomer
itself, so the limits for the angular integration are 0 ≤ ≤ /2
and 0 ≤ ≤ 2 and LOS_factor = for all points on the
surface. However, points on the surface of an aggregate (as
illustrated in Figure 1 [13]) may have lines of sight which are
blocked by other monomers within the aggregate. Thus the
LOS_factor must be calculated numerically. The code
generates points on the surface of each monomer which define
patches of approximately equal area (up to 10,000 patches
total), and at each point checks 1024 test lines of sight to see if
they are open or blocked. The open directions are then
considered in the summation that approximates the integral
over dΩ. Details of the method are given in [13].
The aggregates used in this simulation consist of collections
of spherical dust grains. One population of aggregates were
created from monodisperse spheres with radii of 1.7 μm,
while the second population used polydisperse spheres with
radii from 0.5 to 10 μm and a size distribution determined by
, with n(a)da the number of particles with a
radius between a and a + da and γ = -3.5. The particles were
assumed to be silicate and assigned a temperature gradient of
104 K/m based on [6]. For comparison purposes, the
photophoretic force was also calculated for individual spheres
with radii from 0.6896 μm to 28.25 μm (the range of
equivalent radii for the polydisperse aggregates) and 3.2209
μm to 47.701 μm for the monodisperse aggregates.
B. Temperature Gradient
Aggregates do not develop a uniform temperature gradient
across their component monomers. The simulation assumes a
light source along a given direction. Each point is checked to
find whether the illumination direction is blocked; the light
flux to an open point is calculated by
(5)
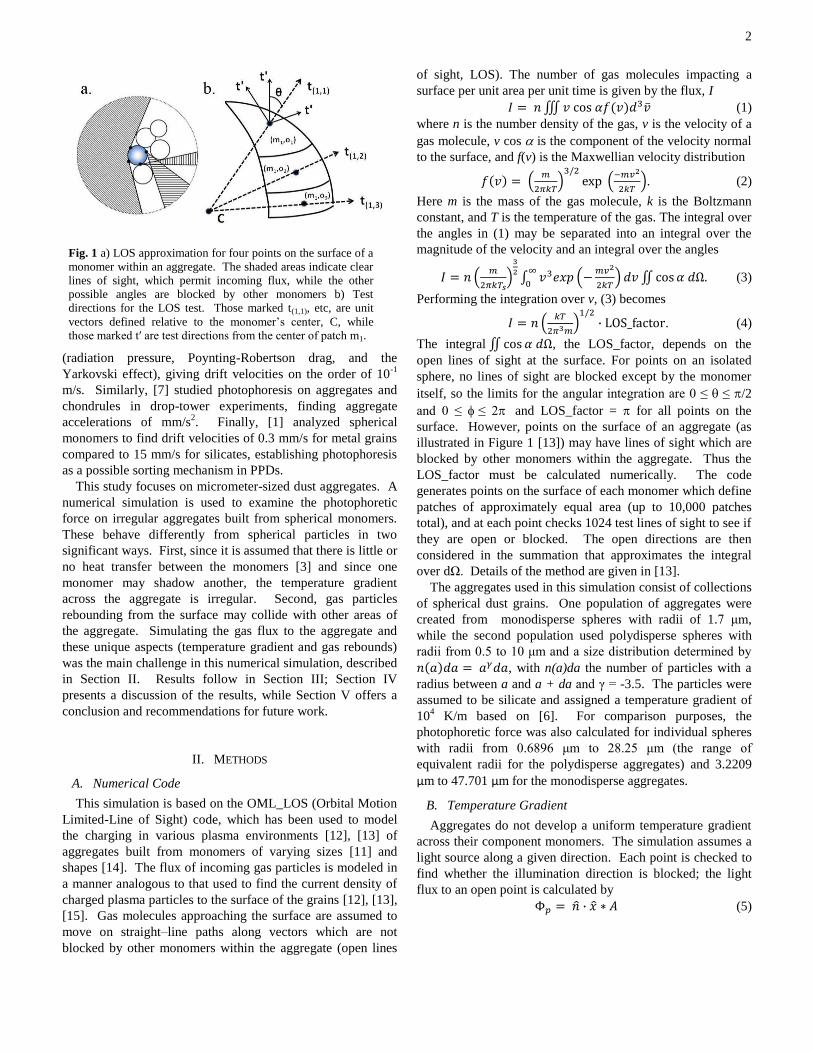
Fig. 1 a) LOS approximation for four points on the surface of a
monomer within an aggregate. The shaded areas indicate clear
lines of sight, which permit incoming flux, while the other
possible angles are blocked by other monomers b) Test
directions for the LOS test. Those marked t(1,1), etc, are unit
vectors defined relative to the monomer’s center, C, while
those marked tʹ are test directions from the center of patch m1.
3
where is the unit normal to the surface at that point, is the
illumination direction, and A is the area of the patch defined
by that point. The total flux to the ith
monomer is found by
summing over all the patches: i = p
The flux, as well as other factors, is used to define the
temperature gradient across the aggregate in three steps. First,
an average temperature for each monomer is determined based
on the fraction of its surface which is illuminated
(6)
where is the scaled average temperature of each monomer,
T is the original average temperature (600 K here),
is the
ratio between the integral over Ω in the light’s direction of
each monomer and that of a fully illuminated sphere, is the
integral over Ω in the light’s direction for the monomer,
is the (unit-vector) coordinate of the point on the
sphere’s surface with the highest temperature, is the
maximum radius of the monomers in the aggregate, and ΔT is
the temperature gradient across the dust. The surface
temperature of each illuminated point is then found from
(7)
with the variables defined as above. The surface temperature
of each shadowed point is given by
(8)
where is the coordinate of the point defined relative to the
coordinate in the light’s direction of the last illuminated point
on the monomer and the other variables are defined as above.
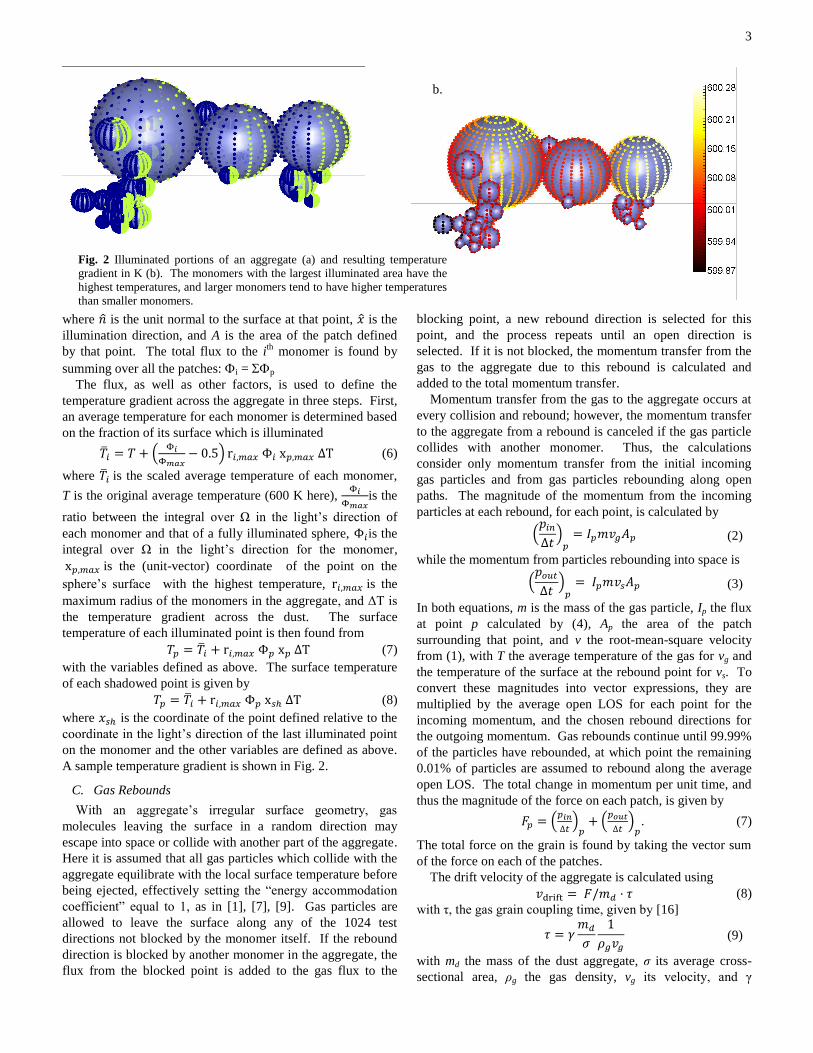
A sample temperature gradient is shown in Fig. 2.
C. Gas Rebounds
With an aggregate’s irregular surface geometry, gas
molecules leaving the surface in a random direction may
escape into space or collide with another part of the aggregate.
Here it is assumed that all gas particles which collide with the
aggregate equilibrate with the local surface temperature before
being ejected, effectively setting the “energy accommodation
coefficient” equal to 1, as in [1], [7], [9]. Gas particles are
allowed to leave the surface along any of the 1024 test
directions not blocked by the monomer itself. If the rebound
direction is blocked by another monomer in the aggregate, the
flux from the blocked point is added to the gas flux to the
blocking point, a new rebound direction is selected for this
point, and the process repeats until an open direction is
selected. If it is not blocked, the momentum transfer from the
gas to the aggregate due to this rebound is calculated and
added to the total momentum transfer.
Momentum transfer from the gas to the aggregate occurs at
every collision and rebound; however, the momentum transfer
to the aggregate from a rebound is canceled if the gas particle
collides with another monomer. Thus, the calculations
consider only momentum transfer from the initial incoming
gas particles and from gas particles rebounding along open
paths. The magnitude of the momentum from the incoming
particles at each rebound, for each point, is calculated by
(2)
while the momentum from particles rebounding into space is
(3)
In both equations, m is the mass of the gas particle, Ip the flux
at point p calculated by (4), Ap the area of the patch
surrounding that point, and v the root-mean-square velocity
from (1), with T the average temperature of the gas for vg and
the temperature of the surface at the rebound point for vs. To
convert these magnitudes into vector expressions, they are
multiplied by the average open LOS for each point for the
incoming momentum, and the chosen rebound directions for
the outgoing momentum. Gas rebounds continue until 99.99%
of the particles have rebounded, at which point the remaining
0.01% of particles are assumed to rebound along the average
open LOS. The total change in momentum per unit time, and
thus the magnitude of the force on each patch, is given by
. (7)
The total force on the grain is found by taking the vector sum
of the force on each of the patches.
The drift velocity of the aggregate is calculated using
(8)
with τ, the gas grain coupling time, given by [16]
(9)
with md the mass of the dust aggregate, σ its average cross-
sectional area, ρg the gas density, vg its velocity, and γ
b. a
.
Fig. 2 Illuminated portions of an aggregate (a) and resulting temperature
gradient in K (b). The monomers with the largest illuminated area have the
highest temperatures, and larger monomers tend to have higher temperatures
than smaller monomers.
4
experimentally determined (in [16]) to be 0.68. Since the
random rebound directions strongly affect the resultant forces
and velocities, the simulation was run 1,000 times for each
aggregate and the forces and velocities were averaged.
Due to irregularities in the aggregate structure, the
rebounding gas particles produce significant forces even
without a temperature gradient across the aggregate. The
magnitudes of these forces—on the order of 10-20
N—are
reasonable for gas drag [17], [18], [19]. To differentiate the
drag force on the aggregate from the photophoretic force, on
each trial the surface temperature and resultant rebound
velocity and momentum transfer for the gas were calculated
with the temperature gradient set to 0 K/m as well as with the
gradient set to 104 K/m. Since the same rebound directions
were used in each calculation, the difference between the
results represents the photophoretic force (Fig. 3).
The current code neglects any torque and subsequent
rotations caused by gas drag, collisions between dust particles,
and thermal forces, since earlier experiments found that for
most particles greater than 1 μm in size, these rotations are
quickly damped by the surrounding gas, happen slowly
enough that a temperature gradient can form, or occur only
along the radial direction and thus leave the gradient
unaffected [3]. In experiments with photophoresis on ice
crystals in a near-vacuum, Eymeren & Wurm [20] found that
the ice aggregates rotated only along radial axes, parallel to
the direction of illumination, probably due to the fact that the
directions of illumination and gravity were the same, allowing
the particles to reach equilibrium between gravity and the
photophoretic force.
D. Analysis Techniques: Compactness Factor
The averaged force and velocity were analyzed as functions
of the aggregates’ physical parameters, such as mass,
equivalent radius, and compactness factor. Compactness
factor describes the “fluffiness” of the aggregate [13], [15]. It
is calculated by finding the aggregate’s average projected
cross-sectional area. A circle of equivalent area, with
equivalent radius Rσ, is then defined. The compactness factor
is the volume of the aggregate, calculated as the sum of the
volumes of the individual monomers, divided by the volume
of a sphere with radius Rσ
(4)
with N the number of monomers and ri their individual radii
[13]. A compactness factor approaching 0 indicates an open,
fluffy aggregate, while a compactness factor near 1 indicates a
very compact, spherical aggregate.
III. RESULTS
A. Monodisperse Aggregates
The monodisperse aggregates contained 2 to 2179
monomers, with compactness factors from 0.0945 to 1.3869
(the values greater than 1 occurred due to errors when
analyzing the smallest aggregates). The magnitude of the x-
component of the photophoretic force ranged from 1.0714 ×
10-30
N to 4.2039 × 10⁻²⁵
N (due to the direction of the
temperature gradient, the y and z components are negligible
here, though they will be discussed later), with corresponding
drift velocities of 6.7224 × 10⁻⁶
m/s to 0.0098 m/s. In
comparison, the x-force on spheres of equivalent radii ranged
from 1.2216 × 10⁻²⁷
N to 3.9672 × 10⁻²⁴
N (with drift velocities
of 0.0056 m/s to 0.0831 m/s), while the force on spheres of
equivalent mass was from 1.4369 × 10⁻²⁸
N to 1.5655 × 10⁻²⁵
N (with drift velocities of 0.0028 m/s to 0.0283 m/s). For
clarity, in all figures, all components of the forces and drift
velocities of the aggregates and spheres were normalized by
the magnitude of the force and velocity on a single monomer
with radius of 1.7 μm (1.7963 × 10⁻²⁸
N and 0.0030 m/s,
respectively), while the mass or radii were normalized by the
mass (5.1449 × 10⁻¹⁴
kg) and radius of the monomer.
When force and velocity were plotted against radius (Fig. 4
and Fig. 7), the force on the aggregates was orders of
magnitude smaller than the force on the spheres of comparable
radius, a trend which extended to the velocities. When the
force and velocity were plotted against mass (Fig. 6, Fig. 5),
however, the aggregates’ force was slightly greater than the
force on spheres of similar mass (although due to differences
in cross-sectional area, the resultant drift velocity of the
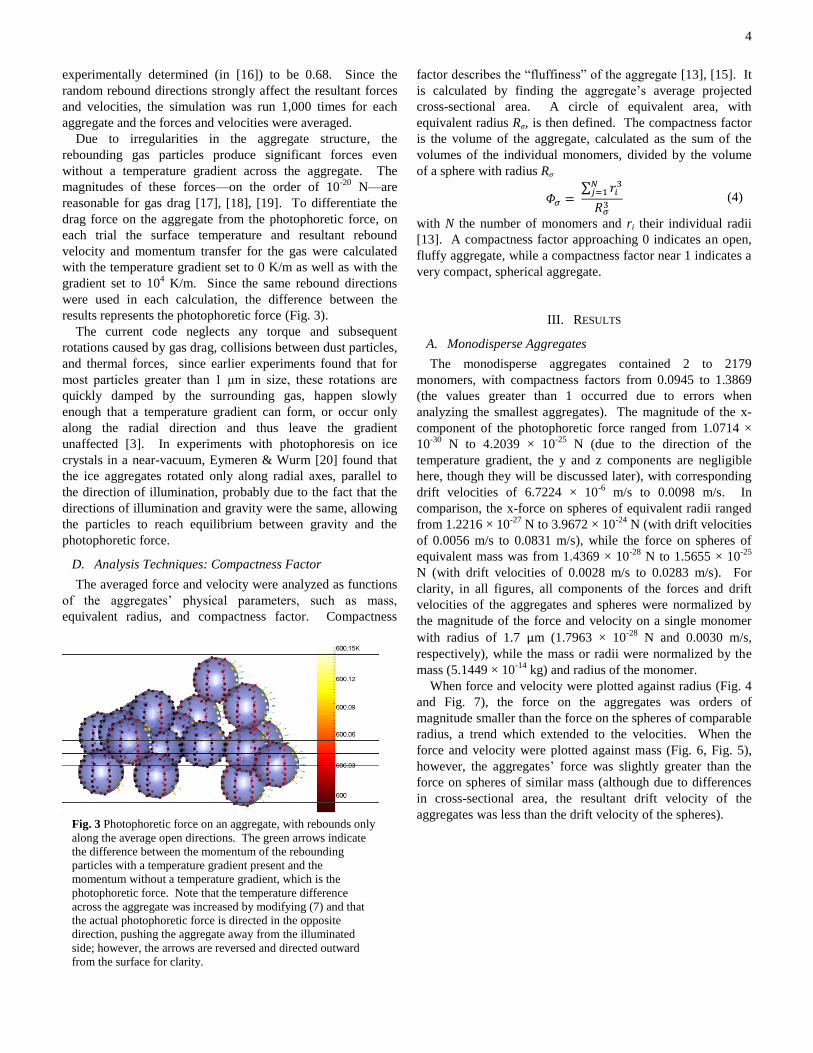
aggregates was less than the drift velocity of the spheres). Fig. 3 Photophoretic force on an aggregate, with rebounds only
along the average open directions. The green arrows indicate
the difference between the momentum of the rebounding
particles with a temperature gradient present and the
momentum without a temperature gradient, which is the
photophoretic force. Note that the temperature difference
across the aggregate was increased by modifying (7) and that
the actual photophoretic force is directed in the opposite
direction, pushing the aggregate away from the illuminated
side; however, the arrows are reversed and directed outward
from the surface for clarity.
5
The force and drift velocity for the aggregates, normalized
by the force and drift velocity of a monodisperse monomer,
were also plotted against the compactness factor (Fig. 10, Fig.
9). The photophoretic force approached 0 as the compactness
factor approached 1, indicating a dense, spherical aggregate
(although due to errors in the code, some aggregates were
assigned compactness factors greater than 1).
B. Polydisperse Aggregates
Polydisperse aggregates contained from 2 to 1376
monomers. The magnitude of the x-component of the
photophoretic force ranges from 8.2166 × 10⁻³³
N to 1.8930 ×
10-25
N, with a resultant velocity from 4.4374 e-7 m/s to
0.0615 m/s. A few negative values arise from the smallest and
most irregular aggregates, indicating a force toward the light,
but the force and velocity of nearly all aggregates is directed
away from the light source.
In comparison, the magnitude of the force on the spheres
with equivalent radii runs from 1.0945 × 10⁻²⁹
N to 8.2414 ×
10-25
N, with resultant velocities from 0.0012 m/s to 0.0492
m/s. The spheres with equivalent masses have slightly smaller
radii than the aggregates; thus, their force ranges from 1.0184
× 10-29
N to 2.3225 × 10⁻²⁵
N with resulting velocities from
0.0011 m/s to 0.0323 m/s.
For clarity, all components of the force and velocity of the
aggregates and the spheres are scaled by the magnitude of the
force and velocity on a sphere with the average radius of the
polydisperse size distribution (1.65 μm). These magnitudes
were 1.6424 × 10⁻²⁸
N and 0.0029 m/s, respectively. In
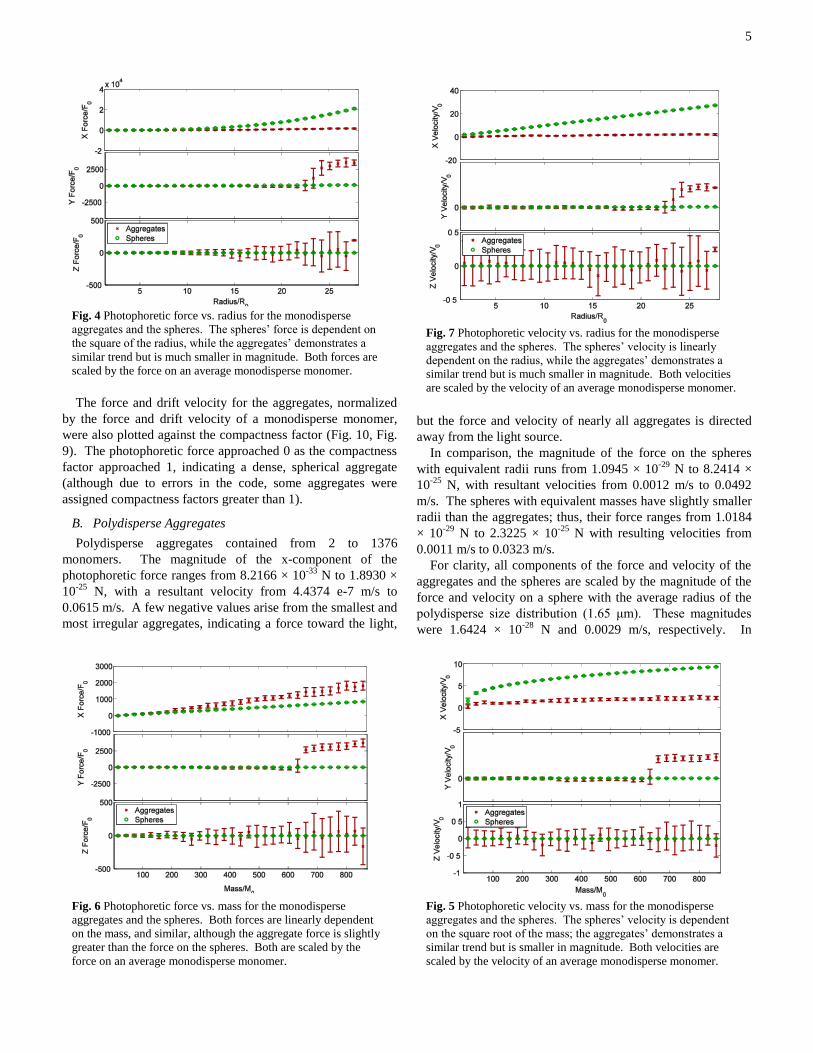
Fig. 7 Photophoretic velocity vs. radius for the monodisperse
aggregates and the spheres. The spheres’ velocity is linearly
dependent on the radius, while the aggregates’ demonstrates a
similar trend but is much smaller in magnitude. Both velocities
are scaled by the velocity of an average monodisperse monomer.
Fig. 6 Photophoretic force vs. mass for the monodisperse
aggregates and the spheres. Both forces are linearly dependent
on the mass, and similar, although the aggregate force is slightly
greater than the force on the spheres. Both are scaled by the
force on an average monodisperse monomer.
Fig. 5 Photophoretic velocity vs. mass for the monodisperse
aggregates and the spheres. The spheres’ velocity is dependent
on the square root of the mass; the aggregates’ demonstrates a
similar trend but is smaller in magnitude. Both velocities are
scaled by the velocity of an average monodisperse monomer.
Fig. 4 Photophoretic force vs. radius for the monodisperse
aggregates and the spheres. The spheres’ force is dependent on
the square of the radius, while the aggregates’ demonstrates a
similar trend but is much smaller in magnitude. Both forces are
scaled by the force on an average monodisperse monomer.
6
addition, the mass and radius of the aggregates and spheres are
scaled by the mass and radius of this average polydisperse
sphere (4.7041 × 10⁻¹⁴
kg and 1.65 μm).
The force and velocity of the aggregates remained
consistent whether plotted against radius (Fig. 11, Fig. 8) or
mass (Fig. 15, Fig. 14); they followed the spheres’ trends
(with force quadratically dependent on radius and linearly
dependent on mass), but were lower than the spheres in all
cases. Their trends proved extremely similar to the
monodisperse force and velocity; however, in the polydisperse
case the aggregates’ force and velocity were closer to those of
the spheres of equivalent radius, and the force when plotted
against mass was lower than the force on the spheres. The
normalized force and velocity for the aggregates approached 0
as the compactness factor approached 1 (Fig. 12, Fig. 13).
IV. DISCUSSION
A. Comparison with Spheres
The aggregates of both size distributions behaved similarly
to each other, as predicted. The overall trends in the force and
drift velocity of the aggregates were similar to those of the
spheres, though the irregular aggregate shapes and random gas
rebounds increased the error in the aggregate data.
The maximum force and velocity for the spheres when
plotted with respect to radius was significantly greater than the
spheres’ maximum force and velocity when plotted with
respect to mass, although the force and velocity of the
aggregate remained consistent. This occurred because the
range of the x-axis was determined by the aggregates. The
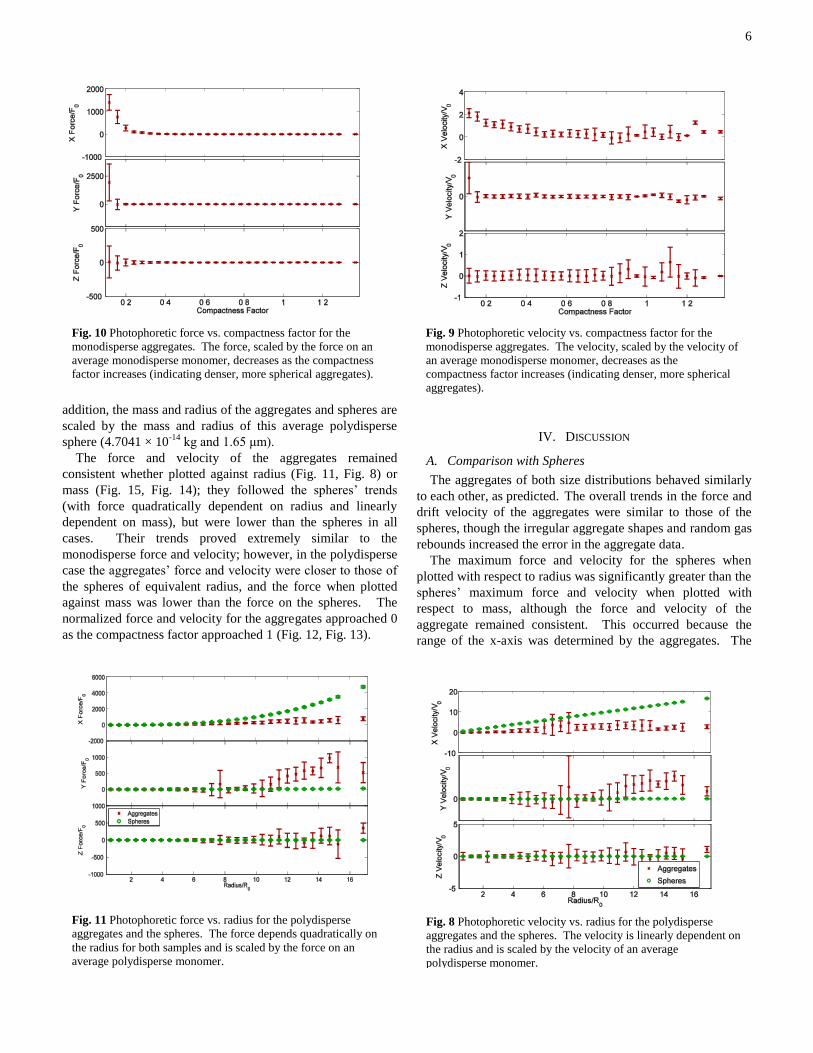
Fig. 10 Photophoretic force vs. compactness factor for the
monodisperse aggregates. The force, scaled by the force on an
average monodisperse monomer, decreases as the compactness
factor increases (indicating denser, more spherical aggregates).
Fig. 9 Photophoretic velocity vs. compactness factor for the
monodisperse aggregates. The velocity, scaled by the velocity of
an average monodisperse monomer, decreases as the
compactness factor increases (indicating denser, more spherical
aggregates).
Fig. 11 Photophoretic force vs. radius for the polydisperse
aggregates and the spheres. The force depends quadratically on
the radius for both samples and is scaled by the force on an
average polydisperse monomer.
Fig. 8 Photophoretic velocity vs. radius for the polydisperse
aggregates and the spheres. The velocity is linearly dependent on
the radius and is scaled by the velocity of an average
polydisperse monomer.
7
spheres with equivalent radii to the aggregates had
significantly higher masses than the aggregates. Thus, the
plots with respect to radius considered a wider range of sphere
masses, resulting in an increased photophoretic force on the
spheres. Spheres with equivalent radii and greater masses
experienced a far stronger force than the aggregates, while
spheres with smaller radii and equivalent masses experienced
roughly the same photophoretic force as the aggregates.
The polydisperse aggregates’ force in the y-direction is less
easily explained. The temperature gradient was directed along
the x-axis, and although asymmetry in the aggregates might
produce some force in the y and z directions, the currently
observed force in the y-direction is only one order of
magnitude smaller than the force in the x-direction, while the
z-direction experiences essentially no force.
The fact that the force and velocities of the aggregates were
consistently lower than those of the spheres is also
unexpected. As the aggregates should be less thermally
conductive than spheres, due to little heat transfer between the
monomers [3], it was predicted that the temperature difference
across the aggregates would be greater than the difference
across a sphere, and this would produce a greater force on the
aggregates than on the spheres. Errors in the code are a
probable cause of this discrepancy. The temperature gradient
across an aggregate has not been extensively studied. In
addition, the number of points generated on each aggregate
where gas particles may collide was limited to 10,000 points,
which may not have been adequate for the larger aggregates.
Both of these error sources may be addressed in future work.
B. Compactness Factor
The force on the aggregate decreased with compactness
factor because a higher compactness factor indicates a smaller
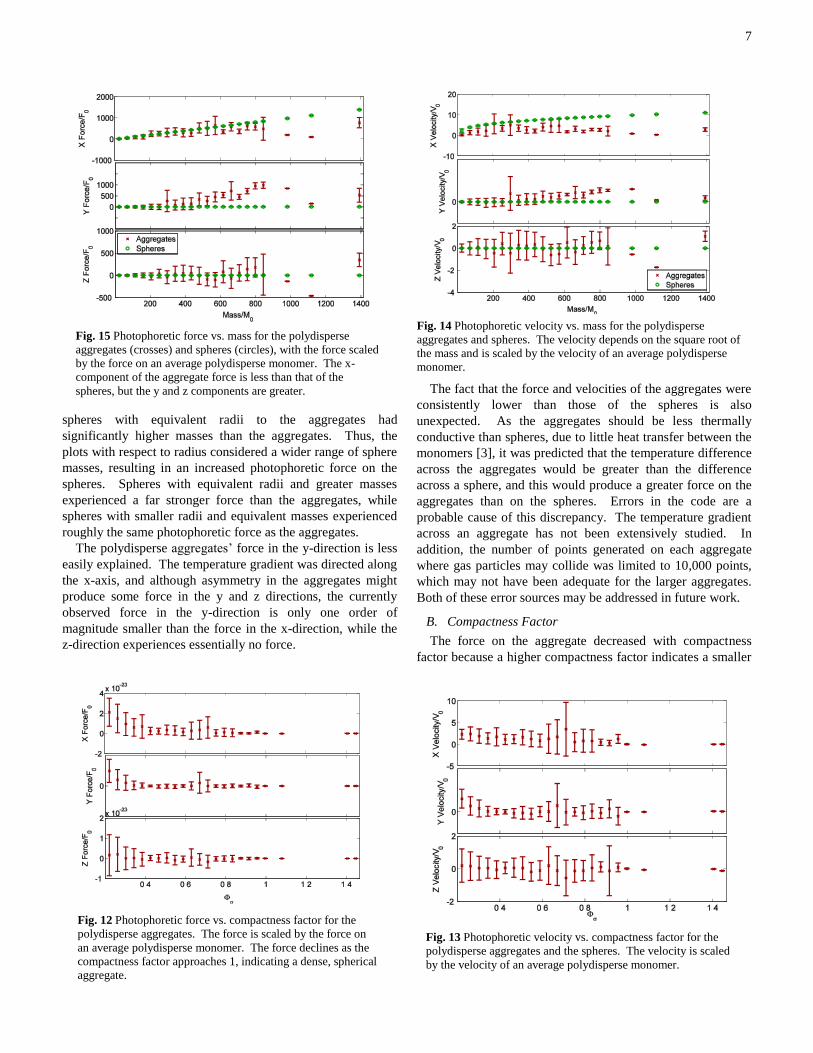
Fig. 15 Photophoretic force vs. mass for the polydisperse
aggregates (crosses) and spheres (circles), with the force scaled
by the force on an average polydisperse monomer. The x-
component of the aggregate force is less than that of the
spheres, but the y and z components are greater.
Fig. 14 Photophoretic velocity vs. mass for the polydisperse
aggregates and spheres. The velocity depends on the square root of
the mass and is scaled by the velocity of an average polydisperse
monomer.
Fig. 13 Photophoretic velocity vs. compactness factor for the
polydisperse aggregates and the spheres. The velocity is scaled
by the velocity of an average polydisperse monomer.
Fig. 12 Photophoretic force vs. compactness factor for the
polydisperse aggregates. The force is scaled by the force on
an average polydisperse monomer. The force declines as the
compactness factor approaches 1, indicating a dense, spherical
aggregate.
8
ratio between surface area and volume; aggregates with high
compactness factor have relatively little surface area for the
gas to collide. Since compactness factor considers both the
equivalent radius of an aggregate and (indirectly, through
volume) its mass, it may prove an effective method of
characterizing the photophoretic force on an aggregate, which
is strongly affected by both of these factors.
C. Comparison with Previous Work
The photophoretic force and drift velocity observed in this
experiment is comparable to previous work on aggregates. In
[7], for instance, the photophoretic force on larger dust
aggregates was experimentally studied. For dust aggregates,
the acceleration ranged from 1.490 ± 0.198 mm/s2 to 200.780
± 4.774 mm/s2, although the diameters of these aggregates
ranged from 1.37 to 1. 93 mm ± 10%, significantly larger than
the aggregates analyzed in the current study.
V. CONCLUSION AND FUTURE WORK
The photophoretic force on micrometer-sized dust
aggregates has a significant influence on their behavior.
Although the force on aggregates may be less than the force
on spheres of comparable mass or radius, the force is
undoubtedly sufficient to produce drift velocities on the orders
of mm/s in silicate aggregates. Combined with previous work
on single particles and larger dust aggregates, this suggests
that photophoresis may be a mechanism for the sorting of dust
by composition in a protoplanetary disk.
This simulation may be modified significantly in future
studies. Theoretical studies have already created more
complex calculations of the heat source function, and thus
temperature gradient, across an aggregate [21]. Although
some studies suggest that due to the small size of the gas
particles and the differences in accommodation coefficients,
heat transfer to the gas has no significant effect on the gradient
[3], it may be necessary to consider heat transfer from the gas
to the colder areas of the aggregate. Finally, future versions of
the code should analyze gradients along different axes to
differentiate between the effects of the aggregate shape and
the temperature gradient.
Modeling aggregates with irregularly shaped monomers
would provide more detailed information on the photophoretic
force. Experimental work, such as that being performed by
Wurm et al. [7], [20], may also guide future models. This
simulation is thus a small element in a broader understanding
of the photophoretic force’s effect on dust aggregates.
ACKNOWLEDGMENT
J. B. Kimery thanks Dr. Truell Hyde, CASPER (especially
the Astrophysics and Space Science Theory Group), and the
Baylor 2013 NSF REU Fellows for support and
encouragement. She specifically thanks Peter Fager for advice
on running the simulation. She also thanks Michael Peirce for
helpful discussions.
REFERENCES
[1] G. Wurm, M. Trieloff, and H. Rauer, “Photophoretic Separation of Metals
and Silicates: The Formation of Mercury-like Planets and Metal Depletion
in Chondrites,” Astrophys. J., vol. 769, no. 1, p. 78, May 2013.
[2] T. Spohn, F. Sohl, K. Wieczerkowski, and V. Conzelmann, “The interior
structure of Mercury: what we know, what we expect from BepiColombo,” Planet. Space Sci., vol. 49, no. 14–15, pp. 1561–1570,
Dec. 2001.
[3] O. Krauss and G. Wurm, “Photophoresis and the pile-up of dust in young circumstellar disks,” Astrophys. J., vol. 630, no. 2, p. 1088, 2005.
[4] S. Beresnev, V. Chernyak, and G. Fomyagin, “Photophoresis of a
spherical particle in a rarefied gas,” Phys. Fluids Fluid Dyn., vol. 5, p. 2043, 1993.
[5] S. Tehranian, F. Giovane, J. Blum, Y.-L. Xu, and B. \AAS Gustafson,
“Photophoresis of micrometer-sized particles in the free-molecular regime,” Int. J. Heat Mass Transf., vol. 44, no. 9, pp. 1649–1657, 2001.
[6] H. Rohatschek, “Semi-empirical model of photophoretic forces for the
entire range of pressures,” J. Aerosol Sci., vol. 26, no. 5, pp. 717–734, 1995.
[7] G. Wurm, J. Teiser, A. Bischoff, H. Haack, and J. Roszjar, “Experiments on the photophoretic motion of chondrules and dust aggregates—
Indications for the transport of matter in protoplanetary disks,” Icarus,
vol. 208, no. 1, pp. 482–491, Jul. 2010. [8] G. Wurm and O. Krauss, “Concentration and sorting of chondrules and
CAIs in the late solar nebula,” Icarus, vol. 180, no. 2, pp. 487–495, 2006.
[9] O. Krauss, G. Wurm, O. Moussis, J.-M. Petit, J. Horner, and Y. Alibert, “The photophoretic sweeping of dust in transient protoplanetary disks,”
arXiv e-print astro-ph/0611757, Nov. 2006.
[10] J. Blum and G. Wurm, “The growth mechanisms of macroscopic bodies in protoplanetary disks,” Annu Rev Astron Astrophys, vol. 46, pp. 21–56,
2008.
[11] L. S. Matthews, R. L. Hayes, M. S. Freed, and T. W. Hyde, “Formation of cosmic dust bunnies,” Plasma Sci. Ieee Trans., vol. 35, no. 2, pp. 260–
265, 2007.
[12] L. S. Matthews and T. W. Hyde, “Charging of fractal dust agglomerates in a plasma environment,” in Pulsed Power Conference, 2007 16th IEEE
International, 2007, vol. 2, pp. 1577–1580.
[13] L. S. Matthews, V. Land, and T. W. Hyde, “Charging and coagulation of dust in protoplanetary plasma environments,” Astrophys. J., vol. 744, no.
1, p. 8, 2012.
[14] J. Perry, J. Kimery, L. S. Matthews, and T. W. Hyde, “Effects of monomer shape on the formation of aggregates from a power law
monomer distribution,” New J. Phys., vol. 14, 2013.
[15] S. A. Frazier, L. S. Matthews, and T. W. Hyde, “Charging Behavior of Dust Aggregates in a Cosmic Plasma Environment,” Lpi Contrib., vol.
1719, p. 2480, 2013.
[16] J. Blum, G. Wurm, S. Kempf, and T. Henning, “The Brownian Motion of Dust Particles in the Solar Nebula: An Experimental Approach to the
Problem of Pre-planetary Dust Aggregation,” Icarus, vol. 124, no. 2, pp.
441–451, Dec. 1996. [17] J . Blum and G. Wurm, “Experiments on Sticking, Restructuring, and
Fragmentation of Preplanetary Dust Aggregates,” Icarus, vol. 143, no. 1,
pp. 138–146, Jan. 2000. [18] C. W. Ormel and J. N. Cuzzi, “Closed-form expressions for particle
relative velocities induced by turbulence,” Astron. Astrophys., vol. 466,
no. 2, pp. 413–420, 2007. [19] R. Nakamura and Y. Hidaka, “Free molecular gas drag on fluffy
aggregates,” Astron. Astrophys., no. 340, pp. 329–334, 1998.
[20] J. van Eymeren and G. Wurm, “The implications of particle rotation on the effect of photophoresis,” Mon. Not. R. Astron. Soc., vol. 420, no. 1,
pp. 183–186, Feb. 2012.
[21] Y. Xu, B. Å. S. Gustafson, F. Giovane, J. Blum, and S. Tehranian, “Calculation of the heat-source function in photophoresis of aggregated
spheres,” Phys. Rev. E, vol. 60, no. 2, pp. 2347–2365, Aug. 1999.
Jesse B. Kimery was born in Carrboro, NC. She graduated from Kimery
Home School in 2012. She attends Rice University in Houston, TX, pursuing
a B. S. in physics and math and expects to graduate in 2016.
She was an REU Fellow at Baylor University, Waco, TX. She co-authored
“Effects of monomer shape on the formation of aggregates from a power law
monomer distribution” (J Perry, J Kimery, L Matthews, and T W Hyde;
published in New Journal of Physics).
Top Related