


Languages
Pages
Legal


Perspectives of FutureSocial Security Beneficiaries
Ages 45-64: DetailedFindings
September 2015
Perspectives of Future SocialSecurity Beneficiaries Ages 45-64:
Detailed Findings
Report Prepared by
Rebecca Perron
September 2015AARP Research Center

Perspectives of Future Social Security Beneficiaries Ages 45-64: Detailed Findings ii
AARP is a nonprofit, nonpartisan organization, with a membership of nearly 38 million, thathelps people turn their goals and dreams into real possibilities, strengthens communities andfights for the issues that matter most to families such as healthcare, employment and incomesecurity, retirement planning, affordable utilities and protection from financial abuse. Weadvocate for individuals in the marketplace by selecting products and services of high qualityand value to carry the AARP name as well as help our members obtain discounts on a widerange of products, travel, and services. A trusted source for lifestyle tips, news and educationalinformation, AARP produces AARP The Magazine, the world's largest circulation magazine;AARP Bulletin; www.aarp.org; AARP TV & Radio; AARP Books; and AARP en Español, aSpanish-language website addressing the interests and needs of Hispanics. AARP does notendorse candidates for public office or make contributions to political campaigns orcandidates. The AARP Foundation is an affiliated charity that provides security, protection, andempowerment to older persons in need with support from thousands of volunteers, donors, andsponsors. AARP has staffed offices in all 50 states, the District of Columbia, Puerto Rico, andthe U.S. Virgin Islands. Learn more at www.aarp.org.
Acknowledgements
The author would like to thank Tanya Mitchell for her early management of the project andquestionnaire development and the following colleagues for providing expert guidance andreview of both the survey instrument and reports: Mary Liz Burns, Josh Rosenblum, GaryKoenig, Mikki Waid, Alison Shelton, John Hishta, Jodi Sakol, David Cerner, Cristina Martin-Firvida, Rosa Maymi, Deb Whitman, Jeannine English, Jonathan Peterson, S. Kathi Brown, JeffLove, Laura Mehegan, Karen Turner, Becky Gillan, and Mike Hilker.
The following representatives from the Financial Planning Association also provided review onthe survey and reports: Ben Lewis and David Yeske.
All media inquiries about this report should contact AARP’s Media Relations at (202) 434-2560.Inquiries about the survey instrument or additional information about the report should beaddressed to Rebecca Perron [email protected].

Perspectives of Future Social Security Beneficiaries Ages 45-64: Detailed Findings iv
Table of Contents
Executive Summary _______________________________________________1
Introduction______________________________________________________3
Detailed Findings:_________________________________________________4
Priorities and Expectations of the Role of Social Security
in Retirement ______________________________________________4
Social Security Knowledge____________________________________7
Confidence in Social Security and Solvency _____________________17
Information Sources Used____________________________________18
Profile of Respondents_______________________________________27
Appendix A: Gender Differences____________________________________31
Appendix B: Methodology_________________________________________32
Appendix C: Annotated Questionnaire_______________________________37
List of Charts_____________________________________________________vi

Perspectives of Future Social Security Beneficiaries Ages 45-64: Detailed Findings vi
List of Charts
Chart 1 Importance of Selected Factors in Social Security Claiming Decisions:
All Respondents __________________________________________________ 4
Chart 2 Importance of Selected Factors in Social Security Claiming Decisions: Married
Respondents Only ________________________________________________ 4
Chart 3 Social Security’s Expected Share of Household Income in Retirement ______ 5
Chart 4 Social Security Expected to be a Source of Retirement Income by Age _______ 6
Chart 5 Social Security Planning Priorities by Household Income _________________ 6
Chart 6 Social Security Expected to be a Source of Retirement Income by
Household Income _______________________________________________ 7
Chart 7 Self-Reported Knowledge about How Social Security Retirement Benefits
are Determined __________________________________________________ 8
Chart 8 Knowledge of Earliest Age That One Can Begin Collecting Social
Security Retirement Benefits _______________________________________ 8
Chart 9 Expected Claiming Age for Social Security Benefits _____________________ 9
Chart 10 Expected Monthly Social Security Benefit _____________________________ 9
Chart 11 Knowledge of Percent Increase in Benefits by Waiting from Age 62
Until FRA _______________________________________________________10
Chart 12 Earliest Age to Claim Social Security to Receive Highest Possible
Monthly Benefit_________________________________________________ 11
Chart 13 Understanding the Nature of Reduction in Current Monthly Social Security
Benefits Due to Salary from Work___________________________________ 11
Chart 14 Knowledge of benefits collected from a Spouse’s Work History____________ 12
Chart 15 Earliest Age at Which Spouse Should Claim Social Security Benefits to
Maximize Benefits for his Widow ____________________________________13
Chart 16 Number of Years Consumers Believe a Couple Must be Married to Collect
Social Security Benefits on the Ex-spouse’s Work Record________________13
Chart 17 Knowledge about How Social Security Benefits are Determined by Age_____14
Chart 18 Correct Responses to Knowledge Questions by Age ___________________14
Chart 19 Beliefs about the Number of Years Ex-spouses Must be Married to Claim
Benefits off the Ex’s Work Record by Age ____________________________15
Chart 20 Select Knowledge Items by Household Income _______________________16
Chart 21 Select Knowledge Items: Highest versus Lowest Household Income_______16

Perspectives of Future Social Security Beneficiaries Ages 45-64: Detailed Findings vii
List of Charts (continued)
Chart 22 Social Security Knowledge Differences by Professional Financial
Advisor Use __________________________________________________ 17
Chart 23 Confidence in the future of Social Security Benefits ___________________ 17
Chart 24 How Long Social Security Can Pay 100% and 75% Benefits ____________ 18
Chart 25 Information sources Used by Consumers to Learn about Social Security
Retirement Benefits ____________________________________________ 19
Chart 26 Usefulness of Each Source of Information (if used )____________________ 20
Chart 27 Online Tools and Resources Used to Learn about or Calculate Social
Security Benefits _________ _____________________________________ 20
Chart 28 Last Reviewed Estimated Social Security Benefits_____________________ 21
Chart 29 Used Various Sources of Information to Learn about Social Security
by Age_______________________________________________________ 22
Chart 30 Used the Internet and Online Tools for Social Security Information
by Age ______________________________________________________ 22
Chart 31 Time Since Last Reviewed Estimated Social Security Benefits
by Age ______________________________________________________ 23
Chart 32 Used Various Sources of Information to Learn about Social Security
by Household Income ___________________________________________24
Chart 33 Have Used the Internet and Online Resources to Find Out about Social
Security Benefits by Household Income _____________________________25
Chart 34 Time Since Last Reviewed Estimated Social Security Benefits by
Household Income ______________________________________________25
Chart 35 Information Sources Used by Use of Professional Financial Advisor _______26
Chart 36 Use of the Internet and Internet-based Resources to Learn about Social
Security by Use of Professional Financial Advisor ______________________27
Chart 37 Demographic Profile of Respondents ________________________________28
Chart 38 Current Retirement Plans _________________________________________29
Chart 39: Retirement Income Sources by Household Income _____________________29

Perspectives of Future Social Security Beneficiaries Ages 45-64: Detailed Findings 1
Executive Summary
With the recent celebration of Social Security’s 80th birthday, AARP’s Social Security Anniversary survey
shows that Americans of all ages, political ideologies, and incomes support the program.1 While we
know that Americans find Social Security to be one of the most important government programs, we are
less certain of the level of knowledge that they have related to policies around when and how to claim
benefits. Since how and when a beneficiary claims their Social Security benefits affects their monthly
amount, these decisions could have costly implications.
AARP sought to understand what future beneficiaries know about Social Security claiming policies, what
sources of information they use to educate themselves, and how large of a share Social Security will be
in their retirement income.2 AARP fielded a nationally representative survey to 1,215 adults ages 45-64
who are not yet receiving Social Security benefits (neither disability or retirement), but who will
ultimately be able to receive Social Security retirement benefits based on their own work history by age
62. The questionnaire was fielded using GfK’s Knowledge Panel, a probability-based online panel.
Results were weighted to the US population ages 45-64 who are eligible for Social Security retirement
benefits based on their own work history and are not currently on disability.
Key findings include:
Future beneficiaries place the highest importance on maximizing the amount of money they (or
they and their spouse) receive in retirement and in understanding the best age to claim benefits
(96% very or somewhat important). Least important to them is claiming benefits while they are
still working (47%).
Approximately half of consumers ages 45-64 expect that Social Security will be a major source of
their household retirement income, 39 percent of whom expect it to make up 50 percent or
more of their retirement income.
Nearly one half (47%) say they are very or somewhat knowledgeable about how their benefits
will be determined and just over six in ten know that age 62 is the earliest age that they can
claim benefits.
A large majority of future beneficiaries (88%) know that waiting from age 62 until their full
retirement age would increase their benefit amount, yet only one third know that claiming at
age 70 will result in their maximum benefit amount.
Just over one quarter (27%) of the entire sample of future beneficiaries knows that, when
benefits are withheld due to work income prior to full retirement age, they will get the benefits
back over time (in this example, $40,000 per year was used).
Half of respondents who have ever been married know they can receive Social Security benefits
based on their living spouse’s work history. Well over nine in 10 know they can receive such
1The Social Security Anniversary Survey report is available from www.aarp.org/ss80
2This research was fielded to future beneficiaries. A companion survey was fielded to CERTIFIED FINANCIAL
PLANNER™ (CFP®) professionals via The Financial Planning Association. A separate report including select resultsfrom both surveys is available at www.aarp.org/SocialSecurityPlanning .

Perspectives of Future Social Security Beneficiaries Ages 45-64: Detailed Findings 2
benefits after the death of their spouse. They are less certain how the age that both the
deceased spouse and the age that the surviving spouse claim(ed) these benefits matters.
Approximately one quarter of ever-married respondents know that a divorcee can collect Social
Security benefits based on the ex-spouse’s work history if they were married at least 10 years.
An additional third (34%) believe they can collect if married five or fewer years and 31 percent
believe they could never collect benefits from an ex-spouse’s work record.
The two most common sources of information related to Social Security retirement benefits are
friends and family (46%) and the Social Security Administration (45%). Less commonly used
sources include newspaper articles (33%), financial magazines or books (22%), financial shows
on television (17%), AARP (16%), a professional financial advisor (16%), and/or a current or
former employer (16%).
Findings show a Social Security knowledge gap for Americans ages 45-64 that could severely impact
future benefits and retirement plans. It is important that Americans educate themselves about the rules
and policies of the Social Security program to allow them to make the best decisions for themselves and
their families.

Perspectives of Future Social Security Beneficiaries Ages 45-64: Detailed Findings 3
INTRODUCTION
With the recent celebration of Social Security’s 80th birthday, AARP’s Social Security Anniversary survey,
which is described in a separate publication3, shows that Americans of all ages, political ideologies, and
incomes support the program. While we know that Americans find Social Security to be one of the most
important government programs, we are less certain of the level of knowledge that they have related to
policies around when and how to claim benefits. Since how and when a beneficiary claims their Social
Security benefits affects their monthly amount, these decisions could have costly implications.
AARP sought to understand what future beneficiaries know about Social Security claiming policies, what
sources of information they use to educate themselves, and how large of a share of their retirement
income they expect Social Security will be. AARP fielded a nationally representative survey to 1,215
adults ages 45-64 who are not yet receiving Social Security benefits (neither disability or retirement), but
who will ultimately be able to receive Social Security retirement benefits based on their own work
history by age 62. The questionnaire was fielded using GfK’s Knowledge Panel, a probability-based
online panel. Results were weighted to the US population ages 45-64 who are eligible for Social Security
retirement benefits based on their own work history and are not currently on disability.
Findings show that future Social Security beneficiaries expect to rely on Social Security income for a
substantial share of their retirement income. However, the survey finds that future beneficiaries do not
fully understand the impact of their claiming decisions. This reveals a knowledge gap that may
undermine their retirement expectations. In fact, general knowledge questions show that they are
objectively somewhat knowledgeable about basic issues like earliest age they can claim Social Security
benefits and ability to claim widow benefits. However, the survey finds they are less knowledgeable
about the intricacies of how and the degree to which some of the Social Security claiming rules affect
benefit dollar amounts—how much money are they losing out on OR will they find themselves with a
shortfall when their benefits are not as high as they expected?
The survey of Social Security beneficiaries4 discussed in this report represents one of the two surveys
highlighted in a cobranded report released by AARP and the Financial Planning Association. That report,
also available from www.aarp.org/SocialSecurityPlanning, presents select results from future
beneficiaries alongside survey results from CERTIFIED FINANCIAL PLANNER™ (CFP®) professionals. Results for
the entire sample of future beneficiaries are presented here and followed in each section by significant
survey differences by age group (45-54; 55-64), household income (Less than $50,000 per year; $50,000-
$100,000 per year; $100,000+ per year), and if they have used a professional financial advisor (p<.05).
3The Social Security Anniversary Survey report is available from www.aarp.org/ss80
4The terms ‘future beneficiary’, ‘consumer’, and ‘respondent’ are used interchangeably in this report to refer to the
sample.

Perspectives of Future Social Security Beneficiaries Ages 45-64: Detailed Findings 4
DETAILED FINDINGS
Priorities and Expectations of the Role of Social Security in Retirement
Future beneficiaries place the highest importance on maximizing the amount of money they (or they
and their spouse) receive in retirement and in understanding the best age to claim benefits (96% very or
somewhat important). Least important to them is claiming benefits while they are still working (47%).
[See chart 1 and chart 2]
"When thinking about your Social Security retirement benefits, how important is each of the following to you personally? "
Based on total respondents, n=1215
"When thinking about your Social Security retirement benefits, how important is each of the following to you personally? "
(Based on married respondents, n=777)
77% 74%
47%22%
19% 22%
31%
26%
0%10%20%30%40%50%60%70%80%90%
100%
Maximizingamount ofmoney in
retirement
Understandingbest age to
claim benefits
Understandingearliest age
they can claimbenefits
Claimingbenefits whilestill working
Chart 1: Importance of selected factors in SocialSecurity claiming decisions: All respondents
Somewhat Important
Very Important
96%
47%
78%
96%
79%
55%
17%
28%
0%10%20%30%40%50%60%70%80%90%
100%
Maximizing amount of moneyfor self plus spouse in
retirement
Maximizing amount of moneythat spouse receives after their
death
Chart 2: Importance of selected factors in SocialSecurity claiming decisions: Married respondents only
Somewhat Important
Very Important
96%
83%

Perspectives of Future Social Security Beneficiaries Ages 45-64: Detailed Findings 5
Approximately half (49%) of future beneficiaries expect that Social Security benefits will comprise a
major source of their retirement income. Nearly as many (47%) say it will be a minor source. Most
commonly, 19 percent indicated that they will rely on Social Security benefits for between 21-30 percent
of their household retirement income; 39 percent expect to rely on it for more than 50 percent of their
retirement income. [See chart 3]
"What percent of your household income in retirement do you expect will come from (your and your spouse’s) / (your and your
partner’s) / (your) Social Security retirement benefits?" Base: Social Security will be a source of retirement income; n=1170.
Priorities by Age
Consumers5 ages 55-64 are more likely than those ages 45-54 to say that Social Security is expected to
be a major source of retirement income. [See chart 4] Ever-married older consumers are also slightly
more likely to identify maximizing the amount of money they and their spouse receive in retirement as
very or somewhat important (98% vs 95%).
5“Consumer” and “future beneficiary” are used interchangeably to refer to the survey respondents.
9%
7%
7%
7%
9%
12%
13%
19%
12%
5%
0% 10% 20% 30% 40% 50%
91-100%
81-90%
71-80%
61-70%
51-60%
41-50%
31-40%
21-30%
11-20%
1-10%
Chart 3: Social Security's expected share of householdincome in retirement
1-50% = 61%
51-100% = 39%

Perspectives of Future Social Security Beneficiaries Ages 45-64: Detailed Findings 6
“In thinking about possible sources of income in retirement, do you expect [your][your and your spouse’s][your and your
partner’s] Social Security retirement benefits will be a major source of income, a minor source of income, or not a source of
income in [your][your and your spouse’s][your and your partner’s] retirement?
Priorities by Household Income
Middle income respondents6 ($50-100k/year) were most likely to say maximizing the amount they
receive in retirement is very or somewhat important (98% vs 94% for <$50k/year and 95% for
$100k+/year). Lowest income respondents were most likely to find claiming benefits while still working
and understanding the earliest ages to claim as very or somewhat important, relative to middle and
highest income respondent. [See chart 5]
"When thinking about your Social Security retirement benefits, how important is each of the following to you personally? "
6For purposes of this paper, we refer to lowest income respondents as those with less than $50,000 in annual
household income; middle income respondents are those with between $50,000 and less than $100,000 in annualhousehold income; and highest income respondents as those making $100,000+ per year in household income.
44%51%
56%
42%
0%
20%
40%
60%
80%
Major source Minor source
Chart 4: Social Security expected to be asource of retirement income by age
Ages 45-54(n=618)
Ages 55-64(n=587)
94%
61%
90%98%
48%
80%
95%
38%
67%
0%10%20%30%40%50%60%70%80%90%
100%
Maximizingamount you
receive inretirement
Claiming benefitswhile still working
Understandingearliest age you
can claim
Chart 5: Social Security planning priorites byhousehold income
<$50,000/yr(n=447)
$50-100,000 /yr(n=415)
$100,000+/yr(n=336)

Perspectives of Future Social Security Beneficiaries Ages 45-64: Detailed Findings 7
Not surprisingly, as incomes increase, expected reliance on Social Security for retirement income
decreases. Nearly two thirds (65%) of households with incomes less than $50,000 per year expect Social
Security will be a major source of retirement income, 37 percent of whom will rely on it for 80-100
percent of retirement income. Just over half (54%) of those with household incomes between $50,000
and $100,000 expect Social Security to be a major source of retirement income, with only 14 percent
expecting to rely on it for 80-100 percent of retirement income. Finally, just over one third (35%) of
respondents with highest household income ($100,000+) expect Social Security to be a major source of
retirement income, with only five percent expecting to rely on Social Security for 80-100 percent of
retirement income. [See chart 6]
“In thinking about possible sources of income in retirement, do you expect [your][your and your spouse’s][your and your
partner’s] Social Security retirement benefits will be a major source of income, a minor source of income, or not a source of
income in [your][your and your spouse’s][your and your partner’s] retirement?” Bases: <$50,000/yr n=447; $50,000-$100,000
n=415; $100,000+/yr n=336. “ What percent of your household income in retirement do you expect will come from (your and
your spouse’s)/(your/your partner’s)/ (your) Social Security retirement benefits?” Bases: <$50,000/yr n=424; $50,000-$100,000
n=405; $100,000+/yr n=326.
Priorities by Professional Financial Advisor Client
Respondents who have not used a professional financial advisor are more likely than those who have to
say they expect to rely on Social Security benefits for 80-100 percent of their retirement income (18% vs
5%).
Social Security Knowledge
When describing how knowledgeable they believe they are about how their benefits will be determined,
nearly half (47%) say they are very or somewhat knowledgeable. [See chart 7]
65%
30%
19%
37%
54%
43%
28%
14%
35%
62%
54%
5%
0%
20%
40%
60%
80%
Major source Minor source 1-30% ofincome
80-100% ofincome
Chart 6: Social Security expected to be a sourceof retirement income by household income
<$50,000/yr
$50-100,000 /yr
$100,000+/yr

Perspectives of Future Social Security Beneficiaries Ages 45-64: Detailed Findings 8
"How knowledgeable do you feel you are about how your Social Security retirement benefits are determined?" n=1215
Claiming Age
Just over six in 10 respondents know that 62 is the earliest age that they can claim Social Security
retirement benefits. Almost two in 10, however, believe they cannot collect before age 65 and another
nine percent believe they can claim prior to age 62. [See chart 8]
"To your knowledge, what is the earliest age at which people can start collecting Social Security retirement benefits?" n=1,215
Although the majority of future beneficiaries know the earliest age that they can claim benefits, only 16
percent say they plan to claim at age 627. One quarter expect that they will claim at age 66 or 67, which
includes full retirement age for all respondents. Seventeen percent plan to claim at age 70 or older, thus
receiving their maximum benefit. [See chart 9]
7This includes those who are ages 63 or 64 and thus cannot claim at age 62. When respondents ages 63 or 64 are
removed from the sample, 17 percent say they plan to claim benefits at age 62.
9%
38% 37%
16%
0%
10%
20%
30%
40%
50%
Veryknowledgeable
Somewhatknowledgeable
A littleknowledgeable
Not at allknowledgeable
Chart 7: Self-reported knowledge abouthow Social Security retirement benefits are
determined
9%
61%
30%
0%
20%
40%
60%
80%
Less than age 62 Age 62 (correct) Age 63 or over
Chart 8: Knowledge of earliest age thatone can begin collecting Social Security
retirement benefits

Perspectives of Future Social Security Beneficiaries Ages 45-64: Detailed Findings 9
*Age group that includes full retirement age for all respondents. “At what age do you expect to start collecting Social Security
retirement benefits?” n=1,215.
More than four in 10 (43%) expect that their monthly Social Security benefit will be $1,000 or less per
month (an amount that, if relied on for 100% of retirement income would place them just above the
poverty line for ages 65+). [See chart 10] The average response given was $1,363, higher than the
current average benefit of $1,290 for retirement benefits.8
n=1,215 “How much do you think your monthly Social Security retirement benefits will be if you start collecting benefits at
(expected claim age) and (you are no longer working for pay at that time)/(you are still working for pay at that time)? (Please
assume that any future changes to Social Security will not affect your benefits.) Mean response=$1,363.
A large majority of future beneficiaries (88%) know that waiting from age 62 until their full retirement
age (either age 66 or 67 for respondents in this survey, depending on their year of birth) would increase
their benefit amount. Unfortunately, only five percent know the degree to which those benefits would
8Social Security Administration. Monthly Statistical Snapshot, July 2015.
http://www.ssa.gov/policy/docs/quickfacts/stat_snapshot/
3%
16%
34%
25%
5%
17%
0%
5%
10%
15%
20%
25%
30%
35%
40%
45%
50%
52-61 62 63-65 66-67* 68-69 70+
Chart 9: Expected claiming age for SocialSecurity benefits
13%
30%
12%
28%
15%
0%
10%
20%
30%
40%
50%
Under $500 $500-1,000 $1,001-1,250 $1,250-2,000 $2,001+
Chart 10: Expected monthly Social Security benefit

Perspectives of Future Social Security Beneficiaries Ages 45-64: Detailed Findings 10
increase by waiting those additional years -- 25-30 percent depending on their birth year. Even when
looking more liberally at those respondents whose estimates were within five percentage points (+/-)
from the correct answer, still only 15 percent are correct9. Sixteen percent would overestimate by more
than five percentage points, and 67 percent would underestimate by more than five percentage points
the impact of waiting. [See chart 11]
“Assume that your monthly Social Security retirement benefit would be $1,000 if you start collecting Social Security at age 62.
By how much do you think your monthly benefit would increase if you waited until age [FRA] to start collecting Social Security
benefits?” n=1,054 Respondents who knew benefit would be higher.
Still fewer future beneficiaries - only 57 percent- know that waiting just one year past one’s full
retirement age can result in further increases in benefits – leaving 42 percent who believe benefits will
stay the same or be reduced after age 66 or 67. In fact, only one third know that waiting until age 70
will maximize their benefits and 15 percent believe they need to wait to claim until after age 70 to
receive their highest possible monthly benefit. [See chart 12] This misinformation can put beneficiaries
at risk of losing out on monthly benefits if they wait to claim until after age 70 or of receiving a smaller
benefit than they had estimated.
9Correct answers for the range were (a) 20-30 percent increase for those with a full retirement age of 66; or (b) 25-35
percent increase for those with a full retirement age of 67.
5%
15% 16%
67%
0%
10%
20%
30%
40%
50%
60%
70%
80%
Know exactpercentage
increase
Knowpercentage
increase within+/- 5%
Overestimateimpact onbenefits
Underestimateimpact onbenefits
Chart 11: Knowledge of percent increase inbenefits by waiting from age 62 until FRA

Perspectives of Future Social Security Beneficiaries Ages 45-64: Detailed Findings 11
"What is the earliest age at which you should start collecting Social Security retirement benefits if you wanted to receive your
highest possible monthly benefit? (If you’re not sure, please provide your best guess.)" n=1,215
The Earnings Test
Future beneficiaries are aware that work earnings can reduce benefits claimed prior to full retirement
age (84% know that benefits would be affected and 76% of those know it would be by way of a
reduction)10. However, 42 percent of those know that they will get those benefits back over time; they
are not permanently lost. [See chart 13] This totals just over one quarter (27%) of the entire sample of
future beneficiaries who know that earnings can reduce benefits but they will get them back. Many of
them might ultimately continue to work longer if they knew they would not be permanently penalized
for exceeding the earnings thresholds (for 2015 this amount is $15,720).
Base: Respondents who know work earnings can reduce benefit amount before full retirement age. n=786. “Which of the
following best describes your understanding of the reduction in your current monthly Social Security retirement benefit due to
your salary from work?”
10This example used annual earnings of $40,000.
15%
34% 32%
15%
0%
10%
20%
30%
40%
50%
62-65 66-69 70 (correct) 71+
Chart 12: Earliest age to claim Social Securityto receive highest possible monthy benefit
57%
42%
0%
20%
40%
60%
You will never get back thebenefits that were withheld
After you reach a certain age,you will gradually get back the
benefits that were withheld
Chart 13: Understanding the nature ofreduction in current monthly Social
Security benefits due to salary from work

Perspectives of Future Social Security Beneficiaries Ages 45-64: Detailed Findings 12
Living Spouse & Widow/widower Benefits
Just half of respondents who have ever been married11 know that they could receive Social Security
benefits based on their spouse’s work history, even when the spouse is still alive. Knowledge skyrockets
when asked about survivor benefits. The overwhelming majority of respondents know that a surviving
spouse can collect widow benefits after their spouse dies, both if the surviving spouse has never worked
(97%) or if the surviving spouse has sufficient work history to collect based on their own record (93%).
[See chart 14]
Base: Respondents who have ever been married. N=1,023. “Assume that Tom and Mary are married. Both are 62 years old.
Mary has never worked but Tom has worked long enough to be eligible for Social Security Benefits. To the best of your
knowledge, could Mary receive Social Security spouse benefits based on Tom’s benefits while he is still alive?” “…if Tom dies
before Mary, could Mary receive Social Security widow benefits after Tom dies?” “…In this case, assume that Mary and Tom
have each worked long enough to be eligible for Social Security retirement benefits. Mary has worked for fewer years than
Tom, and Mary’s earnings in a typical year are always much less than Tom’s earnings. If Tom dies before Mary, could Mary
receive Social Security widow benefits after Tom dies?”
Even among ever-married respondents who know that they can receive widow benefits, 20 percent do
not know that the age that the deceased spouse starts collecting their benefits will affect the amount of
widow benefits. Further, of those who know that widow benefits exist, only 20 percent correctly
identify 70 as the age at which a spouse must claim benefits in order to maximize benefits for his widow.
[See chart 15] Additionally, just over one half of those who know about widow benefits know that the
age that the surviving spouse claims their widow benefit also matters; only seven percent correctly
identify the age (equivalent to full retirement age) at which a widow will maximize benefits, though 40
percent select at or within one year of the correct age.
11This includes currently married, divorced, widowed, and separated. This does not include those who were never
married or those who are living with a partner. Base for all questions related to ever-married, including spousal,widow/survivor, and ex-spouse benefits, is n=1023.
50%
97% 93%
0%
20%
40%
60%
80%
100%
Know non-workingspouse can collect
spousal benefits whenspouse is living
Know non-workingspouse can collect widow
benefits when spousehas died
Know working spousecan collect widow
benefits from deceasedspouse's work record
Chart 14: Knowledge of benefits collected froma spouse's work history

Perspectives of Future Social Security Beneficiaries Ages 45-64: Detailed Findings 13
"What is the earliest age at which Tom should start collecting his Social Security retirement benefits if he wants Mary to receive
the highest possible monthly widow benefit in case he dies before her?" Base: Believes widow can receive partner's benefits
after death when both were working, n=947
Benefits for Divorced Individuals
Benefits for divorced Americans are available to unmarried ex-spouses if the couple was married for 10
or more years. Thirty four percent of ever-married respondents believed that a divorcee could collect
off of the ex-spouse’s work record if they were married five years or less, 26 percent correctly identified
10 years as the minimum duration, and 31 percent believe they could never collect Social Security
benefits based on the ex-spouse’s work record, regardless of number of years married. [See chart 16]
This could lead to an ex-spouse foregoing a higher benefit (or any benefit at all, if they have not worked
for pay for 10+ years to qualify on their own) due to lack of knowledge.
Base: Ever-married, n=1,023. “Assume that Susan and Rich divorce after five years of marriage. If Susan is unmarried at the
time she becomes eligible for Social Security, would she be eligible to file for Social Security spousal benefits on Rich’s work
record?” “In order for Susan to be eligible to file for Social Security spousal benefits on Rich’s work record, what is the
minimum number of years that she would have had to have been married to Rich?”
30%
39%
20%
11%
0%
10%
20%
30%
40%
50%
62-65 66-69 70 (correct) 71+
Chart 15: Earliest age at which spouseshould claim Social Security benefits to
maximize benefits for his widow
34%
5%
26%
4%
31%
0%
10%
20%
30%
40%
Five years orfewer
6-9 years 10 years(correct)
11+ years Never
Chart 16: Number of years consumers believe acouple must be married to collect Social Security
benefits on the ex-spouse's work record
Perspectives of Future Social Security Beneficiaries Ages 45-64: Detailed Findings 14
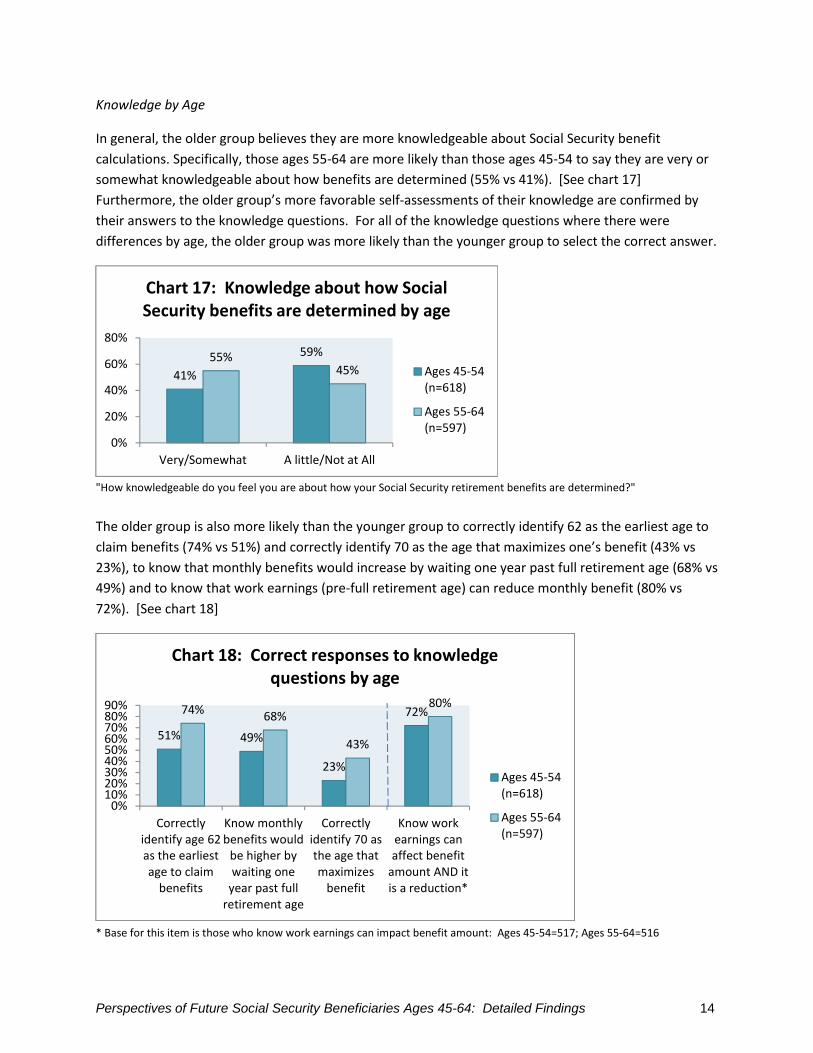
Knowledge by Age
In general, the older group believes they are more knowledgeable about Social Security benefit
calculations. Specifically, those ages 55-64 are more likely than those ages 45-54 to say they are very or
somewhat knowledgeable about how benefits are determined (55% vs 41%). [See chart 17]
Furthermore, the older group’s more favorable self-assessments of their knowledge are confirmed by
their answers to the knowledge questions. For all of the knowledge questions where there were
differences by age, the older group was more likely than the younger group to select the correct answer.
"How knowledgeable do you feel you are about how your Social Security retirement benefits are determined?"
The older group is also more likely than the younger group to correctly identify 62 as the earliest age to
claim benefits (74% vs 51%) and correctly identify 70 as the age that maximizes one’s benefit (43% vs
23%), to know that monthly benefits would increase by waiting one year past full retirement age (68% vs
49%) and to know that work earnings (pre-full retirement age) can reduce monthly benefit (80% vs
72%). [See chart 18]
* Base for this item is those who know work earnings can impact benefit amount: Ages 45-54=517; Ages 55-64=516
41%
59%55%45%
0%
20%
40%
60%
80%
Very/Somewhat A little/Not at All
Chart 17: Knowledge about how SocialSecurity benefits are determined by age
Ages 45-54(n=618)
Ages 55-64(n=597)
51% 49%
23%
72%74%68%
43%
80%
0%10%20%30%40%50%60%70%80%90%
Correctlyidentify age 62as the earliestage to claim
benefits
Know monthlybenefits would
be higher bywaiting one
year past fullretirement age
Correctlyidentify 70 asthe age thatmaximizes
benefit
Know workearnings canaffect benefit
amount AND itis a reduction*
Chart 18: Correct responses to knowledgequestions by age
Ages 45-54(n=618)
Ages 55-64(n=597)

Perspectives of Future Social Security Beneficiaries Ages 45-64: Detailed Findings 15
For those who have ever been married, older consumers (ages 55-64) are more likely than younger
consumers (ages 45-54) to know that a spouse can collect spousal benefits even while the higher
earning spouse is still alive (56% vs 45%), correctly identify 70 as the age that the spouse should have
started collecting benefits in order to maximize amount of the widow benefit (27% vs 14%), and
correctly identify that the surviving spouse should start collecting widow benefits at their own full
retirement age to maximize the widow benefit (13% vs 3%). They are also more likely to correctly
identify 10 years as the minimum number of years a couple must be married for an ex-spouse to claim
benefits off of the ex’s work record (29% vs 23%). Younger ever-married respondents were more likely
than the older group to believe they can never claim off of an ex-spouse’s work record (35% vs 26%).
[See chart 19]
Base: Ever-married. “Assume that Susan and Rich divorce after five years of marriage. If Susan is unmarried at the time she
becomes eligible for Social Security, would she be eligible to file for Social Security spousal benefits on Rich’s work record?” “In
order for Susan to be eligible to file for Social Security spousal benefits on Rich’s work record, what is the minimum number of
years that she would have had to have been married to Rich?”
Knowledge by Household Income
Respondents with the highest household incomes ($100,000+/year) report a Social Security knowledge
level higher than the knowledge level reported by those with the lowest household incomes (53% vs
39%). Overall, because the two highest household income groups gave more correct answers to the
knowledge questions in the survey, it appears that they are in fact more knowledgeable than the lowest
household income group, specifically related to knowing the earliest possible age to claim Social Security
benefits, that monthly benefits would be higher by waiting from age 62 until full retirement age, and
correctly identify 70 as the age that maximizes benefit amounts. [See chart 20]
23%
35%29%
26%
0%
20%
40%
60%
Correctly identify that 10 years isminumum
Incorrectly believe cannot everclaim off ex's work record
Chart 19: Beliefs about the number of years ex-spouses must be married to claim benefits off the
ex’s work record by age
Ages 45-54(n=492)
Ages 55-64(n=531)

Perspectives of Future Social Security Beneficiaries Ages 45-64: Detailed Findings 16
Respondents with highest incomes are more likely than those with lowest incomes to know that
monthly benefits would be higher by waiting one year past full retirement age (63% vs 50%) and know
that work earnings can reduce one’s benefit amount (81% vs 68%). [See chart 21]
Base sizes vary. Know monthly benefit would be higher by waiting – base=total. <$50,000/yr n=447; $100,000+/yr n=336.
Know work earnings can reduce benefit – base= of those who know work can affect benefit amount prior to full retirement age.
<$50,000/yr n=380; $100,000+ n=282.
For ever-married consumers, highest household income respondents were more likely than lowest
household income respondents to correctly identify 70 as the age that a spouse should have started
collecting benefits in order to maximize the amount of widow benefit (25% vs 13%).
49%
77%
22%
61%
91%
33%
69%
92%
36%
0%10%20%30%40%50%60%70%80%90%
100%
Correctly identifyage 62 as theearliest age toclaim benefits
Know thatmonthly benefitswould be higher ifthey waited from
62 until FRA
Correctly identify70 as the age thatmaximizes benefit
Chart 20: Select knowledge itemsby houshold income
<$50,000/yr(n=447)
$50-100,000 /yr(n=415)
$100,000+/yr(n=336)
50%
68%63%
81%
0%10%20%30%40%50%60%70%80%90%
Know monthlybenefits would behigher by waitingone year past full
retirement age
Know workearnings can
reduce benefitamount*
Chart 21: Select knowledge items: Highestversus lowest household incomes
<$50,000/yr
$100,000+/yr

Perspectives of Future Social Security Beneficiaries Ages 45-64: Detailed Findings 17
Knowledge by Professional Financial Advisor Client
Respondents who have consulted with a professional financial advisor self-report a higher level of
knowledge than do those who have not consulted one (62% very or somewhat knowledgeable vs 44%).
Where there are differences in knowledge, respondents who have seen a financial advisor are more
knowledgeable than those who have not; particularly, they are more likely to correctly identify 62 as the
earliest age to claim benefits (71% vs 59%) and to know monthly benefits would be higher by waiting
one year past full retirement age (69% vs 55%). [See chart 22]
Confidence in Social Security and Solvency
More than half of consumers are either not too or not at all confident (55%) that the Social Security
system will be able to provide them with benefits at least equal in value to those received by today’s
retirees. Only seven percent are very confident. [See chart 23]
"How confident are you that the Social Security system will provide you with Social Security retirement benefits that are at least
equal in value to the benefits received by retirees today?" n=1215
71% 69%59% 55%
0%
20%
40%
60%
80%
Correctly identify age 62 asthe earliest age to claim
benefits
Know monthly benefits wouldbe higher by waiting one year
past full retirement age
Chart 22: Social Security knowledge differencesby professional financial advisor use
Used professionalfinancial advisor(n=182)
Did not useprofessionalfinancial advisor(n=1,033)
7%
38% 38%
17%
0%
10%
20%
30%
40%
50%
Very confident Somewhat confident Not too confident Not at all confident
Chart 23: Confidence in the future of Social Securitybenefits

Perspectives of Future Social Security Beneficiaries Ages 45-64: Detailed Findings 18
Possibly tied to confidence in their future Social Security benefits, just over one quarter (27%) know that
Social Security can pay full benefits for 10-20 years (without any changes). Just three percent know that,
even once the trust fund is depleted, beneficiaries will still receive approximately 75 percent of full
benefit levels nearly indefinitely. Nearly four in 10 believe Social Security would only be able to pay out
the reduced amount for fewer than 10 years. [See chart 24]
"If no changes are made to the Social Security system, how long do you think Social Security would be able to continue paying
out benefits at the current level?" "Suppose you knew that after 2033, Social Security benefits would have to be cut by twenty-
five percent because of a shortfall in funds. After 2033, how long do you think Social Security could continue paying out these
reduced benefits without implementing further cuts?" n=1,215
Confidence by Age
Older respondents (ages 55-64) were more likely than younger respondents to be very or somewhat
confident that Social Security will be able to provide benefits in the future equal to those received by
beneficiaries today (56% vs 38%).
Confidence by Professional Financial Advisor Client
Consumers who have used a professional financial advisor are more confident than those who have not
that Social Security will provide benefits to them equal to today’s (60% very or somewhat confident vs
43%).
Information Sources Used
Nearly half (46%) of future beneficiaries consult family or friends to learn about Social Security
retirement benefits, just slightly higher than the number who use the Social Security Administration
(45%). These are distantly followed by newspaper articles (33%), financial magazines or books (22%),
and financial shows on television (17%). [See chart 25] While the use of the Social Security
19%
27%
18%
6%3%
5%
21%
39%
18%
7%
2% 2% 3%
29%
0%5%
10%15%20%25%30%35%40%45%50%
Lessthan 10
years
10 - 20years
21 - 30years
31 - 40years
41 - 50years
Morethan 50
years
Don’tknow
Chart 24: How long Social Security can pay100% and 75% of benefits
Believe will beable to pay100% ofbenefitsBelieve will beable to pay 75%of benefits

Perspectives of Future Social Security Beneficiaries Ages 45-64: Detailed Findings 19
Administration is encouraging, the similar percentage for friends and family means that potential
misconceptions or bad information can be passed along as fact.
"Have you used any of the following information sources to learn about Social Security retirement benefits or when to start
collecting your benefits?" n=1215
Consumers seemed to find all sources of information to be at least somewhat useful. All information
sources were viewed as somewhat or very useful by at least three quarters of respondents who had
used them. Of those information sources consulted, professional financial advisors were the most
useful (as measured by rating of very and somewhat useful), followed by the Social Security
Administration, and AARP. Two out of the three top-rated sources, however, were only used by 16
percent of respondents each. [See chart 26]
3%
3%
4%
5%
7%
9%
10%
16%
16%
16%
17%
22%
33%
45%
46%
0% 10% 20% 30% 40% 50%
A class or seminar at a local college
An attorney
Public library
Your current or former labor union
An accountant
A financial services firm
A professional tax preparer or tax advisor
Your current or former employer
AARP
A professional financial advisor
Financial shows on TV
Financial magazines or books
Newspaper articles
The Social Security Administration
Friends or family members
Chart 25: Information sources used by consumers tolearn about Social Security retirement benefits

Perspectives of Future Social Security Beneficiaries Ages 45-64: Detailed Findings 20
"How useful were these in helping you learn about Social Security retirement benefits or when to start collecting your
benefits?" Respondents were asked to rate the usefulness only of resources that they had used according to their responses
QC18. Base sizes vary. Current/former labor union, class or similar at a local college, public library, and mobile phone app are
not included due to low base sizes/low number of users. Base sizes vary. Current/former labor union, class or similar at a local
college, public library, and mobile phone app are not included due to low base sizes/low number of users.
One way to access some of these sources of information is by using the internet. Various tools,
calculators, and resources exist to help the future beneficiary to understand the Social Security program.
Nearly one third (31%) have used an online Social Security calculator, with the most popular being on
the Social Security Administration’s website (81% of those who have used a Social Security calculator
used it on the SSA website). Much less commonly used are calculators from the retirement plan
provider (14%) and at AARP (11%). Thirty nine percent use the internet in general to learn about Social
Security benefits and a mere paucity (2%) have used a mobile phone application. [See chart 27]
Have you used either of the following tools to estimate your Social Security retirement benefits or learn when to start collecting
your benefits?” “Have you used the internet to learn about Social Security retirement benefits or when you should start
collecting your benefits?” n=1,215
14%
22%
22%
33%
25%
38%
39%
34%
50%
56%
62%
57%
61%
51%
61%
50%
50%
57%
44%
40%
0% 20% 40% 60% 80% 100%
Newspaper article (n=406)
Financial shows on TV (n=205)
Financial magazines or books (n=256)
Your current or former employer (n=205)
Friends or family members (n=552)
An online Social Security calculator (n=370)
A financial services firm (n=103)
AARP (n=220)
The Social Security Administration (n=565)
A professional financial advisor (n=182)
Chart 26: Usefulness of each source of information (if used)
Very useful
Somewhat useful
39%
31%
2%
0%
10%
20%
30%
40%
50%
Internet Online calculator Mobile phoneapplication
Chart 27: Online tools and resources used tolearn about or calculate Social Security
benefits

Perspectives of Future Social Security Beneficiaries Ages 45-64: Detailed Findings 21
Nearly two thirds (64%) have reviewed their estimated Social Security retirement benefits in the past 2
years, 37 percent of whom reviewed them in the last 12 months. [See chart 28]
"When was the last time you reviewed your estimated Social Security retirement benefits?" n=1215
Information Sources by Age
Consumers ages 55-64 were more likely than those ages 45-54 to have learned about Social Security
benefits by using the Social Security Administration (55% vs 37%), AARP (26% vs 9%), a financial services
firm (12% vs 7%), a professional financial advisor (20% vs 12%), financial magazines/books (26% vs 19%),
newspaper articles (40% vs 28%), and an accountant (9% vs 5%). [See chart 29] They were also more
likely to have used an online Social Security calculator (40% vs 25%), specifically one from
www.socialsecurity.gov (86% vs 74% of those who had used an online calculator), and to have used the
internet to learn about Social Security benefits or when to start collecting them (50% vs 31%). [See
chart 30]
37%
27%
14%
2% 1%
11%8%
0%
10%
20%
30%
40%
50%
< 12 monthsago
1-2 yearsago
3-5 yearsago
6-9 yearsago
≥ 10 years ago
Don’tKnow/Don’tRemember
Never
Chart 28: Last reviewed estimated Social Securitybenefits

Perspectives of Future Social Security Beneficiaries Ages 45-64: Detailed Findings 22
"Have you used any of the following information sources to learn about Social Security retirement benefits or when to start
collecting your benefits?"
* Base for “Used socialsecurity.gov calculator” is those who have used an online Social Security calculator. Ages 45-54 n=137;
Ages 55-64=233. ”Have you used either of the following tools to estimate your Social Security retirement benefits or learn
when to start collecting your benefits?” “Have you used the internet to learn about Social Security retirement benefits or when
you should start collecting your benefits?”
Older respondents were more likely than younger respondents to have checked their estimated Social
Security benefits within the past 12 months (48% vs 27%), while younger consumers were more likely to
have reviewed them in the past 3-5 years (16% vs 11) and to have never checked them (10% vs 5%).
[See chart 31]
37%
9%
7%
12%
19%
28%
5%
55%
26%
12%
20%
26%
40%
9%
0% 20% 40% 60% 80%
SSA
AARP
Financial services firm
Professional financial advisor
Financial magazines/books
Newspaper articles
Accountant
Chart 29: Used various sources of informationto learn about Social Security by age
Ages 55-64(n=597)
Ages 45-54(n=618)
25%
74%
31%40%
86%
50%
0%10%20%30%40%50%60%70%80%90%
100%
Online SocialSecurity calculator
Usedsocialsecurity.gov
calculator*
Used the internetto learn aboutSocial Security
benefits/when tostart collecting
Chart 30: Used the internet and online tools forSocial Security information by age
Ages 45-54(n=618)
Ages 55-64(n=597)

Perspectives of Future Social Security Beneficiaries Ages 45-64: Detailed Findings 23
"When was the last time you reviewed your estimated Social Security retirement benefits?"
Information Sources by Household Income
In nearly all cases, highest income respondents were more likely than both middle and lowest income
respondents to have used various sources to get information about Social Security, including: a financial
services firm, a professional financial advisor, financial magazines and books, newspaper articles, and a
professional tax preparer/advisor. Both highest and middle household income consumers were more
likely than lowest income consumers to have used an accountant to get information about Social
Security. [See chart 32]
27%
16%10%
13%
48%
11%
5%8%
0%
20%
40%
60%
Past 12months
Past 3-5 years Never Don’t know
Chart 31: Time since last reviewed estimatedSocial Security benefits by age
Ages 45-54(n=618)
Ages 55-64(n=597)

Perspectives of Future Social Security Beneficiaries Ages 45-64: Detailed Findings 24
5%
10%
14%
26%
3%
7%
7%
11%
20%
30%
7%
7%
14%
24%
30%
41%
10%
14%
0% 20% 40% 60%
Financial services firm
Professional financial advisor
Financial magazines/books
Newspaper articles
Accountant
Professional tax preparer/advisor
Chart 32: Used various sources of information to learn aboutSocial Security by household income
$100,000+/yr(n=336)
$50-100,000 /yr(n=415)
<$50,000/yr(n=447)
"Have you used any of the following information sources to learn about Social Security retirement benefits or when to start
collecting your benefits?"
A similar trend exists related to going online to find Social Security information. As household income
increases, likelihood of using an online Social Security calculator or other internet resources increases.
[See chart 33]. Similarly, respondents with the highest and middle household incomes were more likely
to have reviewed their estimated Social Security benefits within the past 12 months, relative to the
lowest household incomes (43% highest incomes; 36% middle incomes; 27% lowest incomes).
Respondents with lowest household incomes were more likely to say they have never reviewed their
estimated benefits (relative to highest incomes: 11% lowest incomes; 6% highest incomes) and that
they don’t know when they last reviewed them, relative to middle and highest incomes (16% lowest;
10% middle; 8% highest). [See chart 34]

Perspectives of Future Social Security Beneficiaries Ages 45-64: Detailed Findings 25
”Have you used either of the following tools to estimate your Social Security retirement benefits or learn when to start
collecting your benefits?” “Have you used the internet to learn about Social Security retirement benefits or when you should
start collecting your benefits?”
"When was the last time you reviewed your estimated Social Security retirement benefits?"
Information Sources by Professional Financial Advisor Client
Consumers who have used a professional financial advisor are more likely to have used nearly all of the
information sources than those who had not. This includes the Social Security administration (54% vs
43%), a current or former employer (25% vs 14%), AARP (30% vs 14%), a current or former labor union
(12% vs 4%), a financial services firm (42% vs 3%), financial magazines or books (38% vs 19%), financial
shows on TV (27% vs 15%), a class or seminar at a local college (9% vs 2%), newspaper articles (47% vs
31%), an accountant (25% vs 4%), an attorney (13% vs 1%), and a professional tax preparer (33% vs 5%).
[See chart 35]
18%
27%29%36%
43%51%
0%
10%
20%
30%
40%
50%
60%
Used online Social Securitycalculator
Have used the internet tolearn about Social Security
benefits/when to startcollecting
Chart 33: Have used the internet and onlineresources to find out about Social Security
benefits by household income
<$50,000/yr(n=447)
$50-100,000 /yr(n=415)
$100,000+/yr(n=336)
27%
11%16%
36%
10%
43%
6% 8%
0%
20%
40%
60%
Past 12 months Never Don’t Know
Chart 34: Time since last reviewed estimatedSocial Security benefits by household income
<$50,000/yr(n=447)
$50-100,000 /yr(n=415)
$100,000+/yr(n=336)
Nodiff

Perspectives of Future Social Security Beneficiaries Ages 45-64: Detailed Findings 26
"Have you used any of the following information sources to learn about Social Security retirement benefits or when to start
collecting your benefits?"
Clients of professional financial advisors are also more likely than those who are not to use the internet
to learn about Social Security benefits (57% vs 36%), use an online Social Security calculator (50% vs
28%) and/or an app on their mobile phone (5% vs 1%). [See chart 36] They also review their estimated
Social Security benefits more frequently (47% in the past year vs 35%).
54%
25%
30%
12%
42%
38%
27%
9%
47%
25%
13%
33%
43%
14%
14%
4%
3%
19%
15%
2%
31%
4%
1%
5%
0% 20% 40% 60%
SSA
Current/former employer
AARP
Current/former union
Financial services firm
Financial magazines/books
Financial shows on TV
College class/seminar
Newspaper articles
Accountant
Attorney
Professional tax preparer/advisor
Chart 35: Information sources used by use ofprofessional financial advisor
Did not useprofessionalfinancial advisor(n=1,033)
Used professionalfinancial advisor(n=182)

Perspectives of Future Social Security Beneficiaries Ages 45-64: Detailed Findings 27
”Have you used either of the following tools to estimate your Social Security retirement benefits or learn when to start
collecting your benefits?” “Have you used the internet to learn about Social Security retirement benefits or when you should
start collecting your benefits?”
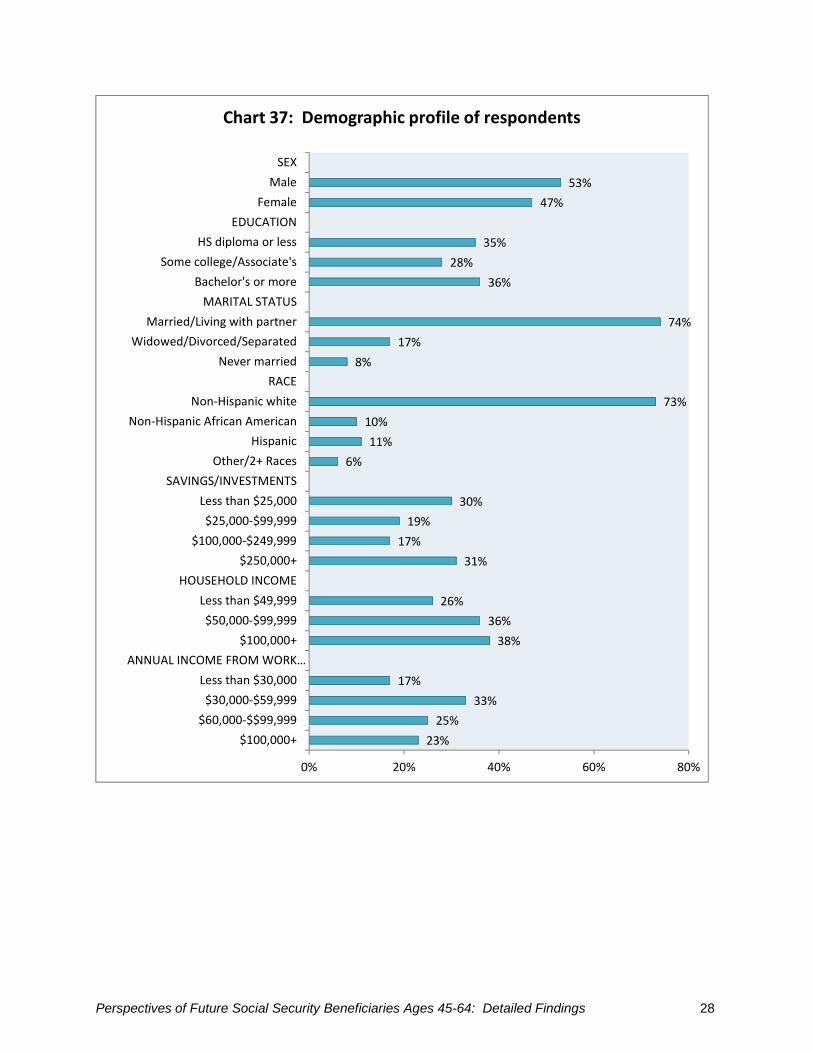
Profile of Respondents
Respondents were 53 percent male and nearly three quarters were married or living with a partner
(74%) and non-Hispanic white (73%). Thirty six percent had educational attainment of a Bachelor’s
degree or higher, 28 percent had attended some college or had an associate’s degree, and 35 percent
had a high school degree or less.
Three in 10 had less than $25,000 in savings or investments, including 13 percent who had less than
$1,000. An equal amount (31%) had $250,000 or more in savings and investments, with a median level
of $102,000. Approximately one quarter had a household income of $100,000-$150,000 (23%) or under
$50,000 (26%). [See chart 37]
One quarter (26%) describe their current health as excellent, while another 59 percent say they are in
good health. In regard to retirement plans, 70 percent currently have an employer-sponsored
retirement savings plan, such as a 401(k), tax deferred annuity or 403(b), thrift savings, money purchase,
or profit-sharing plan. Over four in 10 have other personal savings or investments (47%), an individual
retirement account (42%), or an employer-provided traditional pension or cash balance plan (41%).
[See chart 38]
57%50%
5%
36%
28%
1%0%
10%
20%
30%
40%
50%
60%
Have used the internetto learn about Social
Security benefits/whento start collecting
Online Social Securitycalculator
App on their mobilephone
Chart 36: Use of the internet and internet-basedresources to learn about Social Security by use of
professional financial advisor
Used professionalfinancial advisor(n=182)
Did not useprofessional financialadvisor(n=1,033)
Perspectives of Future Social Security Beneficiaries Ages 45-64: Detailed Findings 28
23%
25%
33%
17%
38%
36%
26%
31%
17%
19%
30%
6%
11%
10%
73%
8%
17%
74%
36%
28%
35%
47%
53%
0% 20% 40% 60% 80%
$100,000+
$60,000-$$99,999
$30,000-$59,999
Less than $30,000
ANNUAL INCOME FROM WORK…
$100,000+
$50,000-$99,999
Less than $49,999
HOUSEHOLD INCOME
$250,000+
$100,000-$249,999
$25,000-$99,999
Less than $25,000
SAVINGS/INVESTMENTS
Other/2+ Races
Hispanic
Non-Hispanic African American
Non-Hispanic white
RACE
Never married
Widowed/Divorced/Separated
Married/Living with partner
MARITAL STATUS
Bachelor's or more
Some college/Associate's
HS diploma or less
EDUCATION
Female
Male
SEX
Chart 37: Demographic profile of respondents

Perspectives of Future Social Security Beneficiaries Ages 45-64: Detailed Findings 29
“And just to be sure we have the correct information, do you (and/or your spouse/partner) currently have…” n=1,215
Demographics by Age
Older respondents were more likely than younger respondents to have an employer-provided
traditional pension or cash balance plan (44% vs 38%) and an IRA (47% vs 39%). They were also more
likely to have $500,000 or more in savings and investments (25% vs 11%).
Demographics by Household Income
Not surprisingly, those with higher household incomes were more likely to have all types of retirement
plans. [See chart 39]. They are also more likely to be in excellent or good health (highest incomes, 91%;
middle incomes, 85%; lowest incomes, 73%), while those with lowest household incomes are more likely
than middle and highest incomes to be in fair or poor health (lowest incomes, 27%; middle incomes,
14%; incomes, 9%).
“And just to be sure we have the correct information, do you (and/or your spouse/partner) currently have…”
70%
41% 42% 47%
8%
0%10%20%30%40%50%60%70%80%
Employer-sponsoredretirement savings
plan
Employer-providedtraditional pension
or cash balance plan
Individualretirement account
or IRA
Other personalsavings or
investments outsideof a retirement
account
Refused
Chart 38: Current retirement plans
38%
27%21%
30%
75%
38%43% 43%
86%
52%56%
63%
0%
20%
40%
60%
80%
100%
Employer-sponsoredretirement savings
plan [i.e. 401(k);403(b)]
Traditionalpension/cashbalance plan
IRA Other personalsavings/investments
Chart 39: Retirement income sources by household income
<$50,000/yr(n=447)
$50-100,000 /yr(n=415)
$100,000+/yr(n=336)

Perspectives of Future Social Security Beneficiaries Ages 45-64: Detailed Findings 30
Demographics by Professional Financial Advisor Client
Consumers who have used a professional financial advisor are more likely than those who have not to
have an employer-sponsored defined contribution plan (83% vs 67%), an IRA (68% vs 38%), and personal
savings or investments (65% vs 44%). Also, unsurprisingly, they are more likely to have savings and
investments ($500,000+: 30% vs 14%), higher household incomes ($100,000+/yr: 57% vs 34%), and
higher individual income from work ($80,000+/yr: 50% vs 30%).

Perspectives of Future Social Security Beneficiaries Ages 45-64: Detailed Findings 31
Appendix A: Gender differences
Since differences in data often exist based on gender, we sought to determine the degree to which
being male versus female affected Social Security planning decisions, knowledge, and resources used.
Overall, males and females exhibited no differences in knowledge about Social Security, even though
men believed themselves to be more knowledgeable than women. Men were also more confident
about the future of Social Security and were more likely to use an online calculator and the internet to
learn about benefits. There were differences related to priorities around maximizing benefits and when
to claim. Beyond that, the only differences were related to finances, with men more likely than women
to say their monthly benefit would be higher, they had more in savings, household income, and work
income and estimated that they will rely less on Social Security for retirement income.
Response Male Female
Claiming benefits while still working 42% 53%
Understanding the earliest age that they can claim benefits 74% 81%
Maximizing the amount of money that their spouse receives aftertheir death
87% 77%
Social Security expected to be a major source of retirement incomeMinor source
1-30%81-100%
46%51%42%12%
54%43%28%21%
Very/Somewhat knowledgeable about how Social Securityretirement benefits are determined.A little/not at all
52%
48%
42%
58%
Expect Social Security benefits to be $1,000 per month or lessMore than $1,250
32%54%
53%30%
Very/somewhat confident that Social Security will provide benefitsequal to today’sNot very/not at all confident
49%
50%
41%
58%
Used online Social Security calculator 36% 27%
Have used the internet to learn about Social Security benefits/whento start collecting
44% 35%
Savings and investmentsLess than $1,000$500,000 or more
9%21%
17%12%
Household income$100,000+/yr 46% 30%
Individual annual income from workLess than $40,000$70,000+
19%48%
41%27%
All differences between men and women shown in this table are significant at p<.05.

Perspectives of Future Social Security Beneficiaries Ages 45-64: Detailed Findings 32
Appendix B: Methodology
SAMPLING FRAME
The sampling frame for the general population utilized GfK’s nationally-representative online panel,
KnowledgePanel (see below for details about KnowledgePanel). Respondents were then screened forage, employment status (i.e., not currently on disability), eligibility to receive Social Security benefits byage 62, and has not claimed social security benefits yet.
RESPONDENTS
For this study, a total of 1,215 completed surveys were secured from the nationally representativegeneral population sample of 45-64 year-old Americans who are not disabled and eligible for socialsecurity by age 62 and has not claimed social security benefits yet.
RESPONDENT ELIGIBILITY
To be eligible to participate in the study, the respondent had to be between 45 and 64 years of age,eligible for social security by age 62, and has not claimed social security benefits yet.
DATA COLLECTION
A pilot test to examine survey length and comprehension of questions was conducted from June 18 to25, 2015. Data collection for the main study began on June 25 and continued through July 9, 2015. Anationally-representative sample was selected from GfK’s KnowledgePanel. Project managementreports were generated on daily basis in order to track progress during the field period.
Perspectives of Future Social Security Beneficiaries Ages 45-64: Detailed Findings 33
QUESTIONNAIRE DESIGN
The initial draft of the survey instrument was provided by AARP. As noted above, pilot testing of theinstrument was performed to assure that all aspects of the survey instrument and protocol wereworking as designed. With some minor modification, the questionnaire, sample, and procedures weredeemed to be working as designed, allowing the full data collection effort to proceed.
MARGIN OF ERROR
At 95% level of confidence, for a simple random sample of size 1,215 the resulting overall margin oferror due to sampling is ±3.3%.
SAMPLE WEIGHTS
Virtually all survey data are weighted before they can be used to produce reliable estimates ofpopulation parameters. While reflecting the selection probabilities of sampled units, weighting alsoattempts to compensate for practical limitations of a sample survey, such as differential nonresponseand undercoverage.
For the national survey, the starting sample was weighted to the benchmarks of adults 45 to 64 whilecontrolling demographic compositions. The needed benchmarks were obtained from the latest CurrentPopulation Survey (CPS) and indexed by: age, gender, region, metro status, education, and income.Subsequently, specific benchmarks for those who are eligible for Social Security retirement benefitsbased on their own work history and are not currently on disability – estimates that are not availablefrom external sources – were obtained from the weighted data for such respondents.
All weighting adjustments were carried out using an iterative proportional fitting procedure, commonlyknown as raking, to allow inclusion of several geodemographic dimensions simultaneously during theweighting process. The following tables provide a summary of such dimensions, including thebenchmarks as well as unweighted and weighted respondent counts.

Perspectives of Future Social Security Beneficiaries Ages 45-64: Detailed Findings 34
BENCHMARKS, UNWEIGHTED, AND WEIGHTED DISTRIBUTIONS OF DIMENSIONS USED FOR RAKING OF THE GENERAL
POPULATION SURVEY – KNOWLEDGE PANEL
Raking Dimension Benchmark12 Weighted
SEXAGE Frequency Percent Frequency PercentAge 45-49 Male 1009 12.25 178 14.62Age 45-49 Female 1051 12.75 155 12.75Age 50-54 Male 1076 13.06 175 14.43Age 50-54 Female 1143 13.87 180 14.78Age 55-59 Male 1024 12.43 164 13.51Age 55-59 Female 1090 13.24 152 12.51Age 60-64 Male 8823 10.71 121 9.93Age 60-64 Female 9631 11.69 91 7.46ETHNICITYWhite, Non-Hispanic 5718 69.40 885 72.86Black, Non-Hispanic 942 11.43 121 9.98
Other, Non-Hispanic 499 6.06 61 5.03Hispanic 1005 12.20 135 11.152+ Race, Non- 750 0.91 11 0.97REGION-METRONortheast Metro 1379 16.74 221 18.18
Northeast Non-metro 166 2.01 26 2.18Midwest Metro 1381 16.77 199 16.36Midwest Non-metro 417 5.07 56 4.66South Metro 2475 30.04 368 30.30South Non-metro 556 6.75 82 6.73West Metro 1661 20.16 239 19.66West Non-metro 203 2.46 23 1.94EDUCATIONLess than HS 857 10.40 72 5.90
HS 2560 31.08 355 29.26Some college 2242 27.22 345 28.39Bachelor or higher 2579 31.31 443 36.46INCOME
Under $30,000 1581 19.19 122 10.08$30,000-$59,999 1905 23.13 273 22.45$60,000-$99,999 2042 24.78 348 28.63$100,000 and above 2711 32.90 472 38.83Internet AccessYes 6646 81.04 1054 86.77No 1555 18.96 161 13.23
12Benchmarks are the national numbers to which the data is weighted.
Perspectives of Future Social Security Beneficiaries Ages 45-64: Detailed Findings 35
GFK KNOWLEDGEPANEL
Significant resources and infrastructure are devoted to the recruitment process for the KnowledgePanelso that the resulting panel can properly represent the adult population of the US. This representation isnot only achieved with respect to a broad set of geodemographic distributions, but also hard-to-reachadults – such as those without landline telephone or Spanish language dominant individuals – arerecruited in proper proportions as well. Consequently, the raw distribution of the KnowledgePanelmirrors that of the US adults fairly closely, baring occasional disparities that may emerge for certainsubgroups due to differential attrition rates among recruited panel members.
For selection of general population samples from the KnowledgePanel, however, a patentedmethodology has been developed that ensures the resulting samples behave as EPSEM (equalprobability of selection method). Briefly, this methodology starts by weighting the entireKnowledgePanel to the benchmarks secured from the latest March supplement of the CPS along severaldimensions. This way, the weighted distribution of the KnowledgePanel perfectly matches that of theUS adults – even with respect to the above mentioned few dimensions where minor misalignments mayresult from differential attrition rates. Typically, the geodemographic dimensions used for weighting theentire KnowledgePanel include:
Gender (Male/Female)
Age (18–29, 30–44, 45–59, and 60+)
Race/Ethnicity (Hispanic and non-Hispanic White, African American, Asian, and Other)
Education (Less than High School, High School, Some College, Bachelor and beyond)
Census Region (Northeast, Midwest, South, West)
Household Income (>$10k, $10K to <$25k, $25K to <$50k, $50K to <$75k, $75K to <$100k,
$100K+)
Home ownership status (Own, Rent/Other)
Metropolitan Area (Yes, No)
Internet Access (Yes, No)
Using the above weights as the measure of size (MOS) for each panel member, in the next step a PPS(probability proportional to size) procedure is used to select study specific samples. It is the applicationof this PPS methodology with the above MOS values that produces fully self-weighing samples from theKnowledgePanel, for which each sample member can carry a design weight of unity. Moreover, ininstances where the study design has required any form of oversampling of specific subgroups, suchdepartures from an EPSEM design are corrected by adjusting the corresponding design weightsaccordingly with the CPS benchmarks serving as reference points.
KNOWLEDGEPANEL CALIBRATION WEIGHTING
Studies that need a large number of respondents, or those that focus on rare subpopulations, canrequire sample sizes that KnowledgePanel may not be able to provide. In such instances, a blended-sample that is comprised of both KnowledgePanel and non-probability samples can provide an effectivealternative. For such applications we will use our proprietary Calibration process to correct for some ofthe known coverage problems associated with opt-in online panels. These coverage problems includeomission of non-internet households, as well as overrepresentation of hyper internet users. Ascompared to samples that exclusively rely on non-probability opt-in panels, inclusion of parallel samples

Perspectives of Future Social Security Beneficiaries Ages 45-64: Detailed Findings 36
from the KnowledgePanel along with our calibration weighting adjustment produces blended samplesthat can represent the target population more effectively and offer more robust inferential possibilities.
Specifically, our calibration weighting is a procedure that allows two samples – one probability-basedfrom the KnowledgePanel and non-probability from opt-in sources – to be blended together to producea larger sample that better represents the target population. This improved representation is not onlywith respect to basic geodemographic distributions, but also in terms of an important set ofattitudinal/behavioral measures. This weighting methodology has been used successfully with dozens ofstudies for the Federal and State government agencies, academic researchers, and corporate clients.
Based on repeated studies, it has been demonstrated that respondents from opt-in panels tend to differfrom the general population in several ways. For instance, opt-in respondents have a higher propensityfor adopting new products and services. We have been able to develop a battery of questions that caneffectively measure these early adoption (EA) tendencies by asking respondents to express theiragreement/disagreement – on a scale of 1-to-5 – on the following 5 questions:
EA1. I usually try new products before other people do
EA2. I often try new brands because I like variety and get bored with the same old thing
EA3. When I shop I look for what is new
EA4. I like to be the first among my friends and family to try something new
EA5. I like to tell others about new brands or technology
With the above questions administered to both KnowledgePanel and opt-in panel respondents, we canthen identify how the two sets of responses differ and apply correcting weights to realign non-probability opt-in respondents with those from the probability-based KnowledgePanel. For illustration,the following figure shows the results from a large study that compares survey estimates for percent toptwo boxes for the above 5 EA questions as well as another 9 ad-hoc attitudinal questions. These surveyestimates are shown for KnowledgePanel alone, KnowledgePanel and opt-in panel calibrated, and opt-inpanel alone without calibration.
As seen from the above figure, non-probability opt-in panel respondents tend to score significantlyhigher on each of the 5 EA questions. However, when survey data from these respondents arecalibrated with those from the KnowledgePanel, the observed differences are virtually eliminated.Moreover, as a result of this calibration weighting survey estimates from the blended sample are alsoimproved when comparing responses to the attitudinal questions other than those related to earlyadoption (SV1 – SV9).

Perspectives of Future Social Security Beneficiaries Ages 45-64: Detailed Findings 37
Appendix C: Annotated Questionnaire
Weighted data
Unless otherwise specified, unweighted bases are as follows:
N=1215
* = <.5
- = 0
S1. Which of the following best describes you? Are you…
Not currently receiving Social Security benefits, but you expect to receive them at some point inthe future
93
Not currently receiving Social Security benefits and you don’t expect to receive them in thefuture
7
Currently receiving Social Security benefits -Refused -Based on: Total Respondents N=1215
S2. Why don’t you expect to receive Social Security benefits in the future?
Even though I will be eligible for Social Security benefits, I’m not sure if Social Security willbe around by the time I decide to start collecting benefitsI have not worked long enoughMy main job(s) have not been covered by Social SecurityI won’t need the benefitsOtherDon’t knowRefusedBased on: Do not receive benefits and do not expect to in the future Insufficient
Base
S8. What is your current employment status?
Working for pay on a full-time basis (at least 35 hours per week) 70Working for pay on a part-time basis (less than 35 hours per week) 12Completely retired and not working for pay and not looking for work 5Unemployed and looking for work 5On disability -Not working for pay and not looking for work (homemaker, student, other) 8Refused -Based on: Total Respondents N=1215
R1. Which of the following best describes you?
Retired but currently working 4Never been retired and currently working 96Refused *Based on: Full-time or part-time workers N=963

Perspectives of Future Social Security Beneficiaries Ages 45-64: Detailed Findings 38
R2. Which of the following best describes you?
Retired but currently looking for workNever been retired and currently looking for workRefusedBased on: Unemployed and looking for work Insufficient
Base
R3. Which of the following best describes you?
Retired 20Never been retired 77Refused 3Based on: Not employed and not looking for work N=104
S9. Have you ever been employed, either working for someone else or for yourself?
Yes 100No -Refused -Based on: Retired, unemployed or not working N=252
S10. Since you turned 18 years old, about how many years in total have you worked for pay? (Pleaseprovide your best guess if you’re not sure.)
1-10 211-20 1021-30 3031-40 4441+ 14Refused -Based on: Total Respondents N=1215
S10b. How many more years do you plan to work for pay? (Please provide your best guess if you’re notsure. If you do not plan to work any longer for pay, please enter 0.)
None 10
1-5 19
6-10 27
11-15 21
16-25 18
26+ 4
Refused -
Based on: Working, unemployed and looking, retired or not working N=1215

Perspectives of Future Social Security Beneficiaries Ages 45-64: Detailed Findings 39
S10c. At what age did you last work for pay? (If you’re not sure, please provide your best guess.)
24 128 129 131 132 *35 638 140 441 242 243 244 145 546 147 248 849 150 651 552 553 454 255 656 557 458 959 460 361 462 264 1Refused -Based on: Retired and do not expect to work again or not working and do not expect to workagain
N=126

Perspectives of Future Social Security Beneficiaries Ages 45-64: Detailed Findings 40
Outlook on Social Security Retirement Benefits
R5. When thinking about your Social Security retirement benefits, how important is each of the followingto you personally?
VeryImportant
SomewhatImportant
Not tooImportant
Not at allImportant
Refused
Maximizing the amount of moneythat you receive in retirement
77 19 2 1 1
Claiming your benefits while youare still working
22 26 31 21 1
Understanding the earliest age thatyou can claim your benefits
47 31 15 6 1
Understanding the best age for youto claim benefits
74 22 2 2 *
Based on: Total Respondents N=1215Maximizing the amount of moneythat you and your spouse receivein retirement
79 17 2 1 1
Maximizing the amount of moneythat your spouse receives afteryour death
55 28 13 4 *
Based on: Married N=777
EXPECTATIONS RELATED TO SOCIAL SECURITY
R6. In thinking about possible sources of income in retirement, do you expect (your and yourspouse’s) / (your and your partner’s)/ (your) Social Security retirement benefits will be a major source ofincome, a minor source of income, or not a source of income in (your and your spouse’s) / (your and yourpartner’s) / (your) retirement?
MajorSource
MinorSource
Not aSource
Refused
49 47 3 *
Based on: Total Respondent N=1215

Perspectives of Future Social Security Beneficiaries Ages 45-64: Detailed Findings 41
R6A. What percent of your household income in retirement do you expect will come from (your and your
spouse’s) / (your and your partner’s) / (your) Social Security retirement benefits? (Your best guess is
fine.)
1% to 10% 511% to 20% 1221% to 30% 1931% to 40% 1341% to 50% 1251% to 60% 961% to 70% 771% to 80% 781% to 90% 791% to 100% 9Refused *Based on: Respondents stating Social Security will be a Major or Minor Source of Income N=1170
EXPECTED CLAIMING AGE
Again, unless otherwise specified, please assume that the rest of the questions are about SocialSecurity retirement benefits based on your own work history.Please assume that you will be eligible to receive Social Security retirement benefits at some point in thefuture and that any future changes to the Social Security program will not affect your benefits.
Some people receive other types of Social Security benefits, such as widow/widower benefits for peoplewhose spouses have died or disability benefits for people with disabilities. But, please assume that therest of the questions are about Social Security retirement benefits based on your own work history unlesswe specifically refer to other types of benefits.
KG1. How knowledgeable do you feel you are about how your Social Security retirement benefits aredetermined?
Very knowledgeable 9Somewhat knowledgeable 38A little knowledgeable 37Not at all knowledgeable 16Refused *Based on: Total Respondents N=1215

Perspectives of Future Social Security Beneficiaries Ages 45-64: Detailed Findings 42
KG2. To your knowledge, what is the earliest age at which people can start collecting Social Security
retirement benefits?
18 *19 *21 *25 *30 *35 *45 *46 *50 *52 *55 256 *58 *59 260 461 162 6163 464 165 1866 267 468 170 172 *76 *Refused *Based on: Total Respondents N=1215

Perspectives of Future Social Security Beneficiaries Ages 45-64: Detailed Findings 43
KG3. At what age do you expect to start collecting Social Security retirement benefits? (If you have notthought about this before, please provide your best guess.)
49 *50 *52 *53 *55 *56 *57 *58 *59 *60 161 *62 1663 264 165 3166 1167 1468 469 170 1371 *72 173 *74 *75 176 *77 *80 *82 *99 *Refused -Based on: Total Respondents N=1215
KNOWLEDGE OF KEY FACTORS THAT INFLUENCE BENEFITS
KG4. How much do you think your monthly Social Security retirement benefits will be if you start collectingbenefits at (Expected claim age) and (you are no longer working for pay at that time) / (you are stillworking for pay at that time)? (Please assume that any future changes to Social Security will not affectyour benefits. Your best guess is fine.)
$______ per month
Under $500 13$500 - $1000 30$1001 - $1250 12$1251 - $2000 28$2001+ 15Refused 2Based on: Total Respondents N=1215

Perspectives of Future Social Security Beneficiaries Ages 45-64: Detailed Findings 44
IMPACT OF WAITING UNTIL FULL RETIREMENT AGE (FRA) RATHER THAN CLAIMING AT AGE 62 (PART OF
KNOWLEDGE SECTION)
As you answer the following questions, please be aware that 62 is the earliest age at which people can
start collecting Social Security retirement benefits. [Note to programmer: round the FRA to the nearest
year.]
KG5. Compared to the monthly Social Security retirement benefit that you (would have received) if you(start) / (had started) collecting benefits at age 62, would your monthly benefit (be) / (have been) lower orhigher if you instead (wait) / (had waited) until age (FRA) to start collecting Social Security benefits, orwould your monthly benefit be the same regardless of whether you (start) / (had started) collecting at age62 or age (FRA)?
Monthly benefits would be lower if you (start)/(had started) collecting at age (FRA) rather thanage 62
6
Monthly benefits would be higher if you (start)/(had started) collecting at age (FRA) rather thanage 62
88
Monthly benefits would be the same 6Refused *Based on: Total Respondents N=1215
KG5B. Assume that your monthly Social Security retirement benefit would be $1,000 if you start
collecting Social Security at age 62. By how much do you think your monthly benefit WOULD INCREASE if
you wait until age (FRA) to start collecting Social Security benefits? Please enter your best guess of the
increase in your monthly benefit or a percentage increase:
Estimate increase in dollars: $____
Or, Estimate percentage increase:[All data transformed into % for analysis]
0% 11-10 5011-20 1821-30 1231-40 641-50 751-60 161-70 171-80 281-90 *91-100 2Refused 2Based on: Respondents thinking monthly benefits would be higher N=1054

Perspectives of Future Social Security Beneficiaries Ages 45-64: Detailed Findings 45
IMPACT OF DELAYING ONE YEAR BEYOND FULL RETIREMENT AGE (FRA) (PART OF KNOWLEDGE SECTION)
KG6. Compared to the monthly Social Security retirement benefit that you (will receive) / (would havereceived) if you (start) / (had started) collecting benefits at age (FRA), would your monthly benefit (be) /(have been) lower or higher if you instead (wait) / (had waited) one more year until age (FRA+1) to startcollecting Social Security benefits, or would your monthly benefit be the same regardless of whether you(start) / (had started) collecting at age (FRA) or age (FRA+1)?
Monthly benefits would be lower if you (START)/(HAD STARTED) collecting at age (FRA+1) ratherthan age (FRA)
3
Monthly benefits would be higher if you (START)/(HAD STARTED) collecting at age (FRA+1) ratherthan age (FRA)
57
Monthly benefits would be the same 39Refused 1Based on: Total Respondents N=1215
KG7. What is the earliest age at which you should start collecting Social Security retirement benefits ifyou wanted to receive your highest possible monthly benefit? (If you’re not sure, please provide yourbest guess.)
Doesn’t matter 362 663 *64 *65 866 667 2268 569 170 3271 172 873 *74 *75 3Later than 75 4Refused 1Based on: Total Respondents N=1215
KNOWLEDGE OF EARNINGS TEST (PART OF KNOWLEDGE SECTION)
KG8. As far as you know, if you were to claim Social Security retirement benefits at age 64 while youwere employed in a job that paid $40,000 per year, could your salary from work affect the amount of yourmonthly Social Security retirement benefits?
Yes 84No 16Refused *Based on: Total Respondents N=1215
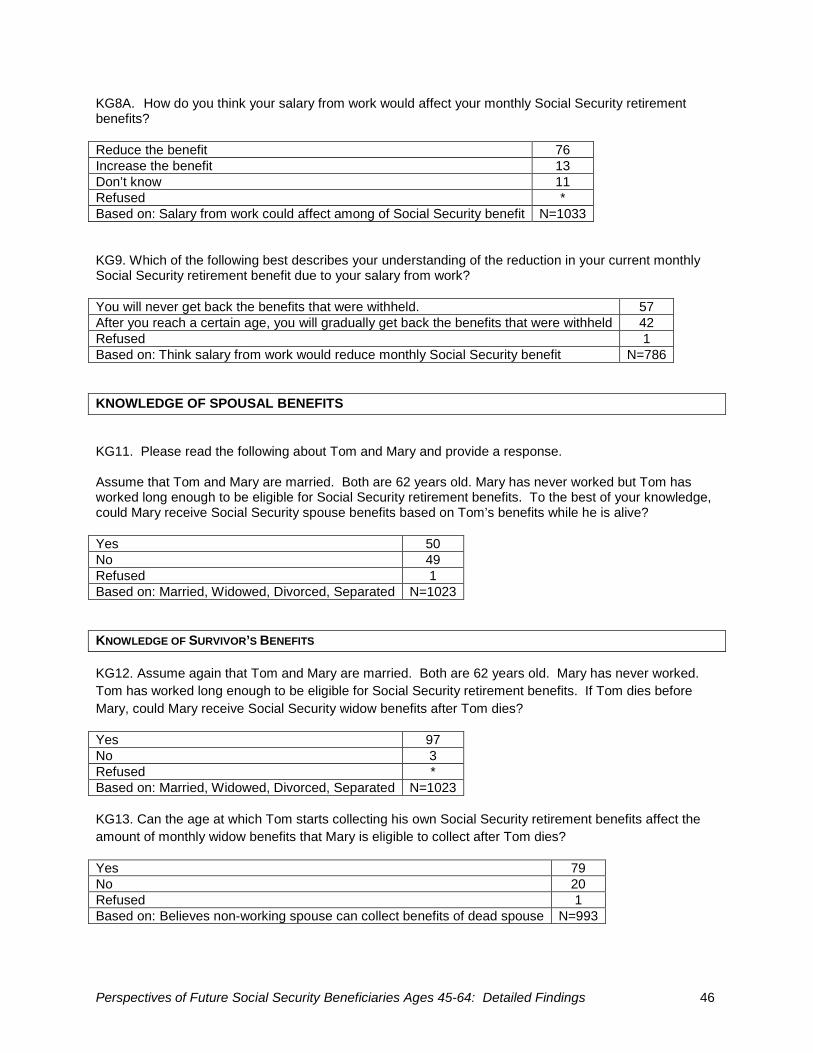
Perspectives of Future Social Security Beneficiaries Ages 45-64: Detailed Findings 46
KG8A. How do you think your salary from work would affect your monthly Social Security retirementbenefits?
Reduce the benefit 76Increase the benefit 13Don’t know 11Refused *Based on: Salary from work could affect among of Social Security benefit N=1033
KG9. Which of the following best describes your understanding of the reduction in your current monthlySocial Security retirement benefit due to your salary from work?
You will never get back the benefits that were withheld. 57After you reach a certain age, you will gradually get back the benefits that were withheld 42Refused 1Based on: Think salary from work would reduce monthly Social Security benefit N=786
KNOWLEDGE OF SPOUSAL BENEFITS
KG11. Please read the following about Tom and Mary and provide a response.
Assume that Tom and Mary are married. Both are 62 years old. Mary has never worked but Tom hasworked long enough to be eligible for Social Security retirement benefits. To the best of your knowledge,could Mary receive Social Security spouse benefits based on Tom’s benefits while he is alive?
Yes 50No 49Refused 1Based on: Married, Widowed, Divorced, Separated N=1023
KNOWLEDGE OF SURVIVOR’S BENEFITS
KG12. Assume again that Tom and Mary are married. Both are 62 years old. Mary has never worked.
Tom has worked long enough to be eligible for Social Security retirement benefits. If Tom dies before
Mary, could Mary receive Social Security widow benefits after Tom dies?
Yes 97No 3Refused *Based on: Married, Widowed, Divorced, Separated N=1023
KG13. Can the age at which Tom starts collecting his own Social Security retirement benefits affect the
amount of monthly widow benefits that Mary is eligible to collect after Tom dies?
Yes 79No 20Refused 1Based on: Believes non-working spouse can collect benefits of dead spouse N=993

Perspectives of Future Social Security Beneficiaries Ages 45-64: Detailed Findings 47
KG13b. Again, assume that Tom and Mary are married. Both are 62 years old. However, in this case,
assume that Mary and Tom have each worked long enough to be eligible for Social Security retirement
benefits. Mary has worked for fewer years than Tom, and Mary’s earnings in a typical year are always
much less than Tom’s earnings. If Tom dies before Mary, could Mary receive Social Security widow
benefits after Tom dies?
Yes 93No 7Refused *Based on: Married, Widowed, Divorced, Separated N=1023
KG14. What is the earliest age at which Tom should start collecting his Social Security retirement benefits
if he wants Mary to receive the highest possible monthly widow benefit in case he dies before her? (If
you’re not sure, please provide your best guess.)
62 1463 *64 165 1466 1067 2368 569 170 2071 172 673 -74 -75 2Later than 75 2Refused *Based on: Believes widow can receive partner's benefits after death when both were working N=947
KG15. After Tom dies, can the age at which Mary starts collecting her Social Security widow benefitsaffect the amount of monthly widow benefits that she is eligible to collect?
Yes 54No 46Refused 1Based on: Believes one spouse can collect the other spouse's benefits after they die N=1009

Perspectives of Future Social Security Beneficiaries Ages 45-64: Detailed Findings 48
KG16. After Tom dies, what is the earliest age at which Mary should start collecting her Social Securitywidow benefits in order to receive the highest possible monthly widow benefit? (If you’re not sure, pleaseprovide your best guess.)
62 2863 164 265 1666 767 1768 669 170 1271 *72 473 -74 -75 2Later than 75 2Refused 1Based on: Those who think that the age at which someone starts collecting dead spouse'sbenefits can affect the amount
N=551
Please read the following about Susan and Rich, both age 62, and provide a response.
KG10. Assume that Susan and Rich divorce after five years of marriage. If Susan is unmarried at thetime she becomes eligible for Social Security, would she be eligible to file for Social Security spousalbenefits on Rich’s work record?
Yes 34No 65Refused 1Based on: Married, Widowed, Divorced, Separated N=1023

Perspectives of Future Social Security Beneficiaries Ages 45-64: Detailed Findings 49
KG10a. In order for Susan to be eligible to file for Social Security spousal benefits on Rich’s work record,what is the minimum number of years that she would have had to have been married to Rich?
6 years 37 years 38 years 19 years *10 years 4011 years *12 years *13 years *14 years *15 years 116 years -17 years -18 years -19 years -20 or more 3Not Applicable. Susan would not be eligible to claim Social Security spousal benefits onRich’s work record regardless of how long they had been married
47
Refused *Based on: Believe Susan would not be eligible for spousal benefits on Rich's work record N=679
Confidence IN SOCIAL SECURITY
C17. How confident are you that the Social Security system will provide you with Social Security
retirement benefits that are at least equal in value to the benefits received by retirees today?
Very confident 7Somewhat confident 38Not too confident 38Not at all confident 17Refused *Based on: Total Respondents N=1215
C17A-If no changes are made to the Social Security system, how long do you think Social Security would
be able to continue paying out benefits at the current level?
For fewer than 10 years 19For 10 to 20 years 27For 21 to 30 years 18For 31 to 40 years 6For 41 to 50 years 3For more than 50 years 5Don’t know 21Refused *Based on: Total Respondents N=1215

Perspectives of Future Social Security Beneficiaries Ages 45-64: Detailed Findings 50
C17B. Suppose you knew that after 2033, Social Security benefits would have to be cut by twenty-five
percent because of a shortfall in funds. After 2033, how long do you think Social Security could continue
paying out these reduced benefits without implementing further cuts?
For fewer than 10 years 39For 10 to 20 years 18For 21 to 30 years 7For 31 to 40 years 2For 41 to 50 years 2For more than 50 years 3Don’t know 29Refused *Based on: Total Respondents N=1215
ACTIONS/BEHAVIORS
C18. Have you used any of the following information sources to learn about Social Security retirementbenefits or when to start collecting your benefits?
Yes No Don’t Know RefusedThe Social Security Administration 45 50 4 2Your current or former employer 16 78 4 2AARP 16 78 3 2Your current or former labor union 5 89 3 3Friends or family members 46 49 3 2A financial services firm 9 85 3 2A professional financial advisor 16 79 3 2Financial magazines or books 22 73 4 2Financial shows on TV 17 76 4 2A class or seminar at a local college 3 90 3 3Public library 4 90 4 3Newspaper articles 33 61 3 2An accountant 7 87 3 3An attorney 3 91 3 3A professional tax preparer or tax advisor 10 84 4 3Based on: Total Respondents N=1215
C19. Have you used either of the following tools to estimate your Social Security retirement benefits orlearn when to start collecting your benefits?
Yes No Don’t Know RefusedAn online Social Security calculator 31 64 4 *An app on your mobile phone 2 93 4 1Based on: Total Respondents N=1215

Perspectives of Future Social Security Beneficiaries Ages 45-64: Detailed Findings 51
C20. On which web site(s) did you use an online Social Security calculator?
The official Social Security website (socialsecurity.gov) 81AARP website (aarp.org) 11Bankrate.com 1Your retirement plan provider 14Other website 2Don’t Know/Don’t Remember 9Refused 1Based on: Used an online Social Security Calculator N=370
C20A. How useful were these in helping you learn about Social Security retirement benefits or when tostart collecting your benefits?
Veryuseful
Somewhatuseful
Not toouseful
Not at alluseful
Refused
(if used) The Social Security Administration(N=565)
50 44 5 2 *
(if used) Your current or former employer(N=205)
33 51 13 3 -
(if used) AARP (N=220) 34 57 7 1 1(if used) Your current or former labor union(Insufficient Base)(if used) Friends or family members (N=552) 25 61 12 2 1(if used) A financial services firm (N=103) 39 50 8 - 3(if used) A professional financial advisor (N=182) 56 40 4 - *(if used) Financial magazines or books (N=256) 22 61 15 2 1(if used) Financial shows on TV (N=205) 22 57 19 1 *(if used) A class or seminar at a local college(Insufficient Base)(if used) Public library (Insufficient Base)(if used) Newspaper article (N=406) 14 62 21 2 1(if used) An online Social Security calculator(N=370)
38 50 9 2 1
(if used) An app on your mobile phone that letyou estimate your SS benefits (Insufficient Base)Based on: Have used sources or tools to learn about Social Security Bases Vary
C21. Have you used the Internet to learn about Social Security retirement benefits or when you shouldstart collecting your benefits?
Yes 39No 61Refused *Based on: Total Respondents N=1215

Perspectives of Future Social Security Beneficiaries Ages 45-64: Detailed Findings 52
C22. When was the last time you reviewed your estimated Social Security retirement benefits?
Less than 12 months ago 371 to 2 years ago 273 to 5 years ago 146 to 9 years ago 210 years ago or more 1Don’t Know/Don’t Remember 11Never 8Refused *Based on: Total Respondents N=1215
Demographics
[SURVEY NOTE: FROM PANEL DATA: GENDER, EDUCATION, MARITAL STATUS, # OF CHILDREN UNDER AGE 18 IN
HOUSEHOLD, RACE/ETHNICITY
D18. How would you describe your current health?
Excellent 26Good 59Fair 14Poor 1Refused 1Based on: Total Respondents N=1215
D19. Are you a member of AARP?
Yes 23No 75Don’t Know 2Refused *Based on: Total Respondents N=1215
D20. And just to be sure we have the correct information, do you (and/or your spouse/ partner)CURRENTLY have:
Money in an employer-sponsored retirement savings plan, such as a 401(k), tax deferredannuity or 403(b), thrift savings, money purchase, or profit-sharing plan
70
An employer-provided traditional pension or cash balance plan, with the benefit based onsalary and years of service
41
An individual retirement account or IRA 42Other personal savings or investments outside of a retirement account, such as mutual funds,stocks, certificates of deposit, or annuities
47
Refused 8Based on: Total Respondents N=1215

Perspectives of Future Social Security Beneficiaries Ages 45-64: Detailed Findings 53
D21. In total, about how much money would you say you (and your spouse/ partner) currently have insavings and investments, not including the value of your primary residence? Please includesavings, certificates of deposits, stocks, bonds, mutual funds, employer-sponsored retirementsavings plans, and other investments, but do not include the value of defined benefit plans.
Less than $1,000 13$1,000 to less than $10,000 9$10,000 to less than $25,000 8$25,000 to less than $50,000 8$50,000 to less than $100,000 11$100,000 to less than $150,000 8$150,000 to less than $250,000 9$250,000 to less than $500,000 15$500,000 to less than $1 million 10$1 million or more 6Refused 4Based on: Total Respondents N=1215
D22. Which of the following categories best describes the combined annual income of ALL MEMBERSof your household, before taxes, including wages or salary, pensions, and all other sources?
Under $20,000 6$20,000 to just under $30,000 4$30,000 to just under $40,000 8$40,000 to just under $50,000 8$50,000 to just under $60,000 7$60,000 to just under $70,000 9$70,000 to just under $80,000 9$80,000 to just under $100,000 11$100,000 to just under $150,000 23$150,000 or more 15Refused 2Based on: Total Respondents N=1215
D23. Which of the following categories best describes your before-tax INDIVIDUAL annual incomeFROM WORKING, excluding pensions and any other sources of income?
Under $20,000 9$20,000 to just under $30,000 8$30,000 to just under $40,000 11$40,000 to just under $50,000 11$50,000 to just under $60,000 11$60,000 to just under $70,000 9$70,000 to just under $80,000 6$80,000 to just under $100,000 10$100,000 to just under $150,000 17$150,000 or more 6Refused 2Based on: Working N=963
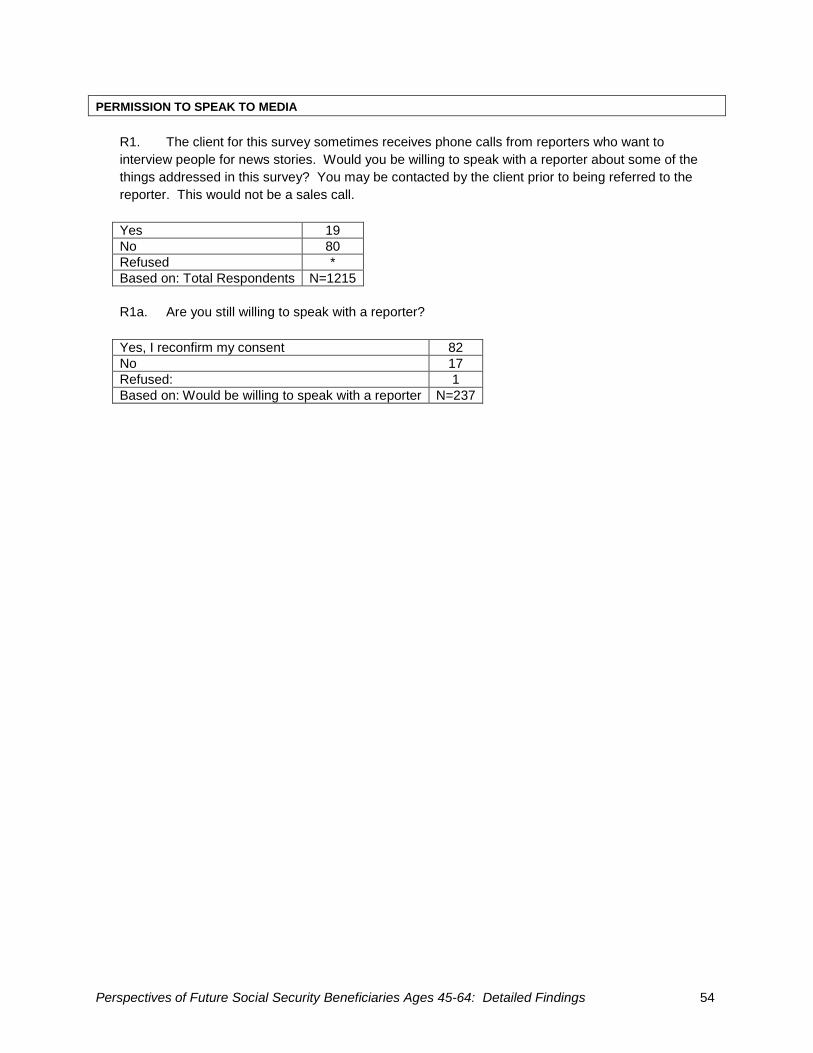
Perspectives of Future Social Security Beneficiaries Ages 45-64: Detailed Findings 54
PERMISSION TO SPEAK TO MEDIA
R1. The client for this survey sometimes receives phone calls from reporters who want to
interview people for news stories. Would you be willing to speak with a reporter about some of the
things addressed in this survey? You may be contacted by the client prior to being referred to the
reporter. This would not be a sales call.
Yes 19No 80Refused *Based on: Total Respondents N=1215
R1a. Are you still willing to speak with a reporter?
Yes, I reconfirm my consent 82No 17Refused: 1Based on: Would be willing to speak with a reporter N=237
Top Related