


Languages
Pages
Legal

119
PERFORMANCE
structural and thermal
chapter 4
To evaluate how traditional and alternative wall systems and buildings perform structurally and thermally, testing and
modeling were performed on material samples and buildings. By measuring their physical characteristics, we can reach
useful conclusions regarding the applicability of these systems to meeting today’s housing needs.
Of particular concern are earthen materials, such as adobe or rammed earth, which have historically been vulnerable
to earthquakes when used in seismic zones. In recent years, research into the structural properties of earth has
demonstrated methods of construction that permit the safe use of earthen walls even in earthquake zones. This
requires adequate foundations, continuous bond beams at the roof level, and suffi cient thickness-to-height ratios for
the walls. Because straw bale is a light-weight variant of frame and plaster construction, it does not face as great a
threat from lateral forces. However, it raises other concerns, in particular, the need to protect the straw from moisture
and rot.
The structural analysis which follows was prepared with the advice of the structural engineer Steven Hess, with
materials strength testing performed by Pattison Evanoff Engineering, both of Tucson, Arizona.
The thermal perfomance study investigates the effectiveness of interior conditioning strategies of vernacular houses
as compared to a contemporary manufactured housing. Heat loss and gain and the effects of thermal mass walls in
contrast with insulated walls are simulated using a computer modeling program, CalPas 3, developed by the Berkeley
Solar Group.
Energy modeling and thermal performance analyses were performed by Christina Neumann, B.Arch., LEED (TM) A.P.
under the direction of Dr. Nader Chalfoun. Dr. Chalfoun teaches architecture and directs the House Energy Doctor
program at the University of Arizona in Tucson.

120 SOUTHWEST HOUSING TRADITIONS design, materials, performance
121
Traditional houses built with adobe, rammed earth or straw bale walls have withstood centuries of rain, wind, snow and
even earthquakes when properly constructed. When built well, they can outlast and out perform conventional wood-
frame houses.
Recent research and experience by practicing architects, engineers and builders in the U.S. Southwest have identifi ed
the most important factors in the structural stability of traditional wall materials. These factors have been codifi ed as
amendments to conventional building codes for earthen and straw bale wall systems.
The structural engineer Steven Hess, a member of the code committee which developed the Tucson/Pima County
alternative materials codes, has summarized the critical engineering issues involved with traditional wall materials.
building systems STRUCTURAL ANALYSIS
122
Most U.S. building codes do not specifi cally
provide for earthen building materials. The
exceptions to this rule are found in the
southwestern states of California, Arizona,
and New Mexico, all states with a tradition
of adobe construction as a legacy of their
Spanish Colonial past. Even in these states, as
interest in adobe and rammed earth resurfaced
in recent decades, design professionals
interested in traditional materials received a
cool reception from code offi cials.
The main stumbling block was the use of
tensile design of unreinforced earth. Code
offi cials treated adobe and rammed earth
with great suspicion. Very conservative
assumptions were made regarding the design
properties of earth. Design strengths were
assumed to be 30 psi in compression and
4 psi in shear and tension. In reality the
compressive strength of adobe is typically
much higher, as evidenced by testing
performed for this study. Historic adobes
from an 1880s era house on Court Avenue
in Tucson, Arizona, averaged 177 psi in
compression. Modern adobe bricks averaged
from 300 for asphalt stabilized bricks, to
450 psi for cement stabilized bricks. Actual
strengths can be 10 to 15 times the assumed
strength. Compressed earth blocks can
achieve even higher strengths and densities.
In southern Arizona, architects and engineers
involved with earthen materials came together
in the mid-1990s to develop an updated code
provision for adoption as an amendment to
the International Residential Code (IRC).
The result was the joint Pima County/City of
Tucson Earthen Materials Appendix Chapter
to the IRC, which subsequently has served as
a model code for other communities. One of
the main concessions of this model code is
the "zero-tension" allowance in the design of
the earthen walls.
Earthen buildings are vulnerable to lateral
forces. Due to its weight, the primary threat
to adobe or rammed earth structures is from
earthquakes, although wind loads can be a
problem for free-standing garden walls. The
problem is that earth walls are monolithic and
cannot readily be reinforced with tension-
resisting elements. An alternate method
of analyzing and resisting lateral loads is
necessary.
The zero-tension approach works well for
non-cantilevered building walls when it is
realized that, due to an earthen wall's thickness
and mass, fi xity at the base of the wall is
generated. Using a fi xed base with a pinned
restraint at the roof attachment elevation,
reasonable allowable wall heights are found
to be allowed within the code specifi ed design
parameters for lateral load combinations.
There are two methods for attaining a pinned
restraint of a wall above the base which
normally occurs at the roof. Method one
is a horizontal diaphragm as traditionally
found in most other buildings. Method
two is the use of a horizontal bond beam
spanning between cross wall supports which
are normally constructed of concrete with
reinforcing. Method two can be adapted to
special cases where no horizontal diaphragm
is available for the support of the wall, such
as at gable end walls.
A prescriptive Residential Code for Earthen
Materials has been written for Pima County
and the City of Tucson, Arizona, which utilizes
the horizontal bond beam design approach for
earthen wall construction. It contains bond
beam size tables based on various wind loads
and Sds seismic response factors (a value based
on the zip code location of the project ). A
copy of the current IRC version of this code
can be found at :http://www.cityoftucson.org/dsd/Codes_Ordinances/Building_
Codes/2003_IRC_Amend_v1.pdf
Engineering principles recognize that cantilevers
can still be stable even if the resultant falls outside
the kern. Design utilizing zero tension at the
cantilever with a focus on the Factor of Safety
for Overturning for the stability of the wall will
produce moderate cantilevered wall heights.
For cantilevered parapets, the code allows
a minimum parapet height of two times the
parapet wall thickness from the last wall support
without calculation. Some designers avoid the
cantilevered parapet by using a veneered adobe
parapet backed by a braced wood stud wall.
Cantilevered adobe or rammed earth fence
walls are designed for wind loads (and seismic
as required) using the basic stability of the wall
for overturning. It is important to have the
masonry or concrete stem as thick as the wall
above or if thinner, reduce the design wall width
at the base of the wall. A masonry or concrete
stem is required to be 6 inches above grade in
order to eliminate moisture wicking from the
soil below grade into the earthen materials wall.
If the earthen materials wall comes in contact,
or goes below grade, the moisture in the soil
will be absorbed into the wall, wicked up a short
distance into the wall, and then evaporate to
EARTHEN WALLS
123structural analysis BUILDING SYSTEMS
the atmosphere when it gets to the surface
of the wall. As the moisture evaporates,
salts carried in solution re-crystallize at or
beneath the surface of the earthen wall.
These salt crystals expand as they form and
cause the outer wall surface to spall off in
layers, eventually causing a “cove” at the
base of the wall. This condition is referred
to as “basal coving”.
Roof joist, trusses, and beams supported
by earthen walls should bear on top of the
wall and as near the center of the wall as
practical. Bearing loads in general should
not be supported off ledgers (which will
produce wall moments from the ledger
eccentricity) due to the zero tension
provisions of the code. The code will allow
up to a 75 lbs/foot of ledger load without
calculations which is intended to cover
non-bearing ledger conditions or very short
spans of hallways or porches. Heavy point
loads should be checked for a maximum
allowable bearing load of 45 psi.
The general historical earthen wall building
confi guration is a series of rectangular rooms
placed together to form the overall building
with generally small window and door
openings. House plans for other materials,
such as studs and stucco or reinforced
masonry, frequently do not convert well to
earthen material wall fl oor plans due to tall
walls, large openings, and infrequent shear
walls. With this in mind, people wishing to
utilize this type of construction may be best
advised to go with the most experienced
and reputable designers and builders for
earthen wall construction.
STRAW BALE WALLS
Straw bale construction was codifi ed in an
amendment chapter to the International
Residential Code adopted by code offi cials in
Pima County, Arizona. The Pima County Straw
Bale IRC amendment can be found on-line at:
http:/www.dcat.net/resources/Tucson_Pima_Co_SB_
Code.pdf This local amendment has served as
model straw bale code, and has been adopted in
other localities where straw bale has been used.
The straw bale code is a prescriptive code for
load bearing walls. It notes the characteristics
for the bales relative to size, plant material,
moisture content, and density. The code goes
over the basic construction of a straw bale wall
relative to the stacking and pinning of the walls
and all other aspects of building with straw bales.
The actual allowable wall heights and lengths are
set by proportions and the only engineering
allowable stress given is a 360 psf allowable
vertical load (2.5 psi) on top of the walls.
Most engineered straw bale is post and beam
type, in which the straw bales serve as infi ll and
the structure derives no structural stability from
them. Most engineers regard straw bale walls
as highly compressible and not ideal to sustain
long-term loadings without deforming and
thereby risking damage to the structure.
The most important factor for straw bale is not
compressive strength, but the moisture content
of the straw. Excessive moisture will cause the
straw to rot, or mold to form, causing failure of
the wall system. In straw bale construction, it is
essential to keep the bales dry. For this reason,
parapet type roofs are not recommended. A
metal roof with a deep continuous overhanging
eave and gutters and downspouts is preferred to
guarantee that the water is kept away from the
wall. It must be anticipated that load-bearing
straw bale walls will compress under full
loading over a period of from 4 to 6 weeks
during construction. Protective plaster cannot
be applied to the exterior until all the potential
settlement has taken place.
Because straw bales weigh only 7 pounds
per cubic foot (in contrast with 125 pcf for
earth), dead-loads from the walls are low. The
allowable roof live and dead load delivered to
the top of straw bale walls is limited to 360
pounds per square foot (equaling 2.5 pounds
per square inch).
Moisture content of straw bales at the time of
their installation shall not exceed 20 percent
of the total weight of the bale. Five bales
are to be selected at random from the lot or
shipment of bales to be used in construction.
Testing may be performed in the fi eld using an
electric resistance moisture meter calibrated to
read by percentage, with probes long enough
to test the center of each bale. A testing lab
may also confi rm the moisture content by
weighing the bales before and after fully drying
them in an oven.
While straw bales vary widely in the type of
straw, degree of compaction, density and
moisture content, they are nonetheless a
uniformly sized, mechanically bundled low-
cost unit that can be readily used for super-
insulating building blocks. Extra care must
be taken in the erection and fi nishing of this
system to ensure its longevity.
124
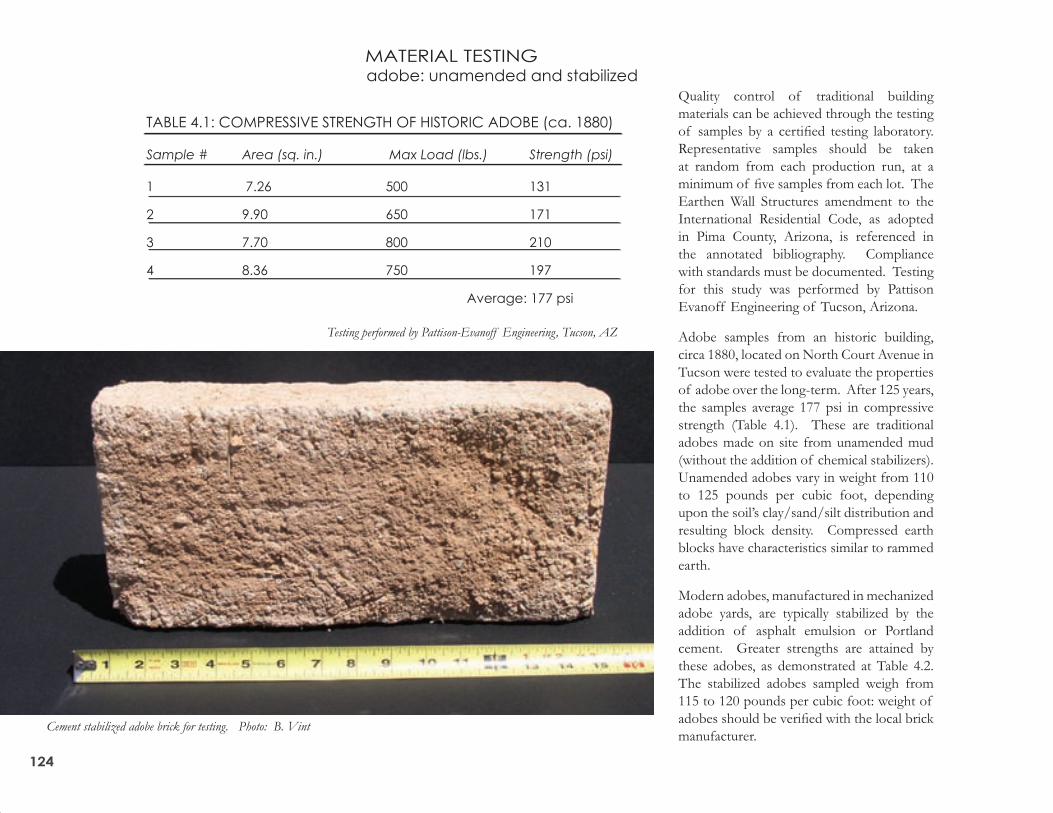
Cement stabilized adobe brick for testing. Photo: B. Vint
TABLE 4.1: COMPRESSIVE STRENGTH OF HISTORIC ADOBE (ca. 1880)
Sample # Area (sq. in.) Max Load (lbs.) Strength (psi)
1 7.26 500 131
2 9.90 650 171
3 7.70 800 210
4 8.36 750 197
Average: 177 psi
Quality control of traditional building
materials can be achieved through the testing
of samples by a certifi ed testing laboratory.
Representative samples should be taken
at random from each production run, at a
minimum of fi ve samples from each lot. The
Earthen Wall Structures amendment to the
International Residential Code, as adopted
in Pima County, Arizona, is referenced in
the annotated bibliography. Compliance
with standards must be documented. Testing
for this study was performed by Pattison
Evanoff Engineering of Tucson, Arizona.
Adobe samples from an historic building,
circa 1880, located on North Court Avenue in
Tucson were tested to evaluate the properties
of adobe over the long-term. After 125 years,
the samples average 177 psi in compressive
strength (Table 4.1). These are traditional
adobes made on site from unamended mud
(without the addition of chemical stabilizers).
Unamended adobes vary in weight from 110
to 125 pounds per cubic foot, depending
upon the soil’s clay/sand/silt distribution and
resulting block density. Compressed earth
blocks have characteristics similar to rammed
earth.
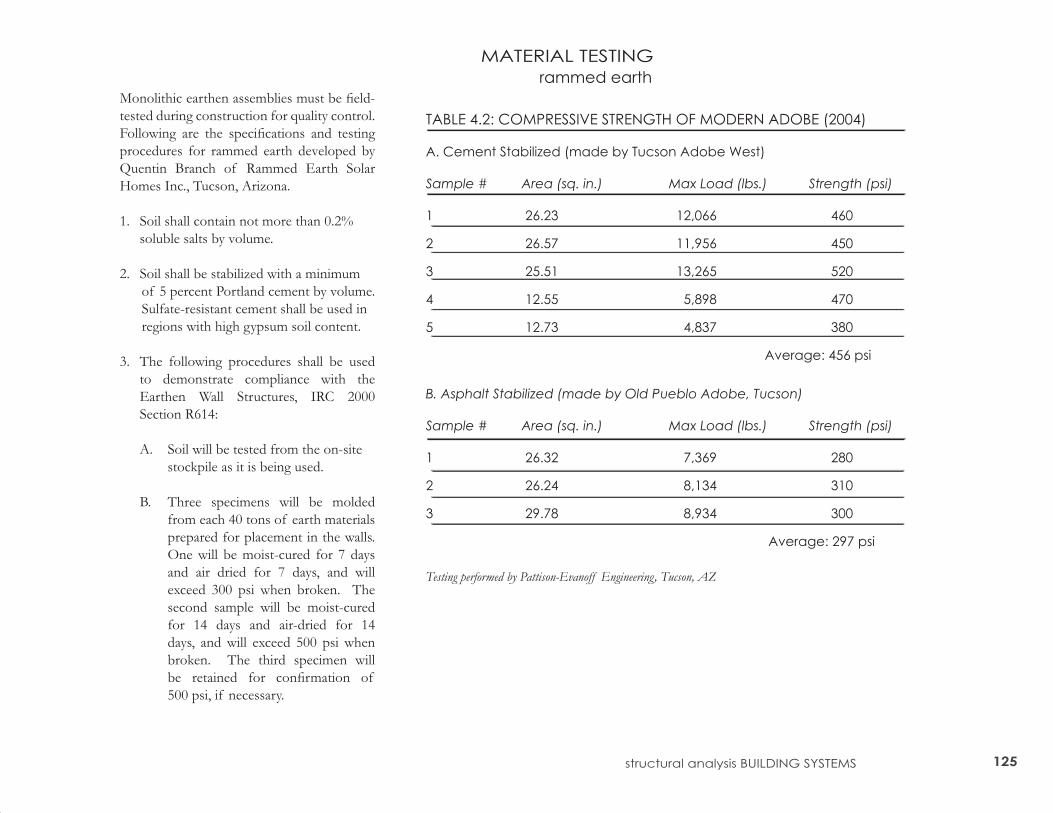
Modern adobes, manufactured in mechanized
adobe yards, are typically stabilized by the
addition of asphalt emulsion or Portland
cement. Greater strengths are attained by
these adobes, as demonstrated at Table 4.2.
The stabilized adobes sampled weigh from
115 to 120 pounds per cubic foot: weight of
adobes should be verifi ed with the local brick
manufacturer.
Testing performed by Pattison-Evanoff Engineering, Tucson, AZ
MATERIAL TESTINGadobe: unamended and stabilized
125structural analysis BUILDING SYSTEMS
TABLE 4.2: COMPRESSIVE STRENGTH OF MODERN ADOBE (2004) A. Cement Stabilized (made by Tucson Adobe West)
Sample # Area (sq. in.) Max Load (lbs.) Strength (psi)
1 26.23 12,066 460
2 26.57 11,956 450
3 25.51 13,265 520
4 12.55 5,898 470
5 12.73 4,837 380
Average: 456 psi
B. Asphalt Stabilized (made by Old Pueblo Adobe, Tucson)
Sample # Area (sq. in.) Max Load (lbs.) Strength (psi)
1 26.32 7,369 280
2 26.24 8,134 310
3 29.78 8,934 300
Average: 297 psi
Monolithic earthen assemblies must be fi eld-
tested during construction for quality control.
Following are the specifi cations and testing
procedures for rammed earth developed by
Quentin Branch of Rammed Earth Solar
Homes Inc., Tucson, Arizona.
1. Soil shall contain not more than 0.2%
soluble salts by volume.
2. Soil shall be stabilized with a minimum
of 5 percent Portland cement by volume.
Sulfate-resistant cement shall be used in
regions with high gypsum soil content.
3. The following procedures shall be used
to demonstrate compliance with the
Earthen Wall Structures, IRC 2000
Section R614:
A. Soil will be tested from the on-site
stockpile as it is being used.
B. Three specimens will be molded
from each 40 tons of earth materials
prepared for placement in the walls.
One will be moist-cured for 7 days
and air dried for 7 days, and will
exceed 300 psi when broken. The
second sample will be moist-cured
for 14 days and air-dried for 14
days, and will exceed 500 psi when
broken. The third specimen will
be retained for confi rmation of
500 psi, if necessary.
Testing performed by Pattison-Evanoff Engineering, Tucson, AZ
MATERIAL TESTING
rammed earth
126
C. Soil will be tested in accordance
with ASTM D558 (Moisture
Density of Soil Cement Mixtures)
or ASTM D698.
D. A sand-cone density or nuclear
back-scatter test will be performed
in the wall. The fi nished wall must
exceed 95 percent relative compaction.
E. Copies of the engineering testing
laboratory reports shall be attached
to the inspection card at the
construction site for the building
inspector’s review.
4. Rammed earth weighs between 123 and
127 pound per cubic foot (average
125 pcf).
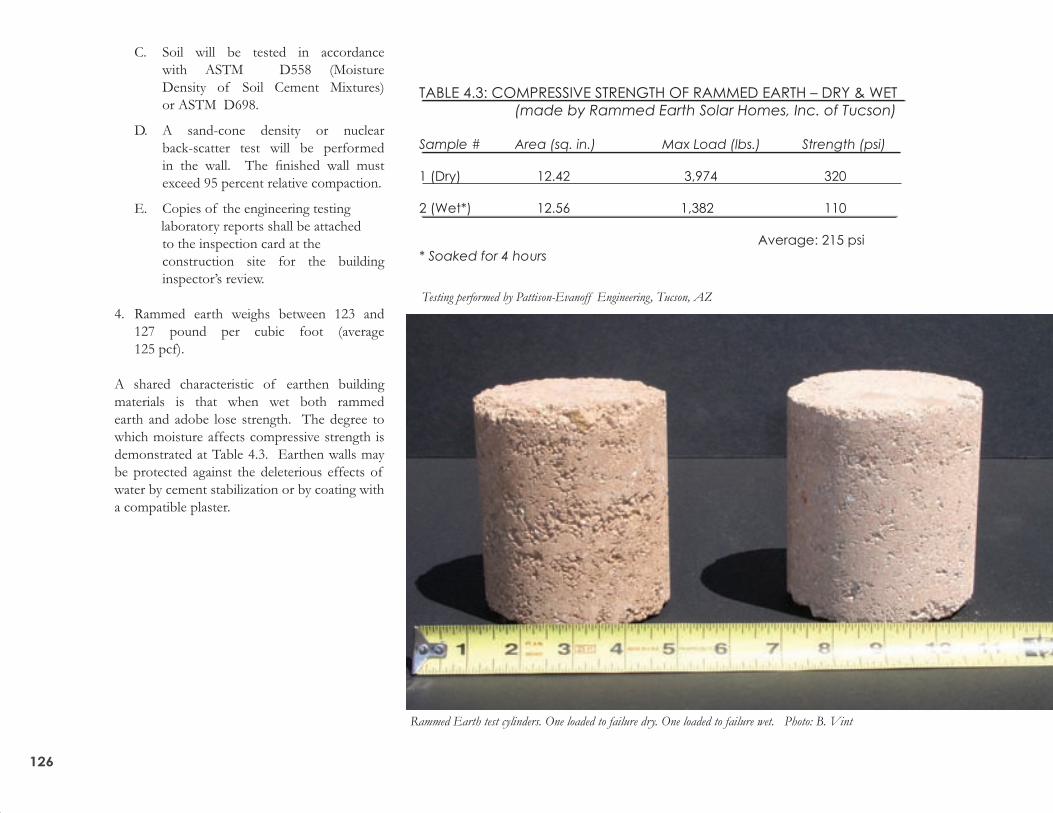
A shared characteristic of earthen building
materials is that when wet both rammed
earth and adobe lose strength. The degree to
which moisture affects compressive strength is
demonstrated at Table 4.3. Earthen walls may
be protected against the deleterious effects of
water by cement stabilization or by coating with
a compatible plaster.
TABLE 4.3: COMPRESSIVE STRENGTH OF RAMMED EARTH – DRY & WET
(made by Rammed Earth Solar Homes, Inc. of Tucson) Sample # Area (sq. in.) Max Load (lbs.) Strength (psi)
1 (Dry) 12.42 3,974 320
2 (Wet*) 12.56 1,382 110
Average: 215 psi
* Soaked for 4 hours
Rammed Earth test cylinders. One loaded to failure dry. One loaded to failure wet. Photo: B. Vint
Testing performed by Pattison-Evanoff Engineering, Tucson, AZ
127
Indigenous inhabitants of the US/Mexican deserts relied on their instincts to inform themselves about their
regional climate to obtain thermal comfort, or that state of contentment a body desires within its thermal environment.
From Acoma Pueblo to the Gray Ranch, the vernacular examples profi led in Ch. 2, Design, feature regional building
adaptations that represent a thousand years of research and evolution. These peoples did not have a constant
stream of harnessed energy to power mechanical conditioning devices, such as air conditioners or gas furnaces.
Instead, they developed building techniques that demonstrate resourceful use of natural forces and materials for
passive heating and cooling, such as solar orientation, thermal storage mass walls, earth cooling, evaporative cooling, vegetated
and built shade devices, and natural ventilation.
Energy-effi cient construction and adaptable operational techniques which evolved from the local climate to
gain a greater level of thermal comfort are called passive conditioning strategies. Since these strategies emphasize
thermal comfort with minimal or no energy consumption, they hold important lessons to apply to contemporary
affordable housing design. The following section is an investigation of the effectiveness of US Southwest
regional passive strategies. It focuses on predicting the thermal effi ciency of some pre-selected urban and rural
vernacular examples as a function of the site features, building form, and building envelope. Thermal performance
will be measured by the effi ciency of the building enclosure to provide thermal comfort rather than the more typically chosen analysis
of mechanical heating and cooling loads. Both urban and rural vernacular houses have been analyzed through fi eld
testing and computer energy simulation as separate cases, due to climatic differences between their locations. The
urban case is the Fish Stevens Duffi eld House of Tucson, Arizona, and the rural case is the Upshaw House on the
Gray Ranch near Animas, New Mexico. The emphasis here is on strategies that vernacular builders employed for
passive conditioning. The performance of these traditional houses will be compared to that of a contemporary
manufactured house. The affordability of a house depends on the operational costs for utilities and maintenance
over the lifetime of the housing unit, or lifecycle cost as much as the initial purchase cost, or fi rst cost.
CalPas 3 is the software used for the energy simulation. Supplemental information on this software can be found
in the Appendix (see p. 199). Although it is a common practice to use computer simulation to predict heating
and cooling loads based on pre-set summer and winter interior temperatures, simulation of traditional buildings
is different. Analysis of interior conditions without use of any mechanical system for conditioning requires
simulation that will shift the focus to predicting interior “fl oating” temperatures as related to human thermal
comfort. This way, researchers can determine the effect of the building envelope and its role in passively creating
a comfortable indoor environment, particularly during summer and winter which are times of seasonal and
diurnal climatic extremes. These are the most diffi cult times for low-income families on a fi xed budget who may
fi nd themselves with excessively high heating and cooling bills.
THERMAL PERFORMANCE ANALYSIS
128
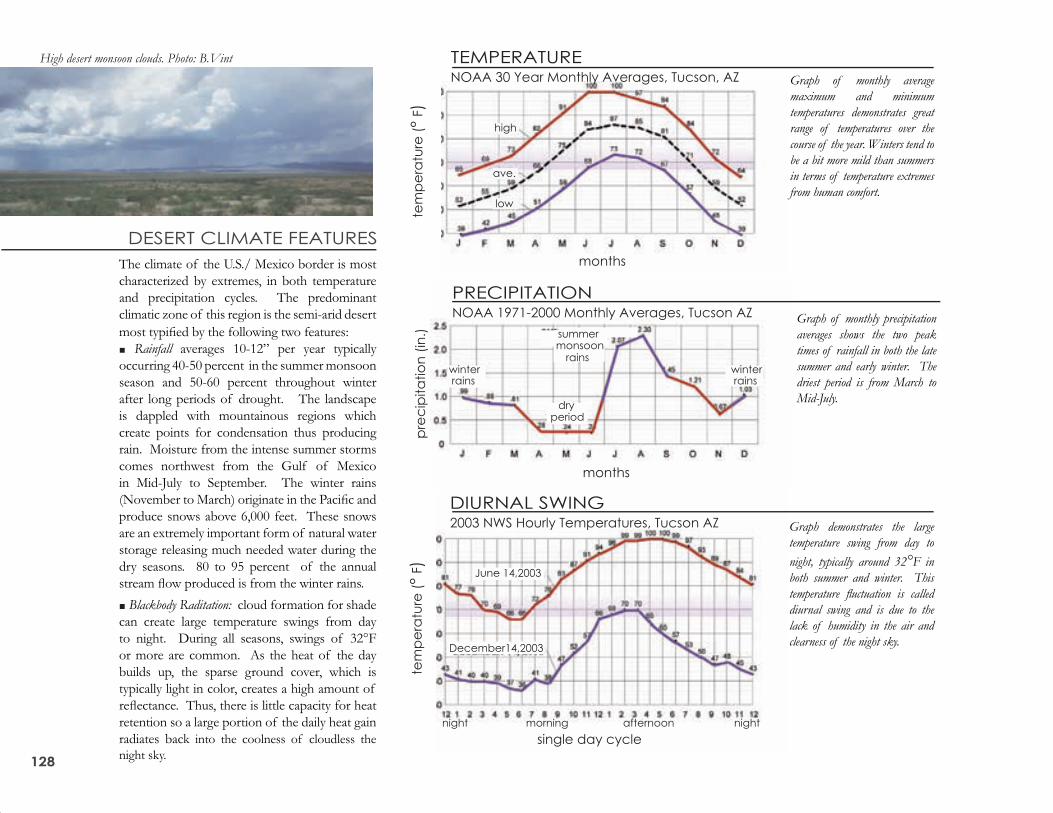
The climate of the U.S./ Mexico border is most
characterized by extremes, in both temperature
and precipitation cycles. The predominant
climatic zone of this region is the semi-arid desert
most typifi ed by the following two features:
■ Rainfall averages 10-12” per year typically
occurring 40-50 percent in the summer monsoon
season and 50-60 percent throughout winter
after long periods of drought. The landscape
is dappled with mountainous regions which
create points for condensation thus producing
rain. Moisture from the intense summer storms
comes northwest from the Gulf of Mexico
in Mid-July to September. The winter rains
(November to March) originate in the Pacifi c and
produce snows above 6,000 feet. These snows
are an extremely important form of natural water
storage releasing much needed water during the
dry seasons. 80 to 95 percent of the annual
stream fl ow produced is from the winter rains.
■ Blackbody Raditation: cloud formation for shade
can create large temperature swings from day
to night. During all seasons, swings of 32°F
or more are common. As the heat of the day
builds up, the sparse ground cover, which is
typically light in color, creates a high amount of
refl ectance. Thus, there is little capacity for heat
retention so a large portion of the daily heat gain
radiates back into the coolness of cloudless the
night sky.
High desert monsoon clouds. Photo: B.Vint
Graph of monthly average
maximum and minimum
temperatures demonstrates great
range of temperatures over the
course of the year. Winters tend to
be a bit more mild than summers
in terms of temperature extremes
from human comfort.
TEMPERATURENOAA 30 Year Monthly Averages, Tucson, AZ
tem
pe
ratu
re (°
F)
months
high
ave.
low
DESERT CLIMATE FEATURES
Graph demonstrates the large
temperature swing from day to
night, typically around 32°F in
both summer and winter. This
temperature fl uctuation is called
diurnal swing and is due to the
lack of humidity in the air and
clearness of the night sky.
tem
pe
ratu
re (°
F)
June 14,2003
December14,2003
single day cycle
night morning afternoon night
DIURNAL SWING2003 NWS Hourly Temperatures, Tucson AZ
Graph of monthly precipitation
averages shows the two peak
times of rainfall in both the late
summer and early winter. The
driest period is from March to
Mid-July.
pre
cip
ita
tio
n (
in.)
PRECIPITATIONNOAA 1971-2000 Monthly Averages, Tucson AZ
winter rains
dryperiod
winter rains
summermonsoon
rains
months
129 sw regional housing THERMAL PERFORMANCE ANALYSIS
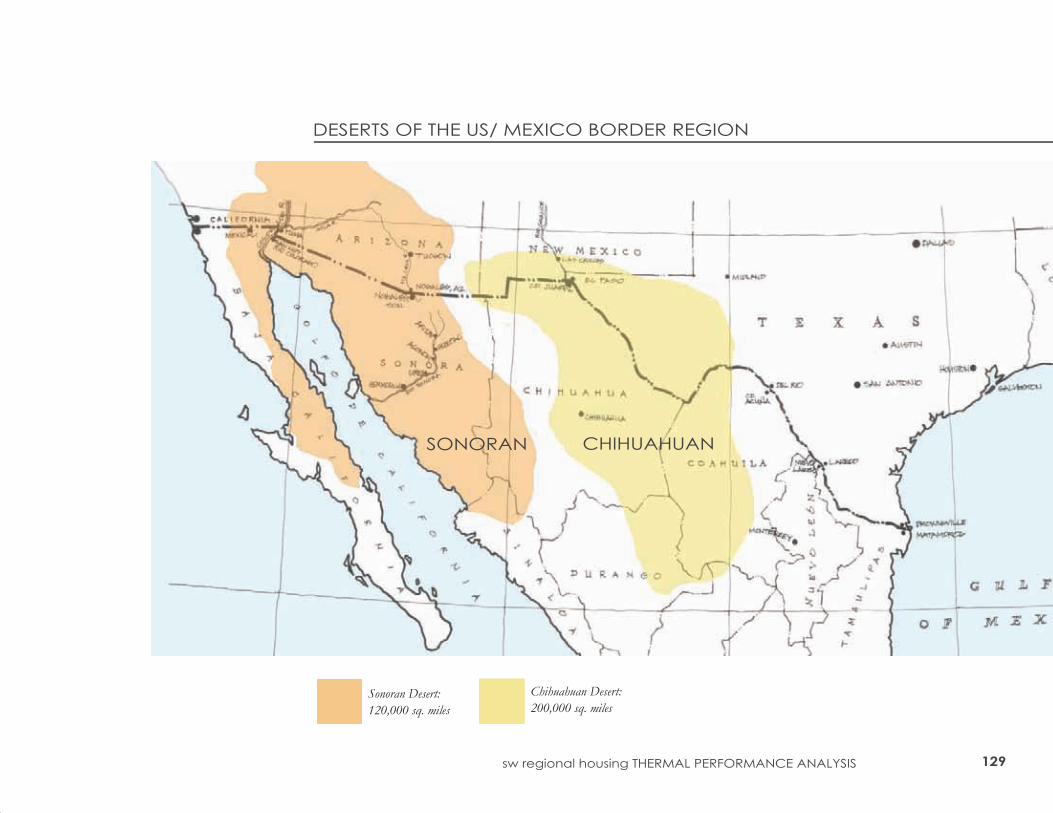
Sonoran Desert:
120,000 sq. miles
Chihuahuan Desert:
200,000 sq. miles
DESERTS OF THE US/ MEXICO BORDER REGION
SONORAN CHIHUAHUAN
130
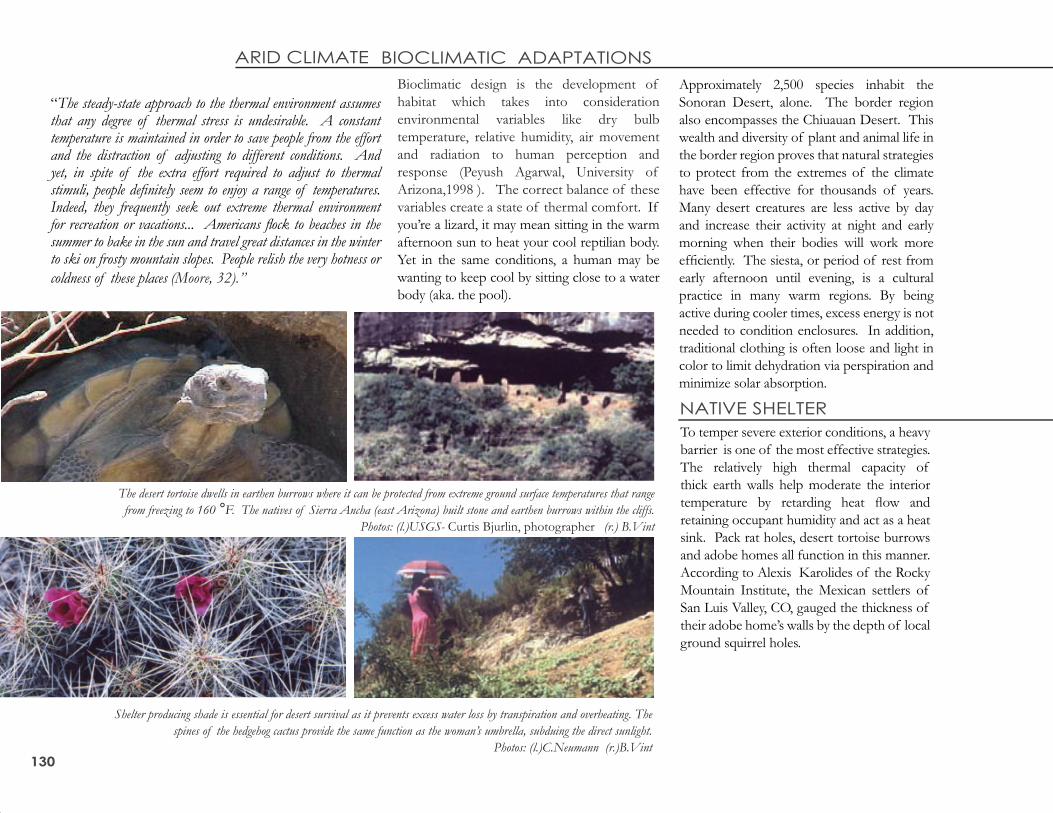
The desert tortoise dwells in earthen burrows where it can be protected from extreme ground surface temperatures that range
from freezing to 160 °F. The natives of Sierra Ancha (east Arizona) built stone and earthen burrows within the cliffs.
Photos: (l.)USGS- Curtis Bjurlin, photographer (r.) B.Vint
Shelter producing shade is essential for desert survival as it prevents excess water loss by transpiration and overheating. The
spines of the hedgehog cactus provide the same function as the woman’s umbrella, subduing the direct sunlight.
Photos: (l.)C.Neumann (r.)B.Vint
Approximately 2,500 species inhabit the
Sonoran Desert, alone. The border region
also encompasses the Chiuauan Desert. This
wealth and diversity of plant and animal life in
the border region proves that natural strategies
to protect from the extremes of the climate
have been effective for thousands of years.
Many desert creatures are less active by day
and increase their activity at night and early
morning when their bodies will work more
effi ciently. The siesta, or period of rest from
early afternoon until evening, is a cultural
practice in many warm regions. By being
active during cooler times, excess energy is not
needed to condition enclosures. In addition,
traditional clothing is often loose and light in
color to limit dehydration via perspiration and
minimize solar absorption.
To temper severe exterior conditions, a heavy
barrier is one of the most effective strategies.
The relatively high thermal capacity of
thick earth walls help moderate the interior
temperature by retarding heat fl ow and
retaining occupant humidity and act as a heat
sink. Pack rat holes, desert tortoise burrows
and adobe homes all function in this manner.
According to Alexis Karolides of the Rocky
Mountain Institute, the Mexican settlers of
San Luis Valley, CO, gauged the thickness of
their adobe home’s walls by the depth of local
ground squirrel holes.
Bioclimatic design is the development of
habitat which takes into consideration
environmental variables like dry bulb
temperature, relative humidity, air movement
and radiation to human perception and
response (Peyush Agarwal, University of
Arizona,1998 ). The correct balance of these
variables create a state of thermal comfort. If
you’re a lizard, it may mean sitting in the warm
afternoon sun to heat your cool reptilian body.
Yet in the same conditions, a human may be
wanting to keep cool by sitting close to a water
body (aka. the pool).
“The steady-state approach to the thermal environment assumes that any degree of thermal stress is undesirable. A constant temperature is maintained in order to save people from the effort and the distraction of adjusting to different conditions. And yet, in spite of the extra effort required to adjust to thermal stimuli, people defi nitely seem to enjoy a range of temperatures. Indeed, they frequently seek out extreme thermal environment for recreation or vacations... Americans fl ock to beaches in the summer to bake in the sun and travel great distances in the winter to ski on frosty mountain slopes. People relish the very hotness or
coldness of these places (Moore, 32).”
ARID CLIMATE BIOCLIMATIC ADAPTATIONS
NATIVE SHELTER
131 sw regional housing THERMAL PERFORMANCE ANALYSIS
day night
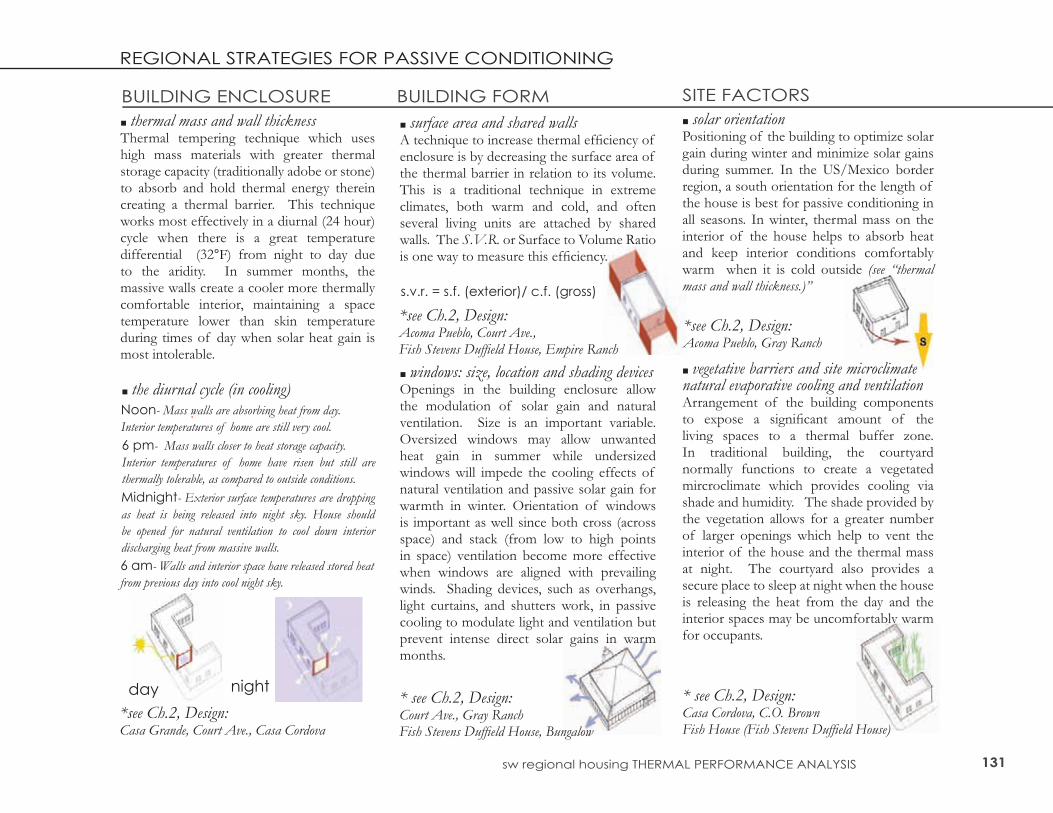
■ the diurnal cycle (in cooling)
■ thermal mass and wall thicknessThermal tempering technique which uses high mass materials with greater thermal storage capacity (traditionally adobe or stone) to absorb and hold thermal energy therein creating a thermal barrier. This technique works most effectively in a diurnal (24 hour) cycle when there is a great temperature differential (32°F) from night to day due to the aridity. In summer months, the massive walls create a cooler more thermally comfortable interior, maintaining a space temperature lower than skin temperature during times of day when solar heat gain is most intolerable.
6 am- Walls and interior space have released stored heat
from previous day into cool night sky.
Noon- Mass walls are absorbing heat from day.
Interior temperatures of home are still very cool.
6 pm- Mass walls closer to heat storage capacity.
Interior temperatures of home have risen but still are
thermally tolerable, as compared to outside conditions.
Midnight- Exterior surface temperatures are dropping
as heat is being released into night sky. House should
be opened for natural ventilation to cool down interior
discharging heat from massive walls.
*see Ch.2, Design: Casa Grande, Court Ave., Casa Cordova
*see Ch.2, Design: Acoma Pueblo, Court Ave., Fish Stevens Duffi eld House, Empire Ranch
■ solar orientationPositioning of the building to optimize solar gain during winter and minimize solar gains during summer. In the US/Mexico border region, a south orientation for the length of the house is best for passive conditioning in all seasons. In winter, thermal mass on the interior of the house helps to absorb heat and keep interior conditions comfortably warm when it is cold outside (see “thermal mass and wall thickness.)”
■ vegetative barriers and site microclimatenatural evaporative cooling and ventilationArrangement of the building components to expose a signifi cant amount of the living spaces to a thermal buffer zone. In traditional building, the courtyard normally functions to create a vegetated mircroclimate which provides cooling via shade and humidity. The shade provided by the vegetation allows for a greater number of larger openings which help to vent the interior of the house and the thermal mass at night. The courtyard also provides a secure place to sleep at night when the house is releasing the heat from the day and the interior spaces may be uncomfortably warm for occupants.
*see Ch.2, Design: Acoma Pueblo, Gray Ranch
* see Ch.2, Design: Casa Cordova, C.O. Brown Fish House (Fish Stevens Duffi eld House)
s.v.r. = s.f. (exterior)/ c.f. (gross)
* see Ch.2, Design: Court Ave., Gray RanchFish Stevens Duffi eld House, Bungalow
REGIONAL STRATEGIES FOR PASSIVE CONDITIONING
BUILDING ENCLOSURE SITE FACTORSBUILDING FORM
■ surface area and shared wallsA technique to increase thermal effi ciency of enclosure is by decreasing the surface area of the thermal barrier in relation to its volume. This is a traditional technique in extreme climates, both warm and cold, and often several living units are attached by shared walls. The S.V.R. or Surface to Volume Ratio is one way to measure this effi ciency.
■ windows: size, location and shading devicesOpenings in the building enclosure allow the modulation of solar gain and natural ventilation. Size is an important variable. Oversized windows may allow unwanted heat gain in summer while undersized windows will impede the cooling effects of natural ventilation and passive solar gain for warmth in winter. Orientation of windows is important as well since both cross (across space) and stack (from low to high points in space) ventilation become more effective when windows are aligned with prevailing winds. Shading devices, such as overhangs, light curtains, and shutters work, in passive cooling to modulate light and ventilation but prevent intense direct solar gains in warm months.
132
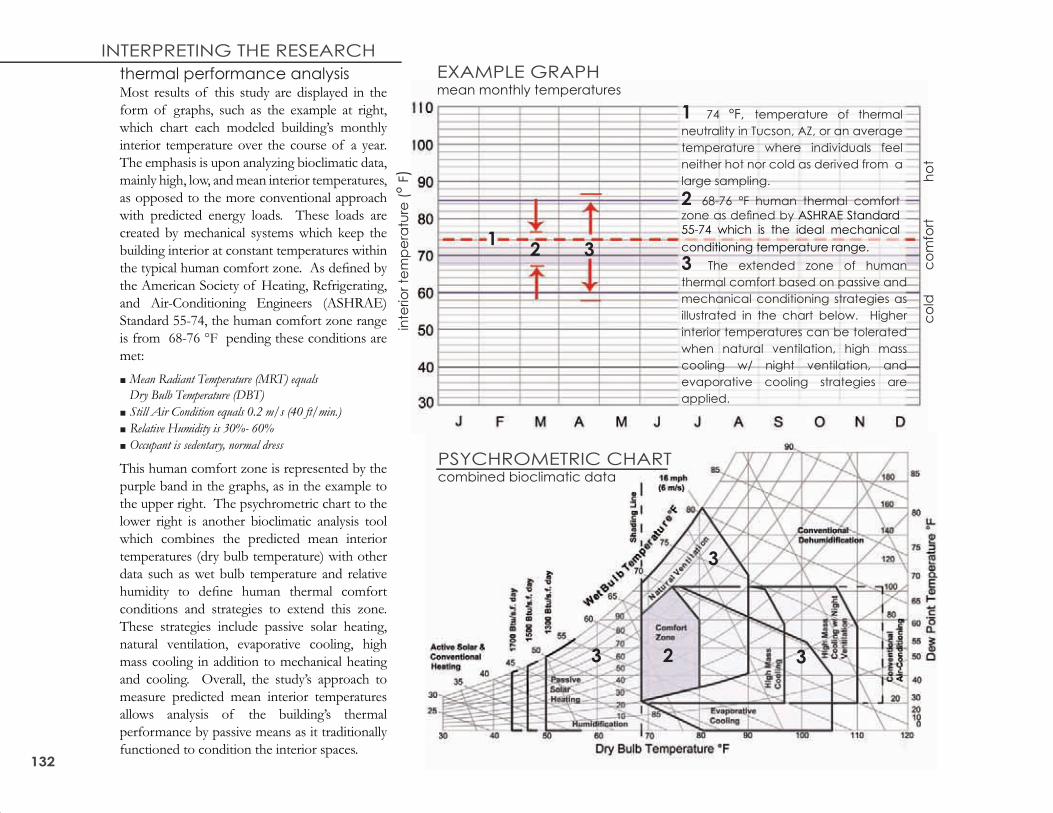
thermal performance analysisMost results of this study are displayed in the
form of graphs, such as the example at right,
which chart each modeled building’s monthly
interior temperature over the course of a year.
The emphasis is upon analyzing bioclimatic data,
mainly high, low, and mean interior temperatures,
as opposed to the more conventional approach
with predicted energy loads. These loads are
created by mechanical systems which keep the
building interior at constant temperatures within
the typical human comfort zone. As defi ned by
the American Society of Heating, Refrigerating,
and Air-Conditioning Engineers (ASHRAE)
Standard 55-74, the human comfort zone range
is from 68-76 °F pending these conditions are
met:
■ Mean Radiant Temperature (MRT) equals
Dry Bulb Temperature (DBT)
■ Still Air Condition equals 0.2 m/s (40 ft/min.)
■ Relative Humidity is 30%- 60%
■ Occupant is sedentary, normal dress
This human comfort zone is represented by the
purple band in the graphs, as in the example to
the upper right. The psychrometric chart to the
lower right is another bioclimatic analysis tool
which combines the predicted mean interior
temperatures (dry bulb temperature) with other
data such as wet bulb temperature and relative
humidity to defi ne human thermal comfort
conditions and strategies to extend this zone.
These strategies include passive solar heating,
natural ventilation, evaporative cooling, high
mass cooling in addition to mechanical heating
and cooling. Overall, the study’s approach to
measure predicted mean interior temperatures
allows analysis of the building’s thermal
performance by passive means as it traditionally
functioned to condition the interior spaces.
inte
rio
r te
mp
era
ture
(°
F)
months
co
ldc
om
fort
ho
t
EXAMPLE GRAPHmean monthly temperatures
1 74 °F, temperature of thermal
neutrality in Tucson, AZ, or an average
temperature where individuals feel
neither hot nor cold as derived from a
large sampling.
2 68-76 °F human thermal comfort
zone as defi ned by ASHRAE Standard
55-74 which is the ideal mechanical
conditioning temperature range.
3 The extended zone of human
thermal comfort based on passive and
mechanical conditioning strategies as
illustrated in the chart below. Higher
interior temperatures can be tolerated
when natural ventilation, high mass
cooling w/ night ventilation, and
evaporative cooling strategies are
applied.
13
PSYCHROMETRIC CHARTcombined bioclimatic data
2
2 33
3
INTERPRETING THE RESEARCH
133 sw regional housing THERMAL PERFORMANCE ANALYSIS
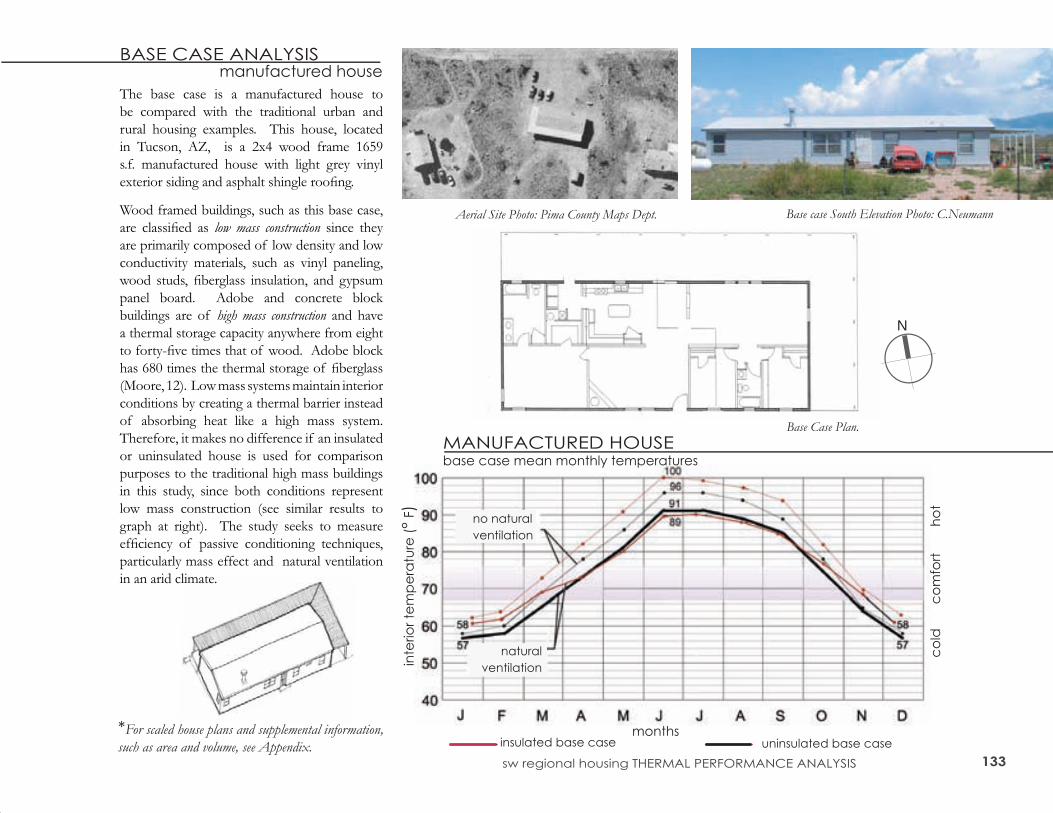
Base case South Elevation Photo: C.Neumann
Base Case Plan.
N
Aerial Site Photo: Pima County Maps Dept.
*For scaled house plans and supplemental information,
such as area and volume, see Appendix.
BASE CASE ANALYSIS manufactured house
The base case is a manufactured house to
be compared with the traditional urban and
rural housing examples. This house, located
in Tucson, AZ, is a 2x4 wood frame 1659
s.f. manufactured house with light grey vinyl
exterior siding and asphalt shingle roofi ng.
Wood framed buildings, such as this base case,
are classifi ed as low mass construction since they
are primarily composed of low density and low
conductivity materials, such as vinyl paneling,
wood studs, fi berglass insulation, and gypsum
panel board. Adobe and concrete block
buildings are of high mass construction and have
a thermal storage capacity anywhere from eight
to forty-fi ve times that of wood. Adobe block
has 680 times the thermal storage of fi berglass
(Moore, 12). Low mass systems maintain interior
conditions by creating a thermal barrier instead
of absorbing heat like a high mass system.
Therefore, it makes no difference if an insulated
or uninsulated house is used for comparison
purposes to the traditional high mass buildings
in this study, since both conditions represent
low mass construction (see similar results to
graph at right). The study seeks to measure
effi ciency of passive conditioning techniques,
particularly mass effect and natural ventilation
in an arid climate.
MANUFACTURED HOUSEbase case mean monthly temperatures
inte
rio
r te
mp
era
ture
(°
F)
months
no natural
ventilation
natural
ventilation
co
ldc
om
fort
ho
t
insulated base case uninsulated base case
134
base case building section
R ROOF- NOT INSULATED BTWN RAFTER (90%) @ RAFTER (10%)INSIDE SURFACE 0.62 0.625/8” GYPSUM BOARD 0.56 0.56 1/2” PLYWOOD 0.63 0.63 NOMINAL 2x6 RAFTER --- 5.22 6” FIBERGLASS BATT INSUL. --- --- PLYWOOD SHEATHING 0.61 0.61 PERM.FELT MEMBRANE 0.06 0.06ASPHALT SHINGLE ROOFING 0.44 0.44OUTSIDE SURFACE 0.17 0.17
TOTAL R: 3.09 8.29
AVE R = 3.61 U= 0.28
R WALL- NOT INSULATED BTWN STUDS (92%) @ STUDS (8%)INSIDE SURFACE 0.62 0.625/8” GYPSUM BOARD 0.56 0.56 1/2” PLYWOOD 0.63 0.63 NOMINAL 2x4 STUD --- 4.356” FIBERGLASS BATT INSUL --- --- PLYWOOD SHEATHING 0.61 0.61 VINYL PANELING 0.61 0.61OUTSIDE SURFACE 0.17 0.17
TOTAL R: 3.20 7.55
AVE R = 3.55 U= 0.28
R FLOOR- NOT INSULATED BTWN TJI (96%) @ RAFTER (4%)INSIDE SURFACE 0.62 0.62CARPETING W/ RUBBER PAD 1.23 1.231/2” PLYWOOD 0.63 0.63 16” DEEP TJI ---- 16.06” FIBERGLASS BATT INSUL ---- ---- OUTSIDE SURFACE 0.17 0.17
TOTAL R: 2.65 18.36
AVE R = 3.29 U= 0.30
* NOTE: U-VALUE FOR SINGLE PANE VINYL WINDOW= 0.5ACCOUNTED FOR IN CALPAS 3 AS SEPARATE ELEMENT FROM ROOF, WALL, OR FLOOR.
0 1 2
scale 3/8” =1’-0”
MANUFACTURED HOUSE TYPICAL WALL SECTIONS
CONDUCTIVITY AND HEAT RESISTANCE
135 sw regional housing THERMAL PERFORMANCE ANALYSIS
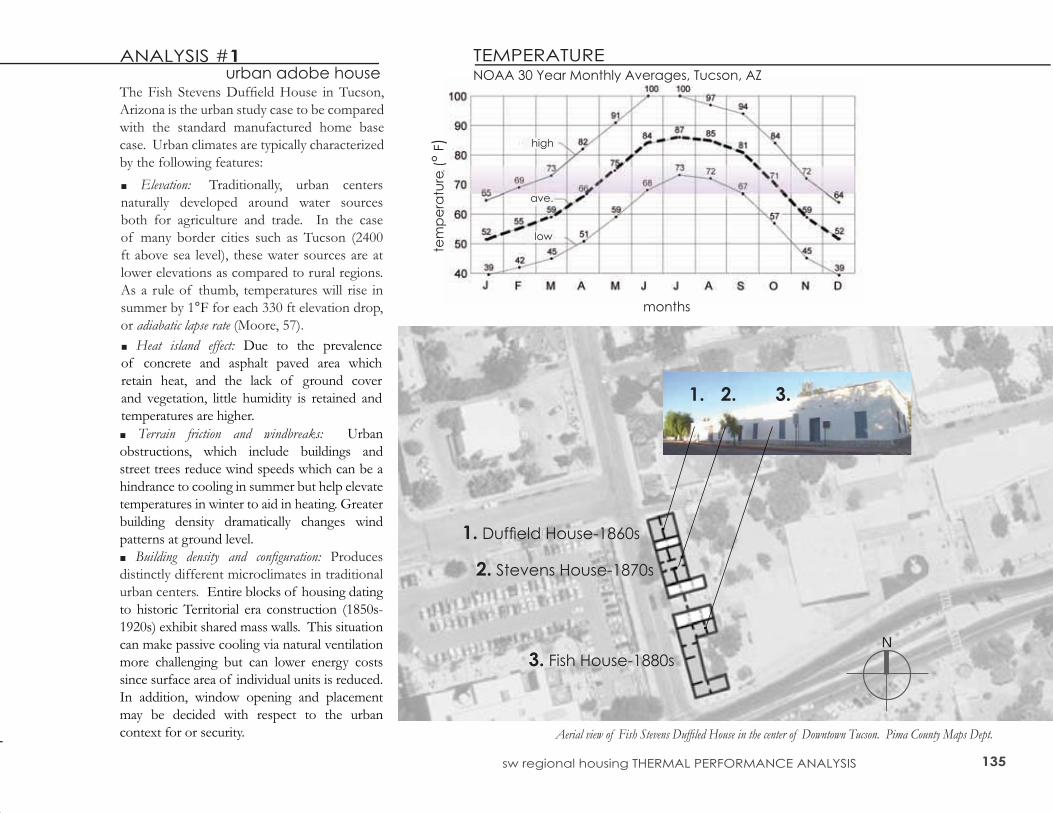
■ Elevation: Traditionally, urban centers
naturally developed around water sources
both for agriculture and trade. In the case
of many border cities such as Tucson (2400
ft above sea level), these water sources are at
lower elevations as compared to rural regions.
As a rule of thumb, temperatures will rise in
summer by 1°F for each 330 ft elevation drop,
or adiabatic lapse rate (Moore, 57).
ANALYSIS #1 urban adobe houseThe Fish Stevens Duffi eld House in Tucson,
Arizona is the urban study case to be compared
with the standard manufactured home base
case. Urban climates are typically characterized
by the following features:
■ Heat island effect: Due to the prevalence
of concrete and asphalt paved area which
retain heat, and the lack of ground cover
and vegetation, little humidity is retained and
temperatures are higher.
■ Terrain friction and windbreaks: Urban
obstructions, which include buildings and
street trees reduce wind speeds which can be a
hindrance to cooling in summer but help elevate
temperatures in winter to aid in heating. Greater
building density dramatically changes wind
patterns at ground level.
■ Building density and confi guration: Produces
distinctly different microclimates in traditional
urban centers. Entire blocks of housing dating
to historic Territorial era construction (1850s-
1920s) exhibit shared mass walls. This situation
can make passive cooling via natural ventilation
more challenging but can lower energy costs
since surface area of individual units is reduced.
In addition, window opening and placement
may be decided with respect to the urban
context for or security. Aerial view of Fish Stevens Duffi led House in the center of Downtown Tucson. Pima County Maps Dept.
N
1. Duffi eld House-1860s
2. Stevens House-1870s
3. Fish House-1880s
1. 2. 3.
tem
pe
ratu
re (°
F)
months
TEMPERATURENOAA 30 Year Monthly Averages, Tucson, AZ
high
ave.
low
136
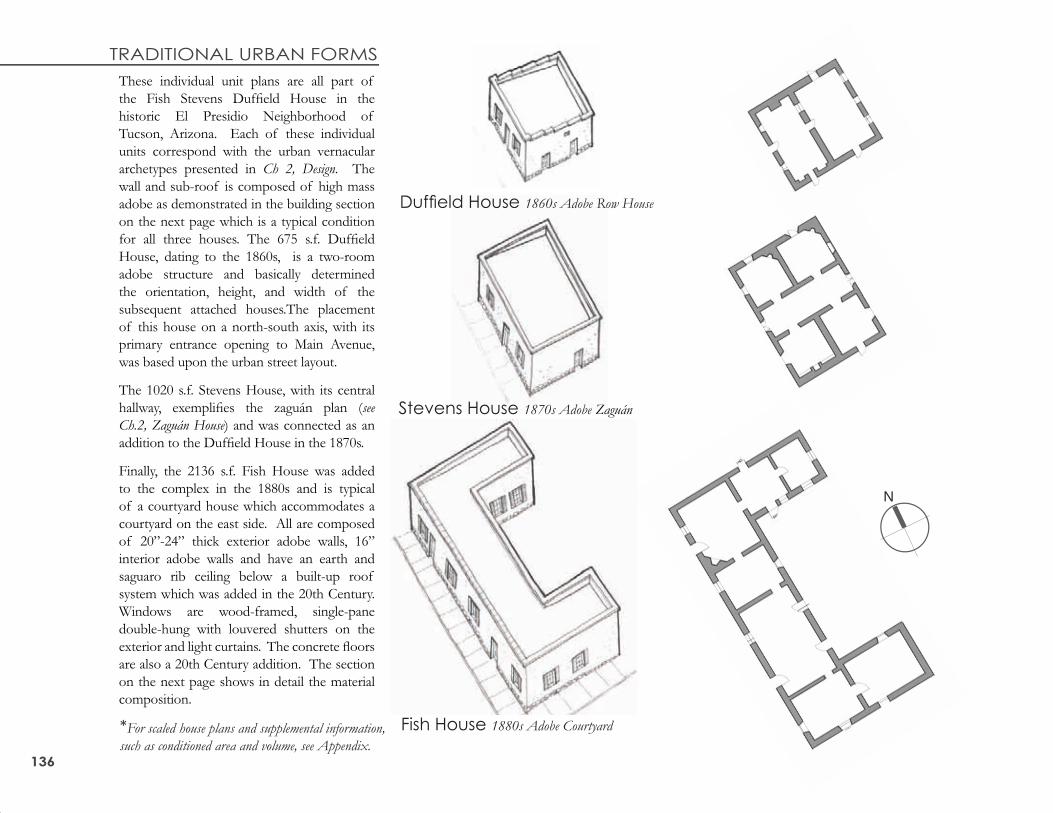
These individual unit plans are all part of
the Fish Stevens Duffi eld House in the
historic El Presidio Neighborhood of
Tucson, Arizona. Each of these individual
units correspond with the urban vernacular
archetypes presented in Ch 2, Design. The
wall and sub-roof is composed of high mass
adobe as demonstrated in the building section
on the next page which is a typical condition
for all three houses. The 675 s.f. Duffi eld
House, dating to the 1860s, is a two-room
adobe structure and basically determined
the orientation, height, and width of the
subsequent attached houses.The placement
of this house on a north-south axis, with its
primary entrance opening to Main Avenue,
was based upon the urban street layout.
The 1020 s.f. Stevens House, with its central
hallway, exemplifi es the zaguán plan (see
Ch.2, Zaguán House) and was connected as an
addition to the Duffi eld House in the 1870s.
Finally, the 2136 s.f. Fish House was added
to the complex in the 1880s and is typical
of a courtyard house which accommodates a
courtyard on the east side. All are composed
of 20”-24” thick exterior adobe walls, 16”
interior adobe walls and have an earth and
saguaro rib ceiling below a built-up roof
system which was added in the 20th Century.
Windows are wood-framed, single-pane
double-hung with louvered shutters on the
exterior and light curtains. The concrete fl oors
are also a 20th Century addition. The section
on the next page shows in detail the material
composition.
Duffi eld House 1860s Adobe Row House
Stevens House 1870s Adobe Zaguán
Fish House 1880s Adobe Courtyard
N
*For scaled house plans and supplemental information,
such as conditioned area and volume, see Appendix.
TRADITIONAL URBAN FORMS
137 sw regional housing THERMAL PERFORMANCE ANALYSIS
U WALL- UNINSULATED PLASTERED ADOBE INSIDE SURFACE 0.621” LIME PLASTER SURFACE 0.61 22” UNSTABILIZED ADOBE -----1” LIME PLASTER SURFACE 0.61OUTSIDE SURFACE 0.17
TOTAL R: 2.01
U= 0.51
U ROOF- BUILT-UP ROOFING ABOVE ORIGINAL EARTH ROOFING BTWN RAFTER (90%) @ RAFTER (10%)OUTSIDE SURFACE 0.17 0.17SILVER PAINTED BUILT-UP ROOF 0.33 0.333/4” PLYWOOD SHEATHING 0.93 0.93ROUGH SAWN 2x6 RAFTER -- 6.116” EARTH ON SAGUARO RIB 1.74 1.74 6” TIMBER BEAM -- 6.11 INSIDE SURFACE 0.62 0.62 TOTAL R: 3.79 16.01
AVE R = 5.0 U= 0.2
U FLOOR- 4” CONCRETE SLAB FACTORED AS MASS ELEMENT IN CALPAS 3 UNDER THE “SLAB” COMMAND. THE DENSITY OF THE STANDARD CONCRETE SPECIFIED IS 140 LBS/ CF. VOLUMETRIC HEAT CAPACITY IS 28 BTU/CF-F AND CONDUCTIVITY IS 0.980 BTUH-FT/ S.f.-F. NO CARPETING IS APPLIED TO THIS SURFACE.
ADOBE SPECIFIED HAS A VOLUMETRIC HEAT CAPACITY OF 25 BTU/CF-F AND CONDUCTIVITY OF 0.30 0 BUTH-FT/S.f.-F.U-VALUE FOR SINGLE PANE VINYL WINDOW= 0.5ACCOUNTED FOR IN CALPAS 3 AS SEPARATE ELEMENT FROM ROOF, WALL, OR FLOOR.
Duffi eld house section
Stevens House Section
Fish House Section 0 1 2
scale 3/8” =1’-0”
CONDUCTIVITY AND HEAT RESISTANCE
URBAN ADOBE TYPICAL WALL SECTIONS
138
EFFECT OF BUILDING FORM
WINTER LOW: 59°FSUMMER HI: 91°F
% YEAR - COMFORT ZONE : 32%% YEAR - EXTENDED COMFORT ZONE : 83%
WINTER LOW: 53°FSUMMER HI: 92°F
% YEAR - COMFORT ZONE : 23%% YEAR - EXTENDED COMFORT ZONE : 81%
WINTER LOW: 55°FSUMMER HI: 89°F
% YEAR - COMFORT ZONE : 22%% YEAR - EXTENDED COMFORT ZONE : 75%
WINTER LOW: 42°FSUMMER HI: 107°F
% YEAR - COMFORT ZONE : 15%% YEAR - EXTENDED COMFORT ZONE : 54%
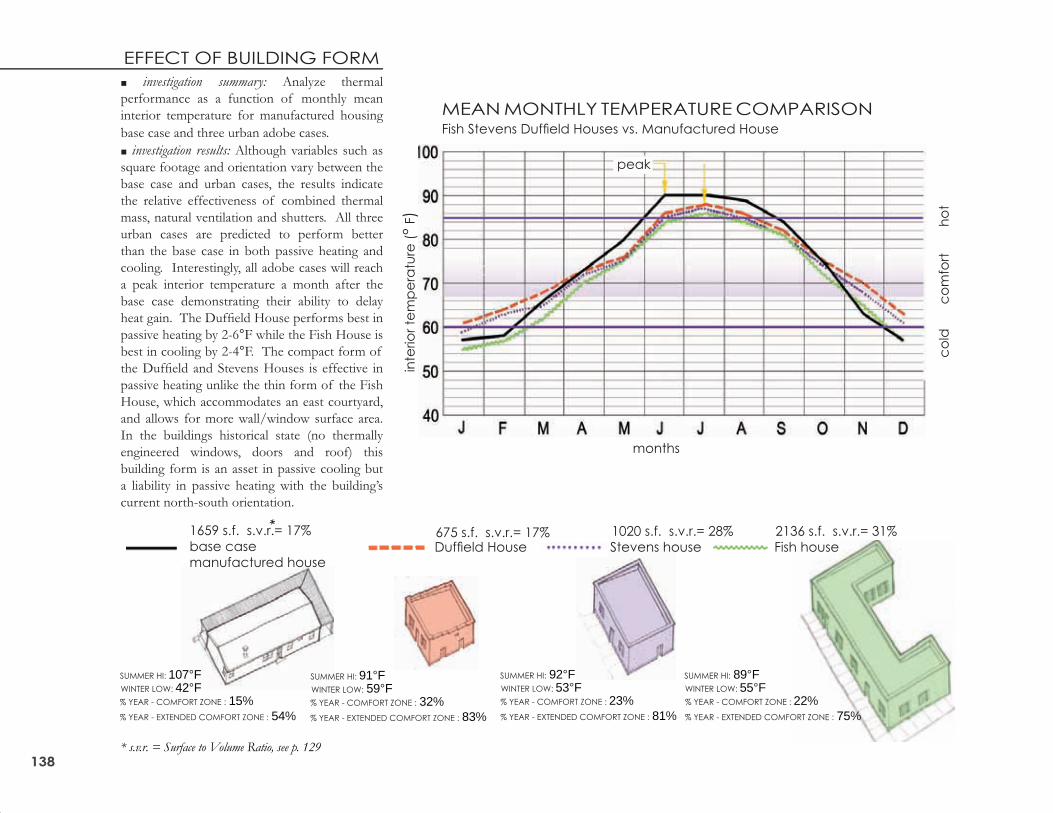
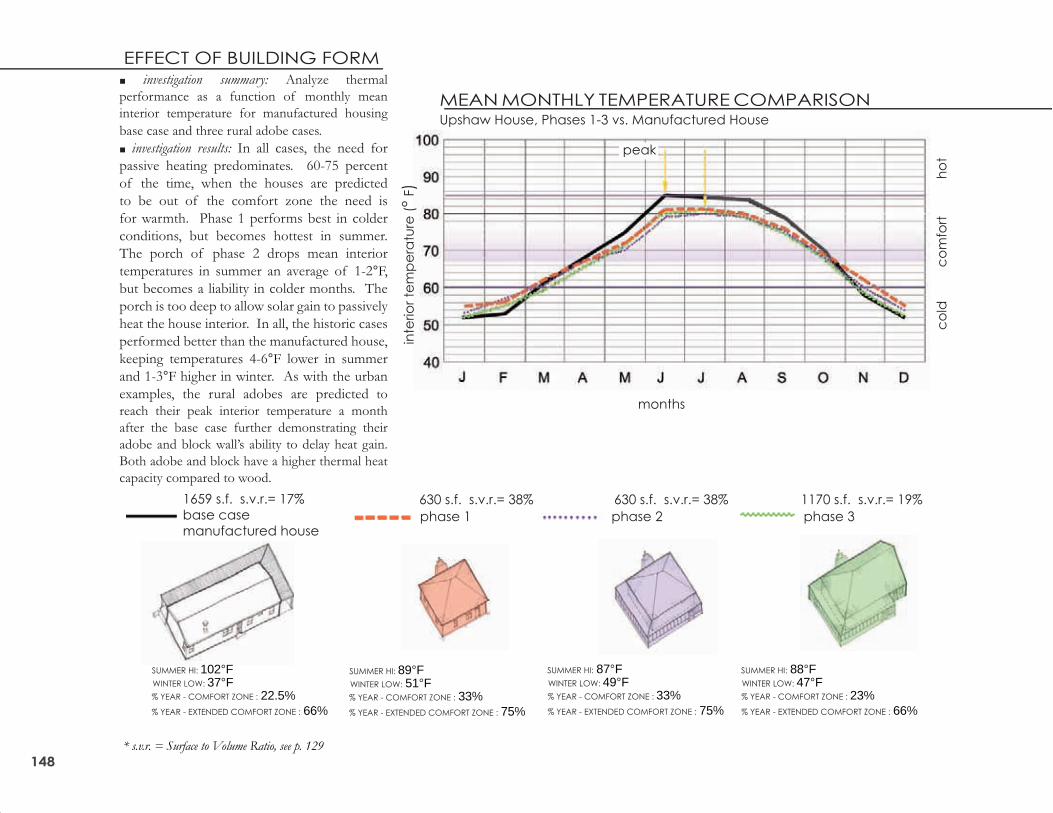
■ investigation summary: Analyze thermal
performance as a function of monthly mean
interior temperature for manufactured housing
base case and three urban adobe cases.
■ investigation results: Although variables such as
square footage and orientation vary between the
base case and urban cases, the results indicate
the relative effectiveness of combined thermal
mass, natural ventilation and shutters. All three
urban cases are predicted to perform better
than the base case in both passive heating and
cooling. Interestingly, all adobe cases will reach
a peak interior temperature a month after the
base case demonstrating their ability to delay
heat gain. The Duffi eld House performs best in
passive heating by 2-6°F while the Fish House is
best in cooling by 2-4°F. The compact form of
the Duffi eld and Stevens Houses is effective in
passive heating unlike the thin form of the Fish
House, which accommodates an east courtyard,
and allows for more wall/window surface area.
In the buildings historical state (no thermally
engineered windows, doors and roof) this
building form is an asset in passive cooling but
a liability in passive heating with the building’s
current north-south orientation.
1659 s.f. s.v.r.= 17%
base case
manufactured houseDuffi eld House Stevens house Fish house675 s.f. s.v.r.= 17% 1020 s.f. s.v.r.= 28% 2136 s.f. s.v.r.= 31%
MEAN MONTHLY TEMPERATURE COMPARISONFish Stevens Duffi eld Houses vs. Manufactured House
inte
rio
r te
mp
era
ture
(°
F)
months
peak
* s.v.r. = Surface to Volume Ratio, see p. 129
* *
co
ldc
om
fort
ho
t
139 sw regional housing THERMAL PERFORMANCE ANALYSIS
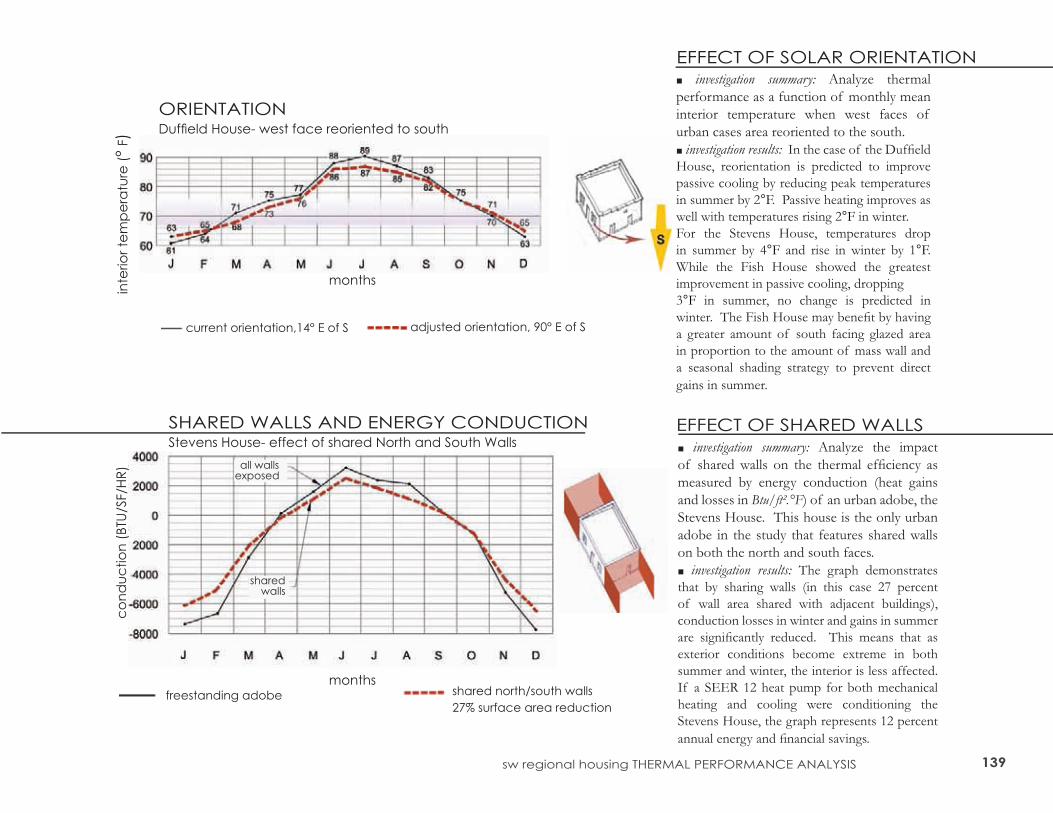
■ investigation summary: Analyze thermal
performance as a function of monthly mean
interior temperature when west faces of
urban cases area reoriented to the south.
■ investigation results: In the case of the Duffi eld
House, reorientation is predicted to improve
passive cooling by reducing peak temperatures
in summer by 2°F. Passive heating improves as
well with temperatures rising 2°F in winter.
For the Stevens House, temperatures drop
in summer by 4°F and rise in winter by 1°F.
While the Fish House showed the greatest
improvement in passive cooling, dropping
3°F in summer, no change is predicted in
winter. The Fish House may benefi t by having
a greater amount of south facing glazed area
in proportion to the amount of mass wall and
a seasonal shading strategy to prevent direct
gains in summer.
EFFECT OF SHARED WALLS
EFFECT OF SOLAR ORIENTATION
■ investigation summary: Analyze the impact
of shared walls on the thermal effi ciency as
measured by energy conduction (heat gains
and losses in Btu/ft².°F) of an urban adobe, the
Stevens House. This house is the only urban
adobe in the study that features shared walls
on both the north and south faces.
■ investigation results: The graph demonstrates
that by sharing walls (in this case 27 percent
of wall area shared with adjacent buildings),
conduction losses in winter and gains in summer
are signifi cantly reduced. This means that as
exterior conditions become extreme in both
summer and winter, the interior is less affected.
If a SEER 12 heat pump for both mechanical
heating and cooling were conditioning the
Stevens House, the graph represents 12 percent
annual energy and fi nancial savings.
ORIENTATION Duffi eld House- west face reoriented to south
inte
rio
r te
mp
era
ture
(°
F)
months
current orientation,14° E of S adjusted orientation, 90° E of S
SHARED WALLS AND ENERGY CONDUCTIONStevens House- effect of shared North and South Walls
co
nd
uc
tio
n (
BTU
/SF/H
R)
monthsfreestanding adobe shared north/south walls
27% surface area reduction
all walls
shared
exposed
walls
140
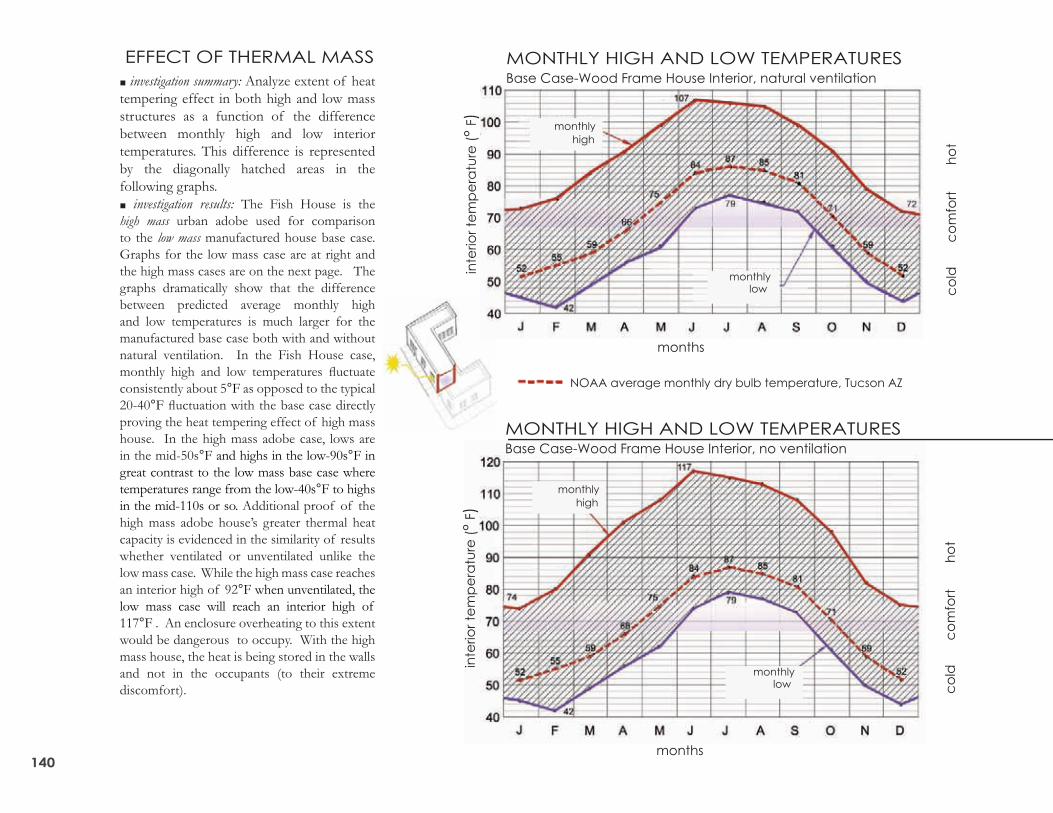
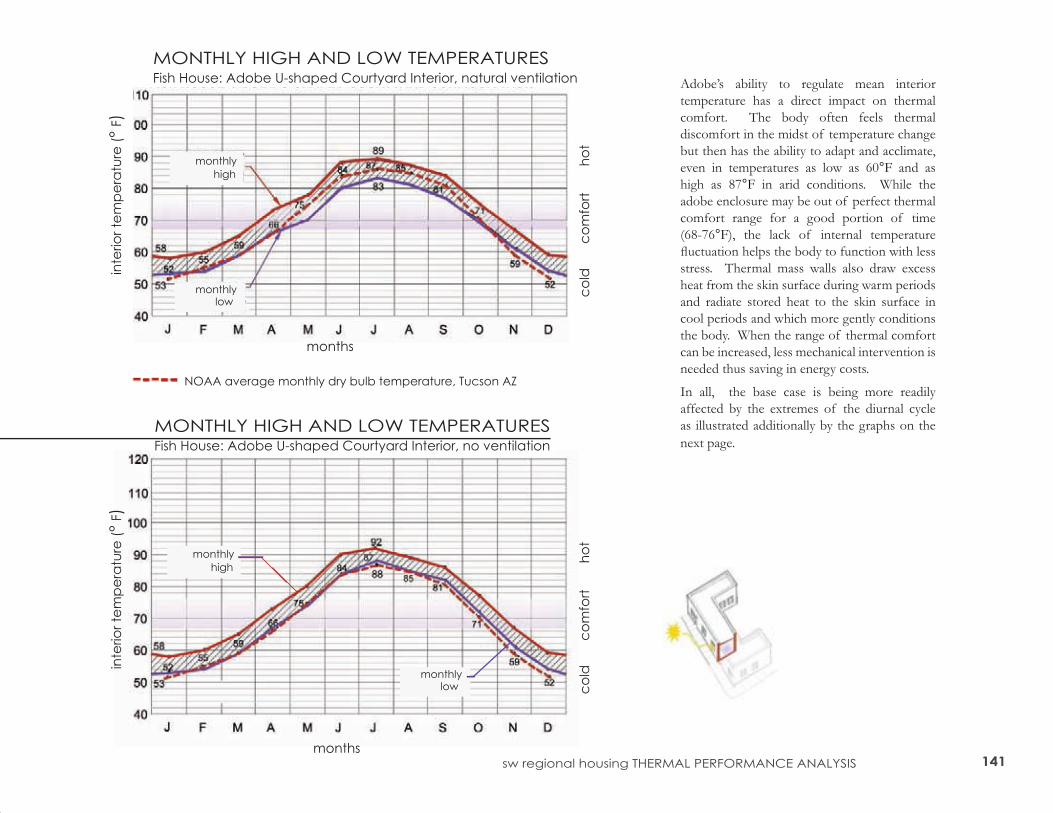
EFFECT OF THERMAL MASS
■ investigation summary: Analyze extent of heat
tempering effect in both high and low mass
structures as a function of the difference
between monthly high and low interior
temperatures. This difference is represented
by the diagonally hatched areas in the
following graphs.
■ investigation results: The Fish House is the
high mass urban adobe used for comparison
to the low mass manufactured house base case.
Graphs for the low mass case are at right and
the high mass cases are on the next page. The
graphs dramatically show that the difference
between predicted average monthly high
and low temperatures is much larger for the
manufactured base case both with and without
natural ventilation. In the Fish House case,
monthly high and low temperatures fl uctuate
consistently about 5°F as opposed to the typical
20-40°F fl uctuation with the base case directly
proving the heat tempering effect of high mass
house. In the high mass adobe case, lows are
in the mid-50s°F and highs in the low-90s°F in
great contrast to the low mass base case where
temperatures range from the low-40s°F to highs
in the mid-110s or so. Additional proof of the
high mass adobe house’s greater thermal heat
capacity is evidenced in the similarity of results
whether ventilated or unventilated unlike the
low mass case. While the high mass case reaches
an interior high of 92°F when unventilated, the
low mass case will reach an interior high of
117°F . An enclosure overheating to this extent
would be dangerous to occupy. With the high
mass house, the heat is being stored in the walls
and not in the occupants (to their extreme
discomfort).
MONTHLY HIGH AND LOW TEMPERATURESBase Case-Wood Frame House Interior, natural ventilation
inte
rio
r te
mp
era
ture
(°
F)
months
monthly
monthly
high
low co
ldc
om
fort
ho
t
MONTHLY HIGH AND LOW TEMPERATURESBase Case-Wood Frame House Interior, no ventilation
inte
rio
r te
mp
era
ture
(°
F)
months
co
ldc
om
fort
ho
t
NOAA average monthly dry bulb temperature, Tucson AZ
monthly
monthly
high
low
141 sw regional housing THERMAL PERFORMANCE ANALYSIS
co
ldc
om
fort
ho
t
MONTHLY HIGH AND LOW TEMPERATURESFish House: Adobe U-shaped Courtyard Interior, natural ventilation
inte
rio
r te
mp
era
ture
(°
F)
monthly
monthly
high
low
NOAA average monthly dry bulb temperature, Tucson AZ
months
co
ldc
om
fort
ho
t
MONTHLY HIGH AND LOW TEMPERATURESFish House: Adobe U-shaped Courtyard Interior, no ventilation
inte
rio
r te
mp
era
ture
(°
F)
monthly
monthly
high
low
months
Adobe’s ability to regulate mean interior
temperature has a direct impact on thermal
comfort. The body often feels thermal
discomfort in the midst of temperature change
but then has the ability to adapt and acclimate,
even in temperatures as low as 60°F and as
high as 87°F in arid conditions. While the
adobe enclosure may be out of perfect thermal
comfort range for a good portion of time
(68-76°F), the lack of internal temperature
fl uctuation helps the body to function with less
stress. Thermal mass walls also draw excess
heat from the skin surface during warm periods
and radiate stored heat to the skin surface in
cool periods and which more gently conditions
the body. When the range of thermal comfort
can be increased, less mechanical intervention is
needed thus saving in energy costs.
In all, the base case is being more readily
affected by the extremes of the diurnal cycle
as illustrated additionally by the graphs on the
next page.
142
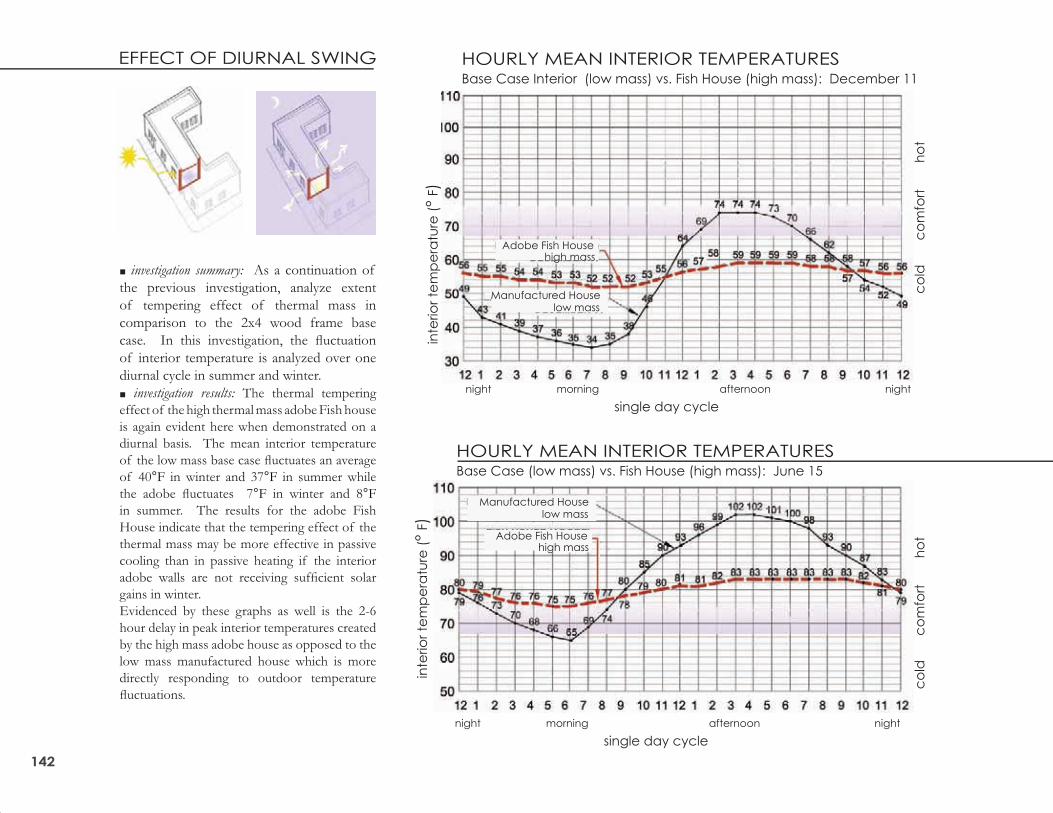
EFFECT OF DIURNAL SWING
■ investigation summary: As a continuation of
the previous investigation, analyze extent
of tempering effect of thermal mass in
comparison to the 2x4 wood frame base
case. In this investigation, the fl uctuation
of interior temperature is analyzed over one
diurnal cycle in summer and winter.
■ investigation results: The thermal tempering
effect of the high thermal mass adobe Fish house
is again evident here when demonstrated on a
diurnal basis. The mean interior temperature
of the low mass base case fl uctuates an average
of 40°F in winter and 37°F in summer while
the adobe fl uctuates 7°F in winter and 8°F
in summer. The results for the adobe Fish
House indicate that the tempering effect of the
thermal mass may be more effective in passive
cooling than in passive heating if the interior
adobe walls are not receiving suffi cient solar
gains in winter.
Evidenced by these graphs as well is the 2-6
hour delay in peak interior temperatures created
by the high mass adobe house as opposed to the
low mass manufactured house which is more
directly responding to outdoor temperature
fl uctuations.
co
ldc
om
fort
ho
t
HOURLY MEAN INTERIOR TEMPERATURESBase Case Interior (low mass) vs. Fish House (high mass): December 11
inte
rio
r te
mp
era
ture
(°
F)
Adobe Fish Househigh mass
low massManufactured House
single day cycle
night morning afternoon night
HOURLY MEAN INTERIOR TEMPERATURESBase Case (low mass) vs. Fish House (high mass): June 15
Adobe Fish Househigh mass
low massManufactured House
co
ldc
om
fort
ho
t
inte
rio
r te
mp
era
ture
(°
F)
single day cycle
night morning afternoon night
143 sw regional housing THERMAL PERFORMANCE ANALYSIS
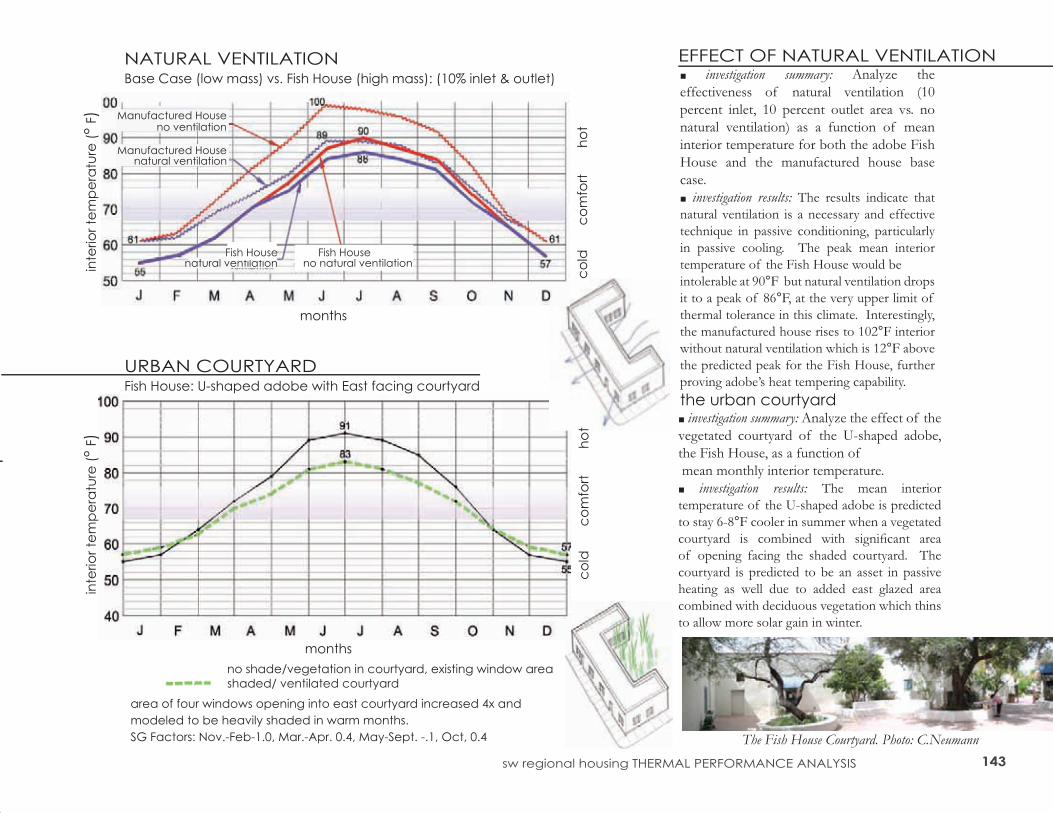
EFFECT OF NATURAL VENTILATION
the urban courtyard
■ investigation summary: Analyze the
effectiveness of natural ventilation (10
percent inlet, 10 percent outlet area vs. no
natural ventilation) as a function of mean
interior temperature for both the adobe Fish
House and the manufactured house base
case.
■ investigation results: The results indicate that
natural ventilation is a necessary and effective
technique in passive conditioning, particularly
in passive cooling. The peak mean interior
temperature of the Fish House would be
intolerable at 90°F but natural ventilation drops
it to a peak of 86°F, at the very upper limit of
thermal tolerance in this climate. Interestingly,
the manufactured house rises to 102°F interior
without natural ventilation which is 12°F above
the predicted peak for the Fish House, further
proving adobe’s heat tempering capability.
■ investigation summary: Analyze the effect of the
vegetated courtyard of the U-shaped adobe,
the Fish House, as a function of
mean monthly interior temperature.
■ investigation results: The mean interior
temperature of the U-shaped adobe is predicted
to stay 6-8°F cooler in summer when a vegetated
courtyard is combined with signifi cant area
of opening facing the shaded courtyard. The
courtyard is predicted to be an asset in passive
heating as well due to added east glazed area
combined with deciduous vegetation which thins
to allow more solar gain in winter.
The Fish House Courtyard. Photo: C.Neumann
NATURAL VENTILATIONBase Case (low mass) vs. Fish House (high mass): (10% inlet & outlet)
inte
rio
r te
mp
era
ture
(°
F)
co
ldc
om
fort
ho
t
months
Manufactured Houseno ventilation
Manufactured Housenatural ventilation
natural ventilationFish House Fish House
no natural ventilation
URBAN COURTYARDFish House: U-shaped adobe with East facing courtyard
inte
rio
r te
mp
era
ture
(°
F)
co
ldc
om
fort
ho
t
months
area of four windows opening into east courtyard increased 4x and
modeled to be heavily shaded in warm months.
SG Factors: Nov.-Feb-1.0, Mar.-Apr. 0.4, May-Sept. -.1, Oct, 0.4
no shade/vegetation in courtyard, existing window area
shaded/ ventilated courtyard
144
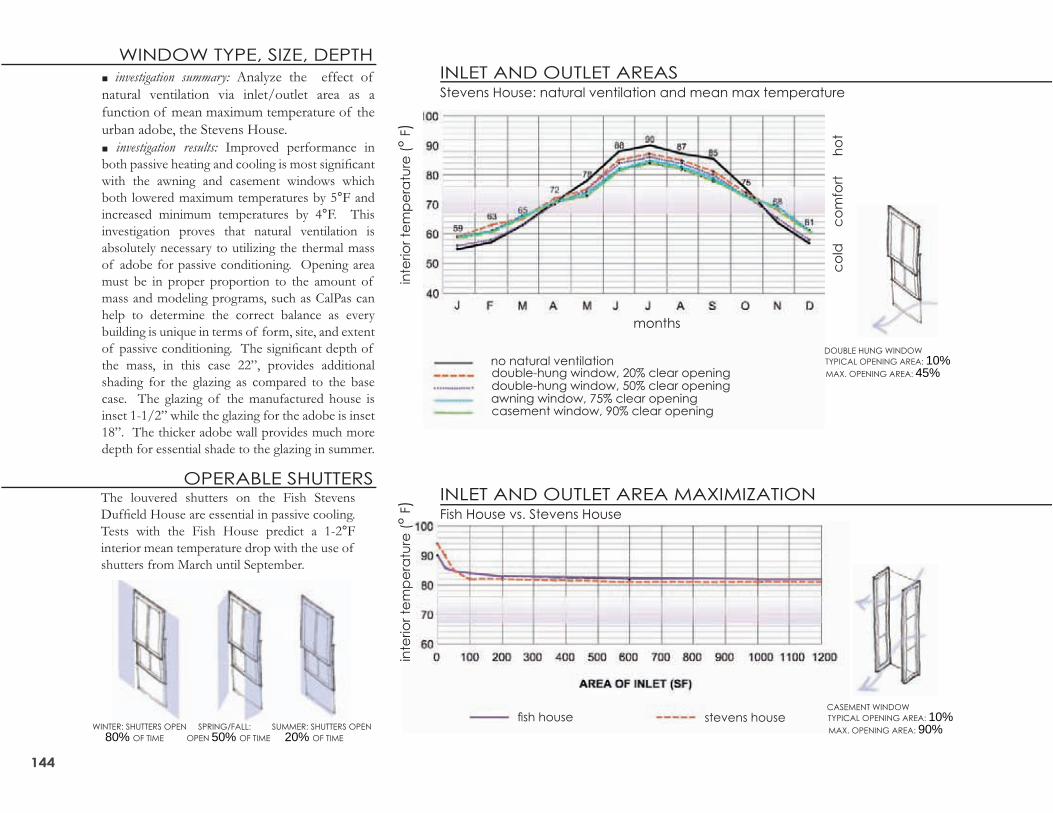
■ investigation summary: Analyze the effect of
natural ventilation via inlet/outlet area as a
function of mean maximum temperature of the
urban adobe, the Stevens House.
■ investigation results: Improved performance in
both passive heating and cooling is most signifi cant
with the awning and casement windows which
both lowered maximum temperatures by 5°F and
increased minimum temperatures by 4°F. This
investigation proves that natural ventilation is
absolutely necessary to utilizing the thermal mass
of adobe for passive conditioning. Opening area
must be in proper proportion to the amount of
mass and modeling programs, such as CalPas can
help to determine the correct balance as every
building is unique in terms of form, site, and extent
of passive conditioning. The signifi cant depth of
the mass, in this case 22”, provides additional
shading for the glazing as compared to the base
case. The glazing of the manufactured house is
inset 1-1/2” while the glazing for the adobe is inset
18”. The thicker adobe wall provides much more
depth for essential shade to the glazing in summer.
The louvered shutters on the Fish Stevens
Duffi eld House are essential in passive cooling.
Tests with the Fish House predict a 1-2°F
interior mean temperature drop with the use of
shutters from March until September.
MAX. OPENING AREA: 45%
DOUBLE HUNG WINDOW
TYPICAL OPENING AREA: 10%
WINTER: SHUTTERS OPEN
80% OF TIME
SPRING/FALL:
OPEN 50% OF TIME
SUMMER: SHUTTERS OPEN
20% OF TIMEMAX. OPENING AREA: 90%
CASEMENT WINDOW
TYPICAL OPENING AREA: 10%
INLET AND OUTLET AREASStevens House: natural ventilation and mean max temperature
inte
rio
r te
mp
era
ture
(°
F)
co
ldc
om
fort
ho
t
no natural ventilationdouble-hung window, 20% clear openingdouble-hung window, 50% clear openingawning window, 75% clear openingcasement window, 90% clear opening
months
fi sh house stevens house
inte
rio
r te
mp
era
ture
(°
F) INLET AND OUTLET AREA MAXIMIZATION
Fish House vs. Stevens House
WINDOW TYPE, SIZE, DEPTH
OPERABLE SHUTTERS
145sw regional housing THERMAL PERFORMANCE ANALYSIS
View of Upshaw complex showing cluster of buildings surrounded by local vegetation. Photo: B.Vint
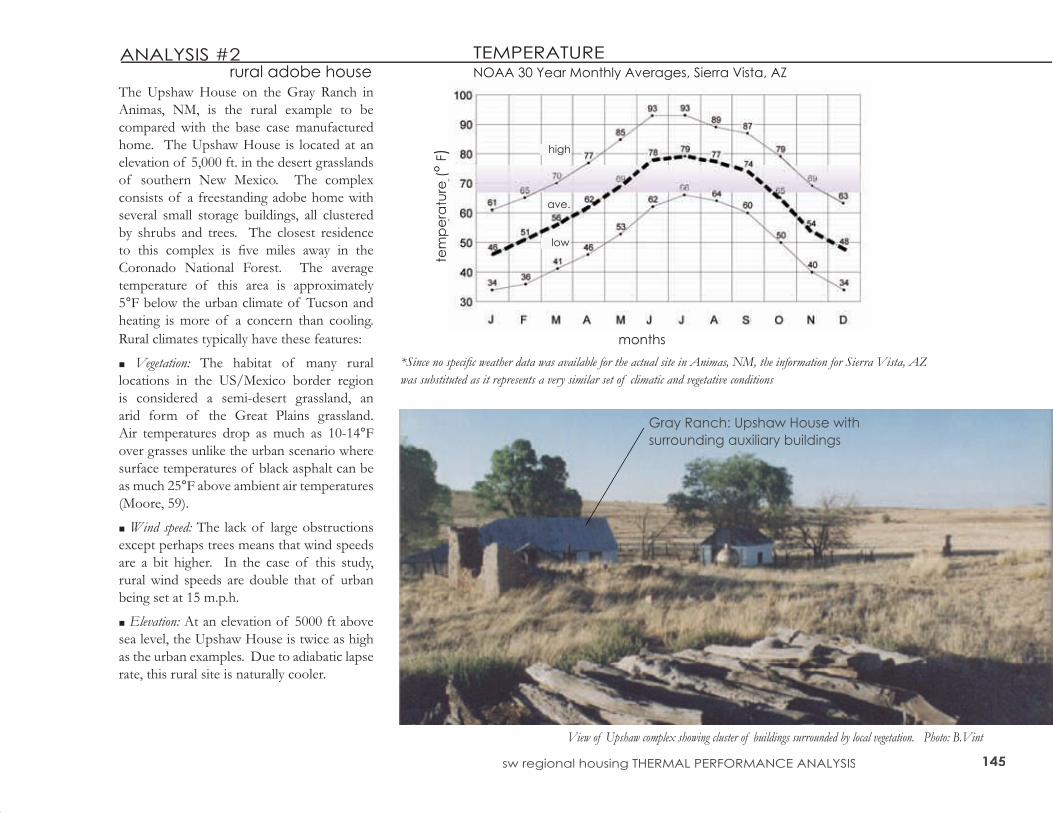
The Upshaw House on the Gray Ranch in
Animas, NM, is the rural example to be
compared with the base case manufactured
home. The Upshaw House is located at an
elevation of 5,000 ft. in the desert grasslands
of southern New Mexico. The complex
consists of a freestanding adobe home with
several small storage buildings, all clustered
by shrubs and trees. The closest residence
to this complex is fi ve miles away in the
Coronado National Forest. The average
temperature of this area is approximately
5°F below the urban climate of Tucson and
heating is more of a concern than cooling.
Rural climates typically have these features:
■ Vegetation: The habitat of many rural
locations in the US/Mexico border region
is considered a semi-desert grassland, an
arid form of the Great Plains grassland.
Air temperatures drop as much as 10-14°F
over grasses unlike the urban scenario where
surface temperatures of black asphalt can be
as much 25°F above ambient air temperatures
(Moore, 59).
■ Wind speed: The lack of large obstructions
except perhaps trees means that wind speeds
are a bit higher. In the case of this study,
rural wind speeds are double that of urban
being set at 15 m.p.h.
■ Elevation: At an elevation of 5000 ft above
sea level, the Upshaw House is twice as high
as the urban examples. Due to adiabatic lapse
rate, this rural site is naturally cooler.
ANALYSIS #2 rural adobe house
Gray Ranch: Upshaw House with
surrounding auxiliary buildings
*Since no specifi c weather data was available for the actual site in Animas, NM, the information for Sierra Vista, AZ
was substituted as it represents a very similar set of climatic and vegetative conditions
months
tem
pe
ratu
re (°
F) high
ave.
low
TEMPERATURENOAA 30 Year Monthly Averages, Sierra Vista, AZ
146
Upshaw House-Phase 1:
simple square plan adobe
*For scaled house plans and additional
supplemental information, such as area and volume,
see Appendix.
Upshaw House-Phase 2:
simple square plan adobe with porch
Upshaw House-Phase 3:
square plan w/ porch and block addition
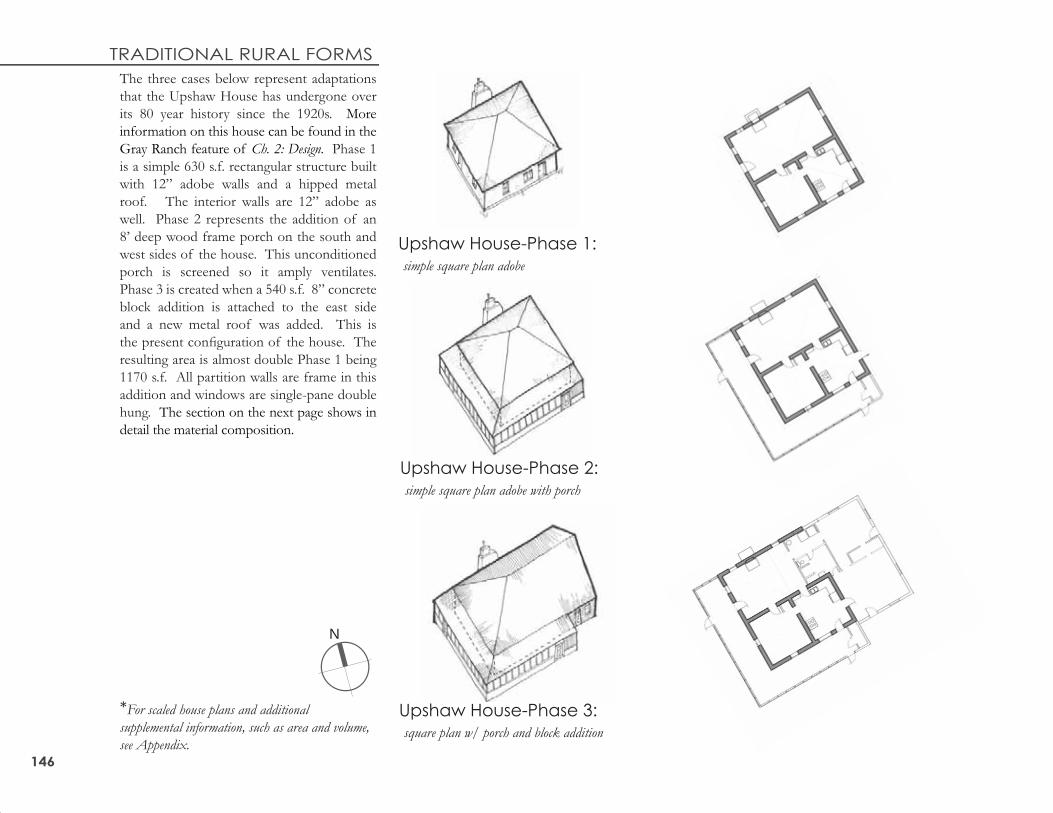
The three cases below represent adaptations
that the Upshaw House has undergone over
its 80 year history since the 1920s. More
information on this house can be found in the
Gray Ranch feature of Ch. 2: Design. Phase 1
is a simple 630 s.f. rectangular structure built
with 12” adobe walls and a hipped metal
roof. The interior walls are 12” adobe as
well. Phase 2 represents the addition of an
8’ deep wood frame porch on the south and
west sides of the house. This unconditioned
porch is screened so it amply ventilates.
Phase 3 is created when a 540 s.f. 8” concrete
block addition is attached to the east side
and a new metal roof was added. This is
the present confi guration of the house. The
resulting area is almost double Phase 1 being
1170 s.f. All partition walls are frame in this
addition and windows are single-pane double
hung. The section on the next page shows in
detail the material composition.
N
TRADITIONAL RURAL FORMS
147 sw regional housing THERMAL PERFORMANCE ANALYSIS
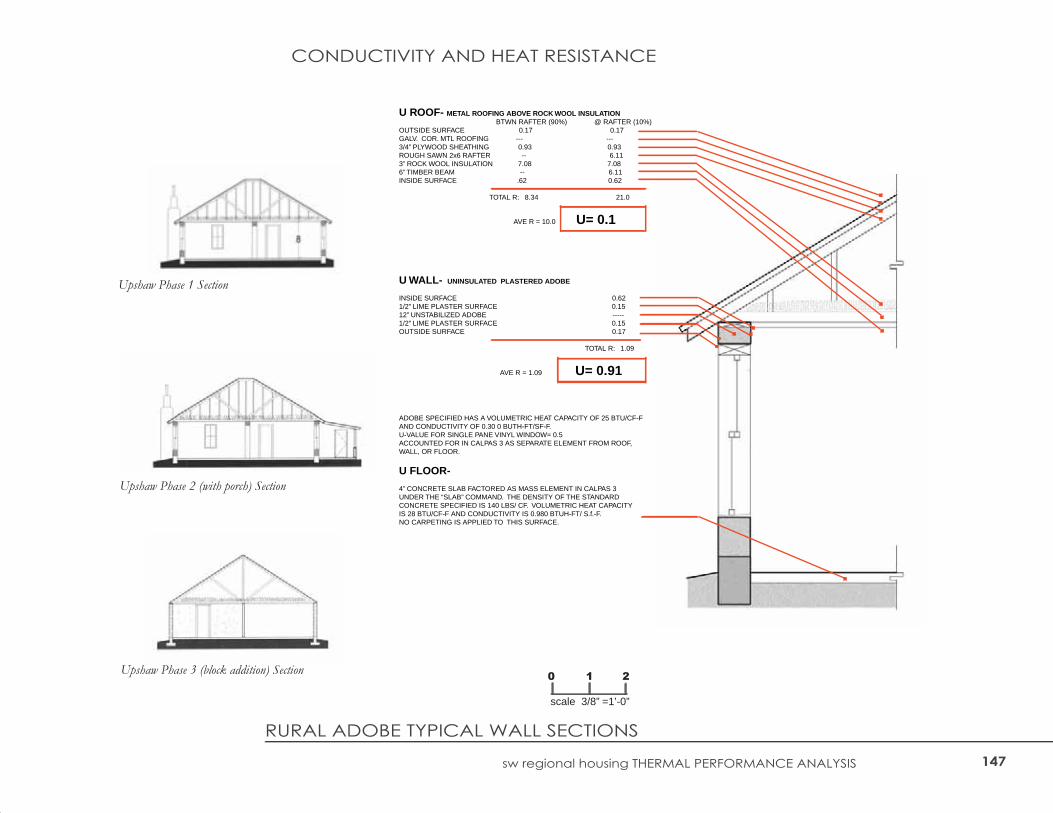
U WALL- UNINSULATED PLASTERED ADOBE INSIDE SURFACE 0.621/2” LIME PLASTER SURFACE 0.15 12” UNSTABILIZED ADOBE -----1/2” LIME PLASTER SURFACE 0.15OUTSIDE SURFACE 0.17
TOTAL R: 1.09
AVE R = 1.09 U= 0.91
U ROOF- METAL ROOFING ABOVE ROCK WOOL INSULATION BTWN RAFTER (90%) @ RAFTER (10%)OUTSIDE SURFACE 0.17 0.17GALV. COR. MTL ROOFING --- ---3/4” PLYWOOD SHEATHING 0.93 0.93ROUGH SAWN 2x6 RAFTER -- 6.113” ROCK WOOL INSULATION 7.08 7.086” TIMBER BEAM -- 6.11 INSIDE SURFACE .62 0.62 TOTAL R: 8.34 21.0
AVE R = 10.0 U= 0.1
U FLOOR- 4” CONCRETE SLAB FACTORED AS MASS ELEMENT IN CALPAS 3 UNDER THE “SLAB” COMMAND. THE DENSITY OF THE STANDARD CONCRETE SPECIFIED IS 140 LBS/ CF. VOLUMETRIC HEAT CAPACITY IS 28 BTU/CF-F AND CONDUCTIVITY IS 0.980 BTUH-FT/ S.f.-F. NO CARPETING IS APPLIED TO THIS SURFACE.
ADOBE SPECIFIED HAS A VOLUMETRIC HEAT CAPACITY OF 25 BTU/CF-F AND CONDUCTIVITY OF 0.30 0 BUTH-FT/SF-F.U-VALUE FOR SINGLE PANE VINYL WINDOW= 0.5ACCOUNTED FOR IN CALPAS 3 AS SEPARATE ELEMENT FROM ROOF, WALL, OR FLOOR.
Upshaw Phase 1 Section
Upshaw Phase 2 (with porch) Section
Upshaw Phase 3 (block addition) Section 0 1 2
scale 3/8” =1’-0”
CONDUCTIVITY AND HEAT RESISTANCE
RURAL ADOBE TYPICAL WALL SECTIONS
148
■ investigation summary: Analyze thermal
performance as a function of monthly mean
interior temperature for manufactured housing
base case and three rural adobe cases.
■ investigation results: In all cases, the need for
passive heating predominates. 60-75 percent
of the time, when the houses are predicted
to be out of the comfort zone the need is
for warmth. Phase 1 performs best in colder
conditions, but becomes hottest in summer.
The porch of phase 2 drops mean interior
temperatures in summer an average of 1-2°F,
but becomes a liability in colder months. The
porch is too deep to allow solar gain to passively
heat the house interior. In all, the historic cases
performed better than the manufactured house,
keeping temperatures 4-6°F lower in summer
and 1-3°F higher in winter. As with the urban
examples, the rural adobes are predicted to
reach their peak interior temperature a month
after the base case further demonstrating their
adobe and block wall’s ability to delay heat gain.
Both adobe and block have a higher thermal heat
capacity compared to wood.
WINTER LOW: 51°FSUMMER HI: 89°F
% YEAR - COMFORT ZONE : 33%% YEAR - EXTENDED COMFORT ZONE : 75%
WINTER LOW: 49°FSUMMER HI: 87°F
% YEAR - COMFORT ZONE : 33%% YEAR - EXTENDED COMFORT ZONE : 75%
WINTER LOW: 47°FSUMMER HI: 88°F
% YEAR - COMFORT ZONE : 23%% YEAR - EXTENDED COMFORT ZONE : 66%
WINTER LOW: 37°FSUMMER HI: 102°F
% YEAR - COMFORT ZONE : 22.5%% YEAR - EXTENDED COMFORT ZONE : 66%
phase 1 phase 2 phase 3
1659 s.f. s.v.r.= 17%
base case
manufactured house
630 s.f. s.v.r.= 38% 630 s.f. s.v.r.= 38% 1170 s.f. s.v.r.= 19%
* s.v.r. = Surface to Volume Ratio, see p. 129
MEAN MONTHLY TEMPERATURE COMPARISONUpshaw House, Phases 1-3 vs. Manufactured House
inte
rio
r te
mp
era
ture
(°
F)
months
peak
co
ldc
om
fort
ho
t
EFFECT OF BUILDING FORM
149 sw regional housing THERMAL PERFORMANCE ANALYSIS
EFFECT OF THERMAL MASS
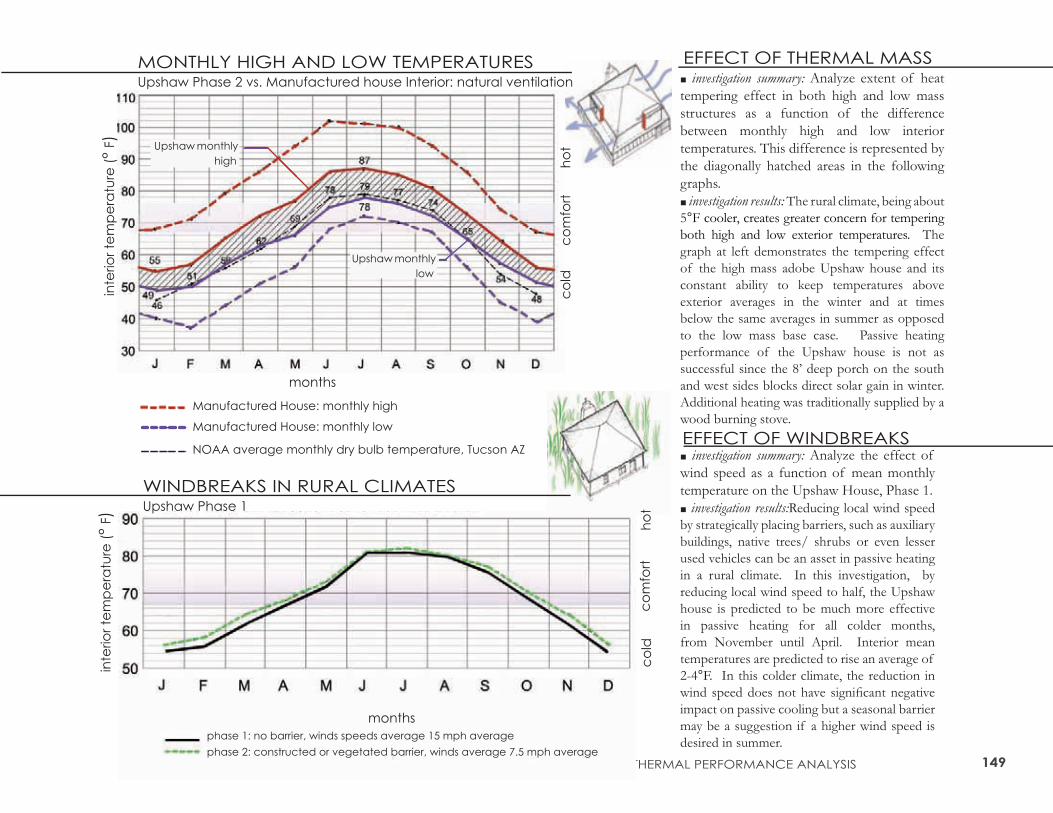
EFFECT OF WINDBREAKS■ investigation summary: Analyze the effect of
wind speed as a function of mean monthly
temperature on the Upshaw House, Phase 1.
■ investigation results:Reducing local wind speed
by strategically placing barriers, such as auxiliary
buildings, native trees/ shrubs or even lesser
used vehicles can be an asset in passive heating
in a rural climate. In this investigation, by
reducing local wind speed to half, the Upshaw
house is predicted to be much more effective
in passive heating for all colder months,
from November until April. Interior mean
temperatures are predicted to rise an average of
2-4°F. In this colder climate, the reduction in
wind speed does not have signifi cant negative
impact on passive cooling but a seasonal barrier
may be a suggestion if a higher wind speed is
desired in summer.
WINDBREAKS IN RURAL CLIMATESUpshaw Phase 1
inte
rio
r te
mp
era
ture
(°
F)
co
ldc
om
fort
ho
t
months
phase 1: no barrier, winds speeds average 15 mph average
phase 2: constructed or vegetated barrier, winds average 7.5 mph average
inte
rio
r te
mp
era
ture
(°
F)
Upshaw monthly
high
Manufactured House: monthly high
months
MONTHLY HIGH AND LOW TEMPERATURESUpshaw Phase 2 vs. Manufactured house Interior: natural ventilation
NOAA average monthly dry bulb temperature, Tucson AZ
Manufactured House: monthly low
Upshaw monthly
low
■ investigation summary: Analyze extent of heat
tempering effect in both high and low mass
structures as a function of the difference
between monthly high and low interior
temperatures. This difference is represented by
the diagonally hatched areas in the following
graphs.
■ investigation results: The rural climate, being about
5°F cooler, creates greater concern for tempering
both high and low exterior temperatures. The
graph at left demonstrates the tempering effect
of the high mass adobe Upshaw house and its
constant ability to keep temperatures above
exterior averages in the winter and at times
below the same averages in summer as opposed
to the low mass base case. Passive heating
performance of the Upshaw house is not as
successful since the 8’ deep porch on the south
and west sides blocks direct solar gain in winter.
Additional heating was traditionally supplied by a
wood burning stove.
co
ldc
om
fort
ho
t
150
EFFECT OF UNENCLOSED PORCH■ investigation summary: Analyze the effect of
the porch addition in Phase 2 upon thermal
performance as a function of monthly mean
interior temperature.
■ investigation results: The addition of the
porch is more effective in passive cooling
than in passive heating, as it is predicted to
drop each monthly mean temperature by 1-2
°F. Phase 2 will remain in the comfort zone
about 1-2 weeks longer as compared to Phase
1. Additional testing was done to investigate
porch orientation when the house is rotated
in 90 degree increments. The diagrams to
the lower right demonstrate this rotation.
Both position B and C were more effi cient in
passive heating without raising temperatures
during the summer. Both were predicted
to raise the mean monthly temperatures in
winter by 1 °F. Another test with position
A in which the porch depth was shortened
to 4 ft. yielded similar results in summer and
winter. In this case, passive heating was more
successful since the adobe walls were more
directly exposed to solar gains in winter.
The deep screened porch of the Upshaw house.
Photo: B. Vint
ROTATION 0°PORCH POSITION A (EXISTING):
ROTATION 90°PORCH POSITION B
ROTATION 180°PORCH POSITION C
ROTATION -90°PORCH POSITION D
SCREENED PORCHUpshaw Phase 1 vs. Phase 2
inte
rio
r te
mp
era
ture
(°
F)
co
ldc
om
fort
ho
t
months
Upshaw house, phase 1
Upshaw house, phase 2
151 sw regional housing THERMAL PERFORMANCE ANALYSIS
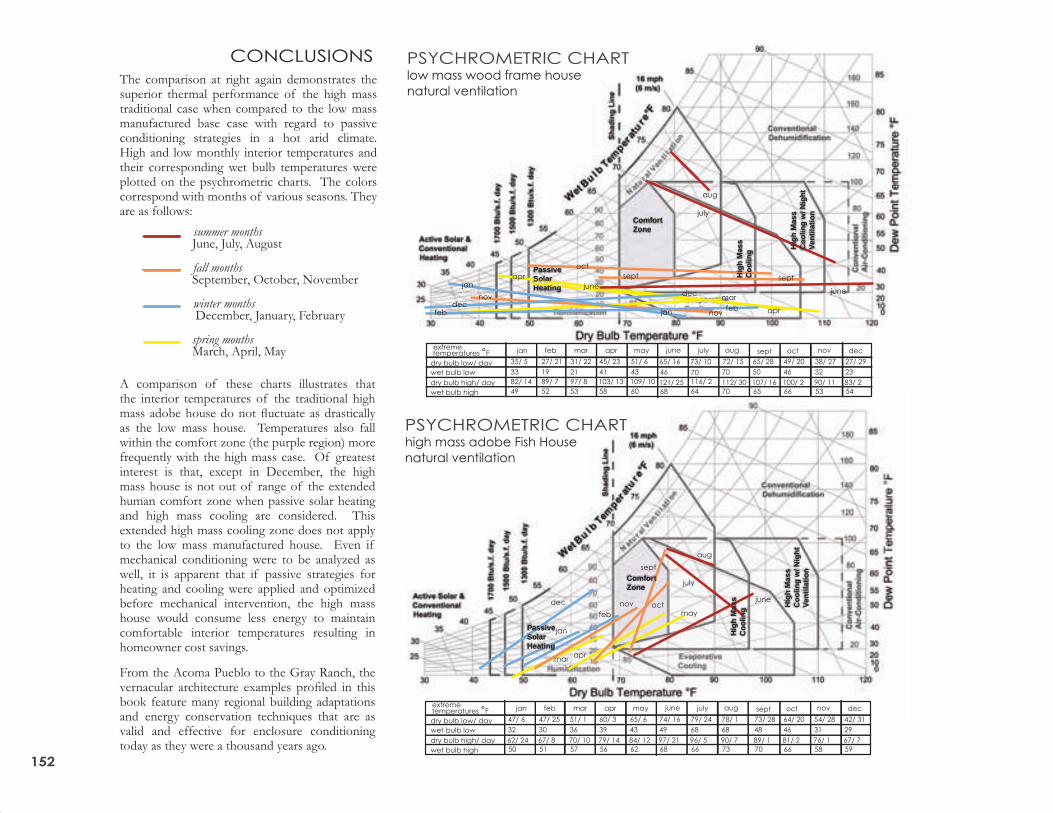
■ High mass heat tempering is a viable traditional passive cooling strategy in the arid Southwest.
- Peak mean interior temperatures for all high mass adobe cases are predicted to stay at least4-6 °F below the low mass base case. - High, low and mean interior temperatures of both rural and urban adobe cases stayed below the threshold of extended human thermal comfort unlike the base case which was well above this limit for June, July and August. The two psychrometric charts p.150 further demonstrate these results.- Peak interior temperatures of the adobe homes were predicted to be delayed one full month, from June with the base case to July .
■ Natural ventilation, particularly during cooler night hours, is a strategy that is vital for thermal mass cooling and southerly exposed operable glazing with appropriate shade allows passive solar heating in addition to ventilation cooling.
- For the urban adobes analyzed, the introduction of natural ventilation lowered temperatures by 5-8°F. This drop in summer is due to natural cross and stack ventilation and blackbody radiation to the clear night sky.- The introduction of the casement window, with the most clear opening (90%) of all window types, was most effective in improving ventilation. In the Stevens House, temperatures drop 7°F in summer and rise 4°F in winter. - Passive solar heating is as essential as cooling in the rural analysis due to higher wind speeds and cooler average exterior temperatures. The porch
Urban Analysis
Fish Stevens Duffi eld House, Tucson AZ
Thermal comfort period elongated 21 - 29 % over base case manufactured house
Rural Analysis
Upshaw House, Animas, New Mexico
Thermal comfort period elongated 0 - 9 % over base case manufactured house
ANALYSIS HIGHLIGHTS
of the Upshaw house blocks direct solar gain and prevents the high mass building’s ability to store precious solar heat which could be gained in cold periods.
■ Seasonally vegetated courtyard is potentially the most effective passive conditioning strategy for both heating and cooling.
- The shallow U-shaped form of the Fish House, with it’s seasonally vegetated courtyard, was the most successful in passive cooling of all cases tested, as its mean interior temperature peaked at 83°F, staying 2-8°F lower than the other adobes and the base case. - Summer shading via dense vegetation, signifi cant depth of mass wall ( 18” window inset in urban adobe homes) and louvered shutters, permits a greater area of opening/glazing for enhanced natural ventilation in summer and solar gain in winter. In the case of the Fish House, while a south facing courtyard would be more ideal as opposed to the existing the east orientation, nonetheless, by increasing the area of open/glazing, mean interior temperatures increased by a few degrees in winter. - Additional passive cooling effects due to evapotranspiration from plants or evaporation from a courtyard fountain were not accounted for in this study, but their common incorporation into traditional courtyards, such as that of the Cordova House, indicates that they also are integral in the creation of a thermally desirable courtyard microclimate. Using native seasonal trees and shrubs adapted to a hot arid climate aids in reduction of water consumption.
CONCLUSIONSIndigenous passive conditioning strategies, in particular thermal mass heat tempering, controlled natural ventilation and seasonally vegetated courtyards, are recommended as the basis for home conditioning in the hot arid Southwest. This study demonstrates the effectiveness of these strategies, as evidenced in the superior thermal performance of the two high mass vernacular cases when compared to a standard low mass contemporary manufactured house. The conventional wood stud and vinyl-sided manufactured house analyzed was designed specifi cally to be dependent on mechanical heating/cooling at all times and thus operates alien to its local climate.
Indigenous strategies for thermal control are effective in creating environments within a reasonable range of human thermal toleration which is particularly evident during times of extreme heat and cold. While these native structures don’t consistently keep within the perfect bounds of thermal comfort (68-76°F), a feat only achieved by energy-intensive mechanical conditioning, they temper outside temperatures such that life is not threatened. The extremely high interior temperatures (averages in 100s) predicted for the unconditioned base case during the hot months simulate the grim reality of unconditioned housing not adapted to a hot and arid climate. This predicament is not uncommon for low-income people living in substandard housing units who cannot afford high air conditioning bills or conditioning system maintenance.
Further study is required to engineer fl oor, wall, and roof systems which utilize these passive strategies in conjunction with modern living patterns, construction methods and conditioning. Hybrid wall systems combining high insulation materials (straw bale, rigid insulation, etc.) in conjunction with thermal mass materials such as adobe, Concrete Earth Blocks (CEB) or Concrete Masonry Units (CMU) have potential to be the most energy effi cient and regionally appropriate enclosures.
152
CONCLUSIONS
The comparison at right again demonstrates the superior thermal performance of the high mass traditional case when compared to the low mass manufactured base case with regard to passive conditioning strategies in a hot arid climate. High and low monthly interior temperatures and their corresponding wet bulb temperatures were plotted on the psychrometric charts. The colors correspond with months of various seasons. They are as follows:
PassiveSolarHeating
Hig
h M
ass
Co
olin
g
ComfortZone
Hig
h M
ass
Co
olin
g w
/ Nig
ht
Ven
tila
tio
n
PSYCHROMETRIC CHARThigh mass adobe Fish House
natural ventilation
jan
feb
dec nov oct
sept
apr
june
mar
aug
july
may
summer months June, July, August
fall months September, October, November
winter months December, January, February
spring months March, April, May
A comparison of these charts illustrates that the interior temperatures of the traditional high mass adobe house do not fl uctuate as drastically as the low mass house. Temperatures also fall within the comfort zone (the purple region) more frequently with the high mass case. Of greatest interest is that, except in December, the high mass house is not out of range of the extended human comfort zone when passive solar heating and high mass cooling are considered. This extended high mass cooling zone does not apply to the low mass manufactured house. Even if mechanical conditioning were to be analyzed as well, it is apparent that if passive strategies for heating and cooling were applied and optimized before mechanical intervention, the high mass house would consume less energy to maintain comfortable interior temperatures resulting in homeowner cost savings.
From the Acoma Pueblo to the Gray Ranch, the vernacular architecture examples profi led in this book feature many regional building adaptations and energy conservation techniques that are as valid and effective for enclosure conditioning today as they were a thousand years ago.
PassiveSolarHeating
Hig
h M
ass
Co
olin
g
ComfortZone
Hig
h M
ass
Co
olin
g w
/ Nig
ht
Ven
tila
tio
n
PSYCHROMETRIC CHARTlow mass wood frame house
natural ventilation
jan
febdec
febnov
decnov
oct
sept septapr
june
apr
marjune
aug
july
jan
jan feb apr junemar july aug sept oct nov dectemperatures °F
dry bulb low/ day
wet bulb low
dry bulb high/ day
wet bulb high
may
jan feb apr junemar july aug sept oct nov dectemperatures °F may
35/ 5
33
82/ 14
49
27/ 21
19
89/ 7
52
31/ 22
21
97/ 8
53
45/ 23
41
103/ 13
58
51/ 6
43
109/ 10
60
121/ 25
68
65/ 16
46
116/ 2
64
73/ 10
70
112/ 30
70
72/ 15
70
107/ 16
65
65/ 28
50
100/ 2
66
49/ 20
46
90/ 11
53
38/ 27
32
83/ 2
54
27/ 29
23
extreme
62/ 24
50
47/ 6
32
extreme
dry bulb low/ day
wet bulb low
dry bulb high/ day
wet bulb high
67/ 8
51
47/ 25
30
70/ 10
57
51/ 1
36
79/ 14
56
60/ 3
39
84/ 12
62
65/ 6
43
97/ 21
68
74/ 16
49
96/ 5
66
79/ 24
68
90/ 7
73
78/ 1
68
89/ 1
70
73/ 28
48
81/ 2
66
64/ 20
46
76/ 1
58
54/ 28
31
67/ 7
59
42/ 31
29
Top Related