


Languages
Pages
Legal

People, Jobs and Productivity: The 'Simple' Dynamics of Inclusive Growth
Subir Gokarn1
Introduction
Let me begin by thanking the Confederation of Indian Industry (CII) for inviting me to
speak at its Annual Regional Meeting and National Conference on “Achieving Double-
digit Growth”. The theme of the conference is, unquestionably, an issue of the utmost
urgency for Indian policymakers. Although, in my current role, I am more focused on
issues of macroeconomic stability and short-term growth and inflation prospects, today's
theme is one on which I wrote and commented on frequently in my past positions and
which I feel very passionate about. So, I am pleased that CII is giving me this
opportunity to take a small diversion from my current concerns and re-visit some old,
but equally important, ones.
In what follows, I propose to view the issue of rapid and sustainable growth from three
perspectives, based on a simple principle. The principle is that rapid, sustained and
inclusive growth will take place when large numbers of people move from low-
productivity jobs to high-productivity ones. Every single historical instance of this being
achieved, cutting across time periods, regions, socio-political contexts and any other
differentiator one might think of, validates this principle.
As for the three perspectives, I will first briefly tread over the by now well-known ground
of long-term demographic projections. This is necessary to highlight just how massive
1 Keynote Address by Dr. Subir Gokarn, Deputy Governor, Reserve Bank of India on March 26, 2010 at CII Western Region’s Annual Regional Meeting and National Conference on “Achieving Double Digit Growth”. The inputs of Abhiman Das, Sunil Kumar and Muneesh Kapur in preparation of this address are gratefully acknowledged.
1

the scale of the challenge is. I will then go over some numbers on employment and
productivity, with the purpose of demonstrating just how significant the impact of the
right kind of employment transitions on inclusive growth can be. Finally, I will offer some
suggestions on the elements of a strategy that will facilitate the required transitions.
The People Imperative
Let's look ahead over the next 20 years using the latest demographic projections made
by the United Nations (Chart 1). Between 2010 and 2020, India will add about 120
million people in the working age segment, or 28 per cent of the global increase, while it
will only add about 43 million people to the 60+ age group, or 16 per cent of the global
increase. In sharp contrast, China will add about 19 million people in the working age
segment 20-59, less than 5 per cent of the global increment. In the same period, it will
add about 60 million people to the 60+ age group, about 27 per cent of the global
increase.
Chart 1: Demographic Transitions
2

Between 2020 and 2030, the differences between the two countries will be even starker.
India will see its working age population increase by almost 100 million people, about
one-third the global increase. Its 60+ population will also increase, but by a relatively
modest 53 million people or 16 per cent of the global increase. On the other hand,
China’s population in the working age segment will actually decline by a significant 62
million people. Its population in the 60+ segment will increase by about 104 million
people, or 33 per cent of the global increment.
I draw two implications from these numbers. First, independently of what will happen to
China, the scale of the challenge for India is going to be unlike anything we've seen
before. A growing backlog of young adults who can only find subsistence employment
even while their aspirations and expectations rise, is hardly the formula for the kind of
social and political stability that is an important pre-requisite for rapid and sustained
growth. Thus, there is a potential vicious circle brewing here. The less effective the
growth process is in creating jobs, both in terms of numbers and quality, the greater the
political threat and, consequently, the less sustainable the growth process itself.
Second, the contrast between Chinese and Indian demographic trends reflects an
enormous opportunity for us to put our inclusive growth trajectory on track. These trends
will drive Chinese wages steadily up, weakening the global competitiveness of their
powerhouse manufacturing sector. Increasing levels of automation and robotization in
Chinese factories is one potential solution but, from our perspective, the relative
abundance of labour on our shores, appropriately skilled, trained and deployed, will
provide global producers with a legitimate alternative to locate their production facilities
in. India may have become the IT and ITES hub of the world over the past two decades;
it now has the opportunity to become the factory to the world as well.
Jobs and Productivity
Let us now take a quick look at our record on achieving the desired jobs-productivity
nexus. I will do this at two levels: first, at the aggregate level across the agriculture-
industry-services spectrum; second in the context of the possibility of India becoming
3

"factory to the world", at the level of the organized manufacturing sector, which will be
key to realizing that aspiration.
The story at the aggregate level is told by charts 2, 3 and 4. Chart 2 depicts a relatively
slow transition in the labour force, using the household employment data from 55th
(1999-00) and 61st (2004-05) rounds of the National Sample Survey as points of
comparison. Over the five-year period, the labour force increased from 397 million to
456 million. 18 million of the increment was absorbed by agriculture, 13 million by
industry and 28 million by services (including construction). The fact that two-thirds of
the incremental number of workers were absorbed by sectors other than agriculture is a
welcome sign from the productivity perspective, as I will demonstrate a little later on.
However, the more worrying aspect of the slow transition is that the share of the total
workforce employed in agriculture only declined from 60 per cent in 1999-00 to 57 per
cent five years later. The share of industry increased from 12 per cent to 13 per cent
and the share of services went up from 28 per cent to 30 per cent.
Chart 2: Slow Employment Transition (Percentage of Indian Workforce)
Source: 55th (1999-2000) and 61st (2004-05) rounds of National Sample Surveys, NSSO.
4

As is well known, this pattern is almost the mirror image of the distribution of GDP
across the three sectors. Chart 3 displays the transition in these shares over the same
period. Agriculture, already the smallest sector, lost some of its share, while services
gained share in GDP somewhat more than they gained share in the labour force. In the
overall context of my theme, the relative stagnation in the share of industry in both GDP
and the labour force is of particular concern.
Chart 3: Mirror Image in Economic Activity (Percentage of Sectoral GDP)
Source: Central Statistical Organisation.
Let me now translate these two sets of numbers into broad productivity indices. Chart 4
displays the ratio of average GDP per worker, a rough indicator of labour productivity, in
industry and services to that in agriculture. The ratio for industry rose marginally from
4.1 in 1999-00 to 4.2 in 2004-05. The ratio for services rose somewhat more, from 4.8 in
1999-00 to 5.5 in 2004-05. However, regardless of the magnitude of increase and the
differential across the two sectors, the stark fact is that average labour productivity
outside agriculture is about 5 times that in agriculture.
5

Chart 4: Labour Productivity Differentials
Sources: Based on data from 55th (1999-2000) and 61st (2004-05) rounds of National Sample Surveys, NSSO.
This has very significant implications for inclusive growth. Simple arithmetic says that
every worker who moves from agriculture to other sectors will increase his/her net
contribution to GDP by four units. Since earnings are typically correlated with individual
productivity, this will necessarily translate into higher incomes for all the workers who
make the transition. In short, the larger is the number of workers who move, the larger
will be the increase in GDP as well as in the average earnings of the labour force. We
have both faster and more inclusive growth.
Obviously, this is an over-simplified model, but that should not detract from its value and
usefulness in explaining the economic transformations of all the economies that have
preceded us down this path. Introducing various levels of complexity will only provide
more realistic estimates of the potential gains from the transition of workers; they will not
undermine the basic logic of the argument.
6

Let me now spend a little time taking a more focused look at the organized
manufacturing sector, which, as I suggested earlier, will play a critical role in the
economic transformation of India. The productivity comparisons at the aggregate level,
while serving to make the point, significantly underestimate the true growth and
inclusion potential of the transition out of agriculture and into industry and services. This
is because the productivity numbers reflect the average GDP per worker across the
organized and unorganized sectors.
For a variety of well-known reasons, productivity in the former, in both industry and
services, is an order of magnitude higher than in the latter. One obvious manifestation
of this is the wage differential. Based on this, as well as other differentiating
characteristics between the two sub-sectors, it would be reasonable to argue that
organized sector employment is more desirable than that in the unorganized sector.
But, the question is: where are the jobs?
Chart 5 tells a story of essentially exclusive growth in the organized manufacturing
sector. The slide combines data from the Index of Industrial Production and the Annual
Survey of Industries, which covers organized (or “registered”) manufacturing
establishments, on the aggregate number of factories and workers in the sector. Each
variable is normalized to a value of 100 in 1993-94, so the time series in the slide reflect
the relative changes in the three variables. It is strikingly clear from the pattern that,
while real output from the organized manufacturing sector has increased substantially,
by almost three times between 1993-94 and 2007-08, the number of factories and
workers employed in the sector have barely grown at all. In fact, employment levels
actually declined towards the middle of the period, before recovering somewhat in the
later years. It appears that the Indian organized manufacturing sector has managed to
triple its output from the same number of establishments, the average size of which has
presumably increased and, most significantly, from virtually the same number of
workers.
7

This, of course, means that the average productivity of those workers who had or were
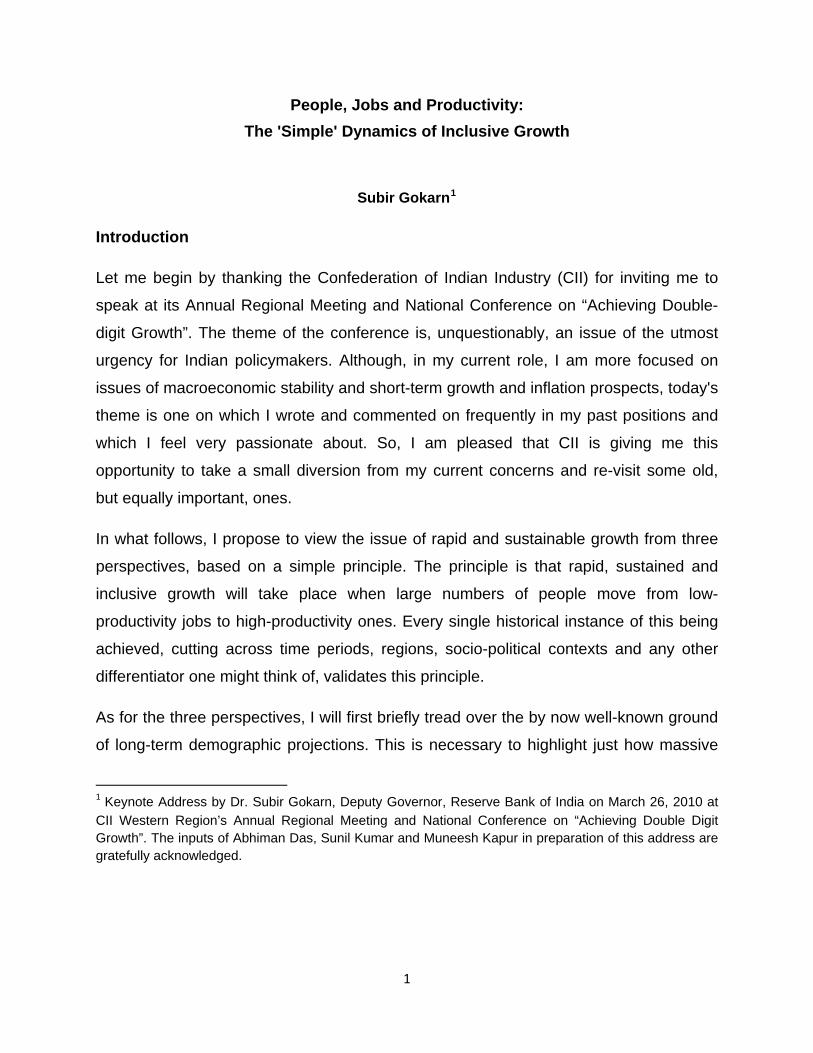
able to get jobs in organized manufacturing went up dramatically. Chart 6 displays this
trend through the series “Value added/worker”. Significantly, total earnings per worker
(emoluments/worker) behaved more or less commensurately with productivity. What is
particularly important about the pattern on this slide, however, is the differential between
“wages” – which reflect the fixed component of earnings – and “emoluments, which
combines the fixed and variable components. The increasing proportion of the variable
component in total earnings per worker indicates that the sector as a whole is beginning
to build a welcome degree of flexibility into its employment contracts. I will return to this
issue in the concluding section.
8
Finally, the rather worrying long-term impression of exclusion becomes somewhat less
so if we look at more recent trends in the absolute numbers of both factories and
workers. From Chart 7, it is apparent that organized manufacturing activity has
experienced a revival in the number of factories during the recent growth boom. Even
more reassuring is the picture in Chart 8, which suggests that this has been matched by
a revival in employment levels. I believe that the increasing flexibility in wage contracts
that was seen in Chart 6 has something to do with this revival. Wage flexibility allows
both the downside and upside of the business cycle to be shared between the
employee and the employer. To that extent, it makes hiring people more attractive,
which is, after all, the ultimate goal.
9

The Components of a Strategy
I have spoken about a simple principle and some simple arithmetic. I will now turn to the
more complicated part of the problem, viz., how to translate the principle and the
arithmetic into outcomes. Not that this is rocket science; as I said earlier, every country
10

that has preceded us has achieved it. Here again, I risk treading over some well-known
ground, but given both the magnitude of the challenge and the potential to become the
factory to the world, I believe that this is a set of arguments that bears repeating.
Three elements need to come together to achieve the transition in employment that is
central to the achievement of rapid and inclusive growth. The first is the degree of
flexibility in the employment contract. The evidence presented in the previous section
suggests that setting up new manufacturing establishments and hiring more people was
correlated with increasing flexibility in wage contracts. However, I do not think that wage
flexibility by itself goes far enough. This needs to be extended to employment flexibility
as well. The protection that individual workers receive from job security regulations, in
my view, places a disproportionate share of the downside risk of a business cycle on
the employer. In effect, the employer becomes the sole provider of a social safety net to
the employee, which significantly raises the effective wage. It is no wonder then, that
the organized manufacturing sector has experienced exclusive growth. The easing of
job security regulations is, I believe, a critical requirement to both stimulating more rapid
growth in this sector and making it more employment-intensive.
We don’t need to look outside our country to find evidence of the strong connection
between the flexibility of the employment contract and growth in employment. Our own
services sector, which has provided the by far the larger employment opportunity, has
the full benefit of employment flexibility. But, let me cite two instances from other
countries that provide a politically palatable way to deal with the transition.
The first is from China, which, in the early 1990s, did away with job security regulations
for new workers and new establishments. This enabled the growth of manufacturing in
the areas outside the Special Economic Zones, where a fully flexible labour market was
in force anyway. Instead of people going to where the jobs were, jobs now began
coming to where the people were. The second is from France, which, after some
resistance, recently implemented its First Jobs Contract law. This allows employers to
hire first-time workers below the age of 26 under different, more flexible, conditions than
its existing workforce is employed under. This was motivated by the need to address
11

widespread unemployment in this age segment, which in turn was attributed to the
rather rigid labour regulations that deterred employers from hiring new workers.
Apart from highlighting the role that flexibility in the employment contract plays in
generating jobs, these instances also point to the importance of “grandfathering” of
existing contracts in making regulatory reform politically acceptable. I believe that this is
a lesson we must take seriously in forming our own strategy.
The second is the matching of supply and demand for skills. Hundreds of millions of
potential workers will add up to nothing if they are not adequately equipped to deal with
the technological and organizational environment in modern manufacturing. Obviously,
basic education, which provides literacy, numeracy, IT skills and, very importantly,
teamwork capabilities, will play an important role. But, more specialized operating skills
are far more difficult for the system to provide. From what I hear, the average shop-floor
has moved far ahead of the capabilities of our vocational training system. I believe that
industry has a significant role to play in this transition. The adoption of Industrial
Training Institutes by industry associations is an absolutely welcome step, but
considering the numbers involved, both the scale and the nature of the role will have to
be thought through.
The third is the provision of a safety net. While I think it is inefficient for the employer to
bear the sole burden of providing a safety net, which is essentially what job security
regulations do, I also think that a safety net is an absolutely critical requirement in an
environment of employment flexibility. Experience from other countries indicates that
reasonable safety nets can be built with contributions from employees, employers and
the government. The development of a credible safety net, along with the
grandfathering approach referred to above will, in my view, facilitate the transition
towards a flexible employment regime in manufacturing.
12

Conclusion
We undoubtedly have a huge challenge in creating reasonable employment for
hundreds of millions of people over the coming decades. I believe that we have a huge
opportunity as well to become the factory to the world. Exploiting this opportunity by
• creating a flexible employment environment in the manufacturing sector
• creating the capacity to provide relevant basic and operational skills to people
• and, creating a reliable safety net with the participation of employees, employers
and the government
is critical to both accelerating growth and making it more inclusive.
Let me end by once again thanking CII for inviting to speak at this event and thank you
all for listening to me.
13
Top Related