


Languages
Pages
Legal


Portugaliae Electrochimica Acta 2013, 31(2), 95-106
DOI: 10.4152/pea.201302095
PORTUGALIAE
ELECTROCHIMICA
ACTA ISSN 1647-1571
The Effect of Eclipta Alba Leaves Extract on the Corrosion
Inhibition Process of Carbon Steel in Sea Water
V. Johnsirani,a,*
J. Sathiyabama,a S. Rajendran,
a,b
S.M. Lydia Christyc and J. Jeyasundari
d
a PG and Research Department of Chemistry, GTN Arts college, Dindigul - 624005, Tamil Nadu, India
b Department of Chemistry, RVS School of Engineenring and Technology, Dindigul-624005, India
c Department of Chemistry, VSB Engineering College, Karur – 639111, Tamil Nadu, India
d Department of Chemistry, SVN College, Madurai, Tamil Nadu, India
Received 23 November 2012; accepted 17 April 2013
Abstract
The inhibition efficiency [IE] of an aqueous extract of eclipta alba leaves in controlling
corrosion of carbon steel in sea water [Thondi, Tamil Nadu, India] has been evaluated
by weight loss method. The weight loss study reveals that the formulation consisting of
6 mL of EAE (Eclipta Alba extract ) and 25 ppm of Zn2+
has 92% inhibition efficiency
in controlling corrosion of carbon steel in sea water. Polarization study reveals that EAE
and Zn2+
system functions as a mixed type inhibitor. AC impedance spectra reveal that
a protective film is formed on the metal surface. The nature of the metal surface has
been analysed by FTIR spectra and AFM analysis.
Keywords: corrosion inhibition, Eclipta Alba, carbon steel, sea water, AFM,FTIR, green
inhibitor.
Introduction
The major chemical constituents of seawater are consistent worldwide. However,
seawater is still a complex chemical system affected by various other factors.
These include the concentration and access of dissolved oxygen, salinity,
concentration of minor ions, biological activity and pollutants [1-2]. Several
inhibitors have been used to control corrosion of metals in sea water.
Most of the inhibitors are synthetic chemicals which may be very expensive and
hazardous to living creatures and environment. Natural products are one of the
renewable sources, which can be used as inhibitors. Natural products in addition
to their environmental friendly and ecologically acceptable nature are
* Corresponding author. E-mail address: [email protected]

V. Johnsirani et al. / Port. Electrochim. Acta 31 (2013) 95-106
96
inexpensive, readily available and renewable sources of materials [3]. Among
these so – called “green corrosion inhibitors” are organic compounds that act by
adsorption on the metallic surfaces [4]. Some of these materials are honey [5],
caffeic acid [6], caffeine [7], pennyroyal oil [8], alizarin [9], occimumviridis
extract [10], rhizome extract [11], Zenthoxylum alatum extract [12], Lowsonia
[13-14], Berberine [15], garlic extract [16] and extracts of several natural
substances [17 -18].
In the present research work the extract of Eclipta alba leaves is taken as it is a
good corrosion inhibitor for carbon steel in marine media collected from Bay of
Bengal at Thondi, a small town located in Ramnad District, Tamil Nadu, India.
Eclipta alba, a medicinal herb, is grown in many parts of India. The parts of the
whole plant are used to cure many diseases. In ayirvedic medicine, the leaf
extract is considered a powerful liver tonic, rejuvenative, and especially good
eclipta prostrate is used for dyeing hair and tattooing [19-20].
Figure 1. Leaves of Eclipta Alba.
The present work is undertaken:
1. To evaluate the inhibition efficiency (IE) of Eclipta alba extract (EAE)-Zn2+
system in controlling corrosion of carbon steel immersed in sea water in the
absence and presence of Zn2+
by weight loss method.
2. To study the mechanism of corrosion inhibition by polarization study and AC
impedance spectra.
3. To analyse the protective film by FTIR spectra and Atomic Force Microscope
(AFM).
4. To propose the mechanism of corrosion inhibition based on the above results.
Materials and methods
Preparation of the plant extract The leaves of Eclipta Alba were dried and ground to powder and 10 g of the
powdered leaves were weighed and boiled with double distilled water. The
extract was filtered to remove suspending impurities, and made up to 100 mL.
The extract was used as corrosion inhibitor in the present study.
Preparation of the specimen Carbon steel specimens (0.02 6% S, 0.06% P, 0.4% Mn, 0.1% C and rest iron) of
the dimensions 1.0 x 4.0 x 0.2 cm were polished to a mirror finish, degreased

V. Johnsirani et al. / Port. Electrochim. Acta 31 (2013) 95-106
97
with trichloroethylene, and used for the weight-loss method and surface
examination studies.
Weight-loss method Carbon steel specimens were immersed in 100 mL of the medium containing
various concentrations of the inhibitor in the absence and presence of Zn2+
for 1
day. The weights of the specimens before and after immersion were determined
using a balance Shimadzu AY62 model. The corrosion IE was then calculated
using the equation
IE = 100 [1-(W2/W1)] % (1)
where W1 is the weight loss value in the absence of inhibitor and W2 is the
weight loss value in the presence of inhibitor.
The corrosion rate was calculated using the formula [21]
Corrosion rate (mm/year) = 87.6 W/ DAT
where W = weight loss in milligrams, D = density of the specimen g/cm3, A =
area of specimen in square cm, T = exposure time in hours.
Potentiodynamic polarization study Polarization studies were carried out in a CHI- electrochemical work station with
impedance model 660A. It was provided with iR compensation facility. A three
electrode cell assembly was used. The working electrode was carbon steel. A
saturated calomel electrode (SCE) was the reference electrode. Platinum was the
counter electrode. From polarization study, corrosion parameters such as
corrosion potential (Ecorr), corrosion current (Icorr), Tafel slopes anodic = ba and
cathodic = bc were calculated, and linear polarization study (LPR) was done. The
scan rate (V/S) was 0.01. Hold time at (Efcs) was zero and quiet time (s) was two.
AC impedance spectra
The instrument used for polarization study was used to record AC impedance
spectra also. The cell set up was also the same. The real part (Z’) and imaginary
part (Z’’) of the cell impedance were measured in ohms at various frequencies.
Values of charge transfer resistance (Rt) and the double layer capacitance (Cdl)
were calculated.
Surface examination study The carbon steel specimens were immersed in various test solutions for a period
of one day. After one day, the specimens were taken out and dried. The nature of
the film formed on the surface of the metal specimen was analyzed for surface
analysis technique by FTIR spectra and Atomic Force Microscopy.
Fourier transform infrared spectra These spectra were recorded in a Perkin-Elmer-1600 spectrophotometer using
KBr pellet. The FTIR spectrum of the protective film was recorded by carefully
removing the film, mixing it with KBr and making the pellet.

V. Johnsirani et al. / Port. Electrochim. Acta 31 (2013) 95-106
98
Atomic Force Microscopy characterization (AFM) The carbon steel specimens immersed in blank and in the inhibitor solution for a
period of one day were removed, rinsed with double distilled water, dried and
subjected to the surface examination. Atomic force microscopy (Veeco dinnova
model) was used to observe the samples’ surface in tapping mode, using
cantilever with linear tips. The scanning area in the images was 5 µm × 5 µm and
the scan rate was 0.6 HZ/second.
Results and discussion The physicochemical parameters of sea water used in the present study are given
in Table 1.
Table 1. Water analysis (Thondi sea water, Tamil Nadu, India).
Parameters Result
Total dissolved salts (mg/L) 30539 ppm
Electrical conductivity (micro mhos/cm) 44910
pH 7.06
Total hardness (CaCO3 equivalent) 100 ppm
Calcium as Ca (mg/L) 19 ppm
Magnesium as Mg (mg/L) 12 ppm
Sodium as Na (mg/L) 0
Chloride as Cl (mg/L) 11400 ppm
Fluoride as F (mg/L) 0
Free ammonia as NH3 (mg/L) 0
Sulphate as SO4 (mg/L) 6708 ppm
Table 2. The corrosion inhibition efficiencies and the corresponding corrosion rates
(millimeter per year) of EAE – Zn2+
system.
Inhibitor
EAE (mL)
0
Zn2+
(ppm)
0 25 50
IE%
CR(mm/y)
IE%
CR(mm/y)
IE%
CR(mm/y)
-
0.1576
16
0.1323
47
0.0835
2 50 0.0788 65 0.0555
70
0.0472
4 55 0.0354 71 0.0457
76
0.0378
6 60 0.0630 92 0.0126
80
0.0315
8 63 0.0583 88 0.0189
82
0.0283
10 65 0.0555 80 0.0315 85 0.0236

V. Johnsirani et al. / Port. Electrochim. Acta 31 (2013) 95-106
99
The calculated inhibition efficiencies (IE) of Eclipta alba Extract in controlling
the corrosion of carbon steel immersed in sea water both in the absence and
presence of zinc ion have been tabulated in Table 2. The calculated values
indicate the ability of Eclipta alba extract to be a good corrosion inhibitor. The
inhibition efficiency is found to be enhanced in the presence of zinc ion. The
formulation consisting of 6 mL of EAE and 25 ppm of Zn2+
offers 92% inhibition
efficiency. That is, the mixture of the inhibitors shows better IE than the
individual inhibitors [22].
Synergism parameter (SI) Synergism parameters are indications of the synergistic effect existing between
inhibitors [23-26]. SI value is found to be greater than one, indicating the
synergistic effect existing between Zn2+
of concentrations 25 ppm and 50 ppm
with various concentrations of EAE. The results are given in Table 3.
Synergism parameters were calculated using the relation
SI =1-θ1+2/ 1-θ’1+2 (2)
where θ1+2= (θ1+θ2) - (θ1 x θ2); θ1= surface coverage of inhibitor (EAE); θ2=
surface coverage of inhibitor (Zn2+
); θ’1+2= combined surface coverage of
inhibitors (EAE) and (Zn2+
) surface coverage = IE%/100.
Table 3. Synergism parameter (SI). EAE
(mL) θθθθ1
Zn2+
25 (ppm)
θθθθ2
EAE-Zn2+
θθθθ’1+2
SI
Zn2+
50 (ppm)
θθθθ2
EAE-Zn2+
θθθθ’1+2
SI
2
4
6
8
10
0.50
0.55
0.60
0.63
0.65
0.16
0.16
0.16
0.16
0.16
0.65
0.71
0.92
0.88
0.80
1.2
1.3034
4.2
2.49
1.47
0.47
0.47
0.47
0.47
0.47
0.70
0.76
0.80
0.82
0.85
0.883
0.9937
1.21
1.0894
1.2366
Potentiodynamic polarization study
Polarization study has been used to detect the formation of a protective film on
the metal surface [27-32]. When a protective film is formed on the metal surface,
the linear polarization resistance (LPR) increases and the corrosion current (Icorr)
decreases. The potentiodynamic polarization curves of carbon steel immersed in
various test solutions are shown in Fig. 2. The corrosion parameters namely,
corrosion potential (Ecorr), Tafel slopes (bc=cathodic; ba=anodic), linear
polarization resistance (LPR) and corrosion current (Icorr) are given in Table 4.
When carbon steel is immersed in sea water, the corrosion potential is -816 mV
vs. SCE. The formulation consisting of 6 mL of EAE solution and 25 ppm of
Zn2+
shifts the corrosion potential to -820 mV vs. SCE. The corrosion potential
shift is very small. This suggests that the EAE-Zn2+
formulation functions as a

V. Johnsirani et al. / Port. Electrochim. Acta 31 (2013) 95-106
100
mixed inhibitor controlling the anodic reaction and cathodic reaction to the same
extent.
The corrosion current value and LPR value for sea water are 6.354×10⁻⁶
A/cm2
and 6.500 x 10³ Ohm cm
2. For the formulation of EAE (6 mL) and Zn
2+ (25
ppm), the corrosion current value has decreased to 5.863 x 10⁻⁶
A/cm2
, and the
LPR value has increased to 6.909 x 10³ Ohm cm
2. This indicates that a protective
film is formed on the metal surface. When a protective film is formed on the
metal surface LPR value increases and corrosion current value decreases.
Table 4. Potentiodynamic polarization curves of carbon steel immersed in various test
solution System Ecorr
mV vs. SCE
bc
mV/decade
ba
mV/decade
LPR
Ohm cm2
Icorr
A/cm2
Sea water -816 157 239 6.500 x 10³ 6.354 x 10
-6
Sea water + 6 mL
EAE + 25 ppm Zn2+
-820 151 240 6.909 x 10³ 5.863 x 10
-6
Figure 2. Polarization curves of carbon steel immersed in various test solutions; (a) sea
water; (b) sea water + EAE 6 mL + Zn2+
25 ppm .
Figure 3. AC impedance spectra of carbon steel immersed in various test solutions; a) sea
water; b) sea water + EAE 6 mL + Zn2+
25 ppm.
V. Johnsirani et al. / Port. Electrochim. Acta 31 (2013) 95-106
101
Analysis of AC impedance spectra AC impedance spectra have been studied to detect the formation of a film on the
metal surface. If a protective film is formed, the charge transfer resistance
increases and the double layer capacitance value decreases [33-37]. The AC
impedance spectra of carbon steel immersed in various solutions are shown in
Fig. 3. The AC impedance parameter, namely charge transfer resistance (Rt) and
double layer capacitance (Cdl) (derived from Nyquist plot) are given in Table 5.
Table 5. AC impedance parameters of carbon steel immersed in various test solutions. System Rt (Ohm cm
2)
Cdl (F/cm
2) Impedance value
log(z/Ohm)
Sea water 101.10 5.0445 x 10⁻⁸
2.060
EAE 6 mL + Zn2+
25 ppm 111.43 4.576 x 10⁻⁸
2.101
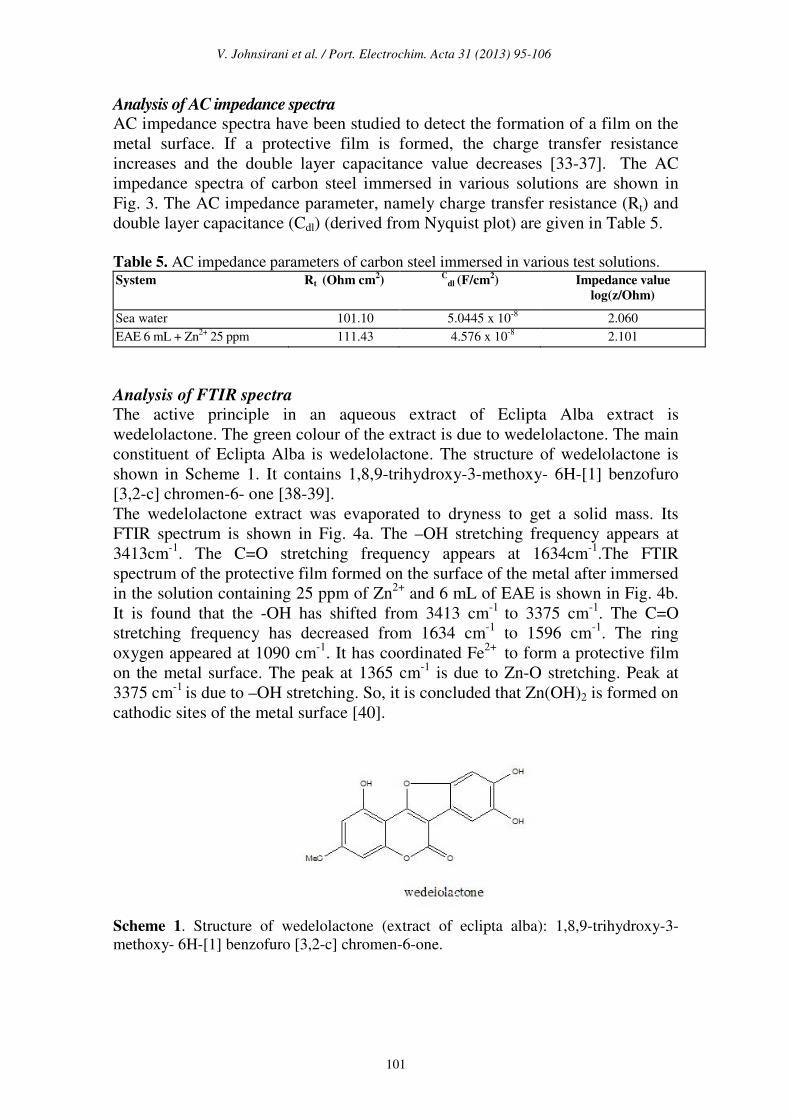
Analysis of FTIR spectra The active principle in an aqueous extract of Eclipta Alba extract is
wedelolactone. The green colour of the extract is due to wedelolactone. The main
constituent of Eclipta Alba is wedelolactone. The structure of wedelolactone is
shown in Scheme 1. It contains 1,8,9-trihydroxy-3-methoxy- 6H-[1] benzofuro
[3,2-c] chromen-6- one [38-39].
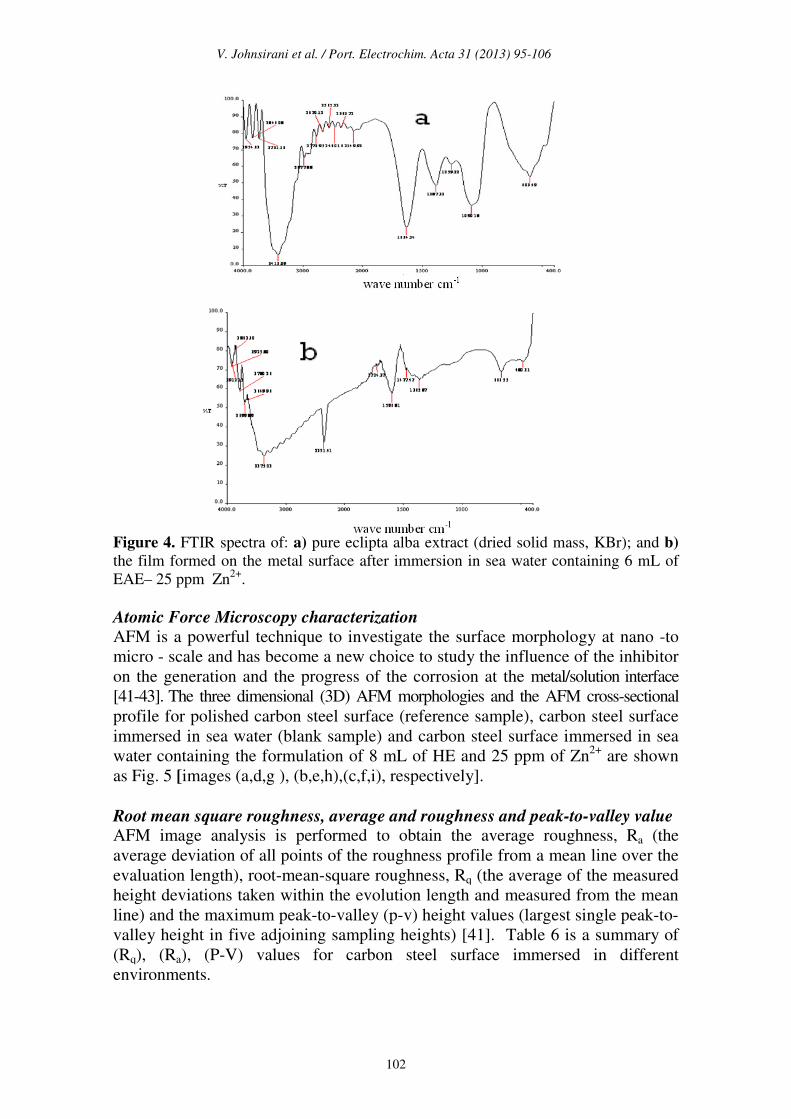
The wedelolactone extract was evaporated to dryness to get a solid mass. Its
FTIR spectrum is shown in Fig. 4a. The –OH stretching frequency appears at
3413cm-1
. The C=O stretching frequency appears at 1634cm-1
.The FTIR
spectrum of the protective film formed on the surface of the metal after immersed
in the solution containing 25 ppm of Zn2+
and 6 mL of EAE is shown in Fig. 4b.
It is found that the -OH has shifted from 3413 cm-1
to 3375 cm-1
. The C=O
stretching frequency has decreased from 1634 cm-1
to 1596 cm-1
. The ring
oxygen appeared at 1090 cm-1
. It has coordinated Fe2+
to form a protective film
on the metal surface. The peak at 1365 cm-1
is due to Zn-O stretching. Peak at
3375 cm-1
is due to –OH stretching. So, it is concluded that Zn(OH)2 is formed on
cathodic sites of the metal surface [40].
Scheme 1. Structure of wedelolactone (extract of eclipta alba): 1,8,9-trihydroxy-3-
methoxy- 6H-[1] benzofuro [3,2-c] chromen-6-one.
V. Johnsirani et al. / Port. Electrochim. Acta 31 (2013) 95-106
102
Figure 4. FTIR spectra of: a) pure eclipta alba extract (dried solid mass, KBr); and b)
the film formed on the metal surface after immersion in sea water containing 6 mL of
EAE– 25 ppm Zn2+
.
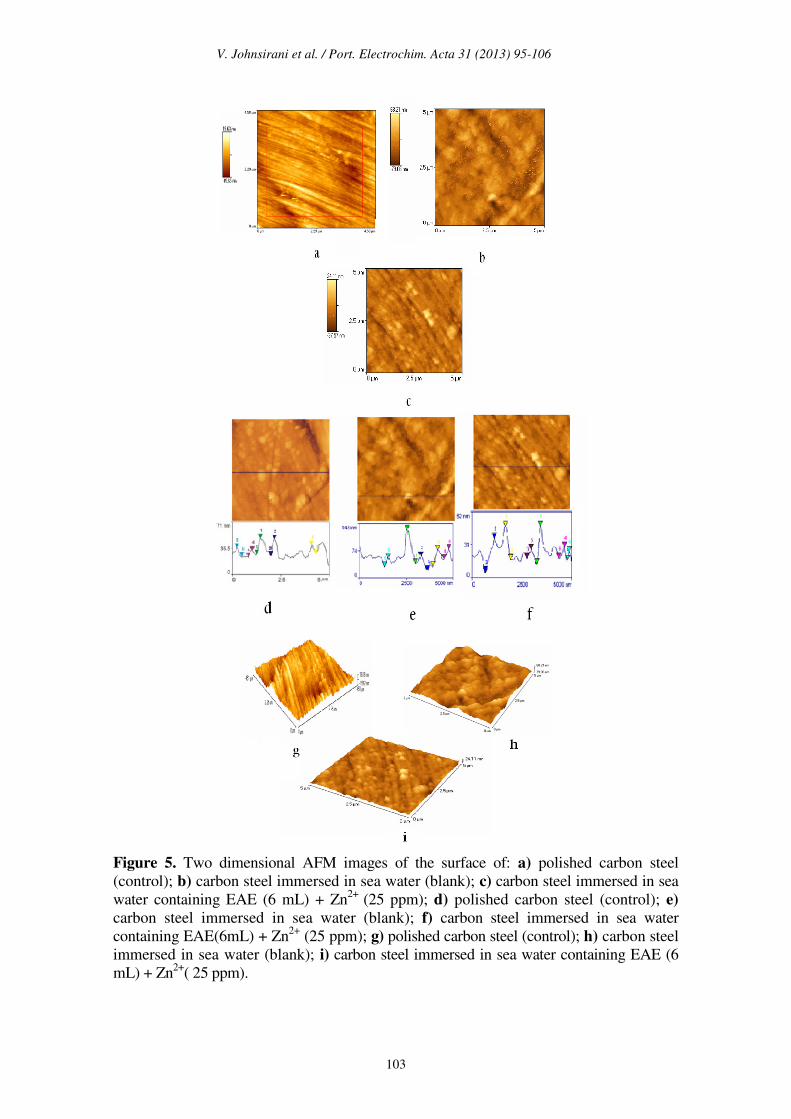
Atomic Force Microscopy characterization AFM is a powerful technique to investigate the surface morphology at nano -to
micro - scale and has become a new choice to study the influence of the inhibitor
on the generation and the progress of the corrosion at the metal/solution interface
[41-43]. The three dimensional (3D) AFM morphologies and the AFM cross-sectional
profile for polished carbon steel surface (reference sample), carbon steel surface
immersed in sea water (blank sample) and carbon steel surface immersed in sea
water containing the formulation of 8 mL of HE and 25 ppm of Zn2+
are shown
as Fig. 5 [images (a,d,g ), (b,e,h),(c,f,i), respectively].
Root mean square roughness, average and roughness and peak-to-valley value
AFM image analysis is performed to obtain the average roughness, Ra (the
average deviation of all points of the roughness profile from a mean line over the
evaluation length), root-mean-square roughness, Rq (the average of the measured
height deviations taken within the evolution length and measured from the mean
line) and the maximum peak-to-valley (p-v) height values (largest single peak-to-
valley height in five adjoining sampling heights) [41]. Table 6 is a summary of
(Rq), (Ra), (P-V) values for carbon steel surface immersed in different
environments.
V. Johnsirani et al. / Port. Electrochim. Acta 31 (2013) 95-106
103
Figure 5. Two dimensional AFM images of the surface of: a) polished carbon steel
(control); b) carbon steel immersed in sea water (blank); c) carbon steel immersed in sea
water containing EAE (6 mL) + Zn2+
(25 ppm); d) polished carbon steel (control); e)
carbon steel immersed in sea water (blank); f) carbon steel immersed in sea water
containing EAE(6mL) + Zn2+
(25 ppm); g) polished carbon steel (control); h) carbon steel
immersed in sea water (blank); i) carbon steel immersed in sea water containing EAE (6
mL) + Zn2+
( 25 ppm).

V. Johnsirani et al. / Port. Electrochim. Acta 31 (2013) 95-106
104
Fig. 5 (a,d,g) displays the surface topography of un-corroded metal surface. The
values of Rq, Ra and p-v height for the polished carbon steel surface (reference
sample) are 4.3 nm, 3.4 nm and 35.28 nm, respectively. The slight roughness
observed on the polished carbon steel surface is due to atmospheric corrosion.
Fig. 5 (b,e,h) displays the corroded metal surface with few pits in the absence of
the inhibitor immersed in sea water. The (Rq), (Ra), (p-v) height values for the carbon
steel surface are 17.10 nm, 13.58 nm and 92.28 nm, respectively. These data suggest
that the carbon steel surface immersed in sea water has a greater surface
roughness than the polished metal surface, which shows that the unprotected
carbon steel surface is rougher due to the corrosion of the carbon steel in sea
water environment.
Table 6. AFM data for carbon steel surface immersed in inhibited and uninhibited
environments. Samples RMS (Rq)
Roughness (nm) Average (Ra)
Roughness (nm) Maximum Peak-to-
Valley height (nm) 1. Polished carbon steel (Control) 4.33 3.41 35.28
2. Carbon steel immersed in sea water
(blank) 17.10 13.58 92.28
3. Carbon steel immersed in sea water
+ EAE (6 mL) + Zn2+
25 (ppm) 8.74 6.48 35.32
Fig. 5 (c,f,i) displays the surface after immersion in sea water containing 6 mL of
EAE and 25 ppm of Zn2+
. The (Rq), (Ra) (p-v) height values for the carbon steel
surface are 8.74 nm, 6.48 nm and 35.32 nm, respectively. The (Rq), (Ra) (p –v) height
values are considerably less in the inhibited environment compared to the
uninhibited environment. These parameters confirm that the surface is smoother.
The smoothness of the surface is due to the formation of a compact protective
film of Fe2+
-EAE complex and Zn(OH)2 on the metal surface thereby inhibiting
the corrosion of carbon steel [41].
Mechanism of corrosion inhibition Weight loss method reveals that the formulation consisting of 6 mL of EAE and
25 ppm of Zn2+
offers 92% IE to carbon steel immersed in sea water. Polarization
study reveals that EAE-Zn2+
system functions as a mixed inhibitor. FTIR spectra
reveal that the protective film consists of Fe2+
-wedelolactone complex and
Zn(OH)2.
In order to explain the above facts in a holistic way, the following mechanism of
corrosion inhibition is proposed:
- when the formulation consisting of sea water, eclipta alba extract and Zn2+
is
prepared, there is formation of Zn2+
-wedelolactone complex in solution;
- when carbon steel is immersed in the solution, the Zn2+
-wedelolactone complex
diffuses from the bulk of the solution towards the metal surface;
- on the metal surface, Zn2+
-wedelolactone complex is converted into Fe2+
-
wedelolactone complex. Zn2+
is released
Zn2+
-wedelolactone + Fe2+
→ Fe2+
- wedelolactone + Zn2+
;
- the released Zn2+
combines with OH- to form Zn(OH)2 on the cathodic sites
Zn2+
+ 2OH- → Zn(OH)2↓;
V. Johnsirani et al. / Port. Electrochim. Acta 31 (2013) 95-106
105
- thus the protective film consists of Fe2+
-wedelolactone complex and Zn(OH)2.
Conclusions The present study leads to the following conclusions:
1. The formulation consisting of 6 mL EAE and 25 ppm Zn2+
has 92% inhibition
efficiency to carbon steel immersed in sea water.
2. Polarization study reveals that EAE-Zn2+
system functions as a mixed
inhibitor.
3. AC impedance spectra reveal that a protective film is formed on the metal
surface.
4.FTIR spectra reveal that the protective film consists of Fe2+
- wedelolactone
complex and Zn(OH)2.
Acknowledgement
The authors are thankful to their respective management and DRDO, India.
References
1. ASM Metals Handbook. Vol 13: Corrosion, 9th
ed. Materials Park, OH:
ASM Intermational; 1987. P. 893.
2. Moller H, Boshoff ET, Froneman H. J South Afr Inst Mining Metallurgy.
2006;106:592.
3. Nasibi M, Zaarei D, Danaee I. Chem Eng Comm. 2012:1.
4. Ostovari A, Hoseinieh SM, Peikari M. et al. Corros Sci. 2009;51:1935.
5. El-Etre AY, Abdallah M. Corros Sci. 2000;42:731.
6. Souza FS, Spinelli A. Corros Sci. 2009;51:642.
7. Trindade LG, Goncalves RS. Corros Sci. 2009;51:1578.
8. Bouyanzer A, Hammouti B, Majidi L. Mater Lett. 2006;60:2840.
9. Ebenso EE, Alemu H, Umoren SA, Obot IB. Int J Electrochem Sci.
2008;3:1325.
10. Oguzie EE. Mater Chem Phys. 2006;99:441.
11. Rajendran S, Shanmugapriya S, Rajalakshmi T, Raj AJJA. Corrosion.
2005;61:685.
12. Chauhan LR, Gunasekaran G, Corros Sci. 2007;49:1143.
13. El-Etre AY, Abdallah M, El-Tantawy ZE. Corros Sci. 2005;47:385.
14. Rajendran S, Agasta M, Devi RB, et al. Zastita Materijala 2009;50:77.
15. Li Y, Zhao P, Liang Q, Hou B. Appl. Surf. Sci. 2005;252:1245.
16. Rajendran S, Devi MK, Regis APP, et al. Zastita Materijala. 2009;50:131.
17. Raja PB, Sethuraman MG. Mater Lett. 2008;62:113.
18. Sangeetha M, Rajendran S, Muthumegala TS, Krishnaveni A. Zastita
Materijala. 2011;52:3.
19. Eclipta prostrate paramount for hair loss and alopecia citation of Bible.
Healthy Hair Highlights News. 22 July 2011.Retrieved 2011-11-09.
20. Roy RK, Thakur M, Dixit VK. Arch Dermatol Res. 2008;300:357.
Retrieved 2012-02-13.
V. Johnsirani et al. / Port. Electrochim. Acta 31 (2013) 95-106
106
21. Fontana MG. Corrosion engineering. 3rd
Ed. New Delhi:TATA McGraw-
Hill; 2006.
22. Umamathi T, Selvi JA, Kanimozhi SA, et al. Ind J Chem Technol.
2008;15:560.
23. Kanimozhi SA, Rajendran S. Int J Electrochem Sci. 2009;4:353.
24. Anthony N, Sherine HB. Arab J Sci Eng. 2010;35:41.
25. RajendranS, Agasta M, Devi RB, et al. Zastita Materijala. 2009;50:77.
26. Anuradha K, Vimala R, Narayanaswamy B, et al. Chem Eng Comm.
2008;195:352.
27. Selvarani FR, Santhamadharasi S, Sahayaraj JW, et al. Bull Electrochem.
2004;20:561.
28. Johnsirani V, Rajendran S, Sathiyabama J, et al. Bulg Chem Comm.
2012;44:41.
29. Kavipriya k, Sathiyabama J, Rajendran S, Krishnaveni A, Int J Adv Eng Sci
Tech. 2012;2:341.
30. Sangeetha M, Rajendran S, Sathiyabama J, et al. Port Electrochim Acta.
2011;29:429.
31. Manivannan M, RajendranS. Res J Chem Sci. 2011;1:42.
32. Pandiarajan M, Prabhakar P, Rajendran S, Eur Chem Bull. 2012;1:238
33. Kalaivani K, Narayanasamy B, Selvi JA, et al. Port Electrochim Acta.
2009;27:177.
34. Rajendran S, Jeyasundari J, Usha P, et al. Port Electrochim Acta.
2009;27:153.
35. Jayashree A, Rajammal F, Selvarani J, et al. Port Electrochim Acta.
2009;27:23.
36. Selvi JA, Rajendran S, Sri VG, et al. Port Electrochim Acta. 2009;27:1.
37. Shanthy P, Rengan P, Chelvan AT, et al. Ind J. Chem Tech. 2009;16:328.
38. Prakash T, Rao NR, Swamy AHMV. Phytomedicine: Int J Phytotherapy
Phytopharmacology. 2008;November 01.
39. Muruganantham S, Anbalagan G, RamamurthyvN. Rom J Biophys.
2009;19:285.
40. Silverstein RM, Webster FX. Spectrometric identification of organic
compounds. 6th Ed. Wiley Student Edition;2007.
41. Sherine B, Nasser AJA, Rajendran S. Int J Eng Sci Tech. 2010;2:341.
42. Singh AK, Quraishi MA. Corros Sci. 2011;53:1288.
43. Wang B, Du M, Zhang J, Gao CJ. Corros Sci. 2011;53:353.
Top Related