


Languages
Pages
Legal


1
Background paper for the COMPETITIVE COMMERCIAL AGRICULTURE IN
AFRICA STUDY (CCAA)
NIGERIA CASE STUDY
Professor Aderibigbe S. Olomola
Director, Agriculture and Rural Development Department
Nigerian Institute of Social and Economic Research (NISER), Ibadan
Disclaimer:
This background report is being made available to communicate the results of Bank-funded work to the development community with the least possible delay. The manuscript therefore has not been prepared in accordance with the procedures appropriate to formally edited texts. Some sources cited in this report may be informal documents that are not readily available.
The findings and interpretations expressed in this report are those of the author(s) and do not necessarily reflect the views of the Board of Executive Directors of the World Bank or the governments they represent, or those of the Food and Agriculture Organization of the United Nations (FAO).
The World Bank and FAO do not guarantee the accuracy of the data included in this work. The designations employed and the presentation of the material in this work, including the boundaries, colors, denominations, and other information shown on any map do not imply any judgment on the part of the World Bank or FAO concerning the legal status of any territory or the endorsement or acceptance of such boundaries.

2
COMPETITIVE COMMERCIAL AGRICULTURE IN AFRICA:
NIGERIAN CASE STUDY
By
Professor Aderibigbe S. Olomola
Director, Agriculture and Rural Development Department
Nigerian Institute of Social and Economic Research (NISER), Ibadan
FINAL REPORT SUBMITTED TO THE CANADIAN INTERNATIONAL
DEVELOPMENT AGENCY (CIDA) AND THE WORLD BANK
OCTOBER, 2007

3
CURRENCY EQUIVALENTS, WEIGHTS AND MEASURES
Currency Equivalents (as of December 2005)
Currency Unit: Naira (�)
Official Rate: US$1 = �131.7
Naira 1 = US$0.0076
Autonomous Market Rate: US$1 = �142.6
Naira 1 = US$0.0070
Mass and Weight Measure
1000 grammes = 1 Kilogramme (kg) 1000 kilogrammes = 1 Tonne
Area Measure
100 Acres = 1 Hectare (ha)

4
TABLE OF CONTENTS
Table of Contents iii List of Tables v List of Figures viii Abbreviations and Acronyms x Executive Summary xii
CHAPTER
1. INTRODUCTION AND BACKGROUND 1 1.1 Objectives 1 1.2 Conceptual Framework 2 1.3 Methodology 4 1.4 Structure of the Report 7 2. REVIEW OF BROAD DEVELOPMENT EXPERIENCE IN NIGERIA 8
2.1 Macroeconomic Performance 8 2.2 Review of Agricultural Development in Nigeria 10 2.3 Constraints to Competitiveness of Commercial Agriculture in Nigeria 18 3. THE VALUE CHAIN ANALYSIS FOR SELECTED COMMODITIES 23
3.1 Value Chain Analysis of the Cassava Industry 26 3.2 Value Chain Analysis of the Cotton Industry 47 3.3 Value Chain Analysis of the Maize Industry 58 3.4 Value Chain Analysis of the Rice Industry 75 3.5 Value Chain Analysis of the Soybean Industry 94 3.6 Value Chain Analysis of the Sugarcane Industry 108 3.7 Comparative Analysis of Value Chain By Type of Crops 118 3.8 Sensitivity Analysis 127

5
4. SUMMARY, CONCLUSIONS AND POLICY RECOMMENDATIONS 131
4.1 Main Findings and Conclusions on Profitability and Export Competitiveness 131
4.2 Constraints 134 4.3 Opportunities for Improved Agricultural Commercialization and Competitiveness 134 4.4 Recommendations for Improved Agricultural Competitiveness in Nigeria 141
REFERENCES 148

6
LIST OF TABLES
TABLE PAGE
2.1 Selected Macroeconomic Indicators 9 2.2 Phases of Agricultural Development Policies in Nigeria: 1960-2006 11 2.3 Average Credit Disbursed By Trading Banks Under the ACGS, By Zone 14 2.4 Moratorium for Agricultural Loans 15 2.5 Index of Production of Selected Crops: 1961-2005 17 2.6 Share of Agriculture in Total Imports and Non-Oil Exports 17 2.7 Trend in US Agricultural Export Dumping Levels, 1990-2003 22 3.1 Farm Sectors and Locations for the Value Chain Analysis 23 3.2 Basic Features of the Agro-Ecological Regions of the Selected Commodities 24
3.3 Gross Margin in Cassava Production in South-west Nigeria 26 3.4 Cassava Starch Value Chain Activity Results 28 3.5 World Cassava Production, 2002 30 3.6 Cassava Production in Nigeria, 1999-2004 33 3.7 Structure of Financial Costs in Cassava Enterprises 37 3.8 Profitability Indicators of Cassava Enterprises (Per MT) 38 3.9 Cassava Value Chain Indicators for 1MT of Final Traded Products 40 3.10 Cassava Profitability and Value Chain Indicators By Level of Commercialization 42 3.11 Comparison of Composition of Cassava Shipment Values in Nigeria (%) 43 3.12 Comparison of Selected Cassava Production Indicators in Nigeria 44 3.13 Build-up of Cassava Final SV in Nigeria By Stage (%) 46 3.14 Cotton Production in Nigeria, 1999-2004 51

7
3.15 Structure of Financial Costs in Cotton Enterprises (FAM) 53 3.16 Profitability Indicators of Cotton Enterprises (Per MT) (FAM) 54 3.17 Cotton Value Chain Indicators in Nigeria (Per MT) 56 3.18 Composition of Cotton Shipment Values in Nigeria (%) 56 3.19 Build-up of Cotton Final SV By Stage (%) 56 3.20 Gross Margin in Maize Production in Nigerian Agro-Ecological Zones 59 3.21 Gross Margin Analysis per Ha of Selected Enterprises 59 3.22 Maize Production in Nigeria, 1999-2004 63 3.23 Structure of Financial Costs in Maize Enterprises in Nigeria 67
3.24 Financial and Profitability Indicators of Maize Enterprises in Nigeria 68 3.25 Value Chain Indicators for Maize Enterprises in Nigeria 70 3.26 Maize Profitability and Value Chain Indicators By Level of Commercialization 71 3.27 Comparison of Composition of Maize Shipment Values in Nigeria 72 3.28 Comparison of Selected Maize Production Indicators 74 3.29 Gross Margin in Rice Production in Nigeria 75
3.30 Comparison of Domestic and Import Price of Rice in Nigeria 76 3.31 Rice Production in Nigeria, 1999-2004 80 3.32 Structure of Financial Costs of Rice Enterprises in Nigeria 84 3.33 Profitability Indicators of Rice Enterprises in Nigeria (Per MT) 86 3.34 Value Chain Indicators for Rice Enterprises in Nigeria (Per MT) 88 3.35 Rice Profitability and Value Chain Indicators By Level of Commercialization 90 3.36 Comparison of Composition of Rice Shipment Values in Nigeria (%) 91 3.37 Comparison of Selected Rice Production Indicators in Nigeria 93 3.38 Build-up of Rice Final SV By Stage (%) 93

8
3.39 Soybean Production in Nigeria, 1999-2004 96 3.40 Structure of Financial Costs in Soybean Enterprises in Nigeria 99 3.41 Financial and Profitability Indicators of Soybean Enterprises in Nigeria (Per MT) 100
3.42 Soybean Value Chain Indicators in Nigeria (Per MT) 102 3.43 Soybean Profitability and Value Chain Indicators By Level of Commercialization 104 3.44 Comparison of Composition of Soybean Shipment Values in Nigeria (%) 105 3.45 Comparison of Selected Soybean Production Indicators in Nigeria 105 3.46 Build-up of Soybean Final SV By Stage (%) 107 3.47 Sugar Supply in Nigeria, 1990-2000 110 3.48 Sugar-Cane Production in Nigeria, By Zones, 1999-2004 112 3.49 Structure of Financial Costs in Sugar-cane Enterprises in Nigeria 114 3.50 Profitability Indicators of Sugar-cane Enterprises in Nigeria (Per MT) 115 3.51 Sugar-cane Value Chain Indicators in Nigeria (Per MT) 116 3.52 Composition of Sugar-cane Shipment Values in Nigeria (%) 117 3.53 Deviations of SVs From Parity Prices of Selected Commodities in Nigeria 126 3.54 Ranking of Selected Commodities in Order of Degree of Competitiveness 126 3.55 Changes in Profitability Indicators With 50% Increase in Yield and 50% Reduction in
Transport Cost 128
3.56 Changes in Shipment Value With 50% Increase in Yield and 50% Reduction in
Transport Cost 129
4.1 Summary of Main Findings By Crops 132 4.2 Value Chain Constraints of Agricultural Commodities in Nigeria 136
4.3 Achievements and Challenges of the Presidential Initiatives on Agriculture 139 4.4 Key Strategies for Improved Agricultural Competitiveness 142

9
LIST OF FIGURES
FIGURE PAGE
1.1 Stages in the Value Chain 3 2.1 Real Export Prices of Selected Agricultural Commodities, 1993-2003 20 3.1 Production of Cassava By Agro-Ecological Zones in Nigeria 34 3.2 Land Area Cultivated to Cassava in Nigerian Agro-Ecological Zones 34 3.3 Composition of Shipment Value for Cassava Enterprises in Nigeria 45 3.4 Cotton Production in Nigerian Agro-Ecological Zones 52 3.5 Land Area Cultivated to Cotton in Nigerian Agro-Ecological Zones 52 3.6 Trend in Maize Import in Nigeria, 2002-2005 62 3.7 Production of Maize By Agro-Ecological Zones in Nigeria 65 3.8 Land Area Cultivated to Maize in Nigerian Agro-Ecological Zones 65 3.9 Composition of Shipment Value for Maize Enterprises in Nigeria 73 3.10 Import of Paddy Rice in Nigeria, 2002-2005 78 3.11 Import of Paddy Rice in Nigeria, 2002-2005 78 3.12 Rice Production in Nigerian Agro-Ecological Zones 81 3.13 Land Area Cultivated to Rice in Nigerian Agro-Ecological Zones 81 3.14 Comparison of Composition of Shipment Values in Rice Enterprises 92 3.15 Trend in Soybean Import in Nigeria, 2002-2005 95 3.16 Soybean Production By Agro-Ecological Zones in Nigeria 97 3.17 Land Area Cultivated to Soybean in Nigerian Agro-Ecological Zones 97
3.18 Composition of Shipment Value for Soybean Enterprises in Nigeria 106 3.19 Sugar-cane Production in Nigeria, 1990-2000 109

10
3.20 Trend in Sugar Export in Nigeria, 2002-2004 111 3.21 Trend in Sugar Import in Nigeria, 2002-2005 111 3.22 Sugar-cane Production in Nigerian Agro-Ecological Zones 113 3.23 Land Area Cultivated to Sugar-cane in Nigerian Agro-Ecological Zones 113 3.24 Composition of Shipment Value for Sugar-cane 117 3.25 Yield of Selected Crops in Nigeria 119 3.26 Comparison of Unit Cost of Production By Crops in Nigeria 120 3.27 Gross Margins in Selected Farm Sectors in Nigeria, By Crops 121 3.28 Net Profit in Selected Farm Sectors in Nigeria, By Crops 122 3.29 Final Shipment Values for Traded Grain Commodities in Nigeria 124 3.30 Final Shipment Values for Selected Traded Products in Nigeria 125

11
ABBREVIATIONS AND ACRONYMS
ADP Agricultural Development Project ACGS Agricultural Credit Guarantee Scheme AfDB African Development Bank CBN Central Bank of Nigeria DVA Domestic Value Added EBA Everything But Arms ECA Economic Commission for Africa ECF Emerging Commercial Farms EU European Union FAM Family Farm FAO Food and Agriculture Organization GDP Gross Domestic Product IDRC International Development Research and Cooperation IFAD International Fund for Agricultural Development IFPRI International Food Policy Research Institute IITA International Institute for Tropical Agriculture ISO International Sugar Organization LCF Large Commercial Farms MBD Million Barrels Per Day NACB Nigerian Agricultural Cooperative Bank NACRDB Nigerian Agricultural Cooperative and Rural Development Bank NAERLS Nigerian Agricultural Extension Research and Liaison Service

12
NAIC National Agricultural Insurance Corporation NCEMA National Centre for Economic Management and Administration NISER Nigerian Institute of Social and Economic Research NSPRI Nigerian Stored \Products Research Institute RCMP Root Crop Monitoring Programme RTEP Root and Tuber Expansion Programme SAP Structural Adjustment Programme SME Small and Medium-Scale Enterprises SSCN Social Science Council of Nigeria SV Shipment Value UNCTAD United Nation Conference for Trade and Development USDA United State Department of Agriculture

13
EXECUTIVE SUMMARY
INTRODUCTION
Since the inception of democratic governance in 1999, Nigeria has witnessed determined efforts by the government to achieve rapid economic growth and development and to significantly reduce poverty. Real GDP growth rate made a significant jump from an average of 2.8 percent in 1997/1998 to 5.4 percent in 2000. Although it has been difficult to maintain a steady growth thereafter, the GDP growth rate has not fallen to the very low level often recorded before 2000. Indeed, in 2003 the target growth rate of 10 percent set by the government was met for the first and last time between 2000 and 2005. The 10.2 percent growth rate in 2003 was the highest in three decades, and was driven mainly by improvements in agriculture which grew by 7 percent and the oil sector which grew by 23 percent. Despite the improvement in growth performance, low level of savings and investment is still a major constraint. The highest investment ratio obtained so far is 16.2 percent while the savings ratio is 15.6 percent. The highest investment ratio attained since 2000 is far below the minimum investment to GDP ratio of about 30 percent which is required to unleash a poverty-reducing growth rate of at least 7-8 percent per year (see NEED, 2004). Increased private investment requires a stable macroeconomic environment characterized by a low rate of inflation, low rate of interest, stable real exchange rate and well-managed current account and fiscal balances. The inflation rate which came down to a single digit in 2000 (6.9 percent) rose to an all time high of 18.9 percent in 2001. It trended downwards thereafter to a single digit again in 2006 (8.2 percent) although the rate remains higher than the rate as at 2000. The lending rate which also peaked at 31.2 percent in 2001 declined to 18.7 percent in 2006 - a rate still regarded by investors as too high for operating profitably. Invariably, manufacturing capacity utilization which stood at 36.1% in 2000 grew somewhat; but followed a declining trend between 2003 and 2006.
Improvement in macroeconomic management has led to substantial reduction in fiscal deficits, less volatility in exchange rate and rising external reserves. Between 2000 and 2003 the problem of fiscal imbalances actually worsened. Fiscal deficit rose from 2.1 percent of GDP to 4.0 percent in 2001 and peaked at 5.5 percent in 2002. Part of the associated problem is the considerable reduction in the growth of credit to the private sector with adverse consequences on investment and output expansion. However, by 2003, the fiscal deficit was less than 3 percent of GDP and by 2004 it was only 1.7 percent. The external reserves increased from about US$9.91 billion in 2000 to about US$16.955 in 2004. These recent macroeconomic trends indicate that the country is right on the path to macroeconomic stability. The implementation of macroeconomic reforms as well as reforms in various sectors of the economy has been going on relentlessly since 2000, but while macroeconomic stability is being achieved, it appears that desirable outcomes in the areas of employment generation, poverty reduction, export expansion and diversification of the economy are yet to be achieved to a significant extent. The transformation of the agricultural sector and investments in infrastructure development will contribute in no small way to the realization of the development objectives in these areas.
The agricultural sector provides employment for about 60 percent of the labour force and raw materials for industrial development. Its provision of food for the growing population and income for millions of smallholders is remarkable for the maintenance of peace in the country. Nonetheless, the performance of the sector over the years is far below expectation because development efforts have failed to place it as the foundation for economic growth and development; thus it has not witnessed the desired transformation and the available resource

14
endowment has been grossly underutilized. Its role in terms of foreign exchange and revenue generation that used to be prominent in the 1960s has been relegated to the background while attention is shifted to the development and export of crude oil. Up to the mid-1960s, Nigeria commanded a share in world agricultural exports of more than one percent and had a leading position for several of its export crops. Nigeria supplied more than half of all traded palm kernel, more than a third of all groundnuts, and more than a fifth of all palm oil. As the country shifted towards petroleum exploitation and export agricultural exports declined and by the mid-1980s, Nigeria’s world market share for agricultural products had dwindled to less than 0.1 percent. Today none of the country’s export crops, with the exception of cocoa, commands any significant world market share. With the increasing need to eradicate poverty and put an end to hunger and malnutrition as enshrined in the MDG targets, Nigeria and indeed many African countries are returning to the agricultural sector for possible solution. In Nigeria, various development approaches have been adopted – the market has been relied upon, the government has been directly involved; yet there remains chronic under-investment in the sector and the efforts have not been able to fully unlock the available potentials.
The goal of the Competitive Commercial Agriculture in Africa (CCAA) study is to explore the feasibility of restoring competitiveness and growth in selected African countries by identifying key commodities or products, production systems, and marketing arrangements that have the potential to underpin a rapid development of competitive commercial agriculture. The competitiveness study in Nigeria will inform on the potential for growth of commercial agriculture in the country. The aim of the competitiveness study is to identify commodities or products that are currently competitive or stand good prospects of becoming competitive in domestic, regional, or global markets. The Nigerian case study focuses on six commodities: cassava, cotton, maize, soybeans, rice and sugar. The specific objectives of the study are threefold. a) To review the broader development situation for Nigeria in general and for agriculture in
particular touching issues such as growth, savings and investment, macro–economic and agricultural policy environment, etc.). Specifically the review involves studies on the investment climate affecting agricultural and agro–industrial development such as policies, state of infrastructure, transport costs, land availability, labor availability, credit availability, institutional environment, and other cross cutting factors.
b) To review existing studies on the competitiveness of the selected commodities in the targeted agro–climatic zone. This involves: (i) identifying and briefly describing the target zone, as well as the most important agricultural production trends within the zone, (ii) identifying and reviewing existing value chain studies that have been conducted in the country for the selected commodities. The scope and coverage of the study, the extent to which the study conforms to the methodological guidelines provided, and the overall quality of the study are examined. (iii) summarizing the qualitative and quantitative conclusions that have been drawn about the actual and potential competitiveness of the commodity for the three farm production systems that are being covered in the study, (iv) identifying weak links in the value chain that are the main obstacles to achieving competitiveness and (v) describing the sorts of improvements that existing studies suggest could be made in the value chain to significantly enhance competitiveness.

15
c) To analyze selected commodity chains from farm–gate to foreign destination ports using the value chain approach. Both qualitative and quantitative analyses of the value chains are carried out.
Data for the analysis came mainly from relevant literature and secondary sources including the Project Coordinating Unit of the Federal Ministry of Agriculture and Water Resources, the Central Bank of Nigeria and the Nigerian Bureau of Statistics. To augment the secondary data, smallholders, emerging commercial farmers and large commercial farmers were visited in different production zones in Oyo, Kwara, Niger and Adamawa states to collect relevant data. The author visited the Zimbabwe farmers in Shonga, Kwara state and obtained useful information through the use of questionnaire and interviews. With this personal contact, it was possible to seek further clarifications through telephone conversations even after the visit. Also input suppliers, processors and exporters were visited to obtain necessary information. A number of companies dealing in export of agricultural commodities were visited in Lagos where discussions were held with key representatives who also supplied useful information relating to domestic and international logistics. With the aid of Research Assistants, cassava, rice and sugar processing enterprises were visited in Oyo, Niger and Adamawa states respectively to obtain necessary data.
THE VALUE CHAIN ANALYSIS FOR SELECTED COMMODITIES
The analysis of the selected commodity chains from farm gate to foreign destination port using the value chain approach and follows the algorithm laid out in the Excel Templates specifically designed for this study. In addition to the quantitative aspects of the analysis, priority is also accorded to the qualitative aspects of the chain covering key areas such as world market structure, the Nigerian market structure and a description of the value chain for each commodity from the production stage up till final consumption. The targeted commodities - cassava, cotton, maize, rice, soybean and sugarcane are produced in specific agro-ecological regions which also reflect the zonal classification of all the 36 states in the country. Cassava, rice and maize are produced in virtually all the six regions while cotton is common in the northwest and northeast agro-ecological regions. Sugarcane is produced mainly in the northeast and north-central regions while soybean is produced in all the regions with the exception of south-south. Commercial production of the selected crops vary considerably across the agro-ecological zones. Whereas cassava, maize and rice are produced in commercial quantity in all the zones, cotton soybean and sugar-cane are restricted to specific zones. The NW (Northwest) zone is the leading producer of cotton, followed by the NE (Northeast) and NC (Northcentral) agro-ecological zones. The Northwest is also leading in the production of sugar-cane. Other zones producing sugar-cane are NE, NC and SW. Available data from 1999 to 2004 indicate that the NC is the leading producer of cassava, maize, rice and soybean. During this period, the production of these commodities maintained a positive but haphazard trend although there seems not to be any significant expansion in land area under cultivation. The value chain analysis seeks to examine the main links in the chain (production, assembly, processing, trade) with a view to determining the international competitiveness of the commodity. The analysis is conducted at three levels of operation – family farm (FAM), emerging commercial farm (ECF) and large commercial farm (LCF) and the results are presented accordingly.

16
Value Chain Indicators and Profitability of Cassava Enterprises
With regard to profitability of the cassava FAM, the results show that operating profit and net profit are positive only at the production and processing stages. At the production stage, the gross margin is US$149.89 while net profit is $149.08; whereas at the processing stage, the gross margin and net profit are US$85.18 and US$84.23 respectively. Moreover, the rate of return is higher at the production stage than at the processing stage. Operating profit of cassava ECF is positive at the production, assembly and processing stages. The gross margin per tonne is US$19.19, US$45.15 and US$85.18 respectively. Whereas net profit is positive at the assembly (US$45.15) and processing (US$84.58) stages, it is negative at the production stage indicating the difficulty to ensure viability of commercial production of cassava. The rate of return is about 22 percent at the production stage; but it is slightly higher at the assembly stage (25 percent) while it is highest at the processing stage (27 percent). Profitability indicators follow virtually the same pattern for cassava LCF as that of the cassava FAM. The results show that operating profit and net profit are positive only at the production and processing stages. At the production stage, the gross margin is US$127.80 while net profit is $107.73; whereas at the processing stage, the gross margin and net profit are US$83.44 and US$82.49 respectively. Moreover, the rate of return is higher at the production stage than at the processing stage.
The transformation of cassava from the FAM into various products results in considerable increase in value along the chain. From the farm production stage to the assembly stage SV increased by 579 percent while the increase from assembly to processing is 14 percent. From processing to the stage of final trading, the SV increased by 62 percent in respect of cassava chips, 74 percent in respect of cassava pellets and 66 percent in respect of starch. The transformation of cassava from farm production into cassava starch, cassava chips and cassava pellets at the final trading stage is associated with an increase in shipment value from US$40.33 at the cassava production stage to US$504.81 for cassava chips, US$542.68 for pellets and US$519.96 for starch. This represents an increase in shipment values of about 1152 percent, 1246 percent and 1189 percent in respect of cassava chips, pellets and starch respectively. Cassava production yields a value added (US$36.48) which represents 90% of the shipment value. Value added also represents a high proportion of the shipment value of the cassava products. The proportion varies from 82 percent in the case of cassava chips and starch to 84 percent for pellets. The DVA is made up largely (99 percent) of domestic costs and mark-ups.
The substantial increase in shipment value from the production stage to the stage of final traded product is not unexpected on account of the nature of the conversion of cassava tuber to the cassava products (chips, pellets, starch). A high quantity of raw cassava tuber (about three tones) of cassava tuber is required for the production of one tonne of each product. In view of the fact that the purchase of cassava tubers is included in the computation of shipment value and given the fact that the price of the commodity increases from one stage to another, it is not surprising that significant increase in shipment value is experienced between the production stage and the final traded commodity stage. The final SVs for cassava chips, pellets and starch are US$504.81, US$542.68 and US$519.96 respectively. Compared with the export parity price (US$-4.00) at the final commodity stage, none of these products is competitive at the international market. Apart from the high domestic costs, the very low level of international prices of these products makes them unprofitable and uncompetitive. As regards ECF, the transformation of cassava along the chain results in considerable increase in value. From the farm production stage to the processing stage SV increased by 26 percent. From processing to the stage of final trading, the SV increased by 62 percent in respect of cassava chips, 74 percent

17
in respect of cassava pellets and 66 percent in respect of starch. The transformation of cassava from farm production into cassava starch, cassava chips and cassava pellets at the final trading stage is associated with an increase in shipment value from US$248.63 at the cassava production stage to US$508.55, US$546.97 and US$520.75 at the stage of final trading of cassava chips, pellets and starch respectively. This represents an increase in shipment values of about 105%, 120% and 109% in the case of cassava chips, pellets and starch respectively. Cassava production yields a value added (US$229.76) which represents 92% of the shipment value. Value added also represents a high proportion of the shipment value of the cassava products. The proportion varies from 72 percent in the case of cassava chips, to 73 percent for starch and 75 percent for pellets. About 90 percent of the DVA in the case of cassava chips is made up of domestic costs and mark-ups while the proportion for pellets is 91 percent. For cassava starch, domestic costs and mark-ups account for 90 percent of the DVA. The final SVs for cassava chips, pellets and starch are US$508.55, US$546.97 and US$520.75 respectively. Compared with the export parity price (US$-3.00) at the final commodity stage, none of these products is competitive at the international market. Again apart from the high domestic costs, the very low level of international prices of these products makes them unprofitable and uncompetitive.
Also, in the case of LCF, the transformation of cassava into various products results in considerable increase in value along the chain. From the farm production stage to the assembly stage SV increased by 553 percent while the increase from assembly to processing is 10 percent. From processing to the stage of final trading, the SV increased by 61 percent in respect of cassava chips, 73 percent in respect of cassava pellets and 66 percent in respect of starch. The transformation of cassava from farm production into cassava starch, cassava chips and cassava pellets at the final trading stage is associated with an increase in shipment value from US$43.79 at the cassava production stage to US$506.63 for cassava chips, US$544.39 for pellets and US$522.61 for starch. This represents an increase in shipment values of about 1053 percent, 1139 percent and 1087 percent in respect of cassava chips, pellets and starch respectively. Cassava production of LCF yields a value added (US$41.85) which represents 96% of the shipment value. Domestic Value Added (DVA) also represents a high proportion of the shipment value of the cassava products. The proportion varies from 83% in the case of cassava chips, to 85% for starch and 84% for pellets. In each case over 80% of the DVA is made up of domestic costs and mark-ups. The final SVs for cassava chips, pellets and starch are US$506.63, US$544.39 and US$522.61 respectively. Compared with the export parity price (US$-3.00) at the final commodity stage, none of these products is competitive at the international market. In addition to high domestic costs, the very low level of international prices of these products makes them unprofitable and uncompetitive.
The results show that the costs incurred by FAM in addition to the domestic costs of production constitute a higher proportion of the SV than it is the case for ECF and LCF. The results show that increasing commercialization of cassava production has not led to an improvement in the degree of competitiveness of the commodity in the international market. A comparison of the final shipment values for the cassava products among the three categories of enterprises shows that domestic costs and mark-ups seem to be highest in the case of FAM while they appear to be lowest in the case of ECF. On the other hand, foreign costs seem to be the highest in the case of ECF followed by LCF and lowest in the case of FAM. The highest level of unofficial extras is also observed in the case of ECF. This finding implies that measures aimed at reducing cost at the farm product level in order to improve the competitiveness of the commodity will be different for the various categories of producers. As it turned out, the ECF is a high cost

18
producer with negative returns. The high production cost incurred by the ECF is due to the cost associated with the fixed assets which cost is by far the highest among the three categories of farmers. The net return is apt to improve if there is a reduction in the cost of capital and increased access to markets that offer more remunerative prices.
Impediments to Growth in the Cassava Industry
There are production processing and marketing constraints in the cassava industry. The cost of hiring labour and the tedium encountered in manual cultivation particularly during land preparation with local implements seem to discourage investment in cassava production. With regard to processing, equipment are generally not easily available, and when available, they are usually inefficient, their parts wear down easily, while the public power supply is very unreliable forcing the processors to depend on the expensive alternative of using power generators in the face of ever escalating cost of fuel for the generators. As regards marketing, unattractive prices of products remain a serious problem. A situation where the cost of transportation due to poor state of the access roads, cost of fuel etc are added to the cost of production make the prices offered for the cassava tubers and processed products like garri and flour unattractive.
Value Chain Indicators and Profitability of Cotton Enterprises
The results show that operating profit and net profit are positive at every stage of the cotton value chain. At the production stage, the gross margin is US$28.55 while net profit is US$17.56; whereas at the assembly stage, the gross margin and net profit are US$76.82 and US$69.57. Profitability is lowest at the processing stage judging by the level of gross margin (US$7.70) and net profit (US$5.29). The rate of return attained at the processing stage is about one percent compared to 26 percent at the assembly stage and 7 percent at the production stage. Profit is highest at the trading stage. Cotton lint trade attracts net profit of US$472.88 with 58 percent rate of return while net profit for cotton seed trade is US$278.45 with 91 percent rate of return.
The transformation of cotton into cotton lint and cotton seed results in considerable increase in value along the chain. The transformation of cotton into cotton lint, is associated with an increase in shipment value from US$219.73 at the cotton production stage to US$815.11 at the stage of trading in cotton lint representing an increase of about 271 percent. For cotton seed, the shipment value increases from US$219.73 to US$307.55 or by about 40 percent (Table 3.17). Cotton production yields a value added (US$219.72) which represents 89 percent of the shipment value. Value added also represents a high proportion of the shipment value of both cotton lint (88 percent) and cotton seed (81 percent) trade. In respect of cotton lint, 92 percent of the DVA is accounted for by domestic costs and mark-ups while in the case of cotton seed domestic costs and mark-ups account for 94 percent of the DVA. The final SV for cotton lint (US$815.11) is lower than the export parity price (US$1,196) implying that Nigerian cotton lint is competitive at the international market. With regard to cotton seed, the final SV (US$307.55) is also lower than the export parity price (US$494) implying that the commodity is competitive at the international market. The composition of shipment values shows considerable variation within each stage but not across the various stages in the value chain. In general, domestic costs and mark-ups constitute not less 80 percent of the SV in each of the stages. This is followed by the foreign costs, unofficial expenses and official duties and tax.

19
Impediments to Growth in the Cotton Industry
The major constraints to growth include (i) inadequate and untimely supply of inputs, (ii) seed contamination which often leads to loss of viability and low yields and (iii) absence of institutional arrangement for commodity grading and quality control.
Value Chain Indicators and Profitability of Maize Enterprises
With regard to profitability indicators of the maize FAM, the results show that operating profit and net profit are positive at the production stage whereas the reverse is the case at the assembly stage. At the production stage, the gross margin is US$227.45 while net profit is $220.73. The rates of return at this stage range from 147 percent to 158 percent. The gross margin per tonne for maize ECF is US$48.5. The negative net profit portrays the difficulty in ensuring increased viability on the basis of the current level of investment and commercialization. At the assembly stage both the gross margin and net profit tend to be negative. In the case of the LCF, only operating profit is positive at the production stage. The gross margin per tonne is US$111.70. The negative net profit is an indication that the long term viability of large commercial maize farms may be difficult. At the assembly stage both operating and net profits tend to be negative.
The value chain indicators for the final traded commodity reveal that substantial increase in shipment value occurs between the production stage and final delivery of the commodity. For the maize FAM, the SV increased from US$150.48 to US$414.83 representing an increase of about 176 percent. Maize production is associated with a value added (US$142.26) which represents 95 percent of the shipment value. About 96 percent of the DVA is accounted for by domestic costs and mark-ups. The result shows that the final SV (US$414.83) is higher than the import parity price (US$131.10) implying that Nigerian maize is not competitive in the international market. In the case of the ECF the SV increased from US$336.68 to US$418.03 representing an increase of about 24 percent. ECF maize production yields a value added (US$274.03) which represents 81 percent of the shipment value. About 88 percent of the DVA is accounted for by domestic costs and mark-ups. The result shows that the final SV (US$418.03) is higher than the import parity price (US$131.10) implying that Nigerian maize is not competitive in the international market. As regards LCF maize production is associated with a value added (US$434.94) which represents 90 percent of the shipment value. The DVA is made up entirely of domestic costs and mark-ups. The result shows that the final SV (US$422.73) is higher than the import parity price (US$131.10) implying that Nigerian maize is not competitive in the international market.
The analysis shows that irrespective of the level of commercialization of maize production in Nigeria, the commodity remains uncompetitive in the international market. This finding implies that measures aimed at reducing cost at the farm product level in order to improve the competitiveness of the commodity should be targeted at domestic costs and mark-ups in general but in the case of ECF and LCF there is need also to address the foreign costs. With the low cost profile of the FAM it has the highest gross margin ($332.05/ha), followed by LCF ($155.21/ha) and ECF ($72.26/ha). The maize FAM also has the highest net returns whereas the other categories of farms have negative net returns. The net return is apt to improve if there is a reduction in the cost of capital and increased access to markets that offer more remunerative prices.

20
Impediments to Growth in the Maize Industry
The major constraints to growth in the maize industry include the following. � Inadequate and untimely supply of modern inputs
� Lack of credit facilities for processing enterprises � Unattractive prices of products � High transportation cost arising from high and rising fuel prices � The lack of pre-planting contracts expose farmers to unfavourable market dynamics. For
instance, in August 2005 maize was sold at N80,000 ($606.06) per tonne but in August 2006 the price dropped to N28,000 ($212.12) per tonne due to the outbreak of bird flu in some states and the resultant fall in the demand for maize in the feed industry.
� Poor storage facilities Value Chain Indicators and Profitability of Rice Enterprises
At the FAM level, the results show that except for raw material processing, operating profit and net profit are positive at every stage of the rice value chain. At the production stage, the gross margin is US$339.49 while net profit is US$333.91; whereas at the assembly stage, the gross margin (US$83.33) and net profit remains the same. At the level of trading, both the gross margin and net profit are positive but remain at the same level (US$83.23) since the traders made no significant investment on rice marketing. The rate of return (net profit/total costs) at the marketing stage (12 percent) is the smallest when compared to the 18 percent at the assembly stage and 277 percent at the production stage.
With regard to profitability indicators, the result shows that both operating profit and net profit are also positive at every stage of the value chain with the exception of raw material processing. At the production stage, the gross margin per tonne is US$402.69 while net profit is US$398.75; whereas at the assembly stage, the gross margin (US$79.70) and net profit remain the same. At the level of trading, both the gross margin and net profit are positive but remain at the same level (US$79.83) since the traders made no significant investment on rice marketing. The rate of return (net profit/total costs) at the marketing stage (12 percent) is the lowest when compared to the 17 percent at the assembly stage and 272 percent at the production stage. The pattern of profitability for the LCF category is similar to that of ECF and FAM. At the production stage, the gross margin per tonne is US$373.79 while net profit is US$164.83; whereas at the assembly stage, the gross margin (US$76.52) and net profit remain the same. At the level of trading, gross margin is US$79.45 while net profit remains at the same level. The rate of return (net profit/total costs) at the marketing stage (12 percent) is the lowest when compared to the 16 percent at the assembly stage and 43 percent at the production stage.
The value chain indicators for the final traded commodity reveal that substantial increase in shipment value occurs between the production of paddy and final delivery of milled rice (Table 3.34). With regard to the FAM, the transformation of paddy rice into milled rice is associated with an increase in shipment value from US$120.64 at the paddy production stage to US$462.12 at the assembly stage (or about 283 percent), US$562.27 at the processing stage (or about 22 percent from the previous stage) and US$674.34 at the final delivery point representing an increase of about 20 percent from the previous stage. Rice production is associated with a value added of US$109.54 which represents 91 percent of the shipment value. About 94 percent of the DVA is accounted for by domestic costs and mark-ups. At the final stage of delivery, the value added obtained (US$653.17) represents 97 percent of the shipment value (US$674.34); and 98 percent of the DVA is made up of domestic costs and mark-ups. The final SV (US$674.34) is

21
greater than the import parity price (US$330) implying that Nigerian rice is not competitive at the international market. With regard to the ECF, the transformation of paddy rice into milled rice is associated with an increase in shipment value from US$146.70 at the paddy production stage to US$465.76 at the assembly stage (or about 217 percent), US$564.03 at the processing stage (or an increase of 21 percent from the previous stage) and US$677.76 at the final delivery point representing an increase of about 20 percent from the previous stage. Rice production yields a value added (US$137.98) which represents 94 percent of the shipment value and it is entirely accounted for by domestic costs and mark-ups. At the final stage of delivery, the domestic value added obtained (US$659.80) represents 97 percent of the shipment value (US$677.76); and of this DVA, costs and mark-ups account for 99 percent. The final SV (US$677.76) is greater than the import parity price (US$330) implying that Nigerian rice is not competitive at the international market. As regards LCF, the transformation of paddy rice into milled rice is associated with an increase in shipment value from US$380.63 at the paddy production stage to US$468.95 at the assembly stage (or about 23 percent), US$565.24 at the processing stage (or about 21 percent from the previous stage) and US$678.14 at the final delivery point representing an increase of about 20 percent from the previous stage. Rice production yields a domestic value added (US$326.52) which represents 86 percent of the shipment value. Of this DVA, 82 percent is accounted for by domestic costs and mark-ups. At the final stage of delivery, the domestic value added obtained (US$596.08) represents 88 percent of the shipment value (US$678.14); and of this DVA, costs and mark-ups account for 96 percent. The final SV (US$678.14) is greater than the import parity price (US$330) implying that Nigerian rice is not competitive at the international market. At the FAM level, costs incurred in addition to domestic costs of production constitute a higher proportion of SV than it is the case for ECF and LCF. As it turned out, however, Nigerian rice remains uncompetitive in the international market irrespective of the level of commercialization of its production. Nonetheless, rice production is quite profitable in each of the three categories of farms. The gross margin per hectare for the ECF is the highest followed by LCF and FAM. Moreover, net return per hectare is also positive across the farms. It is the highest in the case of ECF followed by FAM and LCF. Overall, it appears that the emerging commercial farms will likely require the most serious attention in terms of efforts aimed at reducing production cost and enhancing the competitiveness of rice. The results also imply that the intensity of efforts will not only vary across the farms but also in terms of the specific components of shipment value.
Impediments to Growth in the Rice Industry
There are several constraints militating against the competitiveness of rice production in the country. These include (i) lack of pre-planting contracts which expose farmers to unfavourable market dynamics, (ii) inadequate processing facilities and (iii) inadequate financing of key activities in the value chain. Value Chain Indicators and Profitability of Soybean Enterprises
As regards the FAM, the results show that operating profit and net profit are positive at both the production and assembly stages as well as the final delivery stage. At the production stage, the gross margin is US$159.95 while net profit is US$156.54. The rates of return at this stage range from 76 percent on the basis of net profit to 79 percent based on operating profit. In view of the negligible investment cost at the assembly stage the operating profit (US$9.09) is the same as the

22
net profit and the rate of return is only two percent. At the stage of final delivery, both the gross margin and the net profit have the same value (US$107.89) and the rate of return is about 26 percent. As regards the ECF, both operating profit and net profit are also positive at all stages of the chain. At the production stage, the gross margin per tonne is US$183.46 while at the assembly stage it is US$9.09. At the final delivery stage the operating profit is US$103.79. The rates of return (net profit/total cost) range from 2 percent at the assembly stage to 26 percent at the final delivery stage and 81 percent at the farm production stage. In the case of LCF, both operating profit and net profit are positive at all relevant stages of the chain with the exception of the farm production stage. At the assembly stage, the gross margin per tonne is US$9.09 while at the final delivery stage the operating profit (gross margin) per tonne is US$86.43. The rates of return (net profit/total cost) range from 2 percent at the assembly stage to 22 percent at the final delivery stage.
The value chain indicators for the final traded commodity reveal that substantial increase in shipment value occurs between the production stage and final delivery of the commodity. The SV for the FAM sector increased from US$207.10 to US$422.42 representing an increase of about 104 percent. Soybean production yields a value added (US$154.06) which represents 74 percent of the shipment value. About 95 percent of the DVA is accounted for by domestic costs and mark-ups. The result shows that the final SV (US$422.41) is higher than the import parity price (US$259.56) implying that Nigerian soybean is not competitive in the international market. In the case of ECF, the value chain indicators for the final traded commodity also reveal that substantial increase in shipment value occurs between the production of soybean and final delivery of the commodity. The SV increased from US$232.3 to US$426.52 representing an increase of about 84 percent. Soybean production yields a value added (US$255.71) which represents 110 percent of the shipment value which is accounted for entirely by domestic costs and mark-ups. The result shows that the final SV (US$426.52) is higher than the import parity price (US$259.56) implying that Nigerian soybean is not competitive in the international market. With regard to the LCF sector, the value chain indicators for the final traded commodity reveal that substantial change in shipment value occurs between the production of soybean and final delivery of the commodity. The SV decreased from US$3,146.46 to US$435.23 or by about 86 percent. Soybean production yields a value added (US$587.93) which represents 19 percent of the shipment value out of which 17 percent is accounted for by domestic costs and mark-ups. Foreign costs represents 81 percent of the shipment value at the soybean production stage indicating the high degree of foreign dependence by large commercial farms in terms of imported inputs. The result shows that the final SV (US$435.23) is higher than the import parity price (US$259.56) implying that Nigerian soybean is not competitive in the international market. At the LCF level, costs incurred in addition to domestic costs of production constitute a higher proportion of SV than it is the case for FAM and ECF. As it turned out, however, soybean production in Nigeria remains uncompetitive in the international market irrespective of the level of commercialization. The results point to the fact that domestic costs and mark-ups contribute more to the rising shipment values in the soybean chain than foreign costs as far as the FAM and ECF sectors are concerned whereas in the case of LCF the foreign costs contribute more than domestic costs. Improving the profitability and competitiveness of soybean will therefore, require different policy measures across the farm sectors. Whereas the LCF will benefit more from trade and other related policies, the soybean FAM and ECF may derive greater benefits from sector-specific and other domestic interventions.

23
Impediments to Growth in the Soybean Industry
The major constraints to higher soybean production and utilization in the country are (i) ignorance of improved production methods among the farmers, (ii) inadequate supply of modern inputs, (iii) low output price, (iv) inaccessibility of credit facilities to majority of the farmers and (v) poor storage facilities. Value Chain Indicators and Profitability of Sugar-cane Enterprises
The results show that with the exception of processing, operating profit and net profit are positive at every stage of the value chain. At the production stage, the gross margin per tonne is US$7.25 while net profit is US$4.86; whereas at the assembly stage, the gross margin per tonne (US$6.06) is the same as net profit in view of the negligible investment cost at this stage. As expected, the rate of return (16 percent) at the assembly stage is much lower than at the production stage which is 92 percent on the basis of gross margin and 47 percent based on net profit. Trading in white sugar attracts net profit per tonne of US$105.49 with 13 percent rate of return while net profit for brown sugar trade is US$29.73 with three percent rate of return.
The transformation of sugar-cane into sugar (white and brown sugar) results in considerable increase in value along the chain. The transformation of sugar-cane into white sugar is associated with an increase in shipment value from US$13.14 at the sugar-cane production stage to US$803.60 at the stage of trading in white sugar. For brown sugar, the shipment value increases from US$13.14 to US$955.11. Sugar-cane production yields a value added (US$10.25) which represents 78 percent of the shipment value. About 87 percent of the DVA is made up of domestic costs and mark-ups. At the level of trading, value added also represents a high proportion (98 percent) of the shipment value of both white and brown sugar. About 99 percent of the DVA is accounted for by domestic costs and mark-ups. In general the major components of shipment value are domestic costs and mark-ups, official duties and tax, additional (unofficial) expenses and foreign costs. In the case of sugar-cane, at each stage of the value chain the shipment value consists largely of domestic costs and mark-ups whose share ranges from 67 percent at the production stage to 89 percent at the assembly stage and 99 percent at the processing stage. Although foreign costs seem to be negligible at the processing stage, they represent a sizable proportion at the production stage (22 percent) and assembly stage (7 percent). The final SVs for white sugar (US$803.60) and brown sugar (US$955.11) are both higher than the import parity price (US$409.7) implying that Nigerian sugar is unlikely to be competitive at the international market.
Impediments to Growth in the Sugar-cane Industry
Several problems militate against the performance and growth in the sugar industry. In general the problems cut across the production, processing and marketing stages of the value chain. The main constraints include (i) reliance on estate-based industrial cane production system which is bedeviled with myriads of operational deficiencies and has thus hindered regular supply of raw materials to the sugar factories over the years, (ii) low output price, (iii) restricted market for sugar-cane which has tended to discourage increased production by small-scale farmers, (iv) low yield, (v) reliance on imported cultivars for the estate-based production systems, (vi) low level of capacity utilization in existing sugar mills and (vii) inadequate and irregular supply of sugar-cane to the mills.

24
CONCLUSIONS AND POLICY RECOMMENDATIONS
The analysis of competitiveness of the selected commodities shows that with the exception of cotton, none of the other commodities (cassava, maize, rice, soybean and sugar-cane) is competitive at the international market. Moreover, it is found that the commodities remain uncompetitive irrespective of the level of commercialization at the production level. In other words, the commodities are not competitive in the international market notwithstanding whether or not the producer operates as a small family farm (FAM), emerging commercial farm (ECF) or large commercial farm (LCF). However, in the different farm sectors (FAM, ECF and LCF) the production of the crops appears to be profitable although as expected, the degree of profitability varies by crops and from one sector to another. The results of the analysis show that across the sectors, rice is the most profitable crop. It is followed by soybean, maize, cassava and cotton. For maize, rice, and soybean the unit cost of production increases with rising degree of commercial orientation.
These findings imply that measures aimed at reducing cost at the farm product level in order to improve the competitiveness of the commodity should be targeted at domestic costs and mark-ups in general but in the case of ECF and LCF there is need also to address the foreign costs especially for soybean and maize production which involves the importation of different types of machines and chemical inputs. The results also imply that the intensity of efforts will not only vary across the farms but also in terms of the specific components of shipment value. For instance, in the case of soybean, improving the profitability and competitiveness will require different policy measures across the farm sectors. Whereas the LCF will benefit more from trade and other related policies, the soybean FAM and ECF may derive greater benefits from sector-specific and other domestic interventions. In general, the net return is apt to improve if there is a reduction in the cost of capital and increased access to markets that offer more remunerative prices for the farm products.
Recommendations for Improved Agricultural Competitiveness in Nigeria For improved agricultural competitiveness in Nigeria all the identified constraints in this study as earlier itemized should be the focus of attention with a view to providing enduring solutions within the shortest time possible. In addition, however, there are specific policies and strategies for increased profitability and competitiveness of the selected commodities which should also be considered pari pasu. These can be classified into three broad categories namely; (i) crop-specific interventions, (ii) sector-specific strategies and (iii) macro-related and other strategies. The crop-specific interventions vary from yield improvement and contract farming in the case of cassava, use of animal traction and production credit for cotton, irrigation and establishment of rice processing mills for rice, provision of storage facilities in the case of maize, use of farmers’ associations for input distribution in the case of soybean and development of non-estate-based production systems for sugar-cane. The other recommended strategies are as follows. Sector-specific interventions
-Adequate Funding of Research and Extension for Improved Productivity -Improved Agricultural Financing
-Promotion of Contract Farming to Enhance Market Access -Improved Agricultural Market Information

25
Macro-Related and Other Policies
-Monetary Policy (lowering cost of capital) -Fiscal Policy (favourable exchange rate and tax regimes) -Investment in Infrastructure -Fostering Value Added Enterprises Through Public-Private Parnership -Export Incentives Finally, it is important to stress that the findings of this study have not contradicted popular claims concerning competitiveness in Nigeria. In the case of cassava in particular, it has been argued that Nigeria is in a position of great disadvantage compared to other competitors. For instance, the market price of cassava from Thailand was about a third of the production cost in Nigeria; and that even though Nigeria has been producing about 70 percent of the world cassava, domestic demand and high cost of production have made Nigerian cassava uncompetitive in the world market. Besides, the latest report on trade competitiveness of a sample of 30 African countries placed Nigeria among the five least competitive countries together with Democratic Republic of Congo, Mali, Burkina Faso and Sierra Leone. Nigeria is in this group on account of its poor institutional quality and high inflation as well as low governance and infrastructure scores. Although, efforts to create a more favourable trade environment have been intensified over the years, there seems not to have been any significant reduction in production and marketing costs in the country in general and in the agricultural sector in particular. It is therefore, not surprising that many of the crops included in this study continue to be uncompetitive in the international market.

26
CHAPTER ONE
INTRODUCTION
The main objective of the Competitive Commercial Agriculture in Africa (CCAA) study is to explore the feasibility of restoring competitiveness and growth in selected African countries by identifying key commodities or products, production systems, and marketing arrangements that have the potential to underpin a rapid development of competitive commercial agriculture. Competitiveness will be analyzed using primarily value chain analysis. The CCAA study is concerned with (1) qualitative features of the supply chain, including the policy, institutional, and organizational factors that affect costs and shape relationships among the various actors, and (2) quantitative information about the supply chain, in particular financial costs and time requirements. Here the term “competitiveness” is used to mean competitiveness of a commodity in domestic markets, neighboring countries, and global markets. In a globalizing trading system, prices in all of these markets are ultimately linked to the global market, so broadly speaking the study is concerned with competitiveness in an open international market environment. The ultimate aim of the CCAA study is to promote the growth of commercial agriculture in ways that achieve broad–based poverty reduction.
The competitiveness study in Nigeria will inform on the potential for growth of commercial agriculture in the country. The aim of the competitiveness study is to identify commodities or products that are currently competitive or stand good prospects of becoming competitive in domestic, regional, or global markets. In order to ensure comparability across countries, the CCAA is focusing on tropical savannah zones featuring fairly reliable rainfall in which mixed cereals–root crops systems prevail, often associated with livestock. In West and Central Africa, these zones are commonly referred to as Guinea Savannah. The Nigerian case study focuses on six commodities: cassava, cotton, maize, soybeans, rice and sugar.
1.1 Objectives
The specific objectives of the study are threefold. d) To review the broader development situation for Nigeria in general and for agriculture in
particular touching issues such as growth, savings and investment, macro–economic and agricultural policy environment, etc.). Specifically the review involves studies on the investment climate affecting agricultural and agro–industrial development such as policies, state of infrastructure, transport costs, land availability, labor availability, credit availability, institutional environment, and other cross cutting factors.
e) To review existing studies on the competitiveness of the selected commodities in the targeted agro–climatic zone. This involves: (i) identifying and briefly describing the target zone, as well as the most important agricultural production trends within the zone, (ii) identifying and reviewing existing value chain studies that have been conducted in the country for the selected commodities. The scope and coverage of the study, the extent to which the study conforms to the methodological guidelines provided, and the overall quality of the study are examined. (iii) summarizing the qualitative and quantitative conclusions that have been drawn about the actual and potential competitiveness of the commodity for the three farm production systems that are being covered in the study, (iv) identifying weak links in the value chain that are the main obstacles to achieving competitiveness and (v) describing the

27
sorts of improvements that existing studies suggest could be made in the value chain to significantly enhance competitiveness.
f) To analyze selected commodity chains from farm–gate to foreign destination ports using the value chain approach. Both qualitative and quantitative analyses of the value chains are carried out.
1.2 CONCEPTUAL FRAMEWORK
Broadly defined, quantitative value chain analysis is focused on the amount of money a customer is willing to pay for a firm’s output. In an open economy, this price is determined competitively and flows upstream from the consumer to each producer and marketing company involved in the growing, collection, transformation, and delivery of that commodity to its terminal market. Supply chain analysis is a complementary concept applied to a network of companies across a given industry. Whereas value chain analysis looks at the upstream accumulation of value as a determinant of international competitiveness, supply chain analysis is a downstream concept that looks at the flow of goods from the supplier to consumer. Both concepts are concerned with the organization of value adding activities while competing in a particular industry, but the key analytical distinction comes in the flow of value between the supplier and consumer. Value chain and supply chain analysis are also concerned with product differentiation and timeliness of delivery. These factors are major determinants of a commodity’s final market price and total value that can be divided between participants in the production and marketing system. Seasonality is an especially important factor in agriculture since the prices of most farm commodities are cyclical depending on world production and patterns in consumer demand. Quality differences are likewise an important source of competitive advantage as is the ability of a country to supply guaranteed minimum quantities according to a specific time schedule. Interpretation of the quantitative value chain indicators, therefore, requires knowledge of conditions in other countries in order to pick the most relevant price with which to compare local production. Value chain analysis has gained considerable popularity in recent years. Although many approaches are taken, value chains essentially represent enterprises in which different producers and marketing companies work within their respective businesses to pursue one or more end-markets. Value chain participants sometimes cooperate to improve the overall competitiveness of the final product, but may also be completely unaware of the linkages between their operation and other upstream or downstream participants. Value chains therefore encompass all of the factors of production including land, labor, capital, technology, and inputs as well as all economic activities including input supply, production, transformation, handling, transport, marketing, and distribution necessary to create, sell, and deliver a product to a certain destination. The main stages of an agricultural value chain as defined for the quantitative methodology are illustrated in the figure below (see Keyser, 2006). In this diagram, dashed arrows flow from input supply to all other stages to show that this is a crosscutting function that affects all participants, not just at the farm level. A dashed arrow is also drawn from farm production to processing to show that some farmers may deliver their crop directly to a factory, thereby fulfilling the assembly function as well. This can either happen as part of a vertically integrated supply chain managed by a large company or because the scale or proximity of an individual’s production to the factory justifies direct delivery.

28
Figure 1.1: Stages of the Value Chain
Some of the main activities that occur at each stage of the value chain include the following.
� Input supply. This stage is concerned with the sourcing of raw materials required for agriculture production, processing, and trade. Inputs may either be procured locally or imported. The final value of an input at its place of use includes all manufacturing costs, transportation costs, customs duty and tax, and unofficial payments incurred up to that point. The efficiency of a country’s input supply system therefore has a major bearing on the performance of the entire value chain.
� Farm production. This stage is concerned with primary agriculture production and ends
with the sale of a raw commodity at the farm gate. These transactions may occur literally at the farm gate or at some other point where the farmer hands over ownership of the product to the next value chain participant. Depending on the crop, some type of primary processing (such as the shelling or bagging of dry grain) may take place at the farm level.
� Assembly. This stage involves the collection of agricultural produce from many farmers
and delivery of the raw material to a factory for industrial processing or packaging. In the case of livestock operations, assembly is defined in a broader sense to include the feedlot process for delivery of fattened animals to an abattoir. Bagging and simple grading of crops can also occur at this stage depending on arrangements made at the first point of sale.
� Processing. The processing stage involves the transformation of agriculture raw materials into one or more finished internationally traded goods. Raw commodities, of course, are also traded and this stage may not apply to every crop. The spreadsheet templates have been designed to accommodate the production of up to three goods from a single raw material.
� Domestic and international logistics. The logistics stage is concerned with the delivery of traded commodities to their final market destination. This may either be a foreign market in the case of exports, or a local market for import substitutes. For import substitutes, the logistics stage ends at the domestic level, but the analysis is still concerned with the cost of importing a similar product from the nearest or most competitive country.
Assembly Processing Farm
Production Logistics
Input Supply

29
1.3 Methodology
From these essential concepts, quantitative value chain analysis has become a multidimensional task that requires careful attention to a great many details and individual product differences. Towards this end, the quantitative methodology focuses on the measurement of accumulated production costs, private financial returns, and time requirements at each stage of the value chain. These measurements of cost components, private profitability, and time requirements are drawn from standard per hectare or per ton budgets for farm production, crop assembly, industrial processing, and logistics to the final delivery point which may be a domestic location in the case of import substitutes or foreign location in the case of export commodities. In value chain analysis, all inputs and outputs carry forward their inherited value from the previous stage. This point may seem obvious enough, but is important to stress in value chain analysis where the focus is on cost levels at different stages as a key determinant of international competitiveness. The competitiveness of Nigerian soybeans as an import substitute, for example, depends on the efficiency of the input supply system, farm production, assembly, processing, and logistics costs up to the final domestic market. The accumulated value at the delivery point must then be compared with the cost of bringing similar quality soybeans into the country from the best alternative source. By looking at the cost composition at each stage of the value chain and comparing these costs with world standards, value chain analysis not only shows if the country is internationally competitive, but also helps to identify key stages where costs can most effectively be reduced.
1.3.1 Value Chain Indicators
In addition to looking at the build-up of total costs at each stage, quantitative value chain analysis is also interested in the type of costs incurred as a product accumulates its value. This helps to identify areas where new policies or process innovations could have the greatest impact on international competitiveness. Because a country is only able to influence prices within its own borders, the analysis is particularly interested in the composition of domestic costs. These costs include legitimate local business expenses and mark-ups, official customs duties and taxes, and any number of unofficial payments that sometimes have to be made to facilitate a particular operation. A product’s total value at any given stage in the value chain, therefore, is equal to the sum of all domestic prices and imported cost components. For the CCAA study, these costs are measured in terms of Domestic Value Added (DVA) and Shipment Value (SV), which constitute the main value chain indicators as follows.
Domestic Value Added (DVA) = Domestic costs and mark-ups [1] + Official duties and tax + Unofficial charges and extra costs Shipment Value (SV) = Domestic Value Added
+ Foreign components [2] DVA and SV are measured according to equations [1] and [2] respectively on a per tonne basis at each stage of the value chain for the following products.
Farm production Farm gate product
Assembly Assembled raw material

30
Processing Processed raw material
International logistics Traded commodity
The final calculation of SV for each traded commodity is the most comprehensive measure of actual and potential competitiveness. For a given product or commodity produced in a specific country, international competitiveness is determined by comparing the SV at the final destination (sale point) with a benchmark. The benchmark will usually be the cost–insurance–freight (cif) reference price for the product or commodity at the specified destination.
The measurements of DVA and SV may also be compared, both in an absolute and relative sense, with international benchmarks established by successful competitors. This is one of the main features of the CCAA value chain analysis and this study compares the final shipment values with the most relevant import and export parity prices against which Nigeria must compete. In cases where production increases substitute for imports (such as rice, maize, soybean and sugar), import parity prices are used. Import parity prices are determined by first finding the price the country is most likely to pay in order to import the commodity and then by adding transportation costs to obtain the landed price in domestic cif terms. In cases where increased production is to be exported (such as cassava and cotton), export parity prices are used. And this is determined by subtracting international transport costs from the international prices to give the domestic fob equivalent.
1.3.2 Financial Costs and Profitability Indicators
Beyond the analysis of cost structures and price components, the quantitative analysis is extended to the private costs and returns that accrue to value chain participants. Since agricultural production and marketing begin with the decisions private investors make, it is important to have a sense of the underlying costs and profitability of competing enterprises and marketing systems. Thus, the main analytical templates are designed to calculate total variable costs, investment costs, gross profit, and net profit on per hectare and per ton basis. The net profit is particularly important because it serves as a useful indicator for assessing the viability of each enterprise. A farm enterprise is expected to continue operating as long as operating profit (gross revenue minus operating costs) is positive. Thus, as long as operating costs are covered, the enterprise will operate. However, unless all fixed costs are covered, the farm enterprise is not tenable in the long run; the tendency is for the operations to terminate when the economic life of the existing fixed assets expire.
Each Excel workbook in the analytical templates includes a similar table summarizing basic financial indicators for a particular stage in the value chain. These indicators are measured in different terms following the value chain conventions listed below. At the assembly, processing and logistics stages, the cost of commodity purchases is also recorded in the summary table in addition to basic variable cost and total investment cost data. For the purpose of calculating gross margin, commodity purchases are treated as a variable cost.

31
Farm Production Farm gate product Per Ha; per MT
Assembly Assembled raw material Per Ha; per MT
Processing Processed raw material Per MT; share from Product
Logistics Traded commodity Per MT processed raw material; per MT traded commodity
Other financial indicators such as the gross and net rates of return are also calculated from the templates. These measures show the rate of return to an investor’s outlay of cash and the ability of the enterprise to cover its long-run depreciation costs respectively and are especially useful in comparing different enterprises. Enterprises with a high ratio provide a better return than those with a low ratio.
• Gross rate of return = gross profit / total variable costs.
• Net rate of return = net profit / total production costs.
With regard to the farm production stage, the returns to hired labor and personal management are calculated automatically in the Template as follows.
• Return per day hired labour = Gross (or net) return / days total employment.
• Return per day total labour = Gross (or net) return / days total employment and family management.
1.3.3 Data
Data for the analysis came mainly from relevant literature and secondary sources including the Project Coordinating Unit of the Federal Ministry of Agriculture and Water Resources, the Central Bank of Nigeria and the Nigerian Bureau of Statistics. To augment the secondary data, small holders, emerging commercial farmers and large commercial farmers were visited in different production zones in Oyo, Kwara, Niger and Adamawa states to collect relevant data. The author visited the Zimbabwe farmers in Shonga, Kwara state and obtained useful information through the use of questionnaire and interviews. With this personal contact, it was possible to seek further clarifications through telephone conversations even after the visit. Also input suppliers, processors and exporters were visited to obtain necessary information. A number of companies dealing in export of agricultural commodities were visited in Lagos where discussions were held with key representatives who also supplied useful information relating to domestic and international logistics. With the aid of Research Assistants, cassava, rice and sugar processing enterprises were visited in Oyo, Niger and Adamawa states respectively to obtain necessary data.
Unlike the situation with the Zimbabwe farmers who were visited through the cooperation of the Permanent Secretary of the Kwara State Ministry of Agriculture and his officials, the cooperation of the Lagos-based expatriate officials of foreign companies dealing in rice, cotton and other crops was difficult to secure during the data collection exercise. In spite of visits, numerous telephone and Internet contacts and promises by them to supply necessary data,

32
they were so tactical in ensuring that at the end no data was supplied. Another remarkable problem during the exercise was the great difficulty encountered in searching out the locations of export companies whose addresses had been obtained from the Internet. Many of the Lagos addresses could not be traced and in some instances where the addresses exist, the “exporters” could not be traced. Some of them who were contacted through their telephone addresses promised to arrange a meeting for us to discuss but those promises were never fulfilled. However, a few of those genuinely involved in the export of agricultural commodities were identified and were helpful in providing the required information.
1.3.4 Limitations of the Study
Right from inception, this study was not designed as a survey research. It was to be based essentially on existing data on various aspects of the study including data to be obtained from existing value chain studies on the targeted commodities. As it turned out, value chain studies on the commodities were scanty. Indeed, the analytical template designed for the study by the World Bank has never before been applied in Nigeria. The secondary data therefore, had to be augmented by primary data where necessary (as in the case of cotton) and in some cases there was reliance on small samples of farmers (of all categories i.e. FAM, ECF and LCF), assemblers, input suppliers and exporters for data on 2005 activities in respect of each of the stages of the value chain (production, assembly, processing and international logistics). One limitation of the study especially at the production stage is the limited coverage of the value chain participants that volunteered information for the study. Nonetheless, the nature of the analysis is such that the validity of the results depends more on the accuracy of the data especially the input, output and price data than on large number of respondents.
1.4 Structure of the Report
The remaining part of the report is structured as follows. Chapter two undertakes a review of the broad development experience in Nigeria in recent times with emphasis on the agricultural sector. Chapter three deals with the value chain analysis of the CCAA target commodities (cassava, cotton, maize, rice, soybean and sugar-cane) beginning in each case with a review of literature on available value chain studies in the country. The main findings and suggestions for improved agricultural commercialization and competitiveness in the country are presented in chapter four.

33
CHAPTER TWO
REVIEW OF BROAD DEVELOPMENT EXPERIENCE IN NIGERIA
The precarious situation of the Nigerian economy prior to the assumption of office of the democratically elected government in 1999 is widely known and documented (see NEEDS, 2004). The economy has been grossly mismanaged and the country was characterized by instability socially, politically and economically. Thus, growth was retarded and development constrained in spite of huge endowment of human and material resources. On assumption of office the government specified its economic policies, priorities and implementation strategies as contained in the “Nigerian Economic Policy - 1999-2003" and “Obasanjo’s Economic Direction - 1999-2003" to remedy the situation. In principle government is to be lean, efficient, transparent and function mainly as a facilitator. The economy is to be market-oriented, competitive and private-sector led and is to be revived through clearly identified policy instruments (see Nigerian Economic Policy 1999, and Obasanjo’s Economic Direction, 2000). This has been the philosophy of the grand economic reforms which the government has embarked upon since 2000. In 2004, the National Economic Empowerment and Development Strategy (NEEDS) was launched as the basic policy framework to guide the reform agenda of the government and its development efforts. The development experience since 2000 shows that the economy is moving in the right direction judging by the trend of some key indicators both at the macro and sectoral levels. In this chapter, we undertake a review of the broad development situation in the country focusing on agriculture with a view to identifying the most important constraints that will have to be overcome to achieve broad competitiveness in commercial agriculture. 2.1 Macroeconomic Performance
Since the inception of democratic governance in 1999, Nigeria has witnessed determined efforts by the government to achieve rapid economic growth and development and to significantly reduce poverty. Real GDP growth rate made a significant jump from an average of 2.8% in 1997/1998 to 5.4% in 2000. Although it has been difficult to maintain a steady growth thereafter, the GDP growth rate has not fallen to the very low level often recorded before 2000. Indeed, in 2003 the target growth rate of 10% set by the government was met for the first and last time between 2000 and 2005 (see Table 2.1). The 10.2% growth rate in 2003 was the highest in three decades, and was driven mainly by improvements in agriculture which grew by 7% and the oil sector which grew by 23%. Despite the improvement in growth performance, low level of savings and investment is still a major constraint. The highest investment ratio obtained so far is 16.2% while the savings ratio is 15.6%. The highest investment ratio attained since 2000 is far below the minimum investment to GDP ratio of about 30% which is required to unleash a poverty-reducing growth rate of at least 7-8% per year (see NEED, 2004).
Increased private investment requires a stable macroeconomic environment characterized by a low rate of inflation, low rate of interest, stable real exchange rate and well-managed current account and fiscal balances. The inflation rate which came down to a single digit in 2000 (6.9 percent) rose to an all time high of 18.9 percent in 2001. It trended downwards thereafter to a single digit again in 2006 although the rate remains higher than the rate as at 2000 (Table 2.1). The lending rate which also peaked at 31.2 percent in 2001 declined to 18.7 percent in 2006 - a rate still regarded by investors as too high

34
Table 2.1: Selected Macroeconomic Indicators
Indicator 2000 2001 2002 2003 2004 2005 2006
Domestic Output and Prices Real GDP Growth Rate (%) -Oil Sector -Non-Oil Sector -Agric Sector Oil Production (mbd) Manufacturing Capacity Utilisation (%) Gross National Savings (% of GDP) Gross Fixed Capital Formation (% GDP) Inflation Rate (%)
5.40 11.10 2.90 2.90 2.2 36.1 7.3 6.9
4.70 5.20 4.30 3.86 2.2 39.6 5.3 5.3 18.90
4.60 -5.70 8.3 4.22 2.1 54.9 3.5 6.3 12.90
9.6 23.9 5.2 6.64 2.3 56.5 7.2 8.6 14.0
6.6 3.30 7.8 6.50 2.5 55.7 18.4 11.9 15.0
6.5 0.5 8.2 7.1 2.5 54.8 19.4 12.0 17.9
5.6 -4.7 8.9 7.2 2.2 53.3 n.a 12.5 8.2
Federal Govt Finance (% of GDP) Overall Fiscal balance Retained Revenue Total Expenditure Domestic Debt Stock External Debt Stock
-2.1 13.1 15.4 19.8 68.1
-4.3 15.4 19.6 19.6 61.2
-5.5 13.1 18.6 21.3 72.0
-2.8 13.9 16.7 18.1 61.1
-1.5 10.7 12.2 11.7 41.9
-1.1 11.2 12.2 10.2 18.1
-0.6 10.1 10.6 9.7 2.5
Money and Credit (Growth Rate %) Net Domestic Credit Net Credit to Government Credit to Private Sector
-25.3 -170.1 30.9
79.9 95.2 43.5
64.6 63.6 19.7
29.1 58.4 18.4
12.0 -17.9 26.6
14.5 -37.0 30.8
-65.0 -676.2 28,2
External Sector External Reserves (US $ billion) Average Crude Oil Price (US$/barrel)
Average AFEM/DAS Rate (x/$1.0)
9.910 28.6 101.7
10.416 24.5 111.9
7.681 25.0 121.0
7.468 29.2 129.3
16.955 38.5 133.5
28.279 55.4 132.1
42.298 66.4 128.7
Source: Central Bank Annual Report and Statement of Accounts, 2006 for operating profitably. Invariably, manufacturing capacity utilization which stood at 36.1% in 2000 grew somewhat; but followed a declining trend between 2003 and 2006.
Improvement in macroeconomic management has led to substantial reduction in fiscal deficits, less volatility in exchange rate and rising external reserves. Between 2000 and 2003 the problem of fiscal imbalances actually worsened. Fiscal deficit rose from 2.1 percent of GDP to 4.0 percent in 2001 and peaked at 5.5 percent in 2002. Part of the associated problem is the considerable reduction in the growth of credit to the private sector with adverse consequences on investment and output expansion. However, by 2003, the fiscal deficit was less than 3 percent of GDP and by 2006 it was only 0.6 percent. The external reserves increased from about US$9.91 billion in 2000 to about US$42.298 in 2006. These recent macroeconomic trends indicate that the country is right on the path to macroeconomic stability. The implementation of macroeconomic reforms as well as reforms in various sectors of the economy has been going on relentlessly since 2000, but while macroeconomic stability is being achieved, it appears that desirable outcomes in the areas of employment generation, poverty reduction, export expansion and diversification of the economy are yet to be achieved to a significant extent. The transformation of the agricultural sector and investments in infrastructure development will contribute in no small way to the realization of the development objectives in these areas. As expected the government has placed

35
considerable emphasis on the development of agriculture as a major priority sector since 2000. Thus, in what follows we examine the agricultural development policies and strategies and the recent performance of the sector. 2.2 Review of Agricultural Development in Nigeria
The agricultural sector is critical to the development of Nigerian economy. It provides employment for about 60% of the labour force and raw materials for industrial development. Its provision of food for the growing population and income for millions of smallholders is remarkable for the maintenance of peace in the country. Nonetheless, the performance of the sector over the years is far below expectation because development efforts have failed to place it as the foundation for economic growth and development; thus it has not witnessed the desired transformation and the available resource endowment has been grossly underutilized. Its role in terms of foreign exchange and revenue generation that used to be prominent in the 1960s has been relegated to the background while attention is shifted to the development and export of crude oil. Up to the mid-1960s, Nigeria commanded a share in world agricultural exports of more than one percent and had a leading position for several of its export crops. Nigeria supplied more than half of all traded palm kernel, more than a third of all groundnuts, and more than a fifth of all palm oil. As the country shifted towards petroleum exploitation and export agricultural exports declined and by the mid-1980s, Nigeria’s world market share for agricultural products had dwindled to less than 0.1 percent. Today none of the country’s export crops, with the exception of cocoa, commands any significant world market share (Walkenhorst, 2006).
With the increasing need to eradicate poverty and put an end to hunger and malnutrition as enshrined in the MDG targets, Nigeria and indeed many African countries are returning to the agricultural sector for possible solution. In Nigeria, various development approaches have been adopted – the market has been relied upon, the government has been directly involved; yet there remains chronic under-investment in the sector and the efforts have not been able to fully unlock the available potentials. In what follows we review the existing efforts in terms of the development policies and examine the investment climate affecting the development of Nigerian agriculture. 2.2.1 Agricultural Development Policies
Agricultural development policies in Nigeria can be examined in four distinct phases since independence in 1960. The first phase is the first post-independence decade (1960-69) during which the development approach was essential laissez-faire. Agriculture was mainly in the hands of private-sector operators while government involvement was limited to the development of institutions basically for research and product marketing. The second phase is the period of intensive state control of agricultural activities (1970-85) while the third phase is the period of Structural Adjustment Programme (SAP) and guided deregulation (1986-93; 1994-99). The fourth phase is the new era of reform under a democratic government (2000-2006) in which the economy is conceived to be market-oriented and private-sector led. The phases are examined based on three broad policy categories namely; factor policies, commodity policies and macro-related policies. The key policies are highlighted in Table 2.2.

36
Table 2.2: Phases of Agricultural Development Policies in Nigeria: 1960-2006
FACTOR POLICY COMMODITY POLICY MACRO-RELATED POLICY
Phase I
Minimal State Intervention (1960-69)
-approach generally laissez-faire
-export crop marketing and pricing through activities of the marketing boards.
-agriculture conceived as a residual sector from which surplus labour could be withdrawn for the development of a “modern capitalist sector”
Phase II
Widespread State Control (1970-85)
-Centralization of fertilizer procurement and distribution at the Federal level in 1975 -Establishment of a Federal Superphosphate Fertilizer plant -Farm Subsidy covering inputs such as fertilizers, seeds, herbicides, pesticides and farm machinery as well as services such as land clearing, tractor hiring, irrigation etc. -Creation of a National Seed Service in 1972 -Promulgation of the Land Use Decree in 1978
-creation of Commodity Boards in 1977 for cocoa, groundnut, palm produce, cotton, rubber and food grains to replace the marketing board operating since 1954. -Launching of National Accelerated Food Production Project in 1973 -Introduction of Guaranteed Minimum Prices (GMP) -export of agricultural produce by CBs -fixing of product prices -strategic grain reserve
-Imposition of export tax -direct importation and sale of imported food commodities such as rice, wheat flour, vegetable oils, livestock products etc) -overvalued exchange rate -Credit control -Concessional interest rate -Establishment of NACB in 1972, ACGS and Rural Banking Scheme in 1977
Phase III
Period of SAP and Guided Deregulation (1986-93) (1994-99)
-Subsidy withdrawal -product price decontrol -abolition of CBs -liberalization of agricultural trade
-abolition of export tax -exchange rate deregulation -expenditure reduction -abolition of import licensing -rationalization of tariff structure -relaxation of import restrictions but when necessary, ban on food importation (e.g. rice, maize, wheat, barley and vegetable oils) was imposed -deregulation of credit market -interest rate decontrol -promotion of export financing through the introduction of Rediscounting and Refinancing Facility by the CBN -commercialization and privatization of agro-parastatals -provision in 1987 of a five-year tax-free period for profits earned by companies engaged in agricultural production and agro-processing.
Phase IV
Widespread Economic Reforms (2000-2006)
-Government disengaged from fertilizer procurement and distribution --privatization of National Fertilizer Company of Nigeria (NAFCON)
-privatization of sugar companies -creation of agricultural production companies for initial operation and subsequent handover to private sector
-Merging of NACB, People’s Bank, FEAP to form the NACRDB -Tax Reform -Trade policy reform -Modernization of Customs and port management -Adoption of ECOWAS common external tariff (CET) in October 2005
Source: Author’s compilation

37
2.2.2 Agricultural Land Use and Availability
Land is the most important input for agricultural enterprises but it is generally not believed to be abundant relative to other inputs. It is estimated that only 40% of about 71 million hectares of cultivable land is under use at any point in time. About 10% usually remains under fallow (Olukosi et al, 1991). In the traditional farming system, size of land is generally small and fields are highly fragmented, partly as a result of inheritance laws and also due to practices of shifting cultivation and bush fallow. The distribution is however highly skewed. While the majority of farmers cultivate less than 2 hectares, a few (less than 10 percent) have land holdings of between 2 and 10 hectares. An even more limited proportion, less than 5 percent have land holdings of 10 hectares and above.
As expected the land use patterns vary across the agro-ecological zones. In the northern guinea savanna, Manyong et al (1996) observed in a cereal-based farming system, average farm sizes of 3.1 hectares with about 25 percent of farmers having less than one hectare. Only 2 percent had larger than 10 hectares in the derived savanna zone. In the yam-based farming system of south eastern Nigeria, an average of 3.7 hectares per household was also noted out of which 55 percent was planted to yam, 10 percent to cassava and 35 percent to other arable crops. In the forest re-growth ecology, 2.9 hectares per household was recorded for yam cultivation. In the rice-based farming system, swamp land is relatively limiting. Thus farmlands range from 1 to 3 hectares maximum with an average of 1.46 hectares to swamp rice and average of 1.5 hectares to upland rice. In some agro-ecological zones, there is an increasing population pressure on land resulting in declining quality. And in view of the gross under-investment by the small-scale farmers, land improvement is at a rather low level. This has grave consequences for agricultural productivity and competitiveness in the country. 2.2.3 Agricultural Labour Availability
The availability of labour affects the use of farm land in the traditional farming system. Although family members contribute the bulk of labour input, where hired labour is used, cost of labour often exceeds 70% of total cost of production (Ogungbugbe, 1997). In general, wages depend on age, gender and nature of task and the cost structure varies by crop and production system. For instance in the case of irrigated and non-irrigated rice production systems in Enugu state it was found that 55.07 percent of total production cost was spent on labour in non-irrigated system, while a lower proportion (50.5 percent) was spent in the irrigated system (Dankoli and Dugje, 1994, Dugje, 1995). Since agriculture in Nigeria is virtually unmechanised, human labour becomes vital in all production systems, accounting for almost 90 percent of all farm operations. Under semi-mechanised systems, including animal traction use, human labour use is still as high as 70 percent of all operations (NISER, 2001).

38
38
In terms of labour use, pattern an average household was observed to expend 708 man-days of labour in the guinea savanna region. In the derived savanna zone, man-day utilization was higher - 924 man days - out of which yam cultivation operations took up the major share of 65 percent. In the forest re-growth zone, 429 man-days were noted and 70 percent was used for yam, 20 percent for cassava and 10 percent for other crops (Nweke et al, 1991). Labour use for swamp rice production was only 103 man-days per hectare while 123 man-days were utilised for upland rice. For this farming system, preference is for hired labour (56 percent of total labour) (Ekwe, 1990).
In the northern semi-arid ecology, the estimated labour use pattern shows that the proportion of family labour ranges from 30 to 90 percent, proportion of hired labour ranges from 10 to 50% while the proportion of communal labour ranges from 5 to 10 percent of the labour force (IAR, 1998). Although labour is not generally a constraint in the region, there are two peak labour demand periods which correspond to the planting and harvesting time. It is only during these peak periods that hired or communal labour is used. Other forms of labour are traditional work groups who are used less frequently than other categories. All categories of household members - men, women, children are involved in the supply of communal labour. Although farming is largely labour-intensive, farmers generally often experience seasonal labour shortages. The supply of labour is affected by unending migration of able-bodied youths from the rural to urban areas creating labour shortages especially at peak periods when labour is required for land preparation, weeding and harvesting. 2.2.4 Agricultural Credit Availability
The government has put in place a plethora of institutional arrangements to enhance the availability of formal credit for agricultural production in the country. The Nigerian Agricultural Cooperative Bank was established in 1972 and commenced full operations in 1973 as a specialized credit institution for agricultural development. At inception, the Bank’s authorized share capital was N1.0 million but this was increased to N1.0 billion in 1993. Another agricultural finance innovation - the Agricultural Credit Guarantee Scheme Fund was launched in 1977 to reduce the risk borne by commercial banks in extending credit to farmers. Under the scheme, the Central Bank of Nigeria guaranteed up to 75% of the value of the principal and interest on loans granted to farmers by participating commercial banks up to a maximum of N100,000 for individual loans and N1.0 million for loans to co-operatives and corporate bodies. Between 1978 when the scheme commenced operation and 1998, the Scheme guaranteed loans totaling N1.97 billion for the implementation of about 267,144 projects. The rate of repayment achieved during the period was 55.6 percent (CBN, 1999).
Also in 1977 the rural banking scheme was launched and commercial banks were required to open specified numbers of rural branches in different parts of the country. At least 40% of the total deposit in these rural banks should be lent to borrowers within those rural areas. Between 1980 and 1991, a total of 765 branches were opened and the bank to person ratio was reduced from 1:178,191 to 1:54,640 (CBN, 1999). These schemes have been reorganized in various ways over the years. However, the ACGS continues to operate while the NACB was merged in 2000 with the People’s Bank which was established in 1989 and the Family Economic Advancement Programme which was also given out loans for farming and other activities, to form what is now known as Nigerian Agricultural Cooperative and Rural Development Bank (NACRDB). Following the 60% (US$18million) debt relief granted Nigeria by the Paris Club of creditors in 2005, the Federal Government earmarked a sum of N50 billion for disbursement by

39
39
NACRDB to various categories of farmers in the country. Available data show that between 1990 and 1998, the loans disbursed under the ACGS vary in all the six geo-political zones in the country according to the type of crops produced. The distribution more or less reflects the zones where the production of a particular type of crops is predominant (Table 2.3). The highest proportion of the loans was for the production of cereals (maize, rice, sorghum, millet) in the Northwest, Northeast and Northcentral zones. This is followed by legumes (groundnut, cowpea and soybean) also produced mainly in these zones and roots and tubers (cassava and yam) produced mainly in the Southwest, Southeast and Southsouth zones.
Table: 2.3
Average Credit Disbursed By Trading Banks Under the ACGS, By Zone (�’million)
Cereals Legumes Roots/Tubers Zone
1990-93 1994-98 1990-93 1994-98 1990-93 1994-98
Northwest 14.70 37.61 3.03 12.77 0.58 1.62
Northeast 18.49 27.14 4.41 11.32 0.66 4.89
Northcentral 5.75 21.13 1.22 2.65 2.19 4.62
Southwest 1.27 4.52 0.18 0.29 1.98 7.06
Southeast 1.30 2.66 0.002 0.450 3.13 4.78
Southsouth 1.52 2.40 0.29 0.33 4.40 3.88
Source: Adapted from NISER, 2001 with underlying data from CBN Annual Report and Statement of Accounts (various issues)
Several problems have militated against effective performance of the institutions over the years. As regards the NACB the main problems included inadequacy of loanable funds, high administrative cost and low rate of loan recovery (Tahir, 1999). The major constraints militating against improved performance of the ACGS include (i) weak capacity of personnel in agricultural financing and administration in most of the commercial banks, (ii) high rate of default (especially in the first ten years of the scheme) due to poor project appraisal by banks, poor project management by farmers and inadequate monitoring of guaranteed projects by the lending banks and willful default by farmers, (iii) failure of the banks to file their claims in accordance with the procedures and provisions stipulated by the ACGSF guidelines leading to delays in the settlement of claims (iv) delays by lending banks in processing, approving and disbursing loans to farmers due to over-concentration of decision making at the banks’ head offices, (v) inadequacy of the limit of loans guaranteed, which was insufficient under an inflationary economy and (vi) declining level of participation in the scheme by lending banks in response to the financial sector deregulation of 1986 and the abolition of mandatory sectoral credit allocation requirement of 1996.
Without prejudice to government commitment to deregulation of the financial sector, banks have been enjoined to recognize differences in the gestation periods within each category of agricultural projects and observe grace periods on agricultural loans as an incentive to make credit available for the development of agriculture in the country. The moratorium covers projects in the crop, livestock, fisheries and forestry sub-sectors (Table 2.4)

40
40
Table 2.4: Moratorium for Agricultural Loans
Agric Sub-Sector Type of Moratorium
Crop � 12-18 months for seasonal staple and cash crops e.g. cassava, cotton and groundnut and loans for the construction of on-farm storage structures requiring small capital outlay and short period of construction.
� 5-7 years for tree crops including palm oil, cocoa, citrus, kolanut and other tree and fruit plants.
� A minimum period of 7 years for rubber plantation
Livestock � 6 months for broilers � 24 months for layers � 24 months for swine breeding � 24-30 months for sheep and goat breeding � 6 months for sheep, goat and cattle fattening � 12 months for rabbitry � 7 years for cattle ranching/dairy production
Fisheries 12-18 months for aquaculture
Forestry & Wild Life
� 8-10 years for short, long fibre pulpwood production and sawn timber production
� 8 years for fuelwood/firewood production � 1-2 years for wild honey production � 1-2 years for wild life domestication
2.2.5 Institutional Environment
Nigeria has a large network of research institutes to develop technological innovations in agriculture. Altogether there are 17 of such institutes covering all sub-sectors (crops, livestock, fisheries, forestry) and major crops such as cereals, legumes, roots/tubers, cocoa, rubber, oil palm etc. The National Agricultural Extension Research and Liaison Services (NAERLS) ensures that there is proper linkage between research and extension activities in order to make the benefits of research findings available to the farmers. Each state of the federation also has an Agricultural Development Project (ADP) that provides direct extension services to the farmers. An important institutional arrangement which is crucial for improving the investment climate in agriculture is the Nigerian Agricultural Insurance Corporation (NAIC) which was established in 1987 to provide insurance cover for farmers against natural disasters and other risks associated with agricultural activities. The existence of NAIC has encouraged commercial banks to be more liberal in granting credit to farmers. The CBN stipulates guidelines to assist NAIC’s operations one of which is the mandatory insurance cover for agricultural loans granted by banks under the ACGS. Indeed, the decree establishing NAIC provides that insurance cover is compulsory for farmers who benefit from any agro-allied credit by approved lending institutions or agencies. In general, a farmer who is not a beneficiary is eligible for NAIC’s cover. Undoubtedly, Nigeria has developed a very high capacity in the area of policy formulation. It has not been possible, however, to ensure that the policies operate effectively. Effectiveness has been constrained by political instability, policy inconsistencies, narrow base of

41
41
policy formulation, top-down approach to policy formulation and weak institutional framework for policy coordination (Manyong et al, 2005). 2.2.6 Agricultural Performance
From the foregoing review of agricultural policies in Nigeria there is no doubt that over the years the sector has witnessed massive intervention by the government through numerous policy measures. The relevance of the policies at different times is incontrovertible. There are persistent problems however, with the management of treasury resources flowing into the sector, the level of commitment to project implementation and the extent to which the peculiarities of the sector are taken into consideration in the allocation of resources from time to time. Until recently, there seems to be no consistent pattern of improvement irrespective of whether activities in the sector are controlled by the government or market. Since independence in 1960, the pattern of agricultural growth has been at variance with the strong policy pronouncements and intentions towards agricultural development and the crucial role the sector is expected to play. National account figures indicate that the growth of agricultural GDP was very low (1.7%) between 1960 and 1966 and actually became negative (-1.0%) between 1970 and 1975. During these sub-periods which witnessed the reliance on the laissez-faire philosophy (1960-66) and massive government intervention (1970-75) in the development of agriculture, total GDP grew by 4.7 and 8.4 percent respectively but the performance of agriculture was still sub-optimal. The crop sub-sector experienced the worst performance, growing by 1.3 and –3.6 percent during the two sub-periods respectively. At the same time the livestock GDP grew by 2.5 and 3.1 percent while fishery GDP grew by 10.6 and 10.3 percent respectively (Olomola, 1995). The lack of consistent pattern of agricultural transformation and sub-optimal development is evidenced by the unsystematic fluctuations in the sector’s contribution to total GDP. Agriculture’s contribution to GDP declined from an average of 60 percent annually in the 1960s to about 31 percent in 1971-75 and 22.4 percent in 1976-80. Its contribution rose to 25 percent in 1981-85 and to about 38 percent in 1986-90 before declining again to 30 percent in 1991-92 (Olomola, 1995). Here again, unstable performance of the sector has taken place at different policy regimes – an era of widespread state control (1971-85) and the era of SAP during which the roll back of the state and reliance on market mechanisms appeared to be the order of the day. Since 2000 when reforms took the centre stage and agriculture was prioritized as the engine of economic growth, the contribution of the sector to GDP has risen considerably to an average of 41.5 percent between 2001 and 2005. Within the agricultural sector, notable shifts have occurred in the performance of specific crops over the years. Since the early 1960s, the production of cassava more than quadrupled while the output of yam increased nearly six fold. During the first decade after independence, there was expansion in the production of cassava, cocoa, maize, rice and yam while the production of groundnut, oil palm and sorghum trended downwards. Thereafter, and in spite of massive government intervention, cocoa, yam, groundnut and oil palm production followed a downward trend up to 1985. In general, the food staples performed much better than the traditional export crops. Right from the inception of SAP in 1986 up to 2005 the production of both export and food crops with the exception of maize, followed an upward trend. Between 1961 and 1985, food per capita ratio declined markedly since growth in production failed to match the rapidly growing population. However, from 1986 to 2000 crop output and food availability outpaced the growth of the population and since the early 1990s food per capita ratio has surpassed the level that prevailed during the first decade of independence (Table 2.5).

42
42
Table 2.5: Index of Production of Selected Crops: 1961-2005
1961-65 1966-70 1971-75 1976-80 1981-85 1986-90 1991-95 1996-00 2001-05
CROPS Cassava Cocoa Groundnuts Maize Millet Oil Palm Rice Sorghum Yams
32 24 64 64 27 43 80 6 54 17
37 28 72 59 28 43 68 10 47 34
37 30 68 41 22 56 63 14 44 30
33 36 49 19 17 41 66 18 39 22
35 35 47 19 27 49 63 39 53 19
50 49 62 33 118 72 74 67 65 32
79 92 82 48 155 77 86 90 79 80
96 101 93 91 125 97 96 98 96 95
102 109 105 97 115 100 105 99 101 101
LIVESTOCK 28 34 41 57 76 77 82 95 106
FOOD per capita
89 94 82 66 63 74 96 101 96
Source: Walkenhorst, 2006 based on FAOSTAT database and World Bank, World Development Indicators database.
Table 2.6: Share of Agriculture in Total Imports and Non-Oil Exports
Imports Exports Year
Total N’billion
Food & Live Animals N’billion
Share of Food & Live Animals (%)
Total Non-Oil N’billion
Agricultural Produce N’billion
Share of Agricultural Produce (%)
2000 985.02 113.63 11.54 24.82
2001 1,358.18 158.66 11.68 28.01
2002 1,512.70 144.30 9.54 95.05
2003 2,080.24 201.65 9.69 95.09
2004 1,987.05 178.75 8.99 113.74 37,532.60 33.0
2005 2,479.32 171.82 6.93 105.96 44,395.49 41.9
2006 2,528.09 174.23 6.89 133.59 50,498.86 37.8
Source: CBN Annual Report & Statement of Accounts, 2004 - 2006 Moreover, growth in agricultural GDP has become more appreciable since 2001. As shown earlier in Table 2.1 the growth rate which was 2.90 percent in 2000, increased steadily to 7.2 percent in 2006. Another notable trend in agricultural performance relates to external trade. As shown in Table 2.6, the food import bill has been declining since 2003 on account of expansion in domestic production and pragmatic tariff policies. And from 2001 to 2005, the share of food and live animals in total import has followed a declining trend. As regards agricultural exports, available data shows an increase between 2004 and 2006 during which period the share of agricultural exports in non-oil exports peaked at 41.9 percent.

43
43
2.3 Constraints to Competitiveness of Commercial Agriculture in Nigeria
The constraints to the competitiveness of commercial agriculture in Nigeria can be classified into two broad categories – domestic constraints and external constraints.
(a) Domestic Constraints
Inadequate and Under-developed Infrastructure Agricultural performance in Nigeria is greatly impaired by the low level of development of infrastructure. In the rural areas where majority of the smallholders operate, inadequate infrastructure constitutes a major constraint to agricultural investment, production and trade. In many parts of the country, physical and marketing infrastructure are poorly developed, storage and processing facilities are rudimentary and access to markets is highly restricted. The rural areas in particular where agricultural activities predominate, continue to lag significantly behind the urban areas in infrastructure investments, including paved roads, telephone lines and electricity production. The situation is a reflection of the urban bias in the pattern of development in the country.
Inadequate Market Information There is asymmetric information in both the product and input markets. Thus, the prices agricultural inputs and commodities are not accurately and timely transmitted to buyers and sellers in different parts of the country. This has been a disincentive to intending farmers and a source of frustration to many smallholders in remote parts of the country. Inadequate access to credit facilities Many farmers have no access to formal credit. This situation has worsened the problem of under-investment in the agricultural sector. With the scarcity and rising cost of farm inputs, it is difficult for many farmers to engage in commercial agriculture especially in view of their low level of income and savings. And with limited access to modern means of production the problems of low productivity and low quality of output continue unabated. Poor Business Environment Relative to Other Developing Countries As demonstrated by a recently concluded value and supply chain study, the performance of Nigeria when compared to some developing countries is rather low in terms of some key variables affecting competitiveness in the agricultural sector (Yee and Paludetto, 2005). The variables include (i) cost of credit, (ii) level of electricity service, (iii) cost of delivery of public utilities, (iv) cost of labour, (v) rigidity and skill of the labour market, (vi) extent to which the logistics system is cumbersome, and (ii) burden of regulatory compliance. When compared to strategic competitors such as Bangladesh, China, India, Indonesia, and Kenya, Nigeria fares poorly with regard to finance costs. The 19 percent annual interest rate in Nigeria is four percentage points higher than in its most costly neighbor, Kenya, and more than three times as much as in China.
According to the study, infrastructure cost is particularly critical with regard to power, water, and steam generation. A firm in Nigeria will pay a total of 45.2 cents for one unit of each input. Firms in Kenya face similar costs because of high water cost outlays, but Nigerian firms

44
44
do not come close to comparators in Asia, such as India, a modest comparator in which the equivalent is almost half the price (24.2 cents) for all three units. The cost in Nigeria reflects the high cost of power and steam generation: Power costs at least twice as much as in Nigeria than it does for its nearest comparator, and steam costs almost five times as much. The study also found that labor costs are especially high in Nigeria. Apart from South Africa, where costs rise to 222 cents per hour, Nigeria has the highest costs of all its comparators at 92 cents per hour, almost 30 cents more than its closest competitors: Kenya at 66 cents and China at 57 cents.
Moreover, inefficient and costly logistics services weaken the supply chain of time-sensitive production, particularly of the cassava root for downstream processing, which is subject to a four-day window after harvesting before it spoils. The situation is worsened by late delivery of supplies occasioned cumbersome port procedures. For example, it was found that import customs formalities alone require up to 13 different documents for compliance. Whereas the procedures for registering a business appear to be efficient, licensing requirements and customs regulations continue to be a major source of business concern. On the average, it takes 17.8 days to claim imports from customs (more than twice the duration in China) and 14 days to clear exports (in contrast to 7.7 in China and 4.7 in Kenya). (b) External Constraints
Agricultural Subsidies in Developed Countries The agricultural subsidies provided to farmers in developed countries constitute an impediment for African farmers’ exports because consumers tend to favour the artificially cheaper products from developed countries. Subsidized imported products also often displace the locally produced products in African countries. While the Uruguay Round Agreement did encourage countries to shift from trade-distorting subsidies to non trade-distorting subsidies, more than 60% of the support provided to farmers in wealthy countries still distorts trade. The US spent $1.3 billion on income support for rice farmers in 1999–2000 when its total rice production was worth $1.2 billion. Japan’s subsidies to its farmers, on the other hand, are greater than the entire contribution made by agriculture to the nation’s economy. The total transfers to agriculture amounted to 1.4% of GDP in 2000, compared to the sector’s 1.1% share of GDP (Sharma, 2003). Despite the decoupling of subsidies by the rich countries and the reform of the common agricultural policy undertaken in the EU since 2003, the existing subsidies still cause considerable distortions in the global market and constitute barriers to developing countries’ exports. The EU spends about 40% of its budget (some $60 billion) in subsidies for farmers (Godoy, 2005).
Agricultural export subsidies are particularly debilitating for developing countries because they artificially lower world market prices for their exports. In the short term, low-income countries benefit from lower food import prices. But in the longer-term, farmers in low-income countries cannot compete against subsidized imports and are forced out of business. Developing countries cannot afford to subsidize their farmers, and their farmers cannot compete against highly subsidized farmers in developed countries. Effects of subsidization seem to be particularly severe in Africa. Indeed, studies have shown that EU agricultural policies have reduced African exports of milk products by more than 90 percent, livestock by nearly 70 percent, meat by about 60 percent, non-grain crops by 50 percent and grains by more than 40 percent (see Hassett and Shapiro, 2003). The rich countries of the Organization for Economic Cooperation and Development (OECD) spend close to US$1 billion a day on agricultural subsidies, or about US$300 billion a year. These substantial subsidies artificially boost

45
45
production and depress world prices. Cotton subsidies, for example, depress world prices by more than 20 percent, thus lowering the income of African farmers. Simulations suggest that overall OECD farm subsidies cost farmers in Sub-Saharan Africa US$1.8–1.9 billion per year in lost agricultural income (Chigunta et al, 2004). Unfavourable International Agricultural Commodity Prices Low international agricultural prices constitute a major constraint to the survival of African farmers. The low prices are only advantageous to the minority of farmers who can continue to invest, progress and gain market share. They are insufficient and disadvantageous for the majority of farmers especially the less equipped, land-deprived and poorly situated half of the small farming sector. Apart from the low level of prices a more serious problem is the volatility of the commodity prices which has been a major constraint to increased investment in agriculture. The main causes of the unfavourable and volatile price trend include imbalances between supply and demand, slow consumption growth, over-protection by developed countries and political instability (Olomola, 2006). Indeed, current agricultural commodity prices have increased less rapidly than prices of other products and real agricultural prices have fallen sharply. As illustrated in Fig.2.1, the real export prices of major agricultural commodities in Africa have followed a declining trend over the years; continuing into a few years early in the new millennium. Although some commodities (coffee, cotton, tea, sugar and shrimp) started to witness a rebound since 2002, producers still face enormous challenges. A major challenge is how to ensure that the proportion of the final commodity price accruing to the farmers increase with rising commodity price inflation.
Fig. 2.1: Real Export Prices of Selected Agricultural
Commodities, 1993-2003
0
20
40
60
80
100
120
140
160
1993 1994 1995 1996 1997 1998 1999 2000 2001 2002 2003
Year
Ind
ex (
1995 =
100) cocoa
cotton
coffee
tea
sugar
fish
shrimp

46
46
Imposition of High Tariffs By Developed Countries The high tariffs imposed by developed countries on agricultural products from developing nations reduce the ability of the latter to export their products and compete in the world market. Indeed, tariff escalation - application of higher tariffs on more highly processed products – has been a major tool of exclusion in the hands of developed countries. Developing countries often face low tariffs for raw materials but higher tariffs for processed foods, thereby limiting their ability to move up the value chain. For example, imports of live animals into North America face an average tariff of 21 percent, whereas imports of fresh and frozen meat face average tariffs of 65%; and fresh fruit imports into the European Union face an average tariff of 21 percent, but fruit juice faces an average import tariff of 37 percent (ERS, 2001). Latin American exporters to the EU face tariffs that are five times higher for tomato sauces than those levied on fresh tomatoes. Such practices discourage investments in local processing and deny producers in developing countries opportunities to enter higher-value-added markets where new jobs could be created. Moreover, tariffs on some agricultural products, especially those of interest to developing countries, have been extremely high. As at 2001, tariffs on dairy products were as high as 325 percent; on chocolate, 275 percent; on oilseeds, 170 percent; on sugar, 350 percent (Pinstrup-Andersen, 2001). Intending beef exporters to Europe face tariffs of up to 150 percent while fruit and nut exporters to the US face tariffs of 200 percent or more (Watkins and von Braun, 2003). Besides, tariffs on agricultural goods in the EU and US are four to five times those applied to manufactured goods and peaks in excess of 100 percent for groundnuts in the US and dairy produce in Europe, for example, are common. Invariably, many developing country agricultural exporters have been restricted to the least dynamic part of the global economy and they are systematically excluded from a larger stake in higher-value-added trade. Paradoxically, these tariffs harm poor people in developed countries, raise food prices for consumers and provide little protection to farmers. Tariffs and quotas are also very inefficient ways to protect farm income: the OECD estimates that farmers receive less than 25 cents of every dollar of border protection. Thus, working against de-subsidization and tariff reduction or delaying the process is tantamount to cutting the finger to spite the nose. Export Dumping
Export dumping is a persistent trade distorting practice which has contributed to the low performance of African agriculture over the years. Despite WTO efforts and agreement to end market-distorting practices in agriculture, agricultural export dumping has been on the increase since the inception of the organization about a decade ago. Available data from USDA and OECD indicate that US agricultural commodities continue to be sold well below the cost of production. The proportion by which the average prices of the commodities fell below the cost of production in 2003 stood at 28 percent in the case of wheat, 10 percent for soybeans, 10 percent for corn, 47 percent for cotton and 26 percent for rice (see The NewFarm, 2005). The US farm policies have more or less institutionalized agricultural dumping over the years. As shown in Table 2.7, each of the commodities witnessed considerable increase in the dumping levels between the sub-periods 1990-1996 and 1997-2003.

47
47
Table 2.7: Trend in US Agricultural Export Dumping Levels, 1990-2003
Export Dumping Levels Commodity
1990-1996 (% per year) 1997-2003 (% per year)
Wheat 27 37
Soybean 2 11.8
Corn 6.8 19.2
Cotton 29.4 48.4
Rice 13.5 19.2
Source: Adapted from The NewFarm, March 2005. Despite the free trade era being championed by the World Trade Organisation, industrialized countries have protected themselves against the most dynamic exports of developing countries, including textiles and clothing, agriculture, and processed raw materials. Huge surpluses of products like sugar, dairy and beef accumulated under high tariff walls in industrialized countries, are often disposed of by resorting to subsidized exports, to the detriment of African producers in particular, as they displace their products in third country (export) markets and in the domestic markets of African countries themselves. (ECA, 2000).
Market Concentration
The international market for some agricultural commodities have become much more concentrated. Large trading companies dealing in many commodities have replaced smaller and specialized companies while the total share of all trading companies has fallen relative to direct purchases by processors or final sellers. A highly concentrated commodity market has a strong influence on prices and will not allow free expression of the forces of demand and supply. The concentration of the markets for certain commodities imply that fewer larger companies can dictate the prices they are willing to pay to producers. Producers in Sub-Saharan African countries are mainly smallholders who are largely unorganized and in no way capable of negotiating commodity prices. The situation is worsened by the abolition of commodity boards in many African countries. The boards should have been a useful intermediary that could improve farmers’ bargaining power with large corporate buyers. Some of the services formerly provided by the boards (financing, stockholding) are now provided by foreign companies, thus decreasing the share of commodity income remaining in the producing country (see Olomola, 2007).

48
48
CHAPTER THREE
THE VALUE CHAIN ANALYSIS FOR SELECTED COMMODITIES
This chapter presents the analysis of the selected commodity chains from farm gate to foreign destination port using the value chain approach and following the algorithm laid out in the Excel Templates specifically designed for this study. In addition to the quantitative aspects of the analysis, priority is also accorded to the qualitative aspects of the chain covering key areas such as world market structure, the Nigerian market structure and a description of the value chain for each commodity from the production stage up till final consumption. The distribution of the selected commodities according to the location of production, processing and consumption is shown in Table 3.1.
Table 3.1: Farm Sectors and Locations for the Value Chain Analysis
Commodity Produc-tion Location
Admini-strative Unit
Ecological Zone
Processing Location
Con-sumption Location
Cassava – FAM Obananko Oyo state Southwest Oyo China
Cassava – ECF Onikoko Oyo State Southwest Ibadan China
Cassava – LCF Ilora Oyo State Southwest Ibadan China
Cotton Funtua Katsina State Northwest Funtua Europe
Maize – FAM Awe Oyo state Southwest Ibadan Ibadan
Maize – ECF Erelu Oyo state Southwest Lagos Lagos
Maize – LCF Onikoko Oyo state Southwest Lagos Lagos
Rice – FAM Sachi Niger State Northcentral Bida Ilorin
Rice – ECF Nna Amuna
Niger State Northcentral Bida Ibadan
Rice – LCF Yezhiba Niger State Northcentral Bida Lagos
Soybean-FAM Lagunna – Oyo
Oyo state Southwest Ibadan Ibadan
Soybean – ECF Erelu – Oyo
Oyo state Southwest Ibadan Ibadan
Soybean – LCF Shonga Kwara State Northcentral Lagos Lagos
Sugarcane – FAM Bacita Kwara State Northcentral Bacita Lagos
Sugarcane – LCF Eminpa Kwara State Northcentral Numan Lagos
Note: FAM = Family Farm, ECF = Emergent Commercial Farm; LCF = Large Commercial Farm

49
49
The targeted commodities - cassava, cotton, maize, rice, soybean and sugarcane are produced in specific agro-ecological regions which also reflect the zonal classification of all the 36 states in the country as illustrated in Table 3.2. Cassava, rice and maize are produced in virtually all the six regions while cotton is common in the northwest and northeast agro-ecological regions. Sugarcane is produced mainly in the northeast and north-central regions while soybean is produced in all the regions with the exception of south-south. In general, the main crops produced in each region, land availability and other features are shown in Table 3.2.
Table 3.2: Basic Features of the Agro-Ecological Regions of the Selected Commodities
ZONAL XTICS
NORTH-WEST
NORTH-EAST
NORTH-CENTRAL
SOUTH-WEST SOUTH-EAST SOUTH-SOUTH
Component States
Katsina, Kaduna, Sokoto, Kano, Kebbi, Jigawa, Zafara
Adamawa, Bauchi, Borno, Gombe, Taraba, Yobe
Benue Kogi Kwara Niger Nasarawa Plateau
Ekiti, Lagos Ondo Ogun Osun Oyo
Abia, Anambra, Ebonyi, Enugu, Imo
Akwa Ibom, Bayelsa, Cross River, Delta Edo Rivers
Vegetation Sahel, Sudan, and Northern- Guinea Savanna
Sahel Savanna, Derived Savanna
Forest-savanna,
-Deciduous Forest, Derived Savannah, Secondary Woodland Forest and Southern Guinea Savannah
-Freshwater Swamp -Rain forest
-Freshwater Swamp -Mangrove Forest
Mean Annual Rainfall (mm)
500-1200 500-1200 800-2000 1200-2200
Rural Pop (% of Total)
80% 80% 77%
Population Density(p/km2)
103 47 195
Arable Land (Ha)
14million 3.4 million 24.7 million 4.06 million 5.8 million 8.5 million
Land Under Cultivation (Ha)
9.5 million 6.6 million 2.4 million 2.8 million 2.5 million
Main Crops Sorghum, maize, rice, groundnut, cotton, wheat, tomato, pepper
Sorghum, millet, maize, rice, cowpea, groundnut, cotton, wheat
maize, rice, millet sorghum, cowpea, groundnut, yam, cassava, melon
cassava, maize, yam, rice, melon, cowpea, cocoyam, plantain and vegetables.
yam, cassava, cocoyam, maize, rice, banana, plantain, melon, vegetables Oil-palm, cocoa, rubber and cashew
oil palm, citrus, mango, raffia palm, cocoa, coconut. Cassava, yam, cocoyam, maize, sweet potatoes, plantain, banana vegetables
Source: Adapted from NISER (2001)
50
50
Commercial production of the selected crops vary considerably across the agro-ecological zones. Whereas cassava, maize and rice are produced in commercial quantity in all the zones, cotton soybean and sugar-cane are restricted to specific zones. The NW (Northwest) zone is the leading producer of cotton, followed by the NE (Northeast) and NC (Northcentral) agro-ecological zones. The Northwest is also leading in the production of sugar-cane. Other zones producing sugar-cane are NE, NC and SW. Available data from 1999 to 2004 indicate that the NC is the leading producer of cassava, maize, rice and soybean. As we shall see later, during this period, the production of these commodities maintained a positive but haphazard trend although there seems not to be any significant expansion in land area under cultivation.
Cattle is one of the commodities slated for inclusion in this study at the preliminary stages. However, the level of commercialization of cattle production in the country is such that the type of data required for the value chain analysis and assessment of competitiveness is not easy to come by. It was also not possible to obtain relevant data from the literature. Available studies relating to value chain analysis in Nigeria places less emphasis on the economic significance of competitiveness. The focus is largely on the formal and informal institutions associated with the commodity chain (Adamu et al, 2005). The studies sought to examine the major marketing and transport institutions which regulate cattle trade from the production region in the north (Mamman, 2005) to the consumption region in the south (Filani, 2005) with a view to identifying areas where the potential for the consumers to benefit from the trade could be improved. In order to understand the social context and regulatory mechanisms surrounding market transactions and transport operations within the cattle commodity chain the approach adopted in the studies is essentially qualitative. Conceptually, the transport aspects of the chain are analysed from the standpoint of (i) a functional approach which examines the functions performed right from the production stage to livestock sale, transportation, handling processes, meat storage and retail, (ii) a behavioural approach which seeks to understand the behaviour of the major actors involved in the commodity chain and (iii) an institutional approach which considers the regulatory mechanisms relating to marketing functions and exchange transactions within the chain. The study by Mamman (2005), which was based on the production region in Sokoto in Northwest Nigeria came up with the following findings.
� Most cattle traders inherited their business from their fathers or relations. � They depend on friend, co-traders and family sources for credit. � The system of cattle production and ownership is informal and traditional. � Actors in the commodity chain rely on traders associations and use of mobile telephone
for market information relating to cattle supply and demand, prices, security issues and fuel supply situation.
� Efficient functioning of the chain is constrained by factors such as (i) inadequate capital and lack of access to formal credit, (ii) lack of basic facilities such as water, electricity and secured environment in the cattle market, (iii) inadequate space for the display of cattle in the market, (iv) inadequate grazing resources for cattle rearers/producers and (v) numerous police check points where bribes have to be paid by the drivers while transporting animals from the north to the south and (vi) high rates of tax and levies imposed by state and local governments.

51
51
To remedy the situation the author calls for a shift from road to rail transport, modern form of processing of cattle to beef, introduction of a refrigerated system of marketing livestock products, reduction in transit levies and taxes and improved security on the roads.
3.1 Value Chain Analysis of the Cassava Industry
3.1.1 Review of Cassava Value Chain Studies in Nigeria
Analysis of profitability and value chain indicators of cassava has attracted attention in Nigeria in recent times not only because the commodity is assuming increasing economic importance in terms of domestic and industrial demand but also in view of the current policy attention being focused on export of cassava products. With regard to profitability, studies have shown that cassava enterprises are quite profitable. According to NISER (2001), cassava production is profitable under the traditional and improved system of production. Under the traditional production system, a combination of maize, cassava and melon yielded gross margins of N46,200 and N137,750 in South-east and South-south respectively. However, the same crop mixture, grown under improved system yielded N73,800 in the South-east. The study found that where cassava was cultivated as a sole crop in the Southwest of the country, it was possible to realize a gross margin of N18,750.88 per hectare (see Table 3.3). Table 3.3: Gross Margin in Cassava Production in South-west Nigeria (�)
Improved Sole Cropping Labour
29,470.00
Seed/Cutting
1,114.97
Fertilizer
880.50
Herbicide
775.00
Pesticide
-
Tractor
-
Water Application
-
Transportation
3,991.00
Total Variable Cost
36,231.47
Total Value of Output
54,981.55
Gross Margin
18,750.08
Source: NISER, 2001

52
52
The most extensive value chain study for cassava in Nigeria was conducted in 2005 by Yee and Paludetto to support the World Bank’s initiative in enhancing Nigerian competitiveness and growth in the non-extractive sectors of the economy. The value chain was explored through a case study of a shipment of cassava starch from the southwestern part of the country to Lagos. The main results are presented in Table 3.4. The value chain analysis for 16 tonnes of cassava starch requires that 80 tonnes of cassava roots with a value of N400,000 be transformed to produce cassava starch worth N886,000 yielding an increase in shipment values of about 122%. There is downward pressure on shipment value due to strong competition from overseas sources and domestic substitutes. The strongest foreign competition comes from Thailand, which is the world’s largest exporter of cassava products. In addition, Nigeria faces competition in the form of corn starch. Cassava and corn starch are substitutes in the food starch industry and up until the end of July 2004, corn starch was being imported at prices about 10 to 20 percent lower than cassava starch. Since then, the import tariff applied to corn starch has risen from 15 to 80 percent, thereby providing some room for cassava starch producers to raise their prices.
Intermediate inputs represent 47 percent of the shipment value of cassava starch. The major intermediate input in the starch production process is cassava in the form of roots. The price of the root has escalated about four to five times compared to 4 years ago in 2000 when the price was about N1000 per tonne. The rise of root prices was caused largely by a rising demand that was not accommodated by a corresponding response in supply. The rising demand was attributed to increasing industrial and human consumption, particularly the former in the form of poultry livestock feed, starch and alcohol production. With the high cost of intermediate inputs and downward pressure in the price of cassava starch, there is difficulty in expanding value added along the chain. This is demonstrated by the realized value added (N466,000) for cassava starch which accounts for only 53 percent of shipment value. In contrast, cassava root production realized a value added (N366,000) that represented 91 percent of the shipment value, a much preferable situation. This is largely the result of a fast-rising cassava price that is not accompanied by similar price increases in intermediate input costs (stem cuttings) so that value added is spread as wide as possible to compensate for the cost of primary inputs and logistics activities. As crop cultivation is largely manual, value added is expended mainly on wages, which is sweat labor provided by the grower, and also on logistics.
The results show that there is insufficient value added to cover both the full cost of the value adding activities as well as provide a return to equity. In cassava farming, value added of N365,851 is used to cover logistics costs of N120,207 (33 percent of value added) as well as primary input costs of N245,644 (67 percent of value added) that include depreciation, maintenance, labor, overheads, and utilities (power, diesel, water). In the case of starch production, value added of N466,064 is used to cover logistics costs of N58,064 (12 percent of value added) and primary input costs of N408,000 (88 percent of value added). Accordingly, there are no residual resources left to reward risk equity capital and therefore no profit is accrued. The lack of profitability is due to (i) high Labor cost of root production (ii) high logistics cost of cassava farming and harvesting and (iii) unreliable supply and high cost of utilities. The analysis of cassava starch production shows that the producer is operating with barely enough revenues to cover the costs of production but is not left with anything to recompense capital charge, particularly the cost of equity. Consequently, no profit is realized from operations.

53
53
Table 3.4 Cassava Starch Value Chain Activity Results
Cassava
Growing &Harvesting
Cassava
Growing &Harvesting
400,000 Naira365,851 Naira
376 Days34,149 Naira
245,644 Naira
120,207 Naira0 Naira
91%
9%
30%
67%
33%0%
N/A
N/A64%
N/A
N/A3%
<1%33%
Shipment Value
Realized Value AddedTotal Elapsed Time
Intermediate Inputs
Primary InputsLogistics Costs
Profit/(Loss)
Shipment Value MetricsVA as % of SV
Intermediate Inputs as % of SVLogistics Costs as % of SV
Value Added Metrics
Primary Inputs as % of VALogistics Costs as % of VA
Profit as % of VA
Value Adding Input Cost StructurePrimary Inputs
Capital ChargeRepair & Maintenance
Labour
Administrative OverheadsUtilities
Supplies & IncidentalsLogistics Inputs
InboundOutbound
Cassava
StarchProcessing
Cassava
StarchProcessing
886,064 Naira466,064 Naira
386 Days420,000 Naira
408,000 Naira
58,064 Naira0 Naira
53%
47%
7%
88%
12%0%
25%
N/A 13%
26%
24%N/A
4%9%
Cassava
Growing &Harvesting
Cassava
Growing &Harvesting
400,000 Naira365,851 Naira
376 Days34,149 Naira
245,644 Naira
120,207 Naira0 Naira
91%
9%
30%
67%
33%0%
N/A
N/A64%
N/A
N/A3%
<1%33%
Shipment Value
Realized Value AddedTotal Elapsed Time
Intermediate Inputs
Primary InputsLogistics Costs
Profit/(Loss)
Shipment Value MetricsVA as % of SV
Intermediate Inputs as % of SVLogistics Costs as % of SV
Value Added Metrics
Primary Inputs as % of VALogistics Costs as % of VA
Profit as % of VA
Value Adding Input Cost StructurePrimary Inputs
Capital ChargeRepair & Maintenance
Labour
Administrative OverheadsUtilities
Supplies & IncidentalsLogistics Inputs
InboundOutbound
Cassava
StarchProcessing
Cassava
StarchProcessing
886,064 Naira466,064 Naira
386 Days420,000 Naira
408,000 Naira
58,064 Naira0 Naira
53%
47%
7%
88%
12%0%
25%
N/A 13%
26%
24%N/A
4%9%
Source: Consilium International Inc.
3.1.2 Weak Links in the Cassava Value Chain
The authors identified three major weaknesses in the cassava value chain. The first major weakness in the Nigerian cassava chain relates to the growing and harvesting of the root. The yield of 12 to 15 tonnes per hectare is indicative of the yields experienced in the south-eastern region of Nigeria as per the case study. This region is one of the most productive in the country with respect to cassava. The national average is somewhat lower at 10.0 tonnes/ha. In contrast, Thailand, nationally, experienced yields of 17.1 tonnes/ha in 2002. Regional yields in countries such as India, Laos, Thailand and Barbados have been estimated as high as 25 to 40 tonnes/ha. Obviously, Nigeria’s highest productivity yields fall short of these rates and this situation is due to a number of factors including small scale farming (on plots that are usually less than 1 hectare), manual operation, little or no use of fertilizers and limited knowledge in the use of high yield roots to name a few. Farming at this level makes it difficult to achieve scale economies and, furthermore, in increasing supply responsively to market needs (which at the present time is geared towards gari consumption as food). At the same time, the emergence of a cassava

54
54
processing industry (e.g. starch, alcohol, adhesives, etc.) would consume a significant amount of the annual production of cassava root (in addition to that traditionally required for food production), as demonstrated by the starch example in which the conversion of root to starch is a 5:1 ratio, and this would necessitate a strong increase in the supply of the root. In other words, there is the potential for a strong imbalance between supply of and demand for root cassava which will lead to a shortage of raw material for the hungry processing mills. If that is the case, unavailability is not the only problem as it will be accompanied by significant upward price adjustment that would render the economics of cassava processing infeasible. Obviously, this would undermine the development of the cassava value chain by cutting it short of the processing stage.
Secondly, the small scale of operation has a deleterious effect on the on the supply chain in view of the uneconomic gathering or collection of the root in small shipments from numerous and dispersed growers frequently reaping only 12 to 15 tonnes per harvest. On this basis, the unit cost of transporting small shipments to the destination is naturally more expensive than that of large shipments which could only materialize through higher output farming. In addition, the performance of the supply chain is also negatively affected by the poor road infrastructure, as it provides poor access to the farms. Most of the small farms are not served by paved roads and consequently road freight vehicles cannot provide service on a door-to-door basis, especially after a rain storm. Instead, the harvest is handled from farm to truck manually, frequently with a wheel barrow, over a distance as much as a couple of kilometers, before the truck hauls it to the processing plant or a designated depot. In the process, the transit time is longer than it should have been, thus jeopardizing the short shelf life of the root. Overall, the resources used in carrying out this activity are inordinately high, with transportation charges alone accounting for N1,500 per tonne against a delivered price of the root at the plant gate of about N5000 per tonne. In essence, the high cost of logistics associated with the raw material jeopardizes the commercial viability of the processing operation and extension of the cassava chain to greater value added. Thirdly, at the plant, the economics of production is impeded by a host of factors that are similar to that faced by producers in other industries. These include (i) high rate of interest, (ii) poor and costly public utilities, (iii) random disruption of utility supply that leads to temporary stoppages in plant operation with the consequence of lost output and product spoilage and (iv) low productivity and poor quality of labour. Overall, the operating environment hinders competitiveness and reduces profit-making to a high risk venture.
3.1.3 World Market Structure
Cassava has been growing in economic importance over the years and in recent times, its recognition in producing and consuming countries for industrial development is also increasing very widely. However, the low level of development of the cassava industry in the producing countries has not made it possible for producers and consumers to derive the desired level of satisfaction. Nonetheless, the cassava market is growing internationally. The world output of cassava stood at 186 million tonnes in 2002 and to date Nigeria is the largest producer of the crop. The top 10 producers of cassava accounted for about 75 percent of the production that year (Table 3.5). Available data from 1961-2005 indicate that the cumulative annual growth rate of cassava production was 3.85 percent in Western Africa and 2.60 percent in Central Africa. In 2004, production of fresh cassava roots stood at 56 million tonnes in the former and 28 million tonnes in the latter. According to IFAD (2006), the annual value of fresh roots at farm gate in the region was estimated at USD 3 to 4 billion.

55
55
Table 3.5: World Cassava Production, 2002
Country Output (Million MT)
Nigeria 34.5
Brazil 23.1
Indonesia 16.9
Thailand 16.9
Democratic Republic of Congo 14.9
Ghana 9.7
India 7.0
Tanzania 6.9
Mozambique 5.9
Angola 5.6
Others 45.0
TOTAL 186
Source: FAOSTAT, 2004
In West Africa many countries have ventured into the export of cassava products to the
European Community (EU) with mixed success. The major limitation to this export market is the fixed 145,000 tonnes per annum quota granted for ACP countries by the EU. In Asia, very little cassava is utilized for direct human consumption (except in Indonesia) and most is processed into chips and pellets. The cassava starch industry is most important and most dynamic in Thailand, followed by Indonesia, China, India, and Vietnam. Relatively new entrants into the Asian cassava starch industry are Vietnam and China. Since their respective initial free market policy implementations, very significant investments have been made on cassava starch based, largely on export oriented industries. Most of the starch products are destined for the food processing (MSG, noodles etc), soft drinks, and pharmaceutical industries. For this purpose, both China and Indonesia originally, exporters of cassava presently import cassava products in the form of chips and pellets for their growing processing industries. In fact, China is fast replacing EU as a major importer of cassava chips with over 1million tonne import of the commodity in 2002. Other importers of cassava chips in the Asian region include Japan, South Korea and Malaysia. The major cassava products exported to the EU are the chips and pellets. Thailand is the major supplier contributing about 90% of the products requirements of these markets.
In Latin America and the Caribbean, cassava continues its transition towards a market oriented product and raw materials for the processing industries. The utilization of cassava both as food and for the processing industries has significantly been on the increase in Brazil, followed by Colombia, Venezuela and recently Paraguay. The export of cassava roots to the US and the EU (for food consumption by mainly ethnic groups) is presently dominated by Costa Rica. The US and the EU have highly protected import (and subsidized export) markets. This also affects cassava products especially cassava starches. High levies and quotas are used to protect their domestic industries. Thai cassava pellet imports to the EU continue to decrease since the 1990’s, mainly due to policy changes in favour of the EU domestic grain prices. Other SE-Asian pellet import quotas have remained largely unfilled. The US shows only very minor

56
56
dried cassava imports. Fresh cassava (waxed or frozen) imports mainly from Costa Rica, continue to increase in the US. Nonetheless, the principal consumers of these products do not show a significant additional future demand. Specialty cassava starches are being imported to both the EU and US, despite the prohibitive levies placed on imports above the small quota given by the EU. The major market for cassava in the EU is Netherlands, while Germany, Portugal, Spain, United Kingdom, and Belgium are minor importers. Netherlands imports are re-exported to other destinations in Europe and Russia. Chips and Pellets are the principal products that are exported to these countries, while Rotterdam is the major market centre in Europe. Some inter-and intra-regional trade in cassava exist in Africa. However, there has not been any documented record on the volume and nature of these trades. It is therefore, possible that the trades have been in the form of illegal trans-border transactions. A recent trade mission to South African countries by the Presidential Committee on Cassava Export showed that there is an immediate demand for about 400,000 tonnes of cassava chips (about 1.6million tonnes of cassava) for animal feeds in South Africa and Botswana alone.
3.1.4 Nigerian Cassava Market Structure
Great imbalances continue to exist between the demand and supply of cassava in Nigeria. There is great demand for products from cassava processing. Such products apart from the traditional foods, include industrial raw materials like native and modified starches for the textile, food and beverages, pharmaceutical, pulp and paper industries etc, sweeteners e.g. glucose/dextrose, fructose, citric acid, for both the beverage and pharmaceutical industries, dextrins and other adhesives for packaging industries etc, ethanol for beverage, pharmaceutical, and cosmetic industries, as well as high quality unfermented cassava flour for bakery and confectionery industries. It is roughly estimated that more than 40 million tonnes of cassava would be needed to satisfy the demand of the different industries for the aforementioned products. Demand will also increase as a result of some policy actions taken by the Federal Government including (i) the setting up of a Presidential Committee on national cassava production and export in 2002, (ii) mandatory requirement since January 2005 that 10 percent cassava flour should be included in all composite formulations for the baking and confectionery industry and (iii) the introduction of gari in the National Strategic Food Reserve Programme which hitherto was limited to grains.
The supply for the cassava is at present, inadequate due mainly to some factors such as inadequate pricing for the tubers and processing centres among others. This does not however, imply that there is inadequate availability of cassava roots in the country. The problem of supply is mainly due to inadequate pricing. This is because a number of producers find it inexpedient to sell their roots at the price offered, thus leading to some of them leaving the roots in the farms; resulting into wastage in some cases. The suppliers of cassava roots are mainly the farmers. This is because cassava cannot be stored after harvest. The presence of middlemen in the supply chain of cassava is at present, not very significant. These exist mainly when there are large-scale processors of the roots.
3.1.5 Characterization of the Cassava Value Chain
Cassava Production and Cropping System Cassava production in Nigeria is largely in the hands of smallholders who operate about 87 percent of the total land area cultivated to the crop. The medium holding farms constitute about 10 percent, while the large-scale farms make up the remaining 3 percent. Cassava can be grown

57
57
almost in all the states either as a sole crop or an intercrop with principal staples, such as maize, yam, cocoyam, sweet potato, rice, sorghum, millet; and subsidiary crops, such as beans, okro and leafy vegetables. Cassava can also be grown with oil palm, rubber, cashew and cocoa within the first few years of the permanent crop before the canopy covers. In most of the southern areas of Nigeria, farmers grow cassava in mixtures with maize, cocoyam, yam and vegetables but some grow it sole. In northern areas, sole cropping is more common (Unamma et al., 1985, Okoli and Nnodu, 1996). A recent survey in the country indicates that on the average, for all the crops, about 25 percent of the fields are sole cropped and 75 percent are intercropped (RMDRC, 2004). Cassava is grown in areas where rainfall is greater than 100 mm, and accounts for over 70 percent of the total production of the tuber crop in West Africa. This achievement has been attributed to the improved high yielding, pest and disease resistant cassava varieties produced and released to farmers through research collaboration of IITA, Ibadan and the National Root Crops Research Institute (NRCRI), Umudike.
Harvesting It is best to harvest cassava when the roots have accumulated enough starch; but this will depend on the variety, soil conditions and climatic factors. Early maturing varieties are ready for harvesting at 7 months after planting while late maturing varieties are ready at 12 months after planting. However, studies have shown that several cassava varieties attain optimum fresh weight from 12 – 15 months after planting (IITA, 1990 and Eke-Okoro et al., 1999). Leaving maturing roots unharvested will lead to the roots being very fibrous. Manual harvesting is the main method of harvesting. The stem is cut 30 cm above the soil surface and the roots are lifted up by pulling the stump gently. Cassava can be harvested both in the rainy and dry seasons but it is better to harvest when the soil is wet, to avoid damage to the roots and also to use the stems for fresh planting. This is better than the dry season when the stems are likely to be dried up. The structure and trend of cassava production in Nigeria between 1999 and 2004 are presented in Table 3.6 and Figures 3.1 and 3.2. During the period the North-central zone was the leading producer of cassava annually except in 2004 when it lost the position to the South-south. On the average the contribution of NC to total output is 26.95 percent while NE has the lowest share. Average yield of cassava is highest in SW (13.4 mt/ha) while the lowest occurred in NE (8.17 mt /ha). The leading producers, NC and SS, witnessed major declines in output in 2004 and 2003 respectively. Output growth virtually stagnated in NW and NE although in the case of the latter there was a big jump between 2003 and 2004. In general, cassava production followed an upward trend in the Southwest and Southeast. There is virtually no expansion in land area cultivated to cassava except in SE and SW. In the NC, the trend is actually on the decline between 1999 and 2004 (Fig. 3.2).
Factors Affecting Production The decline in production may be related to losses arising from livestock (mainly cattle), pests and diseases and/or declining soil fertility. Unless fenced round, which is prohibitive considering the relatively low value of the crop, cassava fields could be destroyed by cattle and other domestic animals such as goats and sheep especially during dry season when pasture is scarce. Reduction in soil fertility, which could arise from either soil erosion, as is the case in some southern states, or short rain fall duration in the northern states where farmers with a limited supply of fertilizer would prefer to grow short duration crops like millet or sorghum, may also be contributory. Non-availability of land particularly in the southern parts due to the land tenure system in the zone could also limit the production of cassava. In addition, negative market forces
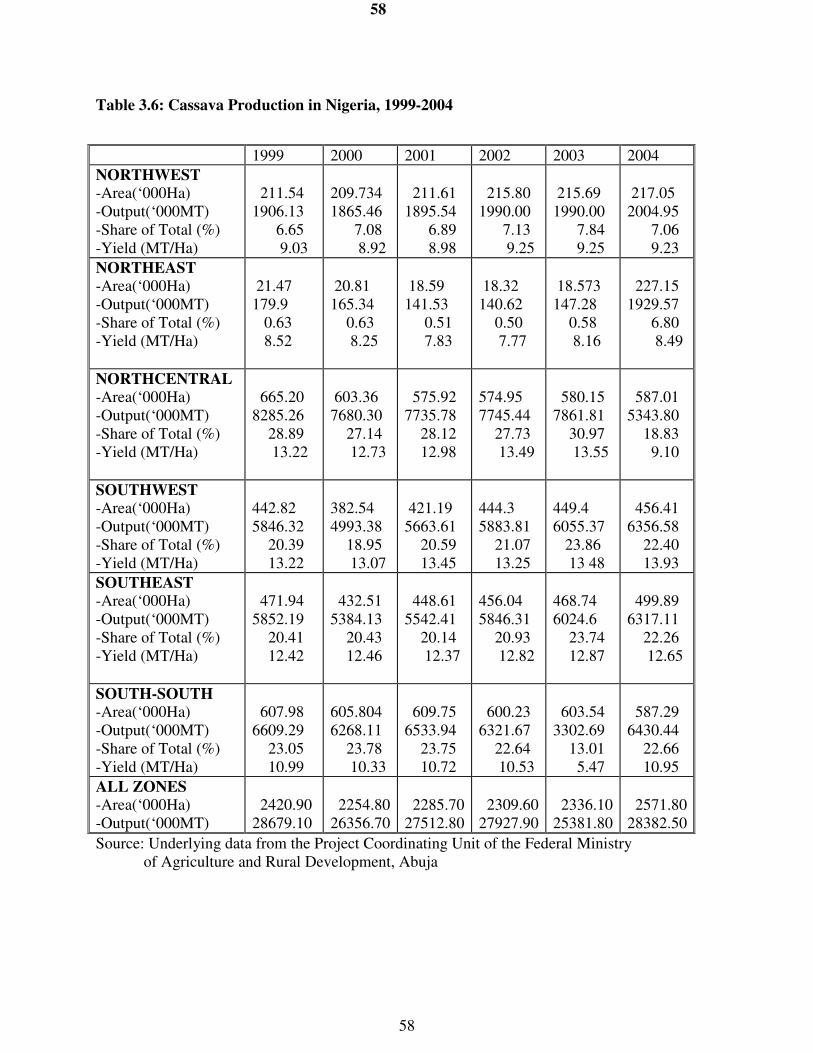
58
58
Table 3.6: Cassava Production in Nigeria, 1999-2004
1999 2000 2001 2002 2003 2004
NORTHWEST
-Area(‘000Ha) -Output(‘000MT) -Share of Total (%) -Yield (MT/Ha)
211.54 1906.13 6.65 9.03
209.734 1865.46 7.08 8.92
211.61 1895.54 6.89 8.98
215.80 1990.00 7.13 9.25
215.69 1990.00 7.84 9.25
217.05 2004.95 7.06 9.23
NORTHEAST
-Area(‘000Ha) -Output(‘000MT) -Share of Total (%) -Yield (MT/Ha)
21.47 179.9 0.63 8.52
20.81 165.34 0.63 8.25
18.59 141.53 0.51 7.83
18.32 140.62 0.50 7.77
18.573 147.28 0.58 8.16
227.15 1929.57 6.80 8.49
NORTHCENTRAL
-Area(‘000Ha) -Output(‘000MT) -Share of Total (%) -Yield (MT/Ha)
665.20 8285.26 28.89 13.22
603.36 7680.30 27.14 12.73
575.92 7735.78 28.12 12.98
574.95 7745.44 27.73 13.49
580.15 7861.81 30.97 13.55
587.01 5343.80 18.83 9.10
SOUTHWEST
-Area(‘000Ha) -Output(‘000MT) -Share of Total (%) -Yield (MT/Ha)
442.82 5846.32 20.39 13.22
382.54 4993.38 18.95 13.07
421.19 5663.61 20.59 13.45
444.3 5883.81 21.07 13.25
449.4 6055.37 23.86 13 48
456.41 6356.58 22.40 13.93
SOUTHEAST
-Area(‘000Ha) -Output(‘000MT) -Share of Total (%) -Yield (MT/Ha)
471.94 5852.19 20.41 12.42
432.51 5384.13 20.43 12.46
448.61 5542.41 20.14 12.37
456.04 5846.31 20.93 12.82
468.74 6024.6 23.74 12.87
499.89 6317.11 22.26 12.65
SOUTH-SOUTH
-Area(‘000Ha) -Output(‘000MT) -Share of Total (%) -Yield (MT/Ha)
607.98 6609.29 23.05 10.99
605.804 6268.11 23.78 10.33
609.75 6533.94 23.75 10.72
600.23 6321.67 22.64 10.53
603.54 3302.69 13.01 5.47
587.29 6430.44 22.66 10.95
ALL ZONES
-Area(‘000Ha) -Output(‘000MT)
2420.90 28679.10
2254.80 26356.70
2285.70 27512.80
2309.60 27927.90
2336.10 25381.80
2571.80 28382.50
Source: Underlying data from the Project Coordinating Unit of the Federal Ministry of Agriculture and Rural Development, Abuja

59
59
Fig. 3.1: Production of Cassava
By Agro-Ecological Zones in
Nigeria
0
2000
4000
6000
8000
10000
1999 2000 2001 2002 2003 2004
Year
Ou
tpu
t ('
000 M
T)
NW
NE
NC
SW
SE
SS
F ig . 3 .2 : L a n d A r e a C u l t iv a t e d t o
C a s s a v a in N ig e r ia n A g r o -
E c o lo g ic a l Z o n e s
0
1 0 0
2 0 0
3 0 0
4 0 0
5 0 0
6 0 0
7 0 0
1999
2000
2001
2002
2003
2004
Y e a r
'000 H
a
N W
N E
N C
S W
S E
S S
60
60
e.g. low price offer for fresh roots, and products e.g. garri may also contribute to reduced production. The general increase in the production of cassava observed could be related to rapid population growth and hence increased market demand for cassava-based foods. As at present, there is relatively low industrial demand for cassava for the production of the various industrial products in Nigeria. However, there is increasing demand for cassava foods such as garri, and instant fufu flour (which are major consumption items in the Southeast and Southwest) which are being increasingly consumed by some populations that hitherto did not have them as their staples. Other factors, which could explain the increasing trend in cassava production include:
� the availability of improved varieties of cassava
� adoption of improved farm management
� existence of improved processing technology
� the interest of government in promoting the cultivation of cassava
� rapid population growth - which tends to increase market demand.
� participation of more middlemen in cassava marketing
� relatively well-developed market access infrastructure
� increased industrial usage of cassava.
Post-Harvest Management Cassava stems when cut from the field may not be planted soon after they have been cut for one reason or the other. It therefore becomes necessary to preserve them for sometime until the farmer is ready to plant them. Similarly, cassava roots may be harvested but it may not be possible to process them into other food forms immediately. Cassava roots are extremely perishable. Once they have been harvested, they begin to deteriorate within 40 – 48 hours (IITA, 1990). The deterioration is caused by physiological changes and subsequently, by rot and decay due to infection by rot –causing microorganisms. Bruises and wounds during harvesting and handling predispose roots to rapid deterioration. This deterioration has adverse effects on the processed product and thus the roots must be stored properly before processing. The Nigerian Stored Products Research Institute (NSPRI) has developed low-cost and practical methods which can store cassava roots fresh for at least 6 – 8 weeks and can be applied easily by farmers and processors. Appropriate methods have also been developed for storing cassava stems for up to 2 – 3 months before using them for planting.
Once harvested, cassava has to be either consumed immediately or processed into more stable product forms. The root consists of 60 to 70% water and has a shelf life of 2 to 3 days. Processing it into dry form reduces the moisture content and converts it into a more durable and stable product with less volume, which makes it easier for transportation. Processing is also necessary to eliminate or reduce the level of hydrocyanic acid (HCN) or cyanide in the crop and to improve the palatability of the food products. Processed cassava products are also used as raw materials for a number of small- or medium-scale industries in Africa. The cassava root can be processed into food products such as garri, fufu, instant flour, fermented flour, and industrial products including chips, pellets, native starch, modified starch/adhesives, alcohol (ethanol),4 Monosodium glutamate (MSG), citric acid, sweeteners e.g. glucose, fructose and sorbitol. The

61
61
processing of cassava leaves for the production of hay (animal feed); as well as for leaf protein concentrates are also gaining grounds. 3.1.6 Results of the Cassava Value Chain Analysis
The value chain analysis seeks to examine the main links in the cassava chain (production, assembly, processing, trade) with a view to determining the international competitiveness of the commodity. The analysis is conducted at three levels of operation – family farm (FAM), emerging commercial farm (ECF) and large commercial farm (LCF) and the results are presented accordingly. (a) Financial Costs and Profitability Indicators
As regards the FAM, the costs at the farm product stage consist largely of variable cost that represents about 97 percent of total production costs. As expected, the total cost is on the increase in the value chain from the production stage to the assembly and processing stage. After the production stage total costs are inclusive of the price paid for cassava (tuber) by the assembler and processor. The analysis keeps track of the build-up of financial costs at every stage of the value chain and this reveals the contribution of the various cost items. At the production stage, labour cost is the single largest component (47 percent) of financial costs and this is followed by seeds, fertilizer and chemicals (38 percent). At the assembly stage, the single most important cost component is also hired labour, with the cost representing 56 percent of the financial costs. The cost of vehicle hire is the next important cost component and it represents 29 percent of total cost. At the processing stage, the bulk of the cost (81 percent) is incurred on storage and plant repair and maintenance (Table 3.7). With regard to profitability of the cassava FAM, the results show that operating profit and net profit are positive only at the production and processing stages. At the production stage, the gross margin is US$149.89 while net profit is $149.08; whereas at the processing stage, the gross margin and net profit are US$85.18 and US$84.23 respectively (Table 3.8). Moreover, the rate of return is higher at the production stage than at the processing stage.
The cost structure of the cassava ECF, shows that production costs consist largely of depreciation of fixed assets (64 percent) followed by non-labour inputs such as seeds, fertilizer and chemicals (20 percent) while hired labour represents 13 percent of the total costs (Table 3.7). The relatively high proportion of depreciation in the case of ECF and LCF is accounted for by the availability of capital equipment such as ploughs and harrows which are very expensive cost items owned and used by the farmers for land preparation and whose costs have to be incorporated into the computation of depreciation. The profitability indicators appear to be encouraging. Operating profit is positive at the production, assembly and processing stages. The gross margin per tonne is US$19.19, US$45.15 and US$85.18 respectively. Whereas net profit is positive at the assembly (US$45.15) and processing (US$84.58) stages, it is negative at the production stage indicating the difficulty to ensure viability of commercial production of cassava. The rate of return is about 22 percent at the production stage; but it is slightly higher at the assembly stage (25 percent) while it is highest at the processing stage (27 percent) (Table 3.8).
Table 3.7 also presents the build-up of financial costs in respect of cassava LCF. There are four important cost items at the production stage. They are, in order of importance, depreciation of fixed assets (46 percent), hired labour (21 percent), chemical application and machine operation (19 percent) and seed, fertilizer and chemicals (14 percent). Profitability

62
62
indicators follow virtually the same pattern for cassava LCF as that of the cassava FAM. The results show that operating profit and net profit are positive only at the production and processing stages. At the production stage, the gross margin is US$127.80 while net profit is $107.73; whereas at the processing stage, the gross margin and net profit are US$83.44 and
Table 3.7: Structure of Financial Costs in Cassava Enterprises percent
COST ITEMS FARM
PRODUCT
ASSEMBLY PROCESSING
FAM
Hired Labour 47 56 2
Seed, Fertilizer & Chemicals 38
Marketing 6
Spraying & Machine Operation 6
Vehicle Hire 29
Fees & Crop Levies 14
Packing & Consumables 1 8
Storage & Plant R&M 81
Overhead & Licence 6
Energy & Machine Operation 2
Depreciation 3 1
TOTAL 100 100 100
ECF
Hired Labour 13 56 2
Seed, Fertilizer & Chemicals 20
Marketing
Spraying& Machine Operation 3
Vehicle O & M 29 2
Fees & Crop Levies 14
Packaging & Consumables 1 7
Storage & Plant R&M 79
Overhead & Licence 6
Energy & Machine Operation 3
Depreciation 64 1
TOTAL 100 100 100
LCF
Hired Labour 21 63 2
Seed, Fertilizer & Chemicals 14
Marketing
Spraying, & Machine Operation
19
Vehicle O & M 24 2
Fees & Crop Levies 12
Packing & Consumables 1 7
Storage & Plant R&M 79
Overhead & Licence 6
Energy & Machine Operation 3
Depreciation 46 1
TOTAL 100 100 100
Source: Author’s computations

63
63
Table 3.8: Profitability Indicators of Cassava Enterprises (Per MT)
FAM CASSAVA
ECF CASSAVA
LCF CASSAVA
Source: Author’s computations
NGN USD NGN USD NGN USD
Gross revenue 14,000 106.06 30,000 227.27 52,360 396.67
Production costs
Crop purchase - 14,000 106.06 30,000 227.27
Other variable costs 11,467 86.87 10,040 76.06 11,196 84.82
Investment costs 21,353 161.77 - - 125 0.95
Total costs 32,820 248.64 24,040 182.12 41,321 313.04
Final income
Gross margin 2,533 19.19 5,960 45.15 11,164 84.58
Net profit (18,820) (142.58) 5,960 45.15 11,039 83.63
Rates of return
Gross margin/total VCGross margin/total VC 0.22 0.25 0.27
Net profit/total costs (0.57) 0.25 0.27
FARM GATE
PRODUCT RAW MATERIAL
PROCESSED
RAW MATERIAL
ASSEMBLED
NGN USD NGN USD NGN USD Gross revenue 25,000 189.39 30,000 227.27 52,360 396.67 Production costs
Crop purchase - 25,000 189.39 30,000 227.27 Other variable costs 5,214 39.50 11,140 84.39 11,116 84.21 Investment costs 108 0.82 - - 125 0.95
Total costs 5,322 40.32 36,140 273.79 41,241 312.43 Final income
Gross margin 19,786 149.89 (6,140) (46.52) 11,244 85.18 Net profit 19,678 149.08 (6,140) (46.52) 11,119 84.23
Rates of return Gross margin/total VC 3.79 -0.17 0.27
Net profit/total costs 3.70 -0.17 0.27
PROCESSED RAW MATERIAL
ASSEMBLED FARM GATE PRODUCT RAW MATERIAL
NGN USD NGN USD NGN USD
Gross revenue 20,000 151.52 30,000 227.27 52,360 396.67
Production costs
Crop purchase - 25,000 189.39 30,000 227.27
Other variable costs 3,130 23.71 12,740 96.52 11,346 85.95
Investment costs 2,649 20.07 - - 125 0.95
Total costs 5,779 43.78 37,740 285.91 41,471 314.17
Final income
Gross margin 16,870 127.80 (7,740) (58.64) 11,014 83.44
Net profit 14,221 107.73 (7,740) (58.64) 10,889 82.49
Rates of return
Gross margin/total VCGross margin/total VC 5.39 -0.21 0.27
Net profit/total costs 2.46 -0.21 0.26
PROCESSED
RAW MATERIAL
ASSEMBLEDFARM GATE
PRODUCT RAW MATERIAL

64
64
US$82.49 respectively. Moreover, the rate of return is higher at the production stage than at the processing stage (Table 3.8).
(b) Value Chain Indicators
The transformation of cassava from the FAM into various products results in considerable increase in value along the chain. From the farm production stage to the assembly stage SV increased by 579 percent while the increase from assembly to processing is 14 percent. From processing to the stage of final trading, the SV increased by 62 percent in respect of cassava chips, 74 percent in respect of cassava pellets and 66 percent in respect of starch. The transformation of cassava from farm production into cassava starch, cassava chips and cassava pellets at the final trading stage is associated with an increase in shipment value from US$40.33 at the cassava production stage to US$504.81 for cassava chips, US$542.68 for pellets and US$519.96 for starch. This represents an increase in shipment values of about 1152 percent, 1246 percent and 1189 percent in respect of cassava chips, pellets and starch respectively. Cassava production yields a value added (US$36.48) which represents 90% of the shipment value. Value added also represents a high proportion of the shipment value of the cassava products. The proportion varies from 82 percent in the case of cassava chips and starch to 84 percent for pellets. The DVA is made up largely (99 percent) of domestic costs and mark-ups (Table 3.9).
The substantial increase in shipment value from the production stage to the stage of final traded product is not unexpected on account of the nature of the conversion of cassava tuber to the cassava products (chips, pellets, starch). A high quantity of raw cassava tuber (about three tones) of cassava tuber is required for the production of one tonne of each product. In view of the fact that the purchase of cassava tubers is included in the computation of shipment value and given the fact that the price of the commodity increases from one stage to another, it is not surprising that significant increase in shipment value is experienced between the production stage and the final traded commodity stage. For the purpose of determining the international competitiveness of the cassava products, the final shipment values are compared with the relevant export parity price. The final SVs for cassava chips, pellets and starch are US$504.81, US$542.68 and US$519.96 respectively (Table 3.9). Compared with the export parity price (US$-4.00) at the final commodity stage, none of these products is competitive at the international market. Apart from the high domestic costs, the very low level of international prices of these products makes them unprofitable and uncompetitive. As regards ECF, the transformation of cassava along the chain results in considerable increase in value. From the farm production stage to the processing stage SV increased by 26 percent. From processing to the stage of final trading, the SV increased by 62 percent in respect of cassava chips, 74 percent in respect of cassava pellets and 66 percent in respect of starch. The transformation of cassava from farm production into cassava starch, cassava chips and cassava pellets at the final trading stage is associated with an increase in shipment value from US$248.63 at the cassava production stage to US$508.55, US$546.97 and US$520.75 at the stage of final trading of cassava chips, pellets and starch respectively. This represents an increase in shipment values of about 105%, 120% and 109% in the case of cassava chips, pellets and starch respectively. Cassava production yields a value added (US$229.76) which represents 92% of the shipment value. Value added also represents a high proportion of the shipment value of the cassava products. The proportion varies from 72 percent in the case of cassava chips, to 73 percent for starch and 75 percent for pellets. About 90 percent of the DVA

65
65
Table 3.9: Cassava Value Chain Indicators for 1MT of Final Traded Products
FAM CASSAVA
ECF CASSAVA
LCF CASSAVA
Source: Author’s computations
NGN USD NGN USD NGN USD Domestic Value Added
Costs & mark-ups 54,003 409.11 59,299 449.23 55,929 423.70 Official duties & tax 17
77 177 1.34
4 - 219
2 - 1.66 199 1.51
Additional costs 423 3.20
- 438 - 3.32 475 3.60 Total DVA 54,603 413.66 59,956 454.21 56,603 428.81
Foreign costs 12032 91.15 11678 88.47 12,032 91.15 Total Shipment Value 66,635 504.81 71,634 542.68 68,635 519.96
TRADED COMMODITIES (1 MT Final Traded Product) CHIPS PELLETS STARCH
NGN USD NGN USD NGN USD Domestic Value Added
Costs & mark-ups 43,665 330.80 49,425 374.43 45,342 343.50 Official duties & tax 1,216 9.21 1,181 8.95 1,173 8.89 Additional costs 3,649 27.64 3,542 26.83 3,625 27.46
Total DVA 48,530 367.65 54,148 410.21 50,140 379.85 Foreign costs 18,599 140.90 18,052 136.76 18,599 140.90
Total Shipment Value 67,129 508.55 72,200 546.97 68,739 520.75
CHIPS PELLETS STARCH TRADED COMMODITIES (1 MT Final Traded Product)
NGN USD NGN USD NGN USD Domestic Value Added
Costs & mark-ups 55,178 418.02 60,557 458.77 57,288 434.00 Official duties & tax 125 0.95 111 0.84 125 0.95 Additional costs 384 2.91 333 2.52 384 2.91
Total DVA 55,687 421.87 61,001 462.13 57,797 437.86 Foreign costs 11,188 84.76 10,859 82.27 11,188 84.76
Total Shipment Value 66,875 506.63 71,860 544.39 68,985 522.61
TRADED COMMODITIES (1 MT Final Traded Product) CHIPS PELLETS STARCH

66
66
in the case of cassava chips is made up of domestic costs and mark-ups while the proportion for pellets is 91 percent. For cassava starch, domestic costs and mark-ups account for 90 percent of the DVA. For the purpose of determining the international competitiveness of the cassava products, the final shipment values are compared with the relevant export parity price. The final SVs for cassava chips, pellets and starch are US$508.55, US$546.97 and US$520.75 respectively (Table 3.9). Compared with the export parity price (US$-3.00) at the final commodity stage, none of these products is competitive at the international market. Again apart from the high domestic costs, the very low level of international prices of these products makes them unprofitable and uncompetitive.
Also, in the case of LCF, the transformation of cassava into various products results in considerable increase in value along the chain. From the farm production stage to the assembly stage SV increased by 553 percent while the increase from assembly to processing is 10 percent. From processing to the stage of final trading, the SV increased by 61 percent in respect of cassava chips, 73 percent in respect of cassava pellets and 66 percent in respect of starch. The transformation of cassava from farm production into cassava starch, cassava chips and cassava pellets at the final trading stage is associated with an increase in shipment value from US$43.79 at the cassava production stage to US$506.63 for cassava chips, US$544.39 for pellets and US$522.61 for starch. This represents an increase in shipment values of about 1053 percent, 1139 percent and 1087 percent in respect of cassava chips, pellets and starch respectively. Cassava production of LCF yields a value added (US$41.85) which represents 96% of the shipment value. Domestic Value Added (DVA) also represents a high proportion of the shipment value of the cassava products. The proportion varies from 83% in the case of cassava chips, to 85% for starch and 84% for pellets. In each case over 80% of the DVA is made up of domestic costs and mark-ups. For the purpose of determining the international competitiveness of the cassava products, the final shipment values are compared with the relevant export parity price. The final SVs for cassava chips, pellets and starch are US$506.63, US$544.39 and US$522.61 respectively. Compared with the export parity price (US$-3.00) at the final commodity stage, none of these products is competitive at the international market. In addition to high domestic costs, the very low level of international prices of these products makes them unprofitable and uncompetitive. 3.1.5 Comparative Value Chain Analysis By Type of Cassava Farms
Cassava Profitability and Value Chain Indicators Table 3.10 presents a summary of the results comparing the profitability and value chain indicators for the three category of farming enterprises included in the study namely; family farms (FAM), emerging commercial farms (ECF) and large commercial farms (LCF). The results show considerable variation in both operating and net profit as well as rate of return in respect of cassava production. The gross margin per tonne is highest for the FAM (US$149.89) followed by LCF (US$127.80) while that of the ECF is the lowest (US$19.19). Net profit is also highest for FAM (US$149.08) followed by LCF (US$107.73) while net profit for ECF is negative. The rate of return (net profit/total cost) for FAM is higher than that of LCF. Moreover, DVA for cassava production (i.e. at the farm product stage) is highest for ECF (US$229.76) followed by LCF (US$41.85) while that of FAM is the lowest (US$36.48). Similarly, the SV is highest for ECF (248.63) followed by LCF (US$43.78) and FAM (US$40.33).

67
67
Table 3.10
Cassava Profitability and Value Chain Indicators By Level of
Commercialization of Farms in Nigeria, 2005
TRADED COMMODITIES FARM GATE PRODUCT
ASSEM-BLED RAW MATERIAL
PROCESSED RAW MATERIAL Chips Pellets Starch
PROFITABILITY
INDICATORS
FAM
GM (US$) NET PROFIT (US$) GM/TVC (%) NET PROFIT/TC (%) ECF
GM (US$) NET PROFIT (US$) GM/TVC (%) NET PROFIT/TC (%) LCF
GM (US$) NET PROFIT (US$) GM/TVC (%) NET PROFIT/TC(%)
VALUE CHAIN
INDICATORS
FAM
DVA (US$) SV (US$) DVA/SV (%) DC/DVA (%) ECF
DVA (US$) SV (US$) DVA/SV (%) DC/DVA (%) LCF
DVA (US$) SV (US$) DVA/SV (%) DC/DVA (%)
149 149 379 370 19 -142 22 -57 127 107 539 246 36 40 90 96 229 249 99 100 41 43 96 97
-46 -46 -17 -17 45 45 25 25 -46 -46 -17 -17 269 274 98 99 161 182 89 92 283 285 99 99
85 84 27 27 85 84 27 27 84 83 27 27 282 312 90 99 266 313 85 95 286 314 91 99
-410 -410 -81 -81 -409 -409 -81 -81 -409 -409 -81 -81 413 504 94 99 367 508 72 89 421 506 83 99
-447 -447 -83 -83 -447 -447 -82 -82 -447 -447 -82 -82 454 542 89 100 410 546 75 91 462 544 85 99
-425 -425 -82 -82 -424 -424 -82 -82 -424 -424 -82 -82 428. 519 82 99 379 520 73 99 437 522 84 99
Source: Author’s computation

68
68
The ratio of DVA to SV is highest for ECF (99 percent) followed by LCF (96 percent) while that of FAM is the lowest (90 percent). Domestic cost of production as a proportion of DVA is also the highest for ECF (100 percent) followed by LCF (97 percent) while that of FAM (96 percent) is the lowest. This implies that the costs incurred by FAM in addition to the domestic costs of production constitute a higher proportion of the SV than it is the case for ECF and LCF. The results show that increasing commercialization of cassava production has not led to an improvement in the degree of competitiveness of the commodity in the international market.
Comparison of Cassava Shipment Values The shipment value consists of domestic costs and mark-ups, official duties and taxes, additional (unofficial) expenses and foreign costs. As noted earlier, domestic costs and mark-ups constitute a dominant part of the shipment value at each stage of the value chain. However, the structure varies not only from one stage to another but also among the three categories of farms. As shown in Table 3.11, composition of shipment values varies considerably across the farms and the various stages in the value chain. In general, domestic costs and mark-ups constitute not less 80 percent of the SV in each of the stages and for each category of farms. All the afore-mentioned items of cost are incurred at the farm product stage by all categories of farmers. The domestic costs and mark-ups are highest in each category followed by the foreign costs, unofficial expenses and official duties and tax. At the assembly and processing stages only the ECF can be associated with some cost on all the items. There was no cost incurred in the form of duties and
Table 3.11: Comparison of Composition of Cassava Shipment Values in Nigeria (%)
FAM ECF LCF
FARM
-Domestic costs and mark-ups -Official duties and tax -Additional expenses -Foreign costs -Total
80 2 4
14 100
88 1 3 8
100
93 1 2 4
100
ASSEMBLY
-Domestic cost and mark-ups -Official duties and tax -Additional expenses -Foreign costs -Total
98 - - 2
100
82 2 5
11 100
99 - - 1
100
PROCESSING
-Domestic cost and mark-ups -Official duties and tax -Additional expenses -Foreign costs -Total
90 - -
10 100
81 1 3
15 100
91 - - 9
100
Source: Author’s computation

69
69
tax as well as unofficial expenses that can be associated with the supply chain from the FAM and LCF categories. A comparison of the final shipment values for the cassava products among the three categories of enterprises shows that domestic costs and mark-ups seem to be highest in the case of FAM while they appear to be lowest in the case of ECF. On the other hand, foreign costs seem to be the highest in the case of ECF followed by LCF and lowest in the case of FAM. The highest level of unofficial extras is also observed in the case of ECF (see Figure 3.3). This finding implies that measures aimed at reducing cost at the farm product level in order to improve the competitiveness of the commodity will be different for the various categories of producers.
Comparison of Cassava Production and Market Indicators The production stage is very critical in the analysis of value chain. All the activities at subsequent stages in the value chain and decision by the producer to stay in business depend largely on critical variables that are associated with crop production. They include the crop yield, unit cost of production and price received by the farmer. A comparison of these and related variables among the three categories of farmers is apt to provide a better understanding of some of the constraints facing the farmers and the nature of support required to enable each category of farmers operate competitively and derive maximum benefits from the value chain. As shown in Table 3.12, cassava yield is very low, but it is lowest in the case of cassava ECF. The cassava FAM obtained the highest yield followed by the LCF. The price received by the farmers followed exactly the same pattern; it is highest in the case of FAM, followed by LCF while the ECF received the lowest price. As it turned out, the ECF is a high cost producer with negative returns. The high production cost incurred by the ECF is due to the cost associated with the fixed assets which cost is by far the highest among the three categories of farmers. The net return is apt to improve if there is a reduction in the cost of capital and increased access to markets that offer more remunerative prices.
Table 3.12: Comparison of Selected Cassava Production Indicators in Nigeria, 2005
FAM ECF LCF
1 Yield MT/Ha 9.15 3.6 5.0
2 Unit Cost of Production $/MT
40 248 44
3 Farm Gate Price $/MT
189 106 152
4 Variable Cost $/Ha 252 312 119
5 Gross Margin $/Ha 1,480 69 639
6 Net Return $/Ha 1,473 -513 539
Source: Author’s computation

70
70
Figure 3.3: Composition of Shipment Value for Cassava Enterprises in Nigeria
CASSAVA FAM
CASSAVA ECF
CASSAVA LCF
Source: Author’s computation
Composition of SV (USD per MT Traded Commodity)
-
100
200
300
400
500
600
CHIPS PELLETS STARCH Costs & Mark-ups Duties & Tax Unofficial Extras Foreign costs
Composition of SV (USD per MT Traded Commodity)
-
100
200
300
400
500
600
CHIPS PELLETS STARCH Costs & Mark-ups Duties & Tax Unofficial Extras Foreign costs
Composition of SV (USD per MT Traded Commodity)
-
100
200
300
400
500
600
CHIPS PELLETS STARCH Costs & Mark-ups Duties & Tax Unofficial Extras Foreign costs

71
71
Build-up of Cassava Final Shipment Value By Stage Analysis of the final shipment value is carried out on the basis of the incremental cost incurred (per 1 MT of raw material) at each stage of the value chain. Table 3.13 presents the cost structure for the three categories of farms. In the case of the cassava FAM the shipment value becomes more prominent at the processing and logistics stages; whereas the shipment values for the ECF and LCF tend to concentrate at the logistics stage. The proportion of the shipment value at the assembly stage is negligible except in the case of the ECF. Table 3.13: Build-up of Cassava Final SV in Nigeria By Stage (%)
FAM ECF LCF
Farm 7 2 2
Assembly 1 13 0
Processing 45 19 32
Trade 47 66 66
TOTAL 100 100 100
Source: Author’s computations
3.1.6 Impediments to Growth in the Cassava Industry
Production The problems of some pests e.g. grasshoppers, rodents e.g. grass-cutter, domestic animals like cattle, still persist. Although efforts at controlling the rodents by traditional practices seem to be in use, its effect at controlling the pests do not seem to be appreciable. The problems of the cattle under the control of the nomads, and the insects are still persistent. Another problem faced by the producers (farmers) is availability of land. This is particularly encountered in the southern parts of the country. Land is usually expensive to obtain and large area of land for farming is usually difficult to come by. The problems of desertification in the northern parts, erosion and flooding in the southern parts of the country militate against extensive cultivation of cassava crop. Environmental degradation through oil spillage is also a critical problem in the South – South geopolitical zone. The lack of mechanization in the production process of cassava in the country is a very important problem highlighted by the respondents. The cost of hiring labour and the tedium encountered in manual cultivation particularly during land preparation with local implements seem to discourage investment in cassava production. Processing. Equipment are generally not easily available, and when available, they are usually inefficient, their parts wear down easily, while the public power supply is very unreliable forcing the processors to depend on the expensive alternative of using power generators in the face of ever escalating cost of fuel for the generators. Marketing. Unattractive prices of products remain a serious problem. A situation where the cost of transportation due to poor state of the access roads, cost of fuel etc are added to the cost of production make the prices offered for the cassava tubers and processed products like garri and flour unattractive. There is need to ensure increased flow of funds to the cassava industry to encourage investment in the production, processing, and marketing of cassava.

72
72
3.2 Value Chain Analysis of the Cotton Industry
3.2.1 Review of Cotton Value Chain Studies in Nigeria
The most relevant work on cotton value chain in Nigeria is the study recently concluded by Yee and Paludetto (2005) which focused on the cotton textile industry in the country. The study divides the cotton textile value chain into five major activities – cotton growing, cotton ginning, yarn spinning, fabric weaving and fabric finishing (dyeing and printing). The value chain is investigated through a case study of a shipment of 204,000 metres of wax prints produced by a manufacturer whose plant is located in the northern part of the country. The plant has the capacity to produce 100,000 linear metres of wax fabric a day based on an integrated operation that gins cotton, spins yarn, weaves grey fabric and processes wax prints on the same site. However, garment production is excluded from the chain of value adding activities at this time. For this shipment, the purchase order is placed by a buyer in Mali on a cost and freight basis with a landed value of 38.7million naira (or 190 naira/metre). This order takes about 50 days to deliver that involves cross-border transport by truck which takes 15 days. However, the cycle of activity to meet this order goes back much earlier in time, beginning with the financing of farmers in the field to grow cotton followed by harvesting over a 5-month season and subsequent processing of cotton material through ginning, spinning, weaving, dyeing and printing into wax African print. This is a long processing cycle characterized by lengthy storage periods that carry a high inventory cost driven by the capital carrying charge for the cotton material. Each stage of processing is linked together in a chain that adds value as a result of activities engaged in inbound logistics for intermediate/raw materials, processing of intermediate inputs together with primary inputs into a fabricated product, and outbound logistics of the fabricated product. The main findings of the study can be summarized as follows.
Competitive Pricing and High Intermediate Input Cost are Squeezing Value Added With the high cost of intermediate inputs and downward pressure in the price of printed fabric, there is difficulty in expanding value added along the chain in spite of increased processing. This is demonstrated by the pattern of value added of 7.3 million naira for yarn, 5.8 million naira for grey cloth, and 7.9 million naira for wax print. These added values also represent 47%, 26% 20% of shipment value respectively for yarn, grey cloth and wax print, a distinctly declining trend. As a consequence, the residual amount of value added left in the chain leaves little room to compensate for the use of primary inputs and logistics. Value Added is Insufficient to Meet the Full Cost of Value Adding Activities Values added along the chain are inadequate to cover the cost of primary inputs and logistics. As a consequence, there are no surpluses to distribute to profit. For example, in yarn spinning, value added of 7.32 million naira is spent on covering logistics costs of 1.73 million naira (24% of value added) as well as primary input costs of 5.59 million naira (76% of value added) that include depreciation, debt financing, labor, overheads, and utilities (power, steam, water). Accordingly, there are no residual resources left to reward risk equity capital and therefore no profit is accrued. Although this type of integrated operation is expected to be logistically more efficient compared to a non-integrated operation where the spectrum of value adding activities is divided and intermediate materials are sourced outside from producers in the chain, this integrated producer encounters significant problems that jeopardize business survival. According to Yee and Paludetto (2005), the major constraints to the value adding process are (i) unreliable

73
73
supply and high cost of utilities, (ii) high capital charge (depreciation, debt interest charges), (iii) poor labour performance and (iv) burdened management as reflected in relatively high cost of administrative overheads. The producer struggles to offset the cost of intermediate inputs and other non-capital related value adding inputs from the receipt of sales. This example, leads to an operating loss of about N4.7 million which represents -60% of realized value added. 3.2.2 World Market Structure
The economic importance of cotton in many developing countries is significant especially in terms of its contribution to household income and national revenue. It contributed between 30 and 44 percent to total merchandize exports in 5 West African cotton-producing countries (Benin, Burkina Faso, Chad, Mali, Togo) during 1998-99. According to Baffes (2004), the corresponding figures for Uzbekistan, Tajikistan, and Turkmenistan were 32, 15, and 12 percent, respectively. Cotton’s contribution to the GDP of these countries has been substantial, ranging between 3.6 percent (Turkmenistan) and 8.2 percent (Tajikistan). In Africa, cotton is typically a smallholder crop, it is grown in rain-fed land and the use of purchased inputs such as chemicals and fertilizers is minimal. The United Nations Food and Agriculture Organization (FAO) estimated that about 100 million rural households were involved in cotton production worldwide in 2001. Among the countries in which cotton is an important contributor to rural livelihoods are China, India, and Pakistan—where 45, 10, and 7 million rural households, respectively were engaged in cotton production. In Africa cotton producing countries, including Nigeria, Benin, Togo, Mali, and Zimbabwe, the number of rural households depending on cotton totaled 6 million. The cotton market has been exposed to considerable market interventions - subsidization in the US, EU, and China and taxation in Africa and Central Asia. In 2002, support to the cotton sector by major players reached almost $6 billion, more than one quarter of the global value of production (Baffes, 2004).
About 33 percent of cotton production is traded internationally. The four dominant cotton exporters—the United States, Uzbekistan, Francophone Africa, and Australia - account for more than two-thirds of world exports. Four major producers—China, India, Pakistan, and Turkey—import cotton to supply their textile industries. However, the eight largest importers account for more than half of world cotton imports. The four East Asian textile producers—Indonesia, Thailand, Taiwan, and Korea—accounted for 22 percent of world cotton imports in 2002, compared to just 3 percent in 1960. Real cotton prices have declined over the last two centuries, although with temporary spikes. The reasons for the long-term decline are similar to those characterizing most primary commodities: on the supply side reduced production costs due to technological improvements and on the demand side stagnant per capita consumption and competition from synthetic products. Reductions in the costs of production have been associated primarily with a doubling of yields, from 300 kilograms per hectare in the early 1960s to surpass 600 kilograms per hectare in 2000. The phenomenal growth in yield has been aided primarily by the introduction of improved varieties, expansion of irrigation and use of chemical fertilizers. Additional diffusion of GM varieties and precision farming, introduced during the 1990s, are expected to further reduce the costs of production (Baffes, 2004).
In Africa, while cotton production has been increasing steadily, just as export of the commodity has maintained an upward trend. However, due to the low level of development of the textile industry especially in West Africa, the level of consumption has been very low and there has been virtually no import. The consumption pattern of cotton is primarily determined by

74
74
the size of the textile industries of the dominant cotton consumers. China, the leading textile producer, absorbed more than one-quarter of global cotton output during the late 1990s. Other major textile producers (and hence major cotton consumers) are India, Turkey, and the United States, which together with China account for three-quarters of global cotton consumption. Several East Asian countries have emerged recently as important cotton consumers. For example, Indonesia, Korea, Taiwan, and Thailand, which together consumed only 130,000 tons in 1960 (1.2 percent of global consumption), absorbed 1.5 million tons in 2002 (7.2 percent of global consumption). Between 1960 and 2000, cotton demand has grown at the same rate as population (1.8 percent per annum) implying that per capita cotton consumption has remained stagnant. By contrast, consumption of chemical fibers has increased consistently over the last four decades, causing cotton’s share in total fiber consumption to decline from 60 percent in 1960 to less than 40 percent in 2000 (Baffes, 2004). 3.2.3 Nigerian Cotton Market Structure Since abolition of the Cotton Board in 1986 and the deregulated of the market as part of the Structural Adjustment Programme at that time, operations in the cotton market has been following the dictates of the forces of supply and demand. The price of cotton is determined in an open market between buyers and sellers. There are over forty textile mills in the country and a similar number of ginneries, which compete for this cotton. Consumption of cotton lint by textile industry in Nigeria is about 100,000 tonnes plus or minus 15 percent. Textile mills are therefore forced to import about 15,000 tons of cotton in order to cover the shortfall in local supply and for certain specific requirement for finer yarns such as 30-40’s, which is not grown locally. It is therefore clear that the local supply is not enough to meet the demand. Against a total demand of about 80,000 MT of lint per annum (240,000 MT seed cotton) by the textile mills, the total production of lint has been less, thus resulting in a gap between demand and supply. It is expected that this gap will widen further as the steps taken by the government to revive the textile industry may lead to increase in capacity utilization, thus resulting in higher demand for cotton. Since 1989, Nigerian cotton is exported after about ten years of absence in the international market. Prices of cotton in the international market have been unstable but high. This was because of increased demand from cotton consuming countries like China, which had an adverse weather and an increase in consumption and export. China’s textile industry has urged the government to double cotton imports in 2004 to help the industry to recover from shortage (RMRDC,2004).
Nigeria has also been involved in cotton seed import as production and marketing activities faced more severe constraints in recent times than hitherto has been the case; while export has been on the decline. Available data from the National Bureau of Statistics (NBS) indicate that the value of cotton seed export as at 2002 when the Federal Government introduced the Presidential Initiatives on Agriculture (PIA) programme which emphasized export expansion, stood at �11.10 million and since then there has been no official record of exports. As regards imports of cotton seeds, the value increased from �6.43 million in 2002 to �10.55 million (or by 64 percent) in 2004.
3.2.4 Characterization of the Cotton Value Chain Cotton is the most important vegetable fibre used in spinning. Presently there are six varieties of cottonseed. Samcot 9 is of the short medium staple variety being grown in the Northwest region comprising Sokoto, Kebbi, Kano, Katsina, Zamfara, Jigawa and Kaduna States. Samcot 10 is

75
75
also used in this region. Samcot 8 is for the North East, also short-medium variety mainly grown in Adamawa, Taraba, Borno, Yobe, Gombe, and Bauchi States. In 2003, the National Seed Varietal Release Committee (NSVRC) approved the release of samcot 11, 12 and 13, which are of long staple. Samcot 11 is for the rain fed southern states where there is adequate rainfall. Samcot 13 is for the Northern ecological zone under irrigation. Movement of seeds across regions has been going on over the years resulting in some instances in contamination and loss of viability. The Cotton Revolving Fund Management Committee (CRFMC), which was saddled with the responsibility of seed purification and development, took up the responsibility to purify and restrict movement of seeds across the regions. This has successfully been concluded in the North East and is ongoing in the North West.
Nigeria’s cotton is known internationally as poly contaminated. This is due to the use of polypropylene bags by farmers to pick and deliver their seed cotton to buyers and ginneries. In the process particles of the poly bag do get mixed up with the cotton during ginning, spinning and even weaving. The damage will be seen only at the dyeing stage, thus most of the cotton lint, yarn or grey exported is discounted because there is no dye guarantee. Efforts are currently being intensified by stakeholders, which have led to the reduction in poly contamination. Firstly, at the buying level both at farm gate and market, farmers are encouraged to use other packaging materials rather than poly bags. In some cases agents issue out cloth sacks, baskets or jute bags to farmers and encouraged them to pick their cotton in those containers. This is called poly free cotton. Buyers pay a premium price for such cotton. Secondly, ginneries have also developed an ingenious ways of reducing the poly contamination using rolling spikes on the suction floor. There is also the manual picking of poly threads to reduce the contamination. Cotton produced in this way is called poly reduced.
Production and Cropping System
The world zone of cotton production lies between 37oN and 32oN latitude. Cotton (Gossypium
hirsutum) is grown on over 33 million hectares world wide, from which 12 million metric tons has given an average yield of 0.35 MT/ha. Cottonseed production exceeds 24 million metric tons. In Nigeria, two broad agronomic zones have been identified. These are; Northern and Southern Cotton Zones. Cotton is cultivated in Nigeria on 0.6 – 0.8 million hectares annually. The major producing areas in the North are Katsina, Kaduna, Zamfara, Kano, Jigawa, Bauchi, Gombe, Plateau, Yobe, Borno, Taraba and Adamawa states. The southern cotton zone comprises Kwara, Ogun, Ondo and Oyo States. A greater majority of cotton farmers are the small to medium holders. The average land holding is two hectares. This constitutes over 80 percent of the farmers. There exist very few large cotton farms with average holding of about 15.2 hectares. The crop harvest is seldom mechanized. Only few large-scale farms do that. Cotton is hand picked usually three times. The first picking begins about ten days after the opening of the first fruit (bolls). The other two pickings follow each other after an interval of a little over one week. It is important to sort the cotton straight away during harvesting into white, stained and waste cotton. The cotton has to be as dry as possible. Hand picked cotton is of high grade and fetches a better price than machine harvest cotton (RMRDC, 2004). The production of cotton takes place in three out of the six agro-ecological zones in the country. Production is concentrated in the northern part of the country especially the Northwest. Available data show that annually from 1999 to 2004, over 80 percent of the cotton produced came from the Northwest zone (Table 3.14). During the period production followed a positive trend in each of the zones (Fig. 3.4). Similarly, the land area cultivated to cotton maintained an

76
76
increasing trend (Fig. 3.5). However, there is no significant increase in yield. Average yield during the period ranges from 0.88 MT/ha in NC to 1.06 MT/ha in NE. Table 3.14: Cotton Production in Nigeria, 1999-2004
Zone 1999 2000 2001 2002 2003 2004
NORTHWEST
-Area(‘000Ha) -Output(‘000MT) -Share of Total (%) -Yield (MT/Ha)
276.84 271.78 89.04 0.98
256.07 268.26 83.76 1.04
259.00 272.00 81.94 1.05
313.00 299.00 84.63 0.95
307.34 294.00 80.94 0.96
311.15 308.21 89.15 0.99
NORTHEAST
-Area(‘000Ha) -Output(‘000MT) -Share of Total (%) -Yield (MT/Ha)
20.99 17.41 5.70 0.85
41.99 35.83 11.19 0.853
27.77 38.37 11.56 1.40
25.78 36.3 10.27 1.44
40.66 36.58 10.07 0.9
40.81 37.5 10.85 0.925
NORTHCENTRAL
-Area(‘000Ha) -Output(‘000MT) -Share of Total (%) -Yield (MT/Ha)
20.04 16.03 5.25 0.80
19.31 16.2 5.04 0.84
23.718 21.583 6.50 0.91
19.00 18.00 5.09 0.95
34.45 32.66 8.99 0.94
ALL ZONES
-Area(‘000Ha) -Output(‘000MT)
317.90 305.20
317.37 320.30
310.49 332.00
357.80 353.30
382.45 363.20
352.00 345.70
Source: Underlying data from the Project Coordinating Unit of the Federal Ministry of Agriculture and Rural Development, Abuja

77
77
Fig. 3.4: Cotton Production in Nigerian
Agro-Ecological Zones
0
50
100
150
200
250
300
350
1999 2000 2001 2002 2003 2004
Year
Ou
tpu
t ('
00
0 M
T)
NW
NE
NC
Fig. 3.5: Land Area Cultivated to
Cotton in Nigerian Agro-Ecological
Zones
0
50
100
150
200
250
300
350
1999 2000 2001 2002 2003 2004
Year
'00
0 h
a NW
NE
NC

78
78
3.2.5 Results of the Cotton Value Chain Analysis
The analysis focuses on key indicators of profitability in the cotton value chain (production, assembly, processing, trade) as well as the indicators of performance of the value chain with a view to determining the international competitiveness of the commodity. Cotton production is largely in the hands of small-scale farmers thus, the production stage of the analysis is limited only to the family farm (FAM). (a) Financial Costs and Profitability Indicators
The analysis keeps track of the build-up of financial costs at every stage of the value chain and this reveals the contribution of the various cost items. Whereas variable costs constitute a large proportion (94 percent) of total financial costs at the production stage, crop purchases are the major component in each of the other stages. Nonetheless, for comparative purposes, the crop purchase price is often excluded from the build-up of financial costs. At the production stage, labour cost is the single largest component (64 percent) of financial costs followed by seeds, fertilizer and chemicals (30 percent). The other stage where there is concentration of cost on a particular activity is the logistics stage where 78 percent of the cost is accounted for by transportation to delivery point. At the assembly stage, the cost is spread among vehicle hire (33 percent), depreciation (33 percent), hired labour (23 percent) and fees and crop levies (11 percent). At the processing stage, the major cost components are overhead and licence, energy and machine operation, hired labour and depreciation in that order (Table 3.15).
Table 3.15: Structure of Financial Costs in Cotton Enterprises (FAM) (percent)
COST ITEMS FARM
PRODUCT
ASSEMBLY PROCESSING LOGISTICS
Hired Labour 64 23 25
Seed, Fertilizer & Chemicals 30
Loading & Storage 11
Transport to Delivery Point 78
Vehicle Hire 33
Fees & Crop Levies 11
Custom Duties & Tax 2
Plant Repair & Maintenance 2
Overhead & Licence 31 9
Energy & Machine Operation 27
Depreciation 6 33 15
TOTAL 100 100 100 100
Source: Author’s computations
The results show that operating profit and net profit are positive at every stage of the value chain. At the production stage, the gross margin is US$28.55 while net profit is US$17.56; whereas at the assembly stage, the gross margin and net profit are US$76.82 and US$69.57. Profitability is lowest at the processing stage judging by the level of gross margin (US$7.70) and net profit (US$5.29). Moreover, the rate of return attained at the processing stage is about one percent compared to 26 percent at the assembly stage and 7 percent at the production stage. Profit is highest at the trading stage. Cotton lint trade attracts net profit of US$472.88 with 58 percent rate of return while net profit for cotton seed trade is US$278.45 with 91 percent rate of return (Table 3.16).

79
79
Table 3.16: Profitability Indicators of Cotton Enterprises (Per MT) (FAM)
Source: Author’s computation
Cotton Lint Cotton Seed NGN USD NGN USD Gross revenue 170,016 1,288.00 77,352 586.00 Production costs Crop purchase 90,000 681.82 23,000 174.24 Other variable costs 17,596 133.30 17,596 133.30 Investment costs - - - - Total costs 107,596 815.12 40,596 307.55 Final income Gross margin 62,420 472.88 36,756 278.45 Net profit 62,420 472.88 36,756 278.45 Rates of return Gross margin/total VC 0.58 0.91
Net profit/total costs 0.58 0.91
NGN USD NGN USD NGN USD Gross revenue 35,000 265.15 45,000 340.91 47,790 362.05 Production costs
Crop purchase - 33,000 250.00 45,000 340.91 Other variable costs 31,231 236.60 1,860 14.09 1,774 13.44 Investment costs 1,451 10.99 957 7.25 318 2.41
Total costs 32,682 247.59 35,817 271.34 47,092 356.76 Final income
Gross margin 3,769 28.55 10,140 76.82 1,016 7.70 Net profit 2,318 17.66 9,183 69.57 698 5.29
Rates of return Gross margin/total VC Gross margin/total VC 0.12 0.29 0.02
Net profit/total costs 0.07 0.26 0.01
FARM GATE PRODUCT RAW MATERIAL
PROCESSED RAW MATERIAL
ASSEMBLED

80
80
(b) Value Chain Indicators
The transformation of cotton into cotton lint and cotton seed results in considerable increase in value along the chain. The transformation of cotton into cotton lint, is associated with an increase in shipment value from US$219.73 at the cotton production stage to US$815.11 at the stage of trading in cotton lint representing an increase of about 271 percent. For cotton seed, the shipment value increases from US$219.73 to US$307.55 or by about 40 percent (Table 3.17). Cotton production yields a value added (US$219.72) which represents 89 percent of the shipment value. Value added also represents a high proportion of the shipment value of both cotton lint (88 percent) and cotton seed (81 percent) trade. In respect of cotton lint, 92 percent of the DVA is accounted for by domestic costs and mark-ups while in the case of cotton seed domestic costs and mark-ups account for 94 percent of the DVA.
For the purpose of determining the international competitiveness of cotton lint and cotton seed, the final shipment values are compared with the relevant export parity price. The final SV for cotton lint (US$815.11) is lower than the export parity price (US$1,196) implying that Nigerian cotton lint is competitive at the international market. With regard to cotton seed, the final SV (US$307.55) is also lower than the export parity price (US$494) implying that the commodity is competitive at the international market. The composition of shipment values shows considerable variation within each stage but not across the various stages in the value chain. In general, domestic costs and mark-ups constitute not less 80 percent of the SV in each of the stages. This is followed by the foreign costs, unofficial expenses and official duties and tax (Table 3.18).
Analysis of the final shipment value is also carried out on the basis of the incremental cost incurred (per 1 MT of raw material) at each stage of the value chain. As shown in Table 3.19, the proportion of the shipment value at the trade logistics stage is the highest. It is closely followed by the farm product stage; whereas the proportions are much lower at the assembly and processing stages. By these results, it is clear that efforts aimed at reducing cost in the cotton value chain should be concentrated at the logistics and the production stages. Moreover, domestic costs and mark-ups are the major items that should be the focus of attention relative to foreign costs, official duties and tax and unofficial expenses.

81
81
Table 3.17: Cotton Value Chain Indicators in Nigeria (Per MT)
Source: Author’s computation Table 3.18: Composition of Cotton Shipment Values in Nigeria (%)
FARM PRODUCT
ASSEMBLY PROCESSING TRADING LOGISTICS
Cotton Lint
Cotton Seed
Domestic costs & mark-ups
82 81 84 81 70
Official duties and tax 2 2 2 3 5
Additional expenses 5 5 4 4 6
Foreign costs 11 12 10 12 19
Total 100 100 100 100 100
Source: Author’s computation Table 3.19: Build-up of Cotton Final SV By Stage (%)
Farm 39
Assembly 8
Processing 4
Trade 49
Total 100
Source: Author’s computation
NGN USD NGN USD NGN USD Domestic Value Added
Costs & mark-ups 26,919 203.93 28,996 219.67 39,582 299.86 Official duties & tax 529 4.01 723 5.48 1072 8.12 Additional costs 1,556 11.79 1,665 12.61 1663 12.60
Total DVA 29,004 219.73 31,384 237.76 42,317 320.58 Foreign costs 3,679 27.87 4,432 33.58 4,775 36.17
Total Shipment Value 32,683 247.60 35,816 271.33 47,092 356.76
NGN USD NGN USD NGN USD Domestic Value Added
Costs & mark-ups 86,974 658.89 28,322 296.86 - Official duties & tax 3,255 24.66 2,075 9.53 - Additional costs 4460 33.79 2620 1.16 -
Total DVA 94,689 717.34 33,017 307.55 - - Foreign costs 12,906 97.77 - 7,579 - -
Total Shipment Value 107,596 815.11 40,596 307.55 - -
Cotton Lint Cottonseed
PROCESSED
TRADED COMMODITIES (1 MT Final Traded Product)
PRODUCT RAW MATERIAL RAW MATERIAL FARM GATE ASSEMBLED

82
82
3.2.6 Impediments to Growth in the Cotton Industry
(a) Production Constraints
� Farmers accord higher priority to food crops than cotton take an economic decision in most cases to cultivate food crops as against cotton. Arguably, food crops can be used at home and as well exchanged for other essentials whereas cotton can only be used to exchange for cash or other items.
� Farmers tend to reduce the area cultivated to cotton in reaction to poor prices and market dynamics.
� Since agriculture in Nigeria is mostly rain-fed, timely arrival of rain is critical. Farmers often take a decision against the cultivation of cotton due to late arrival of rain. The arrival of rain is as important as its cessation in maximizing yield. If rain continues beyond a particular time, it may lead to drastic reduction in output.
� Inadequate and untimely supply of inputs � Seed contamination also leads to reduction in yield. The seeds approved for the two
major cotton-growing regions - North East and North West, are samcot 8 and samcot 9
respectively. There is the tendency for these seeds to be to be mixed up as they are transported from one region to the other. This can happen either through buyers of the seed cotton or oil mills. The mixing could lead to loss of viability and low yields.
� Unavailability of funds at critical times also affects production. In this case funds from household sources are scarce or non-existent. Farmers and operators are thus forced to take loans at commercial rates to finance the production of cotton. Recently, however, there exist a window of opportunity through the Nigerian Agricultural, Cooperative and Rural Development Bank (NACRDB) where loans for cotton cultivation are given at 8% interest rate.
� The impact of government policy towards the agricultural sector in general and cotton in particular also affects cotton production. Policies such as subsidy on inputs like fertilizers, provision of tractors at moderate rates for land preparation exist but only a few farmers have access to the goods and services provided.
(b) Marketing Constraints
� Possibility of adulteration of seed cotton. (e.g. sprinkling of water, adding stones to seed cotton to gain extra weight)
� Standard of cotton quality not assured. � Cottonseed multiplication system in disarray. � Different varieties are indiscriminately cultivated. � Use of polypropylene bags by farmers for packing cotton lint. � Difficulty in controlling farmers’ practices and the ginners � Absence of institutional arrangement for commodity grading and quality control

83
83
3.3 Value Chain Analysis of the Maize Industry
3.3.1 Review of Maize Value Chain Studies in Nigeria
Studies in different parts of Nigeria have examined some aspects of commercialization and competitiveness of maize enterprises and have shown that maize production has been highly profitable in various agro-ecological zones across the country (NISER, 2001). The studies show that gross margins for maize enterprises vary widely; ranging from N1,090 in the Northwest zone to N49,000 in the South-South zone (see Table 3.20). The authors attributed the variations to differences in production systems and varying prices across the zones. It was also found that the trend of profitability in the country has been on the increase over the years. For instance, gross margins of N86.95 and N402 were obtained in 1985 and 1989 respectively for maize cultivated under the traditional production system, while gross margins of N607.75 and N1,310.50 were obtained during the same period for maize cultivated under improved system in Nigeria (Table 3.21). Despite the empirical nature of the studies and their extensive geographical coverage, major gaps remained when compared to the present study. They have tended to focus attention on profitability indicators to the utter neglect of value chain indicators. Moreover, the analysis is more often than not limited to operating profit. Besides, the profitability indicator is often expressed on per hectare basis making it difficult to have a comparison between the unit cost of production and the operating profit per unit of output. These weaknesses will be redressed in this study.
In a more recent study of maize commodity chain in Nigeria, Ahmed et al (2005) examined the market institutions that regulate its operations with emphasis on access to market information, credit facilities and transport infrastructure. The study focused on two major bulking markets in the main maize production areas of Northwest and North-central zones of Nigeria. The study provides a rough estimate of the commission of buying agent (.55 percent of producer price) while the assembler’s profitability was put at 6.2 percent and concludes that the maize markets are fairly competitive. Some of the constraints identified by the study are (i) inadequate access to formal credit facilities, (ii) inadequate security for goods in transit, (iii) poor market infrastructure, (iv) unofficial charges by a diverse range of actors and (v) lack of formal insurance. The study suggests the following interventions to enhance the performance of the maize commodity chain.
� Transport sector improvements are essential across the maize distribution chain. This requires a concerted effort from central, state and local governments, together with donor support. Currently poor producers suffer substantial losses from: failure to evacuate products from producing areas and get them to the most profitable markets at the right time due to poor roads and unreliable transport; diversion of goods in transit by corrupt transporters and highway robbers; extortion from state officials during transit. These losses reduce prices for producers, reduce profits for traders and manufacturers and raise prices for consumers. Although informal insurance operates among richer traders who support one another when losses occur, poor producers do not have the same safety net. NGOs should be encouraged to find ways to empower transporters to resist unofficial payments, such as through radio phone-in programmes.
� Rent-seeking behaviour by state officials is widespread in the maize industry (and not only within the transport component), and must be reduced if the benefits of increased maize demand are to be translated into increased income for poor producers. This could be assisted by more timely payment of salaries in the public sector.

84
84
Table 3.20: Gross Margin in Maize Production in Nigerian Agro-Ecological Zones
Naira/ha
North-West Zone
North-East Zone
North-Central Zone
South-West Zone
South-East Zone
South-South Zone
Labour
15,170
4.58
12,300
15,825
20,600
20,000
Seed
750
7,333
500
2,625
1,000
-
Fertilizer
6,000
10,000
12,000
11,700
4,000
7,200
Herbicide
-
5,050
4,000 -
7,800
Seed dressing
-
500
- - -
Insecticide 750
- - Transportation
720
-
1,000
3,000
Bags
720
1,650
600
-
Tractor
5,500 20,000
Water application
3,000
Total Variable Cost
24,110
20,893.79
31,950
42,650
27,600
55,000
Total Value of Output
25,200
62,700
35,720
64,750
75,000
104,000
Gross Margin
1,090
17,880.4
3,770
22,100
47,400
49,000
Source: NISER, 2001
Table 3.21: Gross Margin Analysis per Ha of Selected Enterprises Naira/ha
Source
Year
Enterprise
Total Variable Cost
Total Value of Output
Gross Margin
CBN/NISER (1992) “ “
1985 1989 1985 1989 1985 1989
Maize (Unimproved) “ “ Maize (Improved) “ “ Swamp rice (Improved)
438 648 517 939 1857 4,106
525 1050 1125 2250 3000 5400
87 402 608 1310 1143 1294
Source: Adapted from NISER, 2001

85
85
� Local government control over space/stall allocation in markets often leads to rent-seeking behaviour among elites and damages the interests of poorer traders, especially women. A national study, supported by central government, is needed to examine the potential benefits, difficulties and processes of contracting out revenue collection and market management to private companies. This would be best conducted by an NGO or research institution.
� Small farmers’ dependence on dillalai (commission agents) for credit (which reduces their flexibility in marketing) could be reduced by credit schemes specifically targeted at small producers: these need to provide much more timely credit with far less paperwork than conventional schemes (which commonly respond far too slowly and without consideration for credit needs over the farming year). Interest charges which are higher than conventional bank schemes would be needed to cover the costs of such schemes, but could still be lower than rates often charged by informal and family credit providers. Collaboration between private sector banks and NGOs could probably best achieve this.
� Better regulation to ensure trader’s correct use of standardized measures is needed in the maize sector. Market associations and/or independent NGOs would probably be the best group to undertake such regulation. NGOs could offer market-based education to poor buyers and sellers who need knowledge and experience of standard measures and how to identify potentially adulterated produce. The relevance of the study to the issue of competitiveness is not in terms of analysis of
value addition at specific stages within the chain but in terms of identifying constraints within the chain and suggesting ways of eliminating them. The study mainly employed qualitative techniques and did not address in specific details the issue of international competitiveness of maize. This is the lacuna being filled by the current study.
3.3.2 World Market Structure
The demand and supply of maize depend on several factors which are often difficult to predict. This derives from its use not only for human consumption but also for livestock production. By and large, maize trade will be affected by the domestic production environment, exchange rates, as well as population and income growth. Considering world commodity prices for maize from 1997-2002, the percentage change over previous year range from –25.3 to 4.2 in 1997 and 2001 respectively (UNCTAD, 2003). The price increase was as a result of drought and unfavorable weather conditions in the major producing areas. Price declines are expected as a result of high levels of stocks and weak demand from industry. Supply of maize is harder to project than demand because production could change dramatically in response to policy changes, which are very difficult to predict – maize producer subsidies in the European Union (EU) and the United States of America (USA) are currently encouraging chronic over production. Surplus grain is sold at the international market or given away as food aid, depressing international prices and undermining production incentives in other countries. Thus, if the EU and USA continue to support maize production, global markets are likely to remain awash in grain, international prices are likely to remain low and current production patterns are unlikely to change significantly (CIMMYT, 2004). At the global level, supply of maize will keep pace with demand for the foreseeable future, since most of the major producing countries and regions have considerable capacity to expand production quickly in response to favorable changes in price incentives. Most of the maize produced in the USA, China and Brazil (the three largest maize producing countries), will be yellow maize destined for domestic and international feed markets. Assuming
86
86
no radical changes in current policies, the USA will remain the world’s dominant maize exporter, while the EU, East Asia and South East Asia will remain major maize importers. While the overall global picture is one of increasing trade in maize, there will be exceptions. Some developing countries including Nigeria will continue to make limited use of international markets because of the high transportation costs involved in accessing them.
A major shift in global cereal demand is underway. By 2020, demand for maize in developing countries will surpass the demand for both wheat and rice. Maize requirements in the developing world alone will increase from 282 million tonnes in 1995 to 504 million tons in 2020 (IFPRI, 2003). The challenge of meeting this unprecedented demand for maize is daunting, especially for the developing world with its level of subsistence farming. Rising incomes and the subsequent growth in meat and poultry consumption will result in a rapid increase in the demand for maize as livestock feed (especially for poultry and pig). In the least developed parts of the world, unabated population growth and the persistence of poverty will maintain upward pressure on the demand for food maize. Relative to 1995 level, annual maize demand in sub – Saharan Africa is expected to double to 52 million tonnes by 2020. Global population growth will stimulate demand for the crop at an annual rate of approximately 3 percent in this century. Raising incomes will translate into increased demands for maize, both for livestock feed and human consumption. At higher income levels, the demand for maize for food may diminish, but this effect will be more than offset by an increase in demand for maize used as feed and or in industry.
3.3.3 Nigerian Maize Market Structure
There is still considerable gap in the demand and supply of maize in the country. The gap could be reduced through expansion of land for maize production, rotation, mixed cropping and production of the crop under irrigation where possible. Domestic demand for maize continues to be largely driven by the evolution of traditional markets (e.g. feed and food markets) as well as by industrial use and the development of alternative uses for maize. Maize demand in the country can be estimated to increase at an average of 3.2 percent per year. Traditionally considered a subsistence crop, maize is now transformed into a commercial crop owing to the demands of the feed and poultry industries. Maize producers have become more market oriented and open to the adoption of improved technologies. In the next two decades, the composition of demand for maize will likely change, with feed use of maize increasing more rapidly than food use. As a result of projected faster growth in feed use, the market for yellow maize will expand relative to that for white maize. A lot of the maize produced in the guinea savanna zone of the country is transported to different parts of the country, north, west and east. Despite the determination of the government to double the output of maize and promote export, it has not been possible to export maize in Nigeria and the country continue to rely on importation in an attempt to satisfy industrial demand. Due to foreign exchange limitations and competing import demand, however, maize import has declined considerably since 2002 (see Fig. 3.6). This has further reduced the supply of the commodity in the country.

87
87
3.3.4 Characterization of the Maize Value Chain
Maize Production and Cropping System The cultivation of maize in Nigeria is performed in two major ways depending on the environment and customs of the people concerned. Sole cropping is seldom practiced; the great majority of the maize crop is grown as mixed crop with yam, cassava, guinea corn, rice, cowpea, groundnut, soybeans etc. Maize is typically intercropped with other food crops, with the predominant combinations varying by production zones. When grown in mixtures the maize is usually in low density mixed with one or more associated crops including cassava, sorghum, pumpkin, cowpea, groundnut, yam, sweet potato, rice, vegetables etc. Mixed cropping lowers maize yields, but it helps farmers increase the overall productivity of the resources invested in agriculture and reduces losses if any of the crops fails. However, some farmers grow a super imposed mixture of the maize with legumes particularly groundnut, soybean and cowpea. In the case of groundnut and soybean, the crops are intercropped at the onset of the season while cowpea is usually planted three to four weeks after the maize relay. The population of the legume is usually lower and optimum population of the maize is maintained which results in higher yields. A common mixture is also that of maize with either millet or sorghum or all the three in few instances. All combinations with maize were found to yield better than the standard millet/sorghum mixture suggesting that inclusion of maize increase the total grain yield of the crops. Despite the fact that maize in the savanna regions is usually grown in mixed stands, monocropped maize is becoming prevalent for all categories of farmers (small, medium and large scale farmers).
As shown in Table 3.22, maize is produced in all the agro-ecological zones in the country. The trend of maize production does not show any significant improvement between 1999 and 2004. Clearly, it shows that the NC is the leading producer of maize in Nigeria. The contribution of this zone to total maize production averaged 34.13% during the period while the
Fig. 3.6: Trend in Maize Import in Nigeria,
2002-2005
0
50
100
150
200
250
300
350
2002 2003 2004 2005
Year
mil
lio
n n
air
a
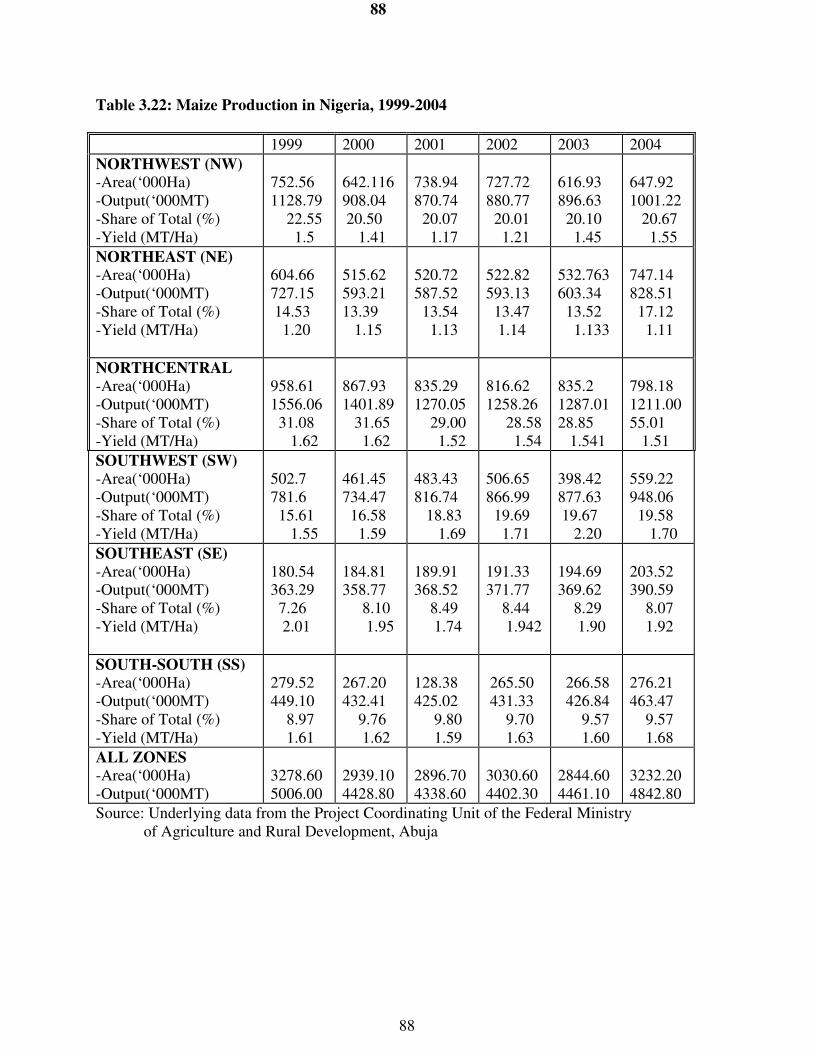
88
88
Table 3.22: Maize Production in Nigeria, 1999-2004
1999 2000 2001 2002 2003 2004
NORTHWEST (NW)
-Area(‘000Ha) -Output(‘000MT) -Share of Total (%) -Yield (MT/Ha)
752.56 1128.79 22.55 1.5
642.116 908.04 20.50 1.41
738.94 870.74 20.07 1.17
727.72 880.77 20.01 1.21
616.93 896.63 20.10 1.45
647.92 1001.22 20.67 1.55
NORTHEAST (NE)
-Area(‘000Ha) -Output(‘000MT) -Share of Total (%) -Yield (MT/Ha)
604.66 727.15 14.53 1.20
515.62 593.21 13.39 1.15
520.72 587.52 13.54 1.13
522.82 593.13 13.47 1.14
532.763 603.34 13.52 1.133
747.14 828.51 17.12 1.11
NORTHCENTRAL
-Area(‘000Ha) -Output(‘000MT) -Share of Total (%) -Yield (MT/Ha)
958.61 1556.06 31.08 1.62
867.93 1401.89 31.65 1.62
835.29 1270.05 29.00 1.52
816.62 1258.26 28.58 1.54
835.2 1287.01 28.85 1.541
798.18 1211.00 55.01 1.51
SOUTHWEST (SW)
-Area(‘000Ha) -Output(‘000MT) -Share of Total (%) -Yield (MT/Ha)
502.7 781.6 15.61 1.55
461.45 734.47 16.58 1.59
483.43 816.74 18.83 1.69
506.65 866.99 19.69 1.71
398.42 877.63 19.67 2.20
559.22 948.06 19.58 1.70
SOUTHEAST (SE)
-Area(‘000Ha) -Output(‘000MT) -Share of Total (%) -Yield (MT/Ha)
180.54 363.29 7.26 2.01
184.81 358.77 8.10 1.95
189.91 368.52 8.49 1.74
191.33 371.77 8.44 1.942
194.69 369.62 8.29 1.90
203.52 390.59 8.07 1.92
SOUTH-SOUTH (SS)
-Area(‘000Ha) -Output(‘000MT) -Share of Total (%) -Yield (MT/Ha)
279.52 449.10 8.97 1.61
267.20 432.41 9.76 1.62
128.38 425.02 9.80 1.59
265.50 431.33 9.70 1.63
266.58 426.84 9.57 1.60
276.21 463.47 9.57 1.68
ALL ZONES
-Area(‘000Ha) -Output(‘000MT)
3278.60 5006.00
2939.10 4428.80
2896.70 4338.60
3030.60 4402.30
2844.60 4461.10
3232.20 4842.80
Source: Underlying data from the Project Coordinating Unit of the Federal Ministry of Agriculture and Rural Development, Abuja

89
89
share of SE (8.11%) seems to be the least. The only zone where production followed an upward trend is Southwest (Fig. 3.7). Land area under maize cultivation trended upwards in SW and NE, virtually stagnated in SE and SS but followed a declining trend in NW and NC (Fig. 3.8). There is also no significant improvement in yield. On the average, the yield of maize ranges from 1.14mt/ha in NE to 1.9mt/ha in SE. Maize Processing Nigeria’s maize processing enterprises are generally engaged in primary processing and are limited by the backward technology and small-scale nature of the enterprise. The future of maize production lies not only on output increase but also on the development of processing industries. When maize is harvested which in most parts of Nigeria is done manually, the cobs are dehusked on the farm or are transported home and left to dry before shelling. Maize grains can be processed into different products for a variety of uses at both the traditional and industrial levels. Two methods are utilized to process maize industrially - wet and dry milling. The objective of the wet milling of maize is to obtain starch, oil and other components, which are useful in other areas such as livestock feeds. The dry milling process involves physical breaking of maize grains into various fractions and the size of the product determines its use. The main objectives of dry milling are: (i) To obtain maximum yield of grits with the least contamination with fat and black specks of the tip cap, to recover as much as possible the endosperm as meal, (ii) To produce the maximum amount of flour and (iii) To obtain the maximum amount of oil. Products from dry milling are maize meal, flour and maize grits. Other by - products are fractions, characterized by various dimensions and sizes which affect composition and utilization. Maize Marketing The established marketing channel for the commodity is mainly through direct sale in open market by the farmers. The middleman buys and hoards the grains to sell at higher prices at off-season. Storage is an important and crucial marketing function that allows the farmers the opportunity to delay the sales of their produce, especially when there is glut, to a later time to enable them sale at higher prices. Some important modern storage facilities include cribs and silos. However, most of the farmers have their own storage facilities such as rumbu, drums, jute bags and sometimes rooms specially prepared for storing farm produce. It is usual that most farmers report problems of rodents, pests and diseases in these storage facilities. Thus, farmers often hurriedly dispose their produce after harvest owing to the non-availability of adequate storage facilities.
3.3.5 Results of the Maize Value Chain Analysis
The relevant stages in the value chain analysis for maize are production, assembly and trade. Data on individual products resulting from maize processing is difficult to come by within the period earmarked for collecting data for this study. In any case, the competitiveness of maize can still be examined since the commodity is traded internationally (directly) in the form of grains. It is treated in this study as an import substitute. The analysis focuses on key financial and profitability indicators in the maize value chain as well as the indicators of performance of the value chain with a view to determining the international competitiveness of the commodity. The analysis is conducted at three levels of operation – family farm (FAM), emerging commercial farm (ECF) and large commercial farm (LCF).

90
90
Fig. 3.7: Production of Maize By
Agro-Ecological Zones in Nigeria
0
200
400
600
800
1000
1200
1400
1600
1800
1999
2000
2001
2002
2003
2004
Year
Ou
tpu
t ('
00
0 M
T) NW
NE
NC
SW
SE
SS
Fig. 3.8: Land Area Cultivated to
Maize in Nigerian Agro-Ecological
Zones
0
200
400
600
800
1000
1200
1999
2000
2001
2002
2003
2004
Year
'00
0 H
a
NW
NE
NC
SW
SE
SS

91
91
(a) Financial Costs and Profitability Indicators
The build-up of financial costs at every stage of the value chain reveals the importance of the various cost items. The cost structure varies widely among the three categories of farms (Table 3.23). With regard to the maize FAM, labour cost is the single largest component (59 percent) of financial costs at the production stage, and this is followed by seeds, fertilizer and chemicals (18 percent). At the assembly stage, the cost is more evenly spread among four items; fees and crop levies (30 percent), vehicle hire (26 percent), hired labour (23 percent) and packing materials and consumables (21 percent). At the logistics stage, transport to delivery point is the dominant cost item (74 percent of total cost) followed by loading and storage (23 percent) and overhead, fees and licence (3 percent). With regard to profitability indicators of the maize FAM, the results show that operating profit and net profit are positive at the production stage whereas the reverse is the case at the assembly stage. At the production stage, the gross margin is US$227.45 while net profit is $220.73. The rates of return at this stage range from 147 percent to 158 percent. (Table 3.24).
The cost structure of the maize ECF provides an insight into the extent of capitalization of maize production. Evidently, labour cost represents only 6 percent of the total production cost whereas depreciation accounts for 44 percent of the cost. Moreover, the cost incurred on seeds, fertilizer and chemicals is four times as high as the labour cost. With this pattern of investment, only operating profit is positive. The gross margin per tonne is US$48.5. The negative net profit portrays the difficulty in ensuring increased viability on the basis of the current level of investment and commercialization. At the assembly stage both the gross margin and net profit tend to be negative (Table 3.24). Also in the case of the LCF, depreciation accounts for the highest proportion (46 percent) of total production cost. The relatively high proportion of depreciation in the case of both ECF and LCF is accounted for by the availability of capital equipment such as ploughs and harrows which are very expensive cost items owned and used by the farmers and whose costs have to be incorporated into the computation of depreciation. This is followed by seeds, fertilizer and chemicals which account for 38 percent of the total cost and hired labour (16 percent). The results show that only operating profit is positive at the production stage. The gross margin per tonne is US$111.70. The negative net profit is an indication that the long term viability of large commercial maize farms may be difficult. At the assembly stage both operating and net profits tend to be negative.

92
92
Table 3.23: Structure of Financial Costs in Maize Enterprises in Nigeria percent
COST ITEMS FARM
PRODUCT
ASSEMBLY LOGISTICS
FAM
Hired Labour 59 23
Seed, Fertilizer & Chemicals 18
Marketing 12
Spraying & Machine Operation 5
Vehicle Hire 26
Fees & Crop Levies 30
Packing & Consumables 21
Loading & Storage 23
Overhead, Licence & Fees 3
Transport to Delivery Point 74
Depreciation 6
TOTAL 100 100 100
ECF
Hired Labour 6 25
Seed, Fertilizer & Chemicals 24
Marketing 3
Spraying& Machine Operation 9
Vehicle O & M 26
Fees & Crop Levies 27
Packaging & Consumables 22
Loading & Storage 22
Overhead, Licence & Fees 14 5
Transport to Delivery Point 73
Depreciation 44
TOTAL 100 100 100
LCF
Hired Labour 16 26
Seed, Fertilizer & Chemicals 38
Spraying, & Machine Operation
Vehicle O & M 26
Fees & Crop Levies 26
Packing & Consumables 22
Loading & Storage 21
Overhead, Licence & Fees 7
Transport to Delivery Point 72
Depreciation 46
TOTAL 100 100 100
Source: Author’s computations

93
93
Table 3.24: Financial and Profitability Indicators of Maize Enterprises in Nigeria (Per MT)
Source: Author’s computation
FAM MAIZE
ECF MAIZE
LCF MAIZE
FARM GATE ASSEMBLED TRADED PRODUCT RAW MATERIAL PRODUCT NGN USD NGN USD NGN USD Gross revenue 49,000 371.21 53,000 401.52 55,000 416.67 Production costs Crop purchase - 49,000 371.21 53,000 401.52 Other variable costs 34,255 259.51 6,590 49.92 2,800 21.21 I nvestment costs 29,219 221.36 - - - Total costs 63,474 480.86 55,590 421.14 55,800 422.73 Final income Gross margin 14,745 111.70 (2,590) (19.62) (800)
(6.06)
Net profit (14,474) (109.65) (2,590) (19.62) 800 ((8888
(6.06) Rates of return Gross margin/total VC 0.43 - 0.05 - 0.01
Net profit/total costs (0.23) - 0.05 - 0.01
FARM GATE ASSEMBLED TRADED PRODUCT RAW MATERIAL COMMODITY NGN USD NGN USD NGN USD Gross revenue 31,666 239.89 53,000 401.52 55,000 416.67 Production costs Crop purchase - 49,000 53,000 53,000 401.52 Other variable costs 25,264 191.39 6,060 2,180 2,180 16.52 I nvestment costs 19,177 145.28 - - - - Total costs 44,441 336.67 55,060 55,180 55,180 418.03 Final income Gross margin 6,402 48.50 (2,060) (15.6) (180) (1.36) Net profit (12,775) (96.78) (2060) (15.6) (180) (1.36) Rates of return Gross margin/total VC 0.25 - 0.04 0.00 Net profit/total costs (0.29) - 0.04 0.00
FARM GATE ASSEMBLED TRADED PRODUCT RAW MATERIAL PRODUCT NGN USD NGN USD NGN USD Gross revenue 49,000 371.21 53,000 401.52 55,000 416.67 - Production costs Crop purchase - 49,000 371.21 53,000 401.52 Other variable costs 18,976 143.76 5,510 41.74 1,758 13.31 Investment costs 888 6.73 - - - - Total costs 19,864 150.48 54,510 412.95 54,758 - 414.83 - Final income Gross margin 30,024 227.45 (1,510) (11.44) 243 1. 84 Net profit 29,136 220.73 (1,510) (11.44) 243 1.84 Rates of return Gross margin/total VC 1.58 - 0.03 0.004 Net profit/total costs 1.4 3 - 0.03 0.004

94
94
(b) Maize Value Chain Indicators
The value chain indicators for the final traded commodity reveal that substantial increase in shipment value occurs between the production stage and final delivery of the commodity (Table 3.25). For the maize FAM, the SV increased from US$150.48 to US$414.83 representing an increase of about 176 percent. Maize production is associated with a value added (US$142.26) which represents 95 percent of the shipment value. About 96 percent of the DVA is accounted for by domestic costs and mark-ups. For the purpose of determining the international competitiveness of maize the final shipment value is compared with the import parity price. The result shows that the final SV (US$414.83) is higher than the import parity price (US$131.10) implying that Nigerian maize is not competitive in the international market.
In the case of the ECF the SV increased from US$336.68 to US$418.03 representing an increase of about 24 percent. ECF maize production yields a value added (US$274.03) which represents 81 percent of the shipment value. About 88 percent of the DVA is accounted for by domestic costs and mark-ups. For the purpose of determining the international competitiveness of maize the final shipment value is compared with the import parity price. The result shows that the final SV (US$418.03) is higher than the import parity price (US$131.10) implying that Nigerian maize is not competitive in the international market. As regards LCF maize production is associated with a value added (US$434.94) which represents 90 percent of the shipment value. The DVA is made up entirely of domestic costs and mark-ups. For the purpose of determining the international competitiveness of maize the final shipment value is compared with the import parity price. The result shows that the final SV (US$422.73) is higher than the import parity price (US$131.10) implying that Nigerian maize is not competitive in the international market.
3.3.5 Comparative Analysis of Maize Profitability and Value Chain Indicators
Maize Profitability and Value Chain Indicators A comparative analysis of profitability based on the level of commercialization of the enterprises reveals considerable variation in both operating and net profit as well as the rates of return in respect of maize production. The gross margin per tonne is highest for the FAM (US$227.45) followed by LCF (US$111.70) while the ECF has the lowest (US$48.50). Net profit is also highest for FAM (US$220.73) while for both ECF and LCF net profit is negative. Moreover, FAM has higher rates of return than ECF and LCF (Table 3.26). The value chain indicators also vary considerably. The DVA for maize production is highest for LCF (US$434.94) followed by ECF (US$274.03) while that of FAM (US$142.26) is the lowest. The SV follows the same pattern. It is highest for LCF (US $480.86) followed by ECF (US$336.68) and FAM (US$150.48). The DVA as a proportion of SV is highest for FAM (95 percent) followed by LCF (90 percent) and ECF (82 percent). However, the domestic cost as a proportion of DVA is highest in the case of LCF (100 percent) followed by FAM (96 percent) and ECF (88 percent). This implies that additional costs incurred by ECF apart from the domestic costs constitute a higher proportion of SV than it is the case for FAM and LCF. The analysis shows however, that irrespective of the level of commercialization of maize production in Nigeria, the commodity remains uncompetitive in the international market.

95
95
Table 3.25: Value Chain Indicators for Maize Enterprises in Nigeria (Per MT)
FAM MAIZE
ECF MAIZE
LCF MAIZE
Source: Author’s computation
NGN USD NGN USD NGN USD
Domestic Value Added
Costs & mark-ups 31,830 241.14 42,448 321.58 42,452 321.61
Official duties & tax 885 6.70 885 6.70 896 6.79
Additional costs 3,457 26.19 3,457 26.19 3,562 26.98
Total DVA 36,172 274.03 46,790 354.47 46,910 355.38
Foreign costs 8,270 62.65 8,270 62.65 8,270 62.65
Total Shipment Value 44,442 336.68 55,060 417.12 55,180 418.03
FARM GATE ASSEMBLED TRADED PRODUCT
PRODUCT RAW MATERIAL YELLOW MAIZE
NGN USD NGN USD NGN USD
Domestic Value Added
Costs & mark-ups 57,412 434.94 49,528 375.21 49,538 375.29
Official duties & tax - - - - -
Additional costs - - - - 200 1.52
Total DVA 57,412 434.94 49,528 375.21 49,738 376.80
Foreign costs 6,062 45.92 6,062 45.92 6,062 45.92
Total Shipment Value 63,474 480.86 55,590 421.14 55,800 422.73
TRADED PRODUCT
PRODUCT RAW MATERIAL YELLOW MAIZE
FARM GATE ASSEMBLED
NGN USD NGN USD NGN USD Domestic Value Added
Costs & mar k - ups 18,116 137.24
52,747 2 399.60
52,980
401.36
Official duties & tax 162
1.23 169
1.28 - 1.21
Add itional costs 500 3.79
507 3.84
531
160
4.02
Total DVA 18,778 142.26
53,423 404.72
53,671 406. 60
Foreign costs 1,086
8.23 1,087
8.23 1,087
8.23
Total Shipment Value 19,864 150.48
54,510 412.95
54,758 414.83
TRADED PRODUCT PRODUCT RAW MATERIAL YELLOW MAIZE
FARM GATE ASSEMBLED

96
96
Table 3.26
Maize Profitability and Value Chain Indicators in Nigeria By Level of
Commercialization of Farms in Nigeria, 2005
TRADED COMMODITY FARM GATE PRODUCT
ASSEMBLED RAW MATERIAL
YELLOW MAIZE
PROFITABILITY
INDICATORS
FAM
GM (US$) NET PROFIT (US$)
GM/TVC (%) NET PROFIT/TC (%)
ECF
GM (US$) NET PROFIT(US$)
GM/TVC (%) NET PROFIT/TC (%)
LCF
GM (US$) NET PROFIT (US$)
GM/TVC (%) NET PROFIT/TC (%)
VALUE CHAIN
INDICATORS
FAM
DVA (US$) SV (US$)
DVA/SV (%) DC/DVA (%)
ECF
DVA (US$) SV (US$)
DVA/SV (%) DC/DVA (%)
LCF
DVA (US$) SV (US$)
DVA/SV (%) DC/DVA (%)
227 220 158 147
48 -96 25 -29
111 -109 43 -23
142 150 95 96
274 336 81 88
435 481 90
100
-11 -11 -3 -3
-15 -15 -4 -4
-19 -19 -5 -5
404 413 98 99
354 417 85 91
375 421 89
100
2 2
0.4 0.4
-1 -1 0 0
-6 -6 -1 -1
406 415 96 99
355 418 85 91
377 423 88 99
Source: Author’s computation

97
97
Comparison of Maize Shipment Values There is considerable variation in the structure of shipment values in the maize value chain not only from one stage to another but also among the three categories of farms. As shown in Table 3.27, the type and proportion of the key components of shipment values vary across the farms and the various stages in the value chain. In general, domestic costs and mark-ups constitute not less than 71 percent of the SV in each of the stages and for each category of farms. The domestic costs and mark-ups are highest in each category followed by the foreign costs, unofficial expenses and official duties and tax. In the case of FAM, the SV at the farm product stage consists of domestic costs and mark-ups, official duties and tax, unofficial expenses and foreign costs although the proportion of duties and tax is negligible. Unofficial expenses as well as duties and tax are also negligible at the assembly and logistics stages. With regard to ECF, the SV consists of the four major elements and the proportion of domestic costs and mark-ups ranges between 71 and 77 percent. This is the lowest among the three categories of farms. As shown in Figure 3.9, however, ECF has the highest proportion of the remaining components of SV (i.e. official duties and tax, unofficial expenses and foreign costs). As regards LCF, the SV consists of only domestic costs and mark-ups and foreign costs; with the former having a dominant share.
Table 3.27: Comparison of Composition of Maize Shipment Values in Nigeria (%)
FAM ECF LCF
FARM
-Domestic costs and mark-ups -Official duties and tax -Additional expenses -Foreign costs -Total
91 1 3 5
100
71 2 8
19 100
90 - -
10 100
ASSEMBLY
-Domestic cost and mark-ups -Official duties and tax -Additional expenses -Foreign costs -Total
97 - 1 2
100
77 2 6
15 100
89 - -
11 100
LOGISTICS
-Domestic cost and mark-ups -Official duties and tax -Additional expenses -Foreign costs -Total
97 - 1 2
100
77 2 6
15 100
89 - -
11 100
Source: Author’s computation

98
98
Figure 3.9: Composition of Shipment Value for Maize Enterprises in Nigeria
FAM MAIZE
ECF MAIZE
LCF MAIZE
Source: Author’s computation
Composition of SV
(USD per MT Traded Commodity)
- 50
100 150 200 250 300 350 400 450
MAIZE Costs & Mark-ups Duties & Tax Unofficial Extras Foreign costs
Composition of SV
(USD per MT Traded Commodity)
- 50
100 150 200 250 300 350 400 450
MAIZE Costs & Mark-ups Duties & Tax Unofficial Extras Foreign costs
Composition of SV
(USD per MT Traded Commodity)
- 50
100 150 200 250 300 350 400 450
MAIZE Costs & Mark-ups Duties & Tax Unofficial Extras Foreign costs
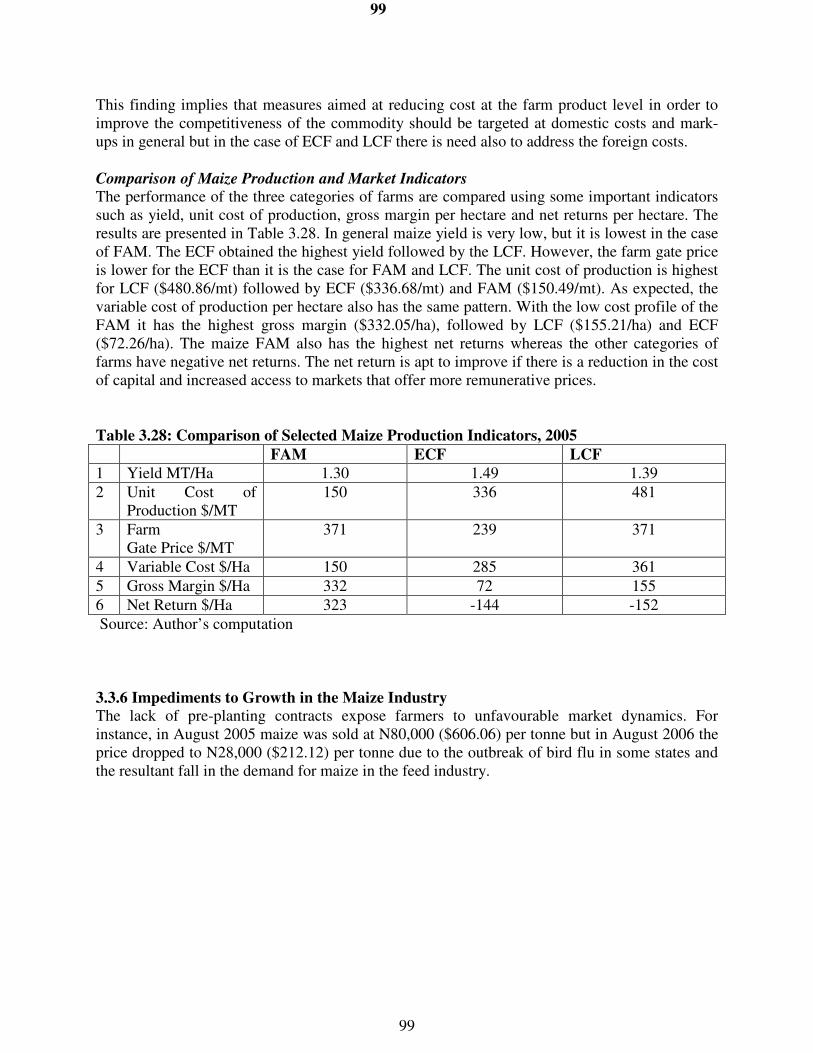
99
99
This finding implies that measures aimed at reducing cost at the farm product level in order to improve the competitiveness of the commodity should be targeted at domestic costs and mark-ups in general but in the case of ECF and LCF there is need also to address the foreign costs.
Comparison of Maize Production and Market Indicators The performance of the three categories of farms are compared using some important indicators such as yield, unit cost of production, gross margin per hectare and net returns per hectare. The results are presented in Table 3.28. In general maize yield is very low, but it is lowest in the case of FAM. The ECF obtained the highest yield followed by the LCF. However, the farm gate price is lower for the ECF than it is the case for FAM and LCF. The unit cost of production is highest for LCF ($480.86/mt) followed by ECF ($336.68/mt) and FAM ($150.49/mt). As expected, the variable cost of production per hectare also has the same pattern. With the low cost profile of the FAM it has the highest gross margin ($332.05/ha), followed by LCF ($155.21/ha) and ECF ($72.26/ha). The maize FAM also has the highest net returns whereas the other categories of farms have negative net returns. The net return is apt to improve if there is a reduction in the cost of capital and increased access to markets that offer more remunerative prices.
Table 3.28: Comparison of Selected Maize Production Indicators, 2005
FAM ECF LCF
1 Yield MT/Ha 1.30 1.49 1.39
2 Unit Cost of Production $/MT
150 336 481
3 Farm Gate Price $/MT
371 239 371
4 Variable Cost $/Ha 150 285 361
5 Gross Margin $/Ha 332 72 155
6 Net Return $/Ha 323 -144 -152
Source: Author’s computation
3.3.6 Impediments to Growth in the Maize Industry
The lack of pre-planting contracts expose farmers to unfavourable market dynamics. For instance, in August 2005 maize was sold at N80,000 ($606.06) per tonne but in August 2006 the price dropped to N28,000 ($212.12) per tonne due to the outbreak of bird flu in some states and the resultant fall in the demand for maize in the feed industry.

100
100
3.4 Value Chain Analysis of the Rice Industry
3.4.1 Review of Rice Value Chain Studies in Nigeria
Studies on the competitiveness of rice production based on the methodology designed for the current study are non-existent in Nigeria. Available studies have tended to limit analysis to profitability indicators. In this category, the studies by NISER (2001), found that rice production has been profitable in various parts of the country judging by the level of gross margins per hectare. Gross margins range between N17,880.4 in the Northeast zone and N71,560 in the North-central zone (see Table 3.29). The authors attributed the variations to differences in rice production systems. Table 3.29: Gross Margin in Rice Production in Nigeria
Naira/ha
North-West Zone
North-East Zone
North-Central Zone
South-East Zone
Labour
24,020
8,313.48
12,390
41,800
Seed
5,850
129
1000
1,000
Fertilizer
12,600
3,510
10,000
2,000
Herbicide
-
7,500
-
Seed dressing
-
1,000
-
Tractor 3,600
Transportation
700
1,000 3,000
Bags
840
1,200
910
-
Total Variable Cost
46,910
13,852.48
33,800
47,800
Total Value of Output
73,500
31,732.88
105,360
75,000
Gross Margin
26,590
17,880.4
71,560
27,200
Source: NISER, 2001

101
101
Of the available studies focusing on production and trade in the rice sub-sector, the most relevant to the current work is the one by Ezedinma (2005) which, inter alia, sought to assess the competitiveness of domestic rice relative to imported rice. Data for the study were collected between 2001 and 2003 from 21 states namely; Abia, Akwa Ibom, Anambra, Adamawa, Benue, Cross River, Ebonyi, Enugu, Imo, Jigawa, Kaduna, Kano, Katsina, Kogi, Kwara, Niger, Ogun, Ondo Osun, Taraba and Zamfara. The component of the study which deals with the issue of competitiveness involves a comparison between the domestic prices of paddy and milled rice in Nigeria with the international prices of the worst grade of rice – white broken rice, Thai A1 super, f. o. b. Bangkok from 1993 to 2002. The author sought to know whether the price of Nigeria’s domestic rice would be competitive in the local market if it were to be processed to the quality and standards of imported rice (i.e. polished, destoned and dirt free with uniform grain characteristics). It was observed through field observations and interviews that on the average an extra cost of 25 percent was needed to process domestic rice to the quality and standards of imported rice. The comparison of prices for different locations of rice mills as at 2002 is shown in Table 3.30.
Table 3.30: Comparison of Domestic and Import Price of Rice in Nigeria
Location of Mills
Miller’s Price (N/25kg)
Additional Processing Cost (25%) (N/25kg)
Marketing margin (N/25kg)
Estimated Urban Market Price (N/25kg)
Price of Imported Rice (N/25kg)
Percentage Difference
Abakaliki 900 225 613 1738 1575 10
Adani 1018 254 431 1704 1575 8
Omor 1068 267 531 1867 1575 18
Bende 1137 284 461 1883 1575 19
Source: Ezendinma, 2005. The results indicate that further processing of domestic rice to meet the quality and standards of imported rice will mean that rice from the Abakaliki mills will be 10.3 percent more expensive than the imported rice while rice from the Adani mills will be more expensive by 8.23 percent. Similarly, rice from the Omor mills will be more expensive by 18.53 percent and Bende by 19.50 percent. Thus, although improving the standards of local rice was feasible and desirable it was not competitive. The author concludes that Nigerian domestic rice is expensive to produce and expensive to process and so cannot compete in the international market.
3.4.2 World Market Structure
Rice is a major food crop in the world. It is being consumed by more than half of the world population. Available data indicate that world output has witnessed some decline for the recent past. Production of milled rice in the world totaled 409.2 million tonnes in 1999 but declined to 384.4 million tonnes in 2002 (USDA, 2002). The top five producers then were China, India, Indonesia, Bangladesh and Vietnam. The international rice market accounts for only about 5-6 percent of global output despite the expansion of trade. Unlike other bulk commodities, the rice market is segmented into a number of different varieties and qualities, each with strong consumer loyalty. The major rice exporters are Thailand, Vietnam, China, USA, India and Pakistan. A significant disincentive in the market has been the downward trend of prices over the

102
102
years. According to Vorley (2005) real world rice prices averaged $860 per tonne from 1950 to 1964, dropping to under $300 by the late 1990s and hovering slightly under $200 in the early 2000s; though higher quality (basmati) rice from Pakistan still attracts up to $370 per tonne. Since June 2001, India has been the lowest-priced source of rice, and more recently, of higher quality regular milled white rice. With intense competition among producers and exporters with suppressed demand and low prices, farmers face much difficulty in making a living out of rice farming. 3.4.3 Nigerian Market Structure
The rice market situation in Nigeria is complex. The country is a major consumer and importer with low level of domestic production. Nigeria is the largest rice producer in the West African sub-region and has in recent times assumed the status of the largest importer of rice in the world. By 1999 production of paddy rice stood at about 3.2 million tonnes but declined to about 2.38 million tonnes in 2004. The demand for rice in Nigeria has been soaring over the years. The increasing demand has been triggered by a combination of factors. The high rate of urbanization, rising population growth, as well as changes in family income an occupational structures have affected the demand for rice. As women enter the work force, the opportunity cost of their time increases and convenience foods such as rice, which can be prepared quickly, rise in importance. Similarly, as men work at greater distances from their homes in the urban setting, more meals are consumed away from home and rice is often the preferred meal. These trends have meant that rice is no longer a luxury food but has become a major source of calories for all strata of the urban population. However, evidence suggests that domestic production capacity is far below the national requirements for rice (Wudiri and Fatoba, 1992; and Ladebo, 1999). The annual demand for rice in the country is estimated at 5 million tones of milled rice, while production level is 3 million tonnes resulting in a deficit of 2 million tonnes.
Over the years the country had resorted to imports to bridge this deficit. For instance in 1999, the value of rice imports was US$259 million and this increased to US$655 million in 2001 and US$756 in 2002. Between 1990 and 2002, Nigeria imported 5,132,616 tons of rice valued at US$1,883,553 million (Ezedinma, 2005). Recent data on rice import show that both paddy and non-paddy rice are being imported into the country. Import of paddy rice rose sharply between 2002 and 2003, from �242,000 to �1,583,689 but declined precipitously thereafter reaching an all time low of �128,442 in 2005 (see Fig. 3.10). Import of non-paddy rice consisting of husked (brown) rice, broken rice and milled rice increased steadily from about �28.3 billion in 2002 to �30.3 billion in 2004. Although it declined somewhat in 2005 (Fig. 3.11), the level of import was higher than it was in 2002 despite the determination of the government to increase domestic production and reduce import under the Presidential Initiative on Agriculture introduced in 2002. 3.4.4 Characterization of the Rice Value Chain
Production and Cropping Systems
The rice production systems in Nigeria include rainfed upland, rainfed lowland, irrigated lowland and deep water and mangrove rice (Singh et al., 1997). Rice farmers tend to be small-scale, with farms of 1-2 ha. Rainfed Upland Rice Production Systems account for 30 percent of the total area under rice. Under this system, rice is directly seeded in non-flooded, well drained soil on level to steeply sloping fields. Rainfall is the only source of water – generally limiting this

103
103
Fig. 3.10: Import of Paddy Rice in
Nigeria, 2002-2005
0
200000
400000
600000
800000
1000000
1200000
1400000
1600000
1800000
2002 2003 2004 2005
Year
Na
ira
Fig. 3.11: Import of Non-Paddy Rice in Nigeria,
2002-2005
27
27.5
28
28.5
29
29.5
30
30.5
2002 2003 2004 2005Year
bil
lio
n n
air
a

104
104
system to areas with more than 1,300 mm of annual rainfall. Because of better rainfall, yields are slightly higher in the south than in the north. The average yield of the rainfed upland rice is 1.7 tons/ha. Upland rice is typically intercropped with various other crops, including vegetables, maize, yam or cassava. The land is cleared between December and March. With the onset of the rains in early April, the land is prepared and the seeds broadcast and harrowed in with a hoe. Ofada is the traditional variety cultivated. Hand-weeding is the usual practice and harvesting is manual. Rainfed lowland rice is the most important system and accounts for approximately half of total rice area in Nigeria. Increasing use of rainfed lowlands appears to have been a major source of the rapid increase in paddy production in recent years (FAO, 2001). Rice under this system is transplanted or seeded directly in the soil on level to slightly sloping fields with variable depth and duration of flooding depending on rainfall. This system is found mainly along the flooded river valleys such as the Niger Basin, Kaduna Basin, Benue Basin, etc. of the Northern states. But such system is also common in Abakaliki and Ogoja areas of Ebonyi and Cross River states respectively. In most of these areas, the river banks or Fadamas are usually flooded during the rainy season which lasts for 4-5 months. Only one crop is planted in a year under sole cropping practice. The average yield is about 2.2 tons/ha. Fertilizer and improved seeds are now being introduced in the production system. Irrigated rice systems account for 16% of total rice area in Nigeria. Irrigated rice encompasses lowlands with good water control, enabling two crops per year. The yield obtained (3.5 tons/ha) is generally higher than in other systems. Irrigated rice systems include both large-scale irrigation schemes in the north and small-scale developed inland valley bottoms in the south. Rice is the main irrigated crop in Nigeria – particularly in the main season (Fagade, 1997; Shaib et al., 1997).
Deepwater rice system can generally be defined as those where flooding achieves a depth of 60-100 cm, and floating rice system as those where flooding exceeds 100 cm. Deepwater and floating rice represents an increasingly marginalized production system for which area and production figures are generally limited. This production system can be found in the Sokoto- Rima valleys and in some other flooded plains or fadamas where water depth is very high. The mangrove swamp rice production system is found where the ocean’s tidal action causes inundation at high tide and drainage at low tide. Most mangrove swamps experience a salt- free growing period during the rainy season when freshwater floods wash the land and displace tidal flows. As a result, the rice growing period is directly related to distance from the ocean, varying between less than four months in the nearest estuaries to more than six months in those more distant. Soils are generally more fertile than in other ecologies since they benefit from regular deposits of silt during annual flooding. However, the soils are also characterized by high salinity and sulfate acidity. Specific areas where this production system can be found include the Niger Delta – particularly in the deep flooded areas of Ilushi, Lagos and Calabar. While this system holds a great potential for rice cultivation in Nigeria, high labour costs associated with clearing and potential negative environmental impacts arising from oil exploration activities pose major constraints to further area expansion. Rice is produced in all the agro-ecological zones. As shown in Table 3.31, the NC is the leading producer of rice in Nigeria. Its contribution to total production averaged 41.57 per cent between 1999 and 2004 whereas the lowest contribution (3.9 per cent) is recorded in the South-South zone. Nonetheless, rice production followed a declining trend in NC just as it is the case in each of the other agro-ecological zones (Fig. 3.12). Moreover, there is no expansion in land area cultivated to rice; rather, each of the zones records a downward trend during the period (Fig. 3.13).

105
105
Table 3.31: Rice Production in Nigeria, 1999-2004
1999 2000 2001 2002 2003 2004
NORTHWEST
-Area(‘000Ha) -Output(‘000MT) -Share of Total (%) -Yield (MT/Ha)
284.47 424.9 13.34 1.47
264.474 381.54 13.24 1.45
227.76 327.61 2.46 1.44
225 313.01 13.73 1.39
232.67 334.75 14.27 1.43
239.05 341.36 14.32 1.42
NORTHEAST
-Area(‘000Ha) -Output(‘000MT) -Share of Total (%) -Yield (MT/Ha)
451.64 756.18 23.74 1.67
409.126 695.64 24.14 1.69
371.83 600.98 86.69 1.62
373.01 684.62 30.03 1.83
386.516 638.02 27.23 1.65
393.72 647.83 27.18 1.64
NORTHCENTRAL
-Area(‘000Ha) -Output(‘000MT) -Share of Total (%) -Yield (MT/Ha)
592.89 1356.12 42.57 2.29
575.24 1273.79 44.20 2.21
469.406 1020.04 7.67 2.17
390.8 861.80 37.81 2.20
427.69 946.85 40.44 2.22
443.05 987.14 41.42 2.23
SOUTHWEST
-Area(‘000Ha) -Output(‘000MT) -Share of Total (%) -Yield (MT/Ha)
103.6 177.9 5.58 1.72
97.919 153.08 5.31 1.57
84.489 123.12 0.93 1.47
82.6 120.67 5.29 1.46
80.53 113.44 4.84 1.41
82.184 113.77 4.77 1.37
SOUTHEAST
-Area(‘000Ha) -Output(‘000MT) -Share of Total (%) -Yield (MT/Ha)
117.7 353.19 11.09 3.01
99.392 273.99 9.51 2.75
76.417 194.71 1.46 2.55
76.329 195.6 8.58 2.56
78.35 204.19 8.71 2.61
79.995 220.59 9.26 2.78
SOUTH-SOUTH
-Area(‘000Ha) -Output(‘000MT) -Share of Total (%) -Yield (MT/Ha)
56.99 117.08 3.68 2.08
49.32 103.53 3.59 2.10
46.75 103.96 0.78 2.23
46.65 103.81 4.55 2.23
45.667 105.84 4.52 2.33
33.79 72.52 3.04 2.18
ALL ZONES
-Area(‘000Ha) -Output(‘000MT)
1607.30 3185.40
1495.50 2881.60
1276.70 2370.40
1194.40 2279.50
1251.40 2343.10
1271.80 2383.20
Source: Underlying data from the Project Coordinating Unit of the Federal Ministry of Agriculture and Rural Development, Abuja

106
106
Fig. 3.12: Rice Production in Nigerian Agro-Ecological
Zones
0
200
400
600
800
1000
1200
1400
1600
1999
2000
2001
2002
2003
2004
Year
Ou
tpu
t ('
000 M
T) NW
NE
NC
SW
SE
SS
Fig. 3.13: Land Area Cultivated to Rice in Nigerian
Agro-Ecological Zones
0
100
200
300
400
500
600
700
1999 2000 2001 2002 2003 2004
Year
'00
0 h
a
NW
NE
NC
SW
SE
SS

107
107
What is more, there is no significant increase in rice yield annually from 1999 to 2004. The range of the average yield is from 1.43mt/ha in the NW to 2.71mt/ha in the SE.
Rice Processing Rice processing activities essentially entail parboiling and milling of paddy. Parboiling precedes milling and it is often carried out with the use of local drums which permits uniform final product from a mixture of paddy derived from different varieties of rice. The traditional domestic parboiling techniques as narrated by Stuykers (1982), involve soaking the paddy in cold water for two days, and then heating in drums until the grains show signs of splitting, whereupon the rice is removed for drying. The problem lies in the long soaking when fermentation commences, and also with the very drying (in 2 hours or less) which leads to broken grains of as much as 49 per cent on milling. There is complete absence of modern technology for the drying of parboiled paddy. Often, drying is done by the road side under the sun. This accounts for the presence of foreign bodies such as stones in the final product. Sun drying in the open does not allow for drying during the rainy seasons. Again, this accounts for the low level of milling during such periods. Where it is possible to dry during the rainy season, often the paddies do not dry properly and this partly accounts for the foul odour of the final product. With respect to milling, three main methods can be identified in Nigeria. These are the Traditional or Hand-pounding System, the Small Mill Processing System and the Large Mill Processing System. The traditional system isvery slow and labour intensive and the final product obtained often contains a high percentage of broken grains and foreign bodies. Given these limitations, this system is fast disappearing.
The small rice mills are the most predominant of the three milling systems. They can be found in major rice processing areas such as Abakaliki in Ebonyi state, Lafia in Nasarawa state and a host of others. Experts believe that about 85 percent of Nigerian rice is processed through the small milling system. This system of processing involves the use of mechanised milling units (often operating the old cono disc technology) with a maximum and minimum capacity of 600 and 200-300 tons per day respectively. At the moment, most small rice mills operate at about 1 tonne/hr. This is due to the lack of availability of sufficient paddy for processing. Some of the millers go far away to look for paddy to buy and sometimes they even go beyond the shores of the country in search of paddy. The final product of the small mills is generally superior to that processed under the traditional hand-pounding system. In some cases however, the final product contains a high percentage of broken grains and thus fetches a lower price in the market. Another major problem with processing is the non-availability of destoning machine. Although some major rice processing areas have destoners, this is not commonly utilized by farmers because of the small volume which farmers have. The lack of destoners coupled with the drying of parboiled paddy by the road side accounts for the large presence of stones in the final product. However, a few large mills exist and most are owned by government or quasi-government parastatals such as the State Agricultural Development Projects. The Pateggi, Uzo-Awani, and the Agbede rice mills are typical examples of large mills in Nigeria. These mills combine rice milling with rice polishing, and in most cases, they possess separate parboiling equipment. Large mills are not popular with the Nigerian farmers. It is also important to note that for large mills the amount of capital investment required is substantial and most of the existing large mills have broken down as a result of lack of spare parts and inadequate maintenance.
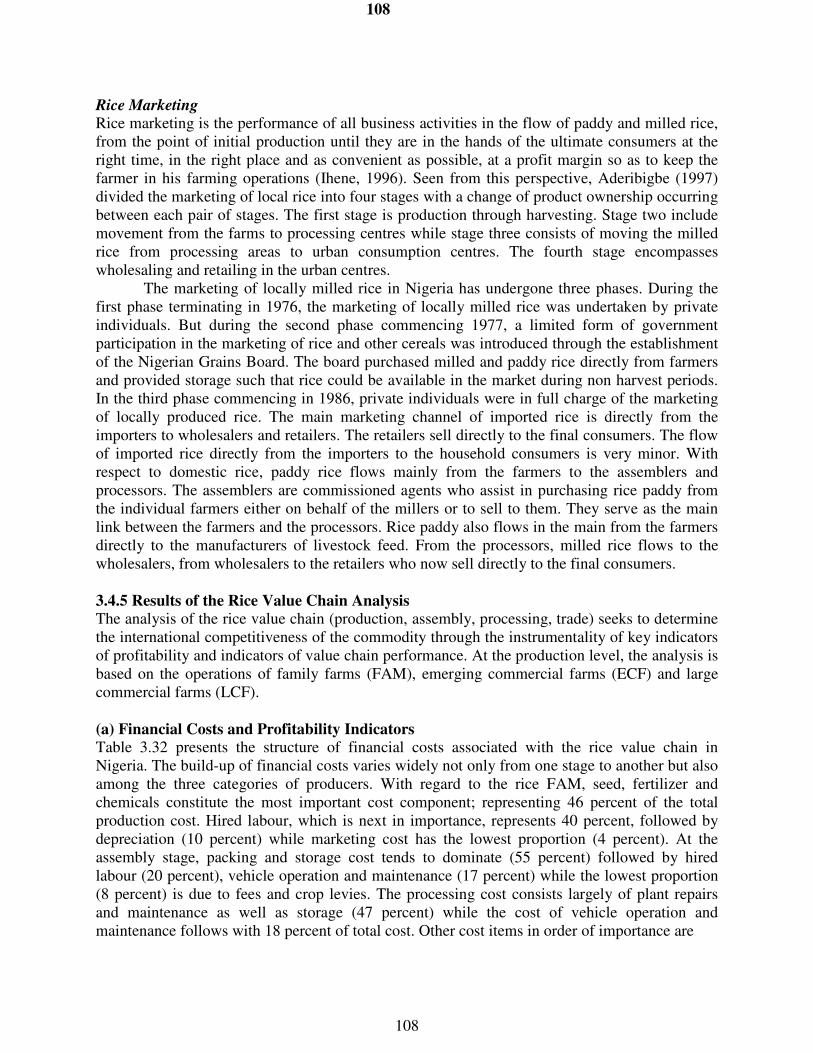
108
108
Rice Marketing Rice marketing is the performance of all business activities in the flow of paddy and milled rice, from the point of initial production until they are in the hands of the ultimate consumers at the right time, in the right place and as convenient as possible, at a profit margin so as to keep the farmer in his farming operations (Ihene, 1996). Seen from this perspective, Aderibigbe (1997) divided the marketing of local rice into four stages with a change of product ownership occurring between each pair of stages. The first stage is production through harvesting. Stage two include movement from the farms to processing centres while stage three consists of moving the milled rice from processing areas to urban consumption centres. The fourth stage encompasses wholesaling and retailing in the urban centres.
The marketing of locally milled rice in Nigeria has undergone three phases. During the first phase terminating in 1976, the marketing of locally milled rice was undertaken by private individuals. But during the second phase commencing 1977, a limited form of government participation in the marketing of rice and other cereals was introduced through the establishment of the Nigerian Grains Board. The board purchased milled and paddy rice directly from farmers and provided storage such that rice could be available in the market during non harvest periods. In the third phase commencing in 1986, private individuals were in full charge of the marketing of locally produced rice. The main marketing channel of imported rice is directly from the importers to wholesalers and retailers. The retailers sell directly to the final consumers. The flow of imported rice directly from the importers to the household consumers is very minor. With respect to domestic rice, paddy rice flows mainly from the farmers to the assemblers and processors. The assemblers are commissioned agents who assist in purchasing rice paddy from the individual farmers either on behalf of the millers or to sell to them. They serve as the main link between the farmers and the processors. Rice paddy also flows in the main from the farmers directly to the manufacturers of livestock feed. From the processors, milled rice flows to the wholesalers, from wholesalers to the retailers who now sell directly to the final consumers. 3.4.5 Results of the Rice Value Chain Analysis
The analysis of the rice value chain (production, assembly, processing, trade) seeks to determine the international competitiveness of the commodity through the instrumentality of key indicators of profitability and indicators of value chain performance. At the production level, the analysis is based on the operations of family farms (FAM), emerging commercial farms (ECF) and large commercial farms (LCF). (a) Financial Costs and Profitability Indicators
Table 3.32 presents the structure of financial costs associated with the rice value chain in Nigeria. The build-up of financial costs varies widely not only from one stage to another but also among the three categories of producers. With regard to the rice FAM, seed, fertilizer and chemicals constitute the most important cost component; representing 46 percent of the total production cost. Hired labour, which is next in importance, represents 40 percent, followed by depreciation (10 percent) while marketing cost has the lowest proportion (4 percent). At the assembly stage, packing and storage cost tends to dominate (55 percent) followed by hired labour (20 percent), vehicle operation and maintenance (17 percent) while the lowest proportion (8 percent) is due to fees and crop levies. The processing cost consists largely of plant repairs and maintenance as well as storage (47 percent) while the cost of vehicle operation and maintenance follows with 18 percent of total cost. Other cost items in order of importance are

109
109
Table 3.32: Structure of Financial Costs of Rice Enterprises in Nigeria percent
COST ITEMS FARM
PRODUCT
ASSEMBLY PROCESSING LOGISTICS
FAM
Hired Labour 40 20
Seed, Fertilizer & Chemicals 46
Marketing 4
Spraying & Machine Operation
Vehicle Operation & Maintenance 17 18
Fees & Crop Levies 8
Packing & Consumables 55 8
Storage & Plant R&M 47
Overhead & Licence 13 2
Energy & Machine Operation 4
Depreciation 10 10
Transport to Delivery Point 98
TOTAL 100 100 100 100
ECF
Hired Labour 58 21
Seed, Fertilizer & Chemicals 11
Marketing 17
Spraying& Machine Operation 11
Vehicle O & M 16 20
Fees & Crop Levies 9
Packaging & Consumables 54 7
Storage & Plant R&M 48
Overhead & Licence 12 2
Energy & Machine Operation 4
Depreciation 3 9 10
Transport to Delivery Point 88
TOTAL 100 100 100 100
LCF
Hired Labour 17 22
Seed, Fertilizer & Chemicals 20
Marketing 1
Spraying, & Machine Operation 7
Vehicle O & M 16 19
Fees & Crop Levies 10
Packing & Consumables 52 7
Storage & Plant R&M 51
Overhead & Licence 11 2
Energy & Machine Operation 4
Depreciation 55 8
Loading and Storage 11
Transport to Delivery Point 87
TOTAL 100 100 100 100
Source: Author’s computations

110
110
overhead (13 percent), depreciation (10 percent), packing materials (8 percent) and energy and machine operation (4 percent). At the logistics stage, transport to delivery point is the dominant cost item (98 percent of total cost). At the FAM level, the results show that except for raw material processing, operating profit and net profit are positive at every stage of the rice value chain. At the production stage, the gross margin is US$339.49 while net profit is US$333.91; whereas at the assembly stage, the gross margin (US$83.33) and net profit remains the same. At the level of trading, both the gross margin and net profit are positive but remain at the same level (US$83.23) since the traders made no significant investment on rice marketing. The rate of return (net profit/total costs) at the marketing stage (12 percent) is the smallest when compared to the 18 percent at the assembly stage and 277 percent at the production stage (Table 3.33).
The cost structure of the rice ECF depicts the labour intensive nature of rice production in the country. Whereas the highest proportion (58 percent) of total production cost was incurred on hired labour, depreciation of fixed capital represents only 3 percent. Marketing cost represents 17 percent, while 11 percent was incurred on seed, fertilizer and chemical. The same proportion was also incurred on spraying and machine operation. At the assembly stage, packing and storage account for 54 percent of the total cost while at the processing stage the highest (48 percent) proportion of total cost was incurred on plant repair and maintenance. At the logistics stage, the dominant cost item is transportation to delivery point and it represents 88 percent of total cost. This is followed by loading and storage (10 percent) while fees and licence constitute only 2 percent. With regard to profitability indicators, the result shows that both operating profit and net profit are also positive at every stage of the value chain with the exception of raw material processing. At the production stage, the gross margin per tonne is US$402.69 while net profit is US$398.75; whereas at the assembly stage, the gross margin (US$79.70) and net profit remain the same. At the level of trading, both the gross margin and net profit are positive but remain at the same level (US$79.83) since the traders made no significant investment on rice marketing. The rate of return (net profit/total costs) at the marketing stage (12 percent) is the lowest when compared to the 17 percent at the assembly stage and 272 percent at the production stage (Table 3.33). As regards the rice LCF, depreciation of fixed capital is the single most important cost item at the farm product level representing 55 percent of total production cost. This is followed by seed, fertilizer and chemicals (20 percent), hired labour (17 percent), machine operation (7 percent) while marketing cost is the lowest (1 percent). The relatively high proportion of depreciation is accounted for by the availability of capital equipment such as ploughs and harrows which are very expensive cost items owned and used by the farmers and whose costs have to be incorporated into the computation of depreciation. At the assembly level, the major cost items, in order of importance, are packing and consumables (52 percent), hired labour (22 percent), vehicle operation and maintenance (16 percent) and fees and crop levies (10 percent). The highest proportion (51 percent) of rice processing cost is due to storage as well as plant repairs and maintenance, followed by 19 percent for vehicle operation and maintenance, 11 percent for overhead, 8 percent for depreciation and the lowest (4 percent) is for energy and machine operation. As expected, the dominant cost item at the logistics stage is transportation to the point of delivery which represents 87 percent of total cost. This is followed by loading and storage (11 percent) and fees, levies and overhead (2 percent). The pattern of profitability for the LCF category is similar to that of ECF and FAM. At the production stage, the gross margin per tonne is US$373.79 while net profit is US$164.83; whereas at the assembly stage, the gross margin (US$76.52) and net profit remain the same. At the level of trading, gross margin is

111
111
Table 3.33: Profitability Indicators of Rice Enterprises in Nigeria (Per MT)
FAM RICE
ECF RICE
LCF RICE
Source: Author’s computation
FARM GATE ASSEMBLED PROCESSED
PRODUCT RAW MATERIAL RAW MATERIAL Milled Rice
NGN USD NGN USD NGN USD NGN USD
Gross revenue 72,000 545.45 72,000 545.45 68,000 515.15 100,000 757.58
Production costs
Crop purchase - 50,000 378.79 72,000 545.45 85,000 643.94
Other variable costs 18,845 142.77 11,480 86.97 2,232 16.91 4,463 33.81
Investment costs 520 3.94 - - 220 1.67 -
Total costs 19,365 146.70 61,480 465.76 74,452 564.03 89,463 677.75
Final income
Gross margin 53,155 402.69 10,520 79.70 (6,232) (47.21) 10,537 79.83
Net profit 52,635 398.75 10,520 79.70 (6,452) (48.88) 10,537 79.83
Rates of return
Gross margin/total VC 2.82 0.17 -0.08 0.12
Net profit/total costs 2.72 0.17 -0.09 0.12
FARM GATE ASSEMBLED
PROCESSED
TRADED COMMODITY
PRODUCT RAW MATERIAL
RAW MATERIAL Milled Rice
NGN
USD NGN
USD NGN
USD NGN
USD
Gross revenue 60,000
454.55 72,000
545.45 68,000
515.15 100,000
757.58
Production costs
Crop purchase - 50,000
378.79 72,000
545.45 85,000
643.94
Other variable costs 15,187
115.05 11,000
83.33 1,998
15.14 4,013
30.40
Investment costs 737
5.58 - - 220
1.67 - -
Total costs 15,924
120.64 61,000
462.12 74,218
562.26 89,013
674.34
Final income
Gross margin 44,813
339.49 11,000
83.33 (5,998)
(45.44) 10,987
83.23
Net profit 44,076
333.91 11,000
83.33 (6,218)
(47.11) 10,987
83.23
Rates of return
Gross margin/total VC 2.95
0.18 - 0.08
0.12
Net profit/total costs 2.77
0.18 - 0.08
0.12
FARM GATE ASSEMBLED
PROCESSED
TRADED COMMODITY
PRODUCT RAW MATERIAL
RAW MATERIAL Milled Rice
NGN
USD NGN
USD NGN
USD NGN
USD
Gross revenue 72,000
545.45 72,000
545.45 68,000
515.15 100,000
757.58
Production costs
Crop purchase - 50,000
378.79 72,000
545.45 85,000
643.94
Other variable costs 22,660
171.67 11,900
90.15 2,392
18.12 4,513
34.19
Investment costs 27,582
208.95 - - 220
1.67 -
Total costs 50,242
380.62 61,900
468.94 74,612
565.24 89,513
678.13
Final income
Gross margin 49,340
373.79 10,100
76.52 (6,392)
(48.42) 10,487
79.45
Net profit 21,758
164.83 10,100
76.52 (6,612)
(50.09) 10,487
79.45
Rates of return
Gross margin/total VC 2.18
0.16 - 0.09
0.12
Net profit/total costs 0.43
0.16 - 0.09
0.12

112
112
US$79.45 while net profit remains at the same level. The rate of return (net profit/total costs) at the marketing stage (12 percent) is the lowest when compared to the 16 percent at the assembly stage and 43 percent at the production stage (Table 3.33). (b) Rice Value Chain Indicators
The value chain indicators for the final traded commodity reveal that substantial increase in shipment value occurs between the production of paddy and final delivery of milled rice (Table 3.34). With regard to the FAM, the transformation of paddy rice into milled rice is associated with an increase in shipment value from US$120.64 at the paddy production stage to US$462.12 at the assembly stage (or about 283 percent), US$562.27 at the processing stage (or about 22 percent from the previous stage) and US$674.34 at the final delivery point representing an increase of about 20 percent from the previous stage. Rice production is associated with a value added of US$109.54 which represents 91 percent of the shipment value. About 94 percent of the DVA is accounted for by domestic costs and mark-ups. At the final stage of delivery, the value added obtained (US$653.17) represents 97 percent of the shipment value (US$674.34); and 98 percent of the DVA is made up of domestic costs and mark-ups. For the purpose of determining the international competitiveness of rice, the final shipment value is compared with the import parity price. The final SV (US$674.34) is greater than the import parity price (US$330) implying that Nigerian rice is not competitive at the international market. With regard to the ECF, the transformation of paddy rice into milled rice is associated with an increase in shipment value from US$146.70 at the paddy production stage to US$465.76 at the assembly stage (or about 217 percent), US$564.03 at the processing stage (or an increase of 21 percent from the previous stage) and US$677.76 at the final delivery point representing an increase of about 20 percent from the previous stage. Rice production yields a value added (US$137.98) which represents 94 percent of the shipment value and it is entirely accounted for by domestic costs and mark-ups. At the final stage of delivery, the domestic value added obtained (US$659.80) represents 97 percent of the shipment value (US$677.76); and of this DVA, costs and mark-ups account for 99 percent. For the purpose of determining the international competitiveness of rice, the final shipment value is compared with the import parity price. The final SV (US$677.76) is greater than the import parity price (US$330) implying that Nigerian rice is not competitive at the international market. As regards LCF, the transformation of paddy rice into milled rice is associated with an increase in shipment value from US$380.63 at the paddy production stage to US$468.95 at the assembly stage (or about 23 percent), US$565.24 at the processing stage (or about 21 percent from the previous stage) and US$678.14 at the final delivery point representing an increase of about 20 percent from the previous stage. Rice production yields a domestic value added (US$326.52) which represents 86 percent of the shipment value. Of this DVA, 82 percent is accounted for by domestic costs and mark-ups. At the final stage of delivery, the domestic value added obtained (US$596.08) represents 88 percent of the shipment value (US$678.14); and of this DVA, costs and mark-ups account for 96 percent. For the purpose of determining the international competitiveness of rice, the final shipment value is compared with the import parity price. The final SV (US$678.14) is greater than the import parity price (US$330) implying that Nigerian rice is not competitive at the international market.

113
113
Table 3.34: Value Chain Indicators for Rice Enterprises in Nigeria (Per MT)
FAM RICE
ECF RICE LCF RICE Source: Author’s computation
D.
NGN USD NGN USD NGN USD Domestic Value Added
Costs & mark-ups 13636 103.3 58,282 441.53 70,624 535.03 Official duties & tax 208 1.58 423 3.20 647 4.90 Additional costs 615 4.66 684 5.18 713 5.40
Total DVA 14459 109.5 59,389 449.91 71,984 545.33 Foreign costs 1,465 11.10 1,612 12.21 2,235 16.93
Total Shipment Value 15924 120.6 61,001 462.12 74,219 562.26
D.
NGN USD NGN USD NGN USD Domestic Value Added
Costs & mark-ups 84,420 639.55 - - Official duties & tax 810 6.14 - - Additional costs 989 7.49 - -
Total DVA 86,219 653.17 - - - - Foreign costs 2,794 21.17 - -
Total Shipment Value 89,013 674.34 - - - -
RICE
PROCESSED
TRADED COMMODITIES (1 MT Final Traded Product)
PRODUCT RAW MATERIAL RAW MATERIAL FARM GATE ASSEMBLED
NGN USD NGN USD NGN USD Domestic Value Added
Costs & mark-ups 18,213 137.98 59,963 454.27 72,084 546.09 Official duties & tax - - 250 1.89 472 3.58 Additional costs - - - - - -
Total DVA 18,213 137.98 60,213 456.16 72,556 549.67 Foreign costs 1,152 8.73 1,267 9.60 1,896 14.36
Total Shipment Value 19,365 146.70 61,480 465.76 74,452 564.03
D.
NGN USD NGN USD NGN USD Domestic Value Added
Costs & mark-ups 86,368 654.30 - - Official duties & tax 635 4.81 - - Additional costs 90 0.68 - -
Total DVA 87,093 659.80 - - - - Foreign costs 2,371 17.96 - -
Total Shipment Value 89,464 677.76 - - - -
FARM GATE ASSEMBLED PROCESSED
TRADED COMMODITIES (1 MT Final Traded Product)
PRODUCT RAW MATERIAL RAW MATERIAL
RICE
NGN USD NGN USD NGN USD
Domestic Value Added Costs & mark-ups 41,126
311.56 51,572
390.70 63,223
478.96 Official duties & tax 616
4.67 978
7.41 1,204
9.12 Additional costs 1,359
10.30 1,495
11.33 1,520
11.52 Total DVA 43,101
326.52 54,045
409.43 65,947
499.60 Foreign costs 7,142
54.11 7,856
59.52 8,665
65.64 Total Shipment Value 50,243
380.63 61,901
468.95 74,612
565.24
D.
NGN USD NGN USD NGN USD Domestic Value Added
Costs & mark-ups 75,235 569.96
- -
Official duties & tax 1,484 11.24
- -
Additional costs 1,964 14.88
- -
Total DVA 78,683 596.08
- -
- -
Foreign costs 10,831 82.05
- -
Total Shipment Value 89,514 678.14
- -
- -
Product 1 Product 2 Product 3
PROCESSED
TRADED COMMODITIES (1 MT Final Traded Product)
PRODUCT RAW MATERIAL RAW MATERIAL FARM GATE ASSEMBLED

114
114
3.4.5 Comparative Value Chain Analysis By Type of Rice Farms
Rice Profitability and Value Chain Indicators
The results comparing the profitability and value chain indicators for the three category of rice farming enterprises included in the study namely; family farms (FAM), emerging commercial farms (ECF) and large commercial farms (LCF) are presented in Table 3.35. The results show considerable variation in both operating and net profit as well as rate of return in respect of rice production. Operating profit is highest for ECF (US$402.69) followed by LCF (US$373.97) while the FAM has the lowest operating profit (US$339.49). Net profit has a different pattern being the highest for ECF (US$398.76) followed by FAM (US$333.91), while LCF has the lowest net profit (US$164.83). The rate of return is the highest for FAM followed by ECF and LCF (Table 3.35).
The value chain indicators relating to rice at the farm gate reveal that DVA for LCF (US$326.52) is the highest followed by that of ECF (US$137.98) while the lowest is DVA at the FAM level (US$109.54). In the same vein, SV is highest for LCF (US$380.63) followed by ECF (US$146.70) and FAM (US$120.64). The ECF has the highest ratio of DVA to SV (93 percent) followed by FAM (91 percent) and LCF (85 percent). Moreover, the ratio of domestic costs to DVA is also the highest for ECF (100 percent) followed by LCF (95 percent) and FAM (94 percent). This implies that at the FAM level, costs incurred in addition to domestic costs of production constitute a higher proportion of SV than it is the case for ECF and LCF. As it turned out, however, Nigerian rice remains uncompetitive in the international market irrespective of the level of commercialization of its production.
Comparison of Rice Shipment Values The shipment value consists of domestic costs and mark-ups, official duties and taxes, additional (unofficial) expenses and foreign costs. As noted earlier, domestic costs and mark-ups constitute a dominant part of the shipment value at each stage of the value chain. However, the structure varies not only from one stage to another but also among the three categories of farms. As shown in Table 3.36, composition of shipment values varies considerably across the farms and the various stages in the value chain.
At the LCF level, domestic costs and mark-ups range from 82 percent of SV at the production stage to 84 percent at the final delivery point. Compared to other categories of farms, foreign costs constitute the highest proportion (14 percent) of SV at the production stage. It is followed by FAM with 9 percent while ECF has the lowest (6 percent). Also, at the production stage, the proportion of official duties and tax as well as unofficial expenses appear to be the highest for the rice LCF compared to ECF and FAM; although in general, official duties and tax appear to be relatively very low. In the case of ECF, domestic costs and mark-ups constitute the highest proportion of SV at each stage of the value chain ranging from 94 percent at the production stage to 96 percent at the final delivery stage. The range in the case of FAM is between 86 percent at the production stage and 95 percent at the final delivery point. Although the proportion of domestic costs and mark-ups seems to be lowest in the case of LCF each in the value chain, the proportion of foreign costs remarkably exceeds that of FAM and ECF (see Figure 3.14). Overall, it appears that the emerging commercial farms will likely require the most serious attention in terms of efforts aimed at reducing production cost and enhancing the competitiveness of rice. The results also imply that the intensity of efforts will not only vary across the farms but also in terms of the specific components of shipment value.

115
115
Table 3.35
Rice Profitability and Value Chain Indicators By Level of
Commercialization of Farms
TRADED COMMODITY FARM GATE PRODUCT
ASSEMBLED RAW MATERIAL
PROCESSED RAW MATERIAL
MILLED RICE
PROFITABILITY
INDICATORS
FAM
GM (US$) NET PROFIT (US$) GM/TVC (%) NET PROFIT/TC (%) ECF
GM (US$) NET PROFIT (US$) GM/TVC (%) NET PROFIT/TC (%) LCF
GM (US$) NET PROFIT(US$) GM/TVC (%) NET PROFIT/TC (%)
VALUE CHAIN
INDICATORS
FAM
DVA (US$) SV (US$) DVA/SV (%) DC/DVA (%) ECF DVA (US$) SV (US$) DVA/SV (%) DC/DVA (%) LCF DVA (US$) SV (US$) DVA/SV (%) DC/DVA (%)
339 333 295 277
403 398 282 272
374 165 218 43
109 121 91 94
138 147 93
100
326 381 85 95
83 83 18 18
79 79 17 17
76 76 16 16
449 462 97 98
456 465 98 99
409 469 87 96
-45 -47 -8 -8
-47 -49 -8 -9
-8 -50 -9 -9
546 562 97 98
549 564 97 99
499 565 89 95
83 83 12 12
79 79 12 12
79 79 12 12
654 674 97 98
659 677 98 99
596 678 90 97
Source: Author’s computation
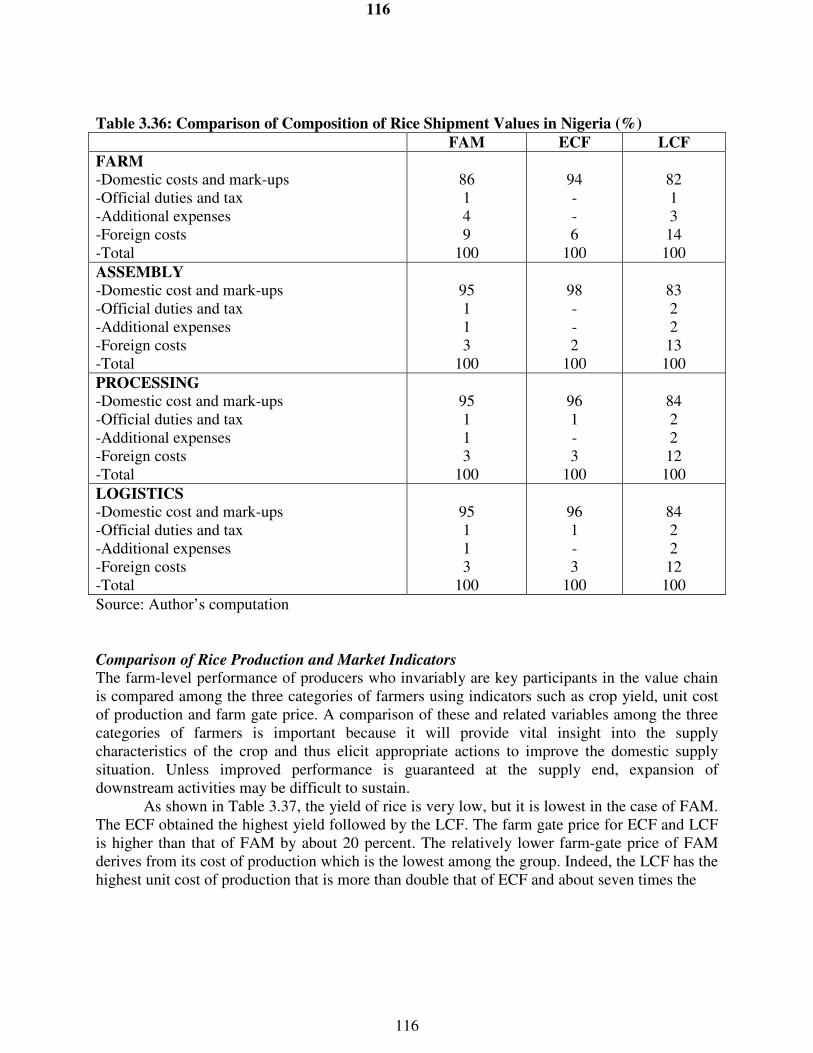
116
116
Table 3.36: Comparison of Composition of Rice Shipment Values in Nigeria (%)
FAM ECF LCF
FARM
-Domestic costs and mark-ups -Official duties and tax -Additional expenses -Foreign costs -Total
86 1 4 9
100
94 - - 6
100
82 1 3
14 100
ASSEMBLY
-Domestic cost and mark-ups -Official duties and tax -Additional expenses -Foreign costs -Total
95 1 1 3
100
98 - - 2
100
83 2 2
13 100
PROCESSING
-Domestic cost and mark-ups -Official duties and tax -Additional expenses -Foreign costs -Total
95 1 1 3
100
96 1 - 3
100
84 2 2
12 100
LOGISTICS
-Domestic cost and mark-ups -Official duties and tax -Additional expenses -Foreign costs -Total
95 1 1 3
100
96 1 - 3
100
84 2 2
12 100
Source: Author’s computation
Comparison of Rice Production and Market Indicators The farm-level performance of producers who invariably are key participants in the value chain is compared among the three categories of farmers using indicators such as crop yield, unit cost of production and farm gate price. A comparison of these and related variables among the three categories of farmers is important because it will provide vital insight into the supply characteristics of the crop and thus elicit appropriate actions to improve the domestic supply situation. Unless improved performance is guaranteed at the supply end, expansion of downstream activities may be difficult to sustain.
As shown in Table 3.37, the yield of rice is very low, but it is lowest in the case of FAM. The ECF obtained the highest yield followed by the LCF. The farm gate price for ECF and LCF is higher than that of FAM by about 20 percent. The relatively lower farm-gate price of FAM derives from its cost of production which is the lowest among the group. Indeed, the LCF has the highest unit cost of production that is more than double that of ECF and about seven times the

117
117
Figure 3.14: Comparison of Composition of Shipment Values in Rice Enterprises
FAM RICE ECF RICE LCF RICE
Source: Author’s computation
Composition of SV
(USD per MT Traded Commodity)
-
100
200
300 400
500
600
700 800
RICE Costs & Mark-ups Duties & Tax Unofficial Extras Foreign costs
Composition of SV
(USD per MT Traded Commodity)
-
100
200
300 400
500
600
700 800
RICE Costs & Mark-ups Duties & Tax Unofficial Extras Foreign costs
Composition of SV
(USD per MT Traded Commodity)
- 100
200 300 400
500 600 700
800
RICE Costs & Mark-ups Duties & Tax Unofficial Extras Foreign costs
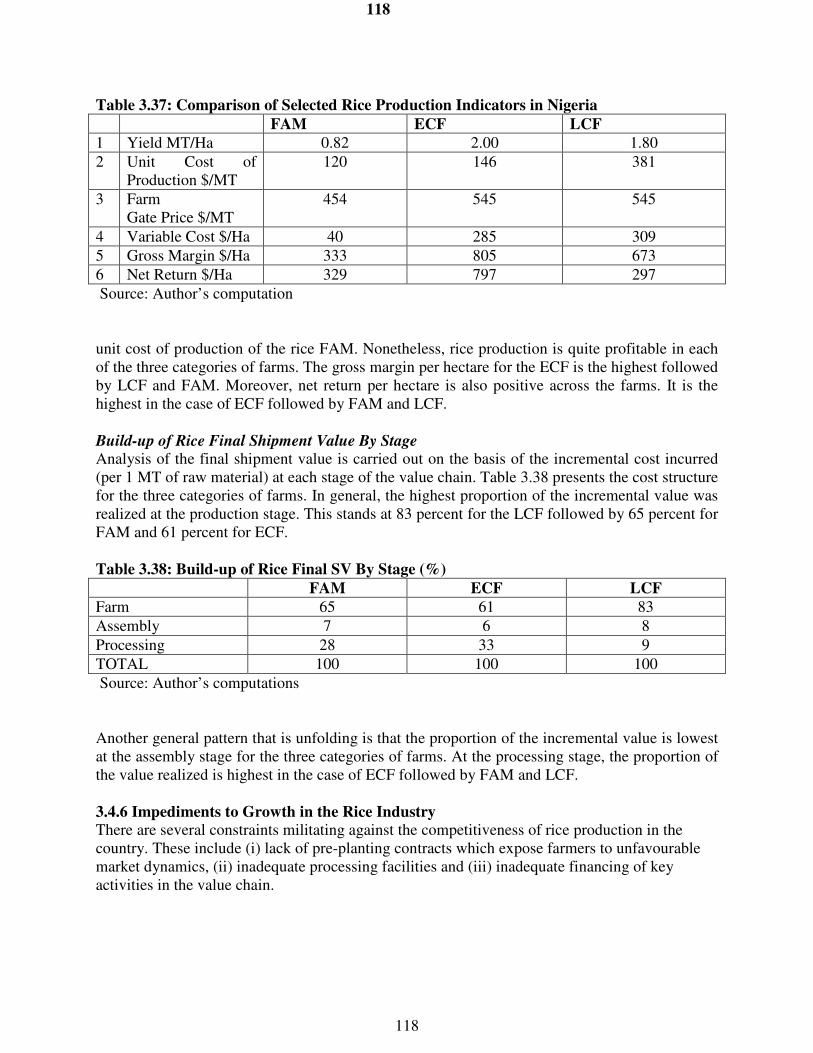
118
118
Table 3.37: Comparison of Selected Rice Production Indicators in Nigeria
FAM ECF LCF
1 Yield MT/Ha 0.82 2.00 1.80
2 Unit Cost of Production $/MT
120 146 381
3 Farm Gate Price $/MT
454 545 545
4 Variable Cost $/Ha 40 285 309
5 Gross Margin $/Ha 333 805 673
6 Net Return $/Ha 329 797 297
Source: Author’s computation unit cost of production of the rice FAM. Nonetheless, rice production is quite profitable in each of the three categories of farms. The gross margin per hectare for the ECF is the highest followed by LCF and FAM. Moreover, net return per hectare is also positive across the farms. It is the highest in the case of ECF followed by FAM and LCF. Build-up of Rice Final Shipment Value By Stage Analysis of the final shipment value is carried out on the basis of the incremental cost incurred (per 1 MT of raw material) at each stage of the value chain. Table 3.38 presents the cost structure for the three categories of farms. In general, the highest proportion of the incremental value was realized at the production stage. This stands at 83 percent for the LCF followed by 65 percent for FAM and 61 percent for ECF. Table 3.38: Build-up of Rice Final SV By Stage (%)
FAM ECF LCF
Farm 65 61 83
Assembly 7 6 8
Processing 28 33 9
TOTAL 100 100 100
Source: Author’s computations
Another general pattern that is unfolding is that the proportion of the incremental value is lowest at the assembly stage for the three categories of farms. At the processing stage, the proportion of the value realized is highest in the case of ECF followed by FAM and LCF.
3.4.6 Impediments to Growth in the Rice Industry
There are several constraints militating against the competitiveness of rice production in the country. These include (i) lack of pre-planting contracts which expose farmers to unfavourable market dynamics, (ii) inadequate processing facilities and (iii) inadequate financing of key activities in the value chain.

119
119
3.5 Value Chain Analysis of the Soybean Industry
3.5.1 World Market Structure
The production of soybean as a commercial crop has been going on from time immemorial in temperate ecologies, first in northern Asia and in more recent years in North America and countries of the Southern Cone of Latin America. The remarkable success of this crop in temperate zones is well known to all, but there is also a very important potential role for soybean in many cropping systems of the tropics and subtropics, where often the farms are mostly small and with little mechanization. Access to local markets appears to be the main constraint in many developing countries in the tropics and sub-tropics where local soybean production could improve farmer incomes and the sustainability of the production system. Often soybean is imported into countries by the local vegetable oil and feed industries and as a consequence no demand for the crop is felt in the farming community. Where good market links from processors to local farmers have been made, as in Nigeria and especially in India, the farmers generally respond and the crop finds a good home in diverse cereal and root crop based production systems. (Thoenes, 2004).
Evidence suggests that soybean contributes significantly to the total value added by the agricultural sector in the major producing countries and particularly so in Brazil, Argentina, Paraguay and the USA. In these countries, soybeans and its two main sub-products also occupy an important position in export earnings from agriculture as well as in terms of total merchandise exports. A few other countries, notably India and China, are also involved in exports (mainly soymeal) but these play a more limited role and are subject to considerable year-to-year variation. Among the group of undernourished countries, apart from India, Bolivia is the only country that derives significant income from export of soybean and derived products. A significant feature of the soybean economy is that considerable value addition occurs at the downstream stages of the production and processing chain. On-farm storage of soybean plays a minor role and small-scale processing and marketing at local level is only relevant in those - statistically less important - areas where soybeans are directly consumed as food. At the global level, the bulk of soybeans produced is stored and shipped in bulk to large-scale industrial units for further processing into oil and meal. Within the soy complex, beans account for about half of the total value of trade; the shares of soymeal and soyoil are 35 and 15 percent respectively, while that of soyfoods is negligible. Soyoil occupies a dominant position in global vegetable oil trade both in volume and value terms. However, over the years, palm oil has become a major competitor, and the two oils directly compete for market share, based on their relative price. Soymeal, on the other hand, as a high value ingredient for compound feed, occupies a leading position in global feedstuffs trade. The key producing countries export a combination of beans and their two subproducts (soyoil and soymeal), depending on the requirements of the market and domestic policies. A main feature of the market is the high level of concentration, with five countries (two developed and three developing) accounting for over 90% of the market. The main competitors on the export market are USA, Brazil and Argentina. Soybean output and exports from Brazil and Argentina have grown phenomenally; both countries share approximately 30 percent of the soybean export market. Brazilian soybean output in 2000/02 stood at 45 million tonnes while Argentina’s output increased to 29.5 million tonnes (Vorley, 2005). A large number of countries are involved in the importation of soybeans and/or products for domestic consumption and, in some cases, for re-exportation purposes. Depending on domestic demand, which is also determined by the structure of the local processing industry,

120
120
countries import either the raw material, soybeans, or directly soyoil and/or soymeal. In recent years, a number of importing countries have shifted from the importation of soyoil or meal to purchases of beans, which reflects efforts to promote processing - and thus value addition - at the domestic level.
4.5.2 Nigerian Market Structure
Soybean has significant economic and nutritional importance and it is in high demand in Nigeria. Economically soybean cake and oil are of great importance to the country. The cake/meal serves as feeding stuff (protein concentrates) to livestock while oil is consumed locally and used in the manufacture of skin lotions, margarine, salad oil, drying oil, etc. By 2003, the industrial demand for soybeans was about 634,000 metric tonnes compared with a supply level of 386,853 metric tonnes. Considering the use of soybean for boosting the protein and mineral content of local diets such as soymeal, dadawa, soy ogi, soya egusi and others in addition to the industrial use, the level of demand in the country has still not been met (RMRDC, 2004).
Nigerian soybean has been reported to be one of the best quality soybeans in the world. Its quality is said to compare favourably with ‘yellow gold’, the United State of America’s variety. Soya-bean gained export status in 1943 when a tonne of soybean was exported from Nigeria. The exported quantity rose to 26,000 in 1962/63 and ever since, the export market has not expanded as expected. The major international buyers are the countries in the West African sub-region: Niger Republic, Chad etc, whose climatic conditions do not favour the cultivation of soybeans. Other consuming countries are Netherlands, United Kingdom, Turkey, France and Poland. Although Nigerian soybeans is exported and is utilized by other nations in their industries, it was observed that there was no sufficient documented evidence of this transaction. Soybeans as a crop does not seem to enjoy an organized trade, the business is rather left in the hands of actors who run it based on their whims and caprices. Since the documented records of commercial transactions are not available, it becomes difficult to reliably determine the quantity of soybeans exported or imported into the country. The available import data between 2002 and 2005 show a haphazard trend. As shown in Fig. 3.15, soybean import rose sharply from �15.23 million in 2002 to �157.58 million in 2003. There was no official record of import in 2004; but by 2005, about 78 tonnes of soybean valued at �17.21 million were imported into the country.
Fig. 3.15: Trend in Soybean
Import in Nigeria,2002-2005
0
50
100
150
200
2002 2003 2004 2005
Year
mil
lio
n n
air
a

121
121
4.5.3 Characterization of the Soybean Value Chain Soybean Production and Cropping System
Soybean production is prominent in the three northern zones – NW, NE and NC; but the leading producer is NC (Table 3.39 and Fig. 3.16). The share of NC in total soybean production between 1999 and 2004 averaged 61 percent. Nonetheless, production trended downwards in NC whereas the trend is on the increase in NW and NE (Fig. 3.16). The land area cultivated to soybean follows a similar trend (Fig. 3.17). The average yield of soybean ranges from 0.59mt/ha in SW to 1.27mt/ha in NC.
Table 3.39: Soybean Production in Nigeria, 1999-2004
1999 2000 2001 2002 2003 2004
NORTHWEST
-Area(‘000Ha) -Output(‘000MT) -Share of Total (%) -Yield (MT/Ha)
78.17 102.39 32.84 1.30
81.51 114.21 32.90 1.40
89.474 112 34.13 1.25
90 117.38 35.27 1.3
121 123.28 36.42 1.01
122.32 125.89 34.86 1.02
NORTHEAST
-Area(‘000Ha) -Output(‘000MT) -Share of Total (%) -Yield (MT/Ha)
10.21 7.33 2.35 0.7
8.042 6.27 1.81 0.75
8.27 7.41 2.26 0.87
7.81 6.93 2.08 0.85
8.06 6.84 2.02 0.75
34.61 24.68 6.83 0.70
NORTHCENTRAL
-Area(‘000Ha) -Output(‘000MT) -Share of Total (%) -Yield (MT/Ha)
147 195.73 62.77 1.32
146.45 218.88 63.04 1.49
171.03 202 61.77 1.18
170.9 203.24 61.08 1.19
167.167 202.954 59.95 1.20
159.36 205.15 56.80 1.28
SOUTHWEST
-Area(‘000Ha) -Output(‘000MT) -Share of Total (%) -Yield (MT/Ha)
6.99 5.41 1.74 0.83
8.91 6.771 1.95 0.75
10.1 5.09 1.55 0.5
9.42 4.25 1.28 0.44
9.02 4.38 1.29 0.45
7.54 4.33 1.20 0.57
SOUTHEAST
-Area(‘000Ha) -Output(‘000MT) -Share of Total (%) -Yield (MT/Ha)
0.76 0.95 0.30 1.25
0.84 1.06 0.31 1.26
0.81 0.94 0.29 1.16
0.89 0.96 0.29 1.07
1.03 1.07 0.32 1.03
1.08 1.13 0.31 1.04
ALL ZONES
-Area(‘000Ha) -Output(‘000MT)
243.10 311.80
245.80 347.20
279.70 327.40
279.00 332.80
306.30 338.50
324.90 361.20
Source: Underlying data from the Project Coordinating Unit of the Federal Ministry of Agriculture and Rural Development, Abuja

122
122
Fig. 3.16: Soybean Production By Agro-
Ecological Zones in Nigeria
0
50
100
150
200
250
1999 2000 2001 2002 2003 2004
Year
Ou
tpu
t ('
00
0 M
T)
NW
NE
NC
SW
SE
Fig. 3.17: Land Area Cultivated to Soybean in Nigerian
Agro-Ecological Zones
0
50
100
150
200
1999 2000 2001 2002 2003 2004
Year
'00
0 H
a
NW
NE
NC
SW
SE

123
123
Although it is more profitable to grow soybean as a sole crop, the traditional farmer plants soybean in mixture with millet, sorghum and maize. Cereals are grown for food while soybean is for cash. Good rotation sequence with soybean improves the yield of cereals. Usually the farms are small and are less than 5 hectares. Harvesting is carried out when pods are dry. Seed moisture content decreases rapidly when drying weather prevails during harvest time. In such a case, seed moisture may drop to 10 percent or less. Prompt harvest is essential in soybean; if harvesting is delayed, the pods may shatter resulting in yield losses and seed deterioration due to alternate wetting and drying. Harvesting and threshing can be manual or mechanical.
Soybean is utilized as cooking oil and protein concentrates in feed milling. The crop also finds uses for soymilk, confectionery, infant weaning foods and seasonings. Soybean processing in Nigeria is therefore geared towards obtaining these products. Processing soybeans to oil employs both the mechanical system of presses and expellers and the chemical system of solvent extraction. The de-oiled cake from soybean processing is marketed as protein concentrate and used for livestock feed milling. Soybean protein extract is also processed to obtain texturized vegetable protein which is utilized in food formulations as meat alternative in view of its protein quantity and physical attributes. The nutritional goodness of soybean is also fully utilized in other food processing operations for producing weaning foods, seasonings and soy milk.
3.5.4 Results of the Soybean Value Chain Analysis
The relevant stages in the value chain analysis for soybean are production, assembly and trade. Data on individual products resulting from soybean processing is difficult to come by within the period earmarked for collecting data for this study. Therefore, the analysis of the competitiveness of soybean focuses on soybean as grains since the commodity is still traded internationally in the form of grains. It is treated in this study as an import substitute. The analysis focuses on key indicators of profitability in the soybean value chain as well as the indicators of performance of the value chain with a view to determining the international competitiveness of the commodity. The analysis is conducted at three levels of operation – family farm (FAM), emerging commercial farm (ECF) and large commercial farm (LCF). (a) Financial Costs and Profitability Indicators
The results show clearly the major cost items at each stage in the soybean value chain with considerable variation at the production stage. With regard to the soybean FAM, hired labour is the most important cost component; representing 44 percent of the total production cost. This is followed by seeds, fertilizer and chemicals (27 percent), marketing (18 percent), spraying and machine operations (9 percent) while the proportion of depreciation (2 percent) is the lowest. In the case of ECF, overhead and management has the highest share (36 percent) of production cost; followed by hired labour (28 percent), seed, fertilizer and chemicals (19 percent), spraying and machine operation (14 percent) while the proportion of marketing cost (3 percent) is the lowest. The cost structure for the LCF sector is quite different. The cost of fixed capital is overwhelming especially in view of the fact that the LCF is highly capitalized with expensive machines (ploughs, harrows, harvesters etc.) which were purchased within the last three years. Invariably, the fixed cost measured by the depreciation of the fixed capital represents 99.6 percent of total production cost. At the assembly stage, packing and storage cost tends to dominate in all the farm sectors (with a share of 66 percent of total cost); followed by hired labour and crop levies which have a share of 17 percent each. The build-up of logistics cost shows a distribution that is heavily skewed towards transport to delivery point whose share of

124
124
total cost ranges from 74 percent for the FAM sector to 79 percent for the ECF and 87 percent for the LCF (Table 3.40).
As regards the FAM, the results show that operating profit and net profit are positive at both the production and assembly stages as well as the final delivery stage. At the production stage, the gross margin is US$159.95 while net profit is US$156.54. The rates of return at this stage range from 76 percent on the basis of net profit to 79 percent based on operating profit. In view of the negligible investment cost at the assembly stage the operating profit (US$9.09) is the same as the net profit and the rate of return is only two percent. At the stage of final delivery, both the gross margin and the net profit have the same value (US$107.89) and the rate of return is about 26 percent (Table 3.41).
Table 3.40: Structure of Financial Costs in Soybean Enterprises in Nigeria percent
COST ITEMS FARM
PRODUCT
ASSEMBLY LOGISTICS
FAM
Hired Labour 44 17
Seed, Fertilizer & Chemicals 27
Marketing 18
Spraying & Machine Operation 9
Fees & Crop Levies 17
Packing & Consumables 66
Loading & Storage 23
Overhead & Management 3
Transport to Delivery Point 74
Depreciation 2
TOTAL 100 100 100
ECF
Hired Labour 28 17
Seed, Fertilizer & Chemicals 19
Marketing 3
Spraying& Machine Operation 14
Fees & Crop Levies 17
Packaging & Consumables 66
Loading & Storage 17
Overhead & Management 36 4
Transport to Delivery Point 79
Depreciation
TOTAL 100 100 100
LCF
Hired Labour 0.1 17
Seed, Fertilizer & Chemicals 0.2
Spraying, & Machine Operation 0.1
Vehicle O & M
Fees & Crop Levies 17
Packing & Consumables 66
Loading & Storage 12
Overhead & Management 1
Transport to Delivery Point 87
Depreciation 99.6
TOTAL 100 100 100
Source: Author’s computations

125
125
Table 3.41: Financial and Profitability Indicators of Soybean Enterprises in Nigeria (Per MT)
FAM SOYBEAN
ECF SOYBEAN
LCF SOYBEAN
Source: Author’s computation
NGN USD NGN USD NGN USD
Gross revenue 54,000 409.09 54,000 409.09 70,000 530.30
Production costs
Crop purchase - 48,000 363.64 54,000 409.09
Other variable costs 29,783 225.63 4,800 36.36 2,300 17.42
Investment costs - - - - -
Total costs 29,783 225.63 52,800 400.00 56,300 426.52
Final income
Gross margin 24,217 183.46 1,200 9.09 13,700 103.79
Net profit 24,217 183.46 1,200 9.09 13,700 103.79
Rates of return
Gross margin/total VCGross margin/total VC 0.81 0.02 0.24
Net profit/total costs 0.81 0.02 0.24
FARM GATE
PRODUCT RAW MATERIAL
TRADED
COMMODITY
ASSEMBLED
NGN USD NGN USD NGN USD
Gross revenue 45,000 340.91 54,000 409.09 63,636 482.09
Production costs
Crop purchase - 48,000 363.64 49,091 371.90
Other variable costs 47,154 357.23 4,800 36.36 3,136 23.76
Investment costs 413,801 3,134.86 - - -
Total costs 460,955 3,492.08 52,800 400.00 52,227 395.66
Final income
Gross margin (2,154) (16.32) 1,200 9.09 11,409 86.43
Net profit (415,955) (3,151.17) 1,200 9.09 11,409 86.43
Rates of return
Gross margin/total VCGross margin/total VC (0.05) 0.02 0.22
Net profit/total costs (0.90) 0.02 0.22
TRADED
COMMODITY
ASSEMBLEDFARM GATE
PRODUCT RAW MATERIAL
NGN USD NGN USD NGN USD Gross revenue 48,000 363.64 54,000 409.09 70,000 530.30 Production costs
Crop purchase - 48,000 363.64 54,000 409.09 Other variable costs 26,887 203.69 4,800 36.36 1,758 13.32 Investment costs 450 3.41 - - -
Total costs 27,337 207.10 52,800 400.00 55,758 422.41 Final income
Gross margin 21,113 159.95 1,200 9.09 14,242 107.89 Net profit 20,663 156.64 1,200 9.09 14,242 107.89
Rates of return Gross margin/total VC Gross margin/total VC 1.79 0 0.02 0.26
Net profit/total costs 0.76 0.02 0.26
TRADED COMMODITY
ASSEMBLED FARM GATE PRODUCT RAW MATERIAL

126
126
As regards the ECF, both operating profit and net profit are also positive at all stages of the chain. At the production stage, the gross margin per tonne is US$183.46 while at the assembly stage it is US$9.09. At the final delivery stage the operating profit is US$103.79. The rates of return (net profit/total cost) range from 2 percent at the assembly stage to 26 percent at the final delivery stage and 81 percent at the farm production stage. In the case of LCF, both operating profit and net profit are positive at all relevant stages of the chain with the exception of the farm production stage. At the assembly stage, the gross margin per tonne is US$9.09 while at the final delivery stage the operating profit (gross margin) per tonne is US$86.43. The rates of return (net profit/total cost) range from 2 percent at the assembly stage to 22 percent at the final delivery stage. (b) Soybean Value Chain Indicators
The value chain indicators for the final traded commodity reveal that substantial increase in shipment value occurs between the production stage and final delivery of the commodity. As shown in Table 3.42, the SV for the FAM sector increased from US$207.10 to US$422.42 representing an increase of about 104 percent. Soybean production yields a value added (US$154.06) which represents 74 percent of the shipment value. About 95 percent of the DVA is accounted for by domestic costs and mark-ups. For the purpose of determining the international competitiveness of soybean, the final shipment value is compared with the import parity price. The result shows that the final SV (US$422.41) is higher than the import parity price (US$259.56) implying that Nigerian soybean is not competitive in the international market.
In the case of ECF, the value chain indicators for the final traded commodity also reveal that substantial increase in shipment value occurs between the production of soybean and final delivery of the commodity. As shown in Table 3.42, the SV increased from US$232.3 to US$426.52 representing an increase of about 84 percent. Soybean production yields a value added (US$255.71) which represents 110 percent of the shipment value which is accounted for entirely by domestic costs and mark-ups. For the purpose of determining the international competitiveness of soybean, the final shipment value is compared with the import parity price. The result shows that the final SV (US$426.52) is higher than the import parity price (US$259.56) implying that Nigerian soybean is not competitive in the international market.
With regard to the LCF sector, the value chain indicators for the final traded commodity reveal that substantial change in shipment value occurs between the production of soybean and final delivery of the commodity. As shown in Table 3.42, the SV decreased from US$3,146.46 to US$435.23 or by about 86 percent. Soybean production yields a value added (US$587.93) which represents 19 percent of the shipment value out of which 17 percent is accounted for by domestic costs and mark-ups. Foreign costs represents 81 percent of the shipment value at the soybean production stage indicating the high degree of foreign dependence by large commercial farms in terms of imported inputs. For the purpose of determining the international competitiveness of soybean, the final shipment value is compared with the import parity price. The result shows that the final SV (US$435.23) is higher than the import parity price (US$259.56) implying that Nigerian soybean is not competitive in the international market.

127
127
Table 3.42: Soybean Value Chain Indicators in Nigeria (Per MT)
FAM SOYBEAN
ECF SOYBEAN
LCF SOYBEAN
Source: Author’s computation
NGN USD NGN USD NGN USD
Domestic Value Added
Costs & mark-ups 33,754 255.71 55,890 423.41 66,504 503.82
Official duties & tax - - - - -
Additional costs - - - - 100 0.76
Total DVA 33,754 255.71 55,890 423.41 66,604 504.58
Foreign costs (3,090) (23.41) (10,304) (78.06) (10,304) (78.06)
Total Shipment Value 30,664 232.30 45,586 345.35 56,300 426.52
TRADED
PRODUCT RAW MATERIAL COMMODITY
FARM GATE ASSEMBLED
NGN USD NGN USD NGN USD
Domestic Value Added
Costs & mark-ups 72,140 546.52 (290,394) (2,199.95) 106,090 803.71
Official duties & tax 1,432 10.85 1,432 10.85 1,432 10.85
Additional costs 4,036 30.58 4,036 30.58 4,086 30.95
Total DVA 77,607 587.93 (284,926) (2,158.53) 111,608 845.52
Foreign costs 337,726 2,558.53 (54,157) (410.28) (54,157) (410.28)
Total Shipment Value 415,333 3,146.46 (339,083) (2,568.81) 57,451 435.23
FARM GATE ASSEMBLED TRADED
PRODUCT RAW MATERIAL COMMODITY
NGN USD NGN USD NGN USD Domestic Value Added
Costs & mark-ups 19,337 146.49 44,782 339.26 51,587 390.81 Official duties & tax 277 2.10 285 2.16 275 2.08 Additional costs 722 5.47 732 5.55 783 5.93
Total DVA 20,336 154.06 45,799 346.96 52,645 398.83 Foreign costs 7,001 53.04 3,114 23.59 3,114 23.59
Total Shipment Value 27,337 207.10 48,913 370.55 55,759 422.42
FARM GATE ASSEMBLED TRADED PRODUCT RAW MATERIAL COMMODITY

128
128
3.5.5 Comparative Value Chain Analysis By Type of Soybean Farms
Soybean Profitability and Value Chain Indicators
Table 3.43 presents a summary of the results comparing the profitability and value chain indicators for the three categories of soybean farms included in the study namely; FAM, ECF and LCF. The results show that operating profit is highest for ECF (US$183.42) followed by FAM (US$159.95) while in the case of LCF the operating profit is negative. Net profit has a similar pattern but remains at the same level as operating profit for ECF. The rates of return (in terms of gross margin/total variable cost and net profit/total cost) are higher for ECF than FAM. The value chain indicators relating to soybean at the farm product stage reveal that DVA for LCF (US$587.93) is the highest followed by that of ECF (US$255.71) while the lowest is DVA at the FAM level (US$154.06). In the same vein, SV is highest for LCF (US$3,146.46) followed by ECF (US$232.30) and FAM (US$207.10). The ECF has the highest ratio of DVA to SV (109 percent) followed by FAM (74 percent) and LCF (18 percent). Moreover, the ratio of domestic costs to DVA is also the highest for ECF (100 percent) followed by FAM (95 percent) and LCF (93 percent). This implies that at the LCF level, costs incurred in addition to domestic costs of production constitute a higher proportion of SV than it is the case for FAM and ECF. As it turned out, however, soybean production in Nigeria remains uncompetitive in the international market irrespective of the level of commercialization.
Comparison of Soybean Shipment Values
The shipment value consists of domestic costs and mark-ups, official duties and taxes, additional (unofficial) expenses and foreign costs. As shown in Table 3.44, the composition of soybean shipment values varies considerably across the farms and the various stages in the value chain. At the FAM level, domestic costs and mark-ups range from 71 percent of SV at the production stage to 92 percent at the assembly stage and 93 percent at the final delivery point. Compared to other categories of farms, foreign costs in respect of LCF constitute the highest proportion (82 percent) of SV at the production stage. It is followed by FAM with 26 percent while ECF has the lowest (8 percent).
In the case of ECF, domestic costs and mark-ups constitutes the highest proportion (92 percent) of SV at the production stage whereas LCF has the lowest proportion (17 percent). Although the proportion of domestic costs and mark-ups seems to be lowest in the case of LCF at the final delivery stage, the proportion of foreign costs still exceeds that of FAM and ECF (see Figure 3.18). The unfolding results point to the fact that domestic costs and mark-ups contribute more to the rising shipment values in the soybean chain than foreign costs as far as the FAM and ECF sectors are concerned whereas in the case of LCF the foreign costs contribute more than domestic costs. Improving the profitability and competitiveness of soybean will therefore, require different policy measures across the farm sectors. Whereas the LCF will benefit more from trade and other related policies, the soybean FAM and ECF may derive greater benefits from sector-specific and other domestic interventions.
Comparison of Soybean Production and Market Indicators In comparing farm-level performance of the three farm sectors, attention is focused on key indicators such as yield, unit cost of production and farm gate price. As shown in Table 3.45, the yield of soybean is very low, but it is lowest in the case of FAM. The ECF obtained the highest

129
129
Table 3.43
Soybean Profitability and Value Chain Indicators By Level of
Commercialization of Farms
TRADED COMMODITY
FARM GATE PRODUCT
ASSEMBLED RAW MATERIAL
DRY SOYBEAN GRAINS
PROFITABILITY
INDICATORS
FAM GM (US$) NET PROFIT(US$) GM/TVC (%) NET PROFIT/TC (%) ECF GM (US$) NET PROFIT(US$) GM/TVC (%) NET PROFIT/TC (%) LCF
GM (US$) NET PROFIT (US$) GM/TVC (%) NET PROFIT/TC (%)
VALUE CHAIN
INDICATORS
FAM
DVA (US$) SV (US$) DVA/SV (%) DC/DVA (%) ECF
DVA (US$) SV (US$) DVA/SV (%) DC/DVA (%) LCF
DVA (US$) SV (US$) DVA/SV (%) DC/DVA (%)
159 156 79 76
183 183 81 81
-16 -3,151 -5 -90
154 207 74 95
256 232 109 100
588 3,146 18 93
9 9 2 2
9 9 2 2
9 9 2 2
347 370
91 98
423 345 123 100
-2,158 -2,568
84 102
107 107
26 26
103 103 24 24
86 86 22 22
398 422 92 98
504 426 118 99
845 435 194 95
Source: Author’s computation

130
130
Table 3.44: Comparison of Composition of Soybean Shipment Values in Nigeria (%)
FAM ECF LCF
FARM
-Domestic costs and mark-ups -Official duties and tax -Additional expenses -Foreign costs -Total
71 1 3
26 100
92 - - 8
100
17 - 1
82 100
ASSEMBLY
-Domestic cost and mark-ups -Official duties and tax -Additional expenses -Foreign costs -Total
92 1 1 6
100
84 - -
16 100
84 - 1
15 100
LOGISTICS
-Domestic cost and mark-ups -Official duties and tax -Additional expenses -Foreign costs -Total
93 - 1 6
100
87 - -
13 100
64 1 2
33 100
Source: Author’s computation
Table 3.45: Comparison of Selected Soybean Production Indicators in Nigeria
FAM ECF LCF
1 Yield MT/Ha 0.98 1.41 1.30
2 Unit Cost of Production $/MT
207 226 3,492
3 Farm Gate Price $/MT
364 409 341
4 Variable Cost $/Ha 153 318 464
5 Gross Margin $/Ha 206 259 -21
6 Net Return $/Ha 203 259 -4,096
Source: Author’s computation

131
131
Figure 3.18: Composition of Shipment Value for Soybean Enterprises in Nigeria
FAM SOYBEAN ECF SOYBEAN LCF SOYBEAN
Source: Author’s computation
Composition of SV
(USD per MT Traded Commodity)
-
50
100
150
200
250
300
350
400
450
SOYBEAN
Costs & Mark-ups
Duties & Tax
Unofficial Extras
Foreign costs
Composition of SV
(USD per MT Traded Commodity)
(200)
(100)
-
100
200
300
400
500
600
SOYBEAN
Costs & Mark-ups
Duties & Tax
Unofficial Extras
Foreign costs
Composition of SV (USD per MT Traded Commodity)
(600) (400) (200)
- 200 400 600 800
1,000
SOYBEAN
Costs & Mark-ups Duties & Tax Unofficial Extras Foreign costs

132
132
yield followed by the LCF. The farm gate price for the ECF sector is the highest; followed by FAM and LCF. Soybean appears to be profitable at the FAM and ECF sectors (but more so in the latter than the former) whereas in the case of the LCF the returns seem to be negative. The unit cost of production is lowest in the FAM sector; the level of variable cost is also the lowest compared with ECF and LCF. However, this has not translated to the highest level of performance in terms of gross margin and net return per hectare due to the fact that the farm gate price in the FAM sector is the lowest.
Build-up of Soybean Final Shipment Value By Stage Analysis of the final shipment value is carried out on the basis of the incremental cost incurred (per 1 MT of raw material) at each stage of the soybean value chain. Table 3.46 presents the cost structure for the three categories of farms. The highest proportion (50 percent) of the incremental value was realized at the production stage only in respect of the FAM sector. With regard to the ECF, the highest proportion (50 percent) was realized at the final delivery stage while the lowest (15 percent) was realized at the production stage. In the case of LCF, the highest proportion (50 percent) of the incremental value was realized at the assembly stage, whereas only 7 percent was realized at the final delivery stage.
Table 3.46: Build-up of Soybean Final SV By Stage (%)
FAM ECF LCF
Farm 50 15 43
Assembly 28 35 50
Trade 22 50 7
TOTAL 100 100 100
Source: Author’s computations 3.5.6 Impediments to Growth in the Soybean Industry
The major constraints to higher soybean production and utilization in the country include the following.
� Ignorance of improved production methods among the farmers � Inadequate supply of modern input � Poor pricing of agricultural produce � Inaccessibility of credit facilities to majority of the farmers � Poor storage facilities � Untimely release of loans resulting in delayed farm operations such as late planting, late
harvesting, inability to procure inputs on time and reliance on manual harvesting in a situation where mechanization should have been ideal
� Very low fertility of the soil. The level of availability of critical nutrients such as phosphates, nitrogen, potassium, boron is extremely low in some areas
� Available fertilizer is grossly deficient in essential micronutrients.

133
133
3.6 Value Chain Analysis of the Sugarcane Industry
3.6.1 Review of Sugar-cane Value Chain Studies
Quantitative studies on sugar-cane value chain studies are non-existent in the country. However, the issues of competitiveness of sugar products in the international market and the performance of the sugar industry have been a major concern in existing literature. Busari (2004) considered some of the qualitative aspects of these issues and identified some causes of the dismal production record of the sugar industry. They are (i) low capacity utilization in the existing mills, (ii) too few operating sugar mills in the country, (iii) availability of cheap imported sugar which led to progressive decline in local output, (iv) persistently inadequate supply of raw material (sugar-cane), (v) lack of improved indigenous technology for sugar processing, (vi) lack of a statutory regulatory organ for sugar-cane and sugar research and development prior to the establishment of the National Sugar Development Council in 1993 and (vii) low level of efficiency of sugar recovery in existing mills. As argued by the author, the unit cost of production of local sugar is higher than the price of imported sugar due largely to the heavy subsidies and varied grants enjoyed by producers who dumped their surplus sugar on the international market. He concludes that it is highly unlikely that countries like Nigeria can produce sugar at costs that will be low enough to match the prices of such cheap imports. This implies that domestic efforts aimed at reducing production costs will be necessary but not sufficient to ensure that Nigerian sugar is competitive in the international market.
3.6.2 World Market Structure
There has been widespread participation of several countries in the production, consumption, import and export of sugar all over the world leading to rapid expansion of the global sugar industry over the last two decades. Available data (IS0, 2000) indicate that world output of sugar increased from about 118 million tonnes in1995 to 130 million tonnes in 2000. Over the period the share of beet sugar declined from 31 to 27 percent while that of cane sugar rose from 69 to 73 percent. Sugar has a distinct characteristic in the sense that the major producers and exporters also tend to be the major consumers and importers. The top five sugar producers, Brazil, EU, India, China and USA were also the top consumers in the world. India was on top of the list of consumers in 2000 (consuming about 16.4 million tonnes) followed by EU (14.1 million tonnes), Brazil (9.7 million tones), USA (8.9 million tonnes) and China 98.5 million tonnes). As at 2000, Brazil remained the leading exporter followed by EU, Australia, Thailand and Cuba. At the top of the five leading importers in 2000 was the Russian Federation followed by EU, Japan, Korea and USA. Increased world sugar output has been due a combination of factors including field expansion and radical improvement in technology (in Brazil), improved efficiency and increased capacity utilization of existing facilities (in China), area expansion and favourable weather (in Thailand), fertile land, good weather and supportive role of government in the form of subsidies and financing of research and infrastructure (in the US) (see Busari, 2004). Between 1995 and 2000, sugar imports followed an upward trend in view of the persistent decline in world prices. From an all time high of 13.28 cents/lb in 1995, the ISA daily price (which is the average of the New York Coffee and Sugar Exchange spot price and the London Daily Price) declined to 6.27 cents/lb in 1999. And on the basis of the London Daily Price, sugar prices have slumped from $333/tonne in 1995 to $160.8/tonne in 1999. Thus, it has been possible to stabilize the world per capita consumption of sugar at about 21 kg annually over the period.

134
134
3.6.3 Nigerian Market Structure
Two types of sugar-canes are produced in Nigeria – industrial cane and the chewing cane. Industrial sugar-cane is the major raw material used in the manufacture of sugar in the country. The chewing cane is mainly chewed in its natural form for its sweet juice, although the local populace often process part of the sugar-cane into various forms of sugar products. However, despite the long history of commercial sugar-cane cultivation in Nigeria which dates back to the 1950s, the sugar industry remains grossly underdeveloped. The sugar requirements of the country remains largely unmet from domestic sources despite favourable agro-climatic and edaphic conditions for the production of sugar-cane and in spite of the long period of existence of sugar mills. This is due to several reasons chief among them is the very low level of production of industrial cane in the country.
Between 1990 and 2000, the output of industrial cane was higher than that of chewing cane only for a period of three years - 1990 to 1992. Thereafter, the output of chewing cane has been much higher. Besides, the output of chewing cane has trended upwards over the years whereas that of industrial cane followed a declining trend (Figure 3.19). Output of chewing cane increased from 336,000 tonnes in 1990 to 793,000 tonnes in 2000 while the output of industrial cane plunged precipitously from 584,000 tonnes to 52,000 tonnes during the same period. The downstream activities in the sugar industry have also not achieved the desired results. Domestic production of sugar had suffered considerably with the output declining from 41851 tonnes in 1990 to mere 4000 tonnes in 2000. It has not been possible for domestic output to meet up to 5 percent of sugar supply in the country during the period. There has been heavy reliance on import (Table 3.47). Even in the face of declining domestic output, sugar import could not be allowed to rise continuously due to foreign exchange difficulties. The overall consequence, is that per capita consumption of sugar in Nigeria has been very low. It stood at 8.0 kg in 1999 far behind the world figure of 20.8 kg and figures in some developing countries such as Swaziland (69.0 kg), Gibraltar (83.3 kg), Singapore (69.0 kg) just to mention a few (see Busari, 2004) Hitherto, sugar production in the country had been carried out largely by two government-owned companies which had demonstrated very woeful performance over the years. One of the companies (The Nigerian Sugar Company Ltd) started operations since 1964 while the other (Savannah Sugar Company Ltd) was commissioned in 1980. Recently, however, the companies have been privatized under the 2003-2007 reform agenda of the government. Since the liberalization of the sugar industry, there has been favourable private sector response; the most significant of which was the establishment of a huge sugar refinery in 2000 with a capacity of 650,000 tonnes of refined sugar annually. It is expected that increased private sector investment in the sugar industry should, in due course, begin to yield desired results especially in terms of increased sugar consumption and reduced import.
Fig. 3.19: Sugar-cane Production in
Nigeria, 1990-2000
0200400600800
1000
1990
1992
1994
1996
1998
2000
Year
'00
0 M
T
IndustrialCane
ChewingCane
Total

135
135
Table 3.47: Sugar Supply in Nigeria, 1990-2000
Year Domestic
Production
(MT)
Import
(MT)
Total
(MT)
Share of
Import (%)
1990 41851 857149 899000 95.34
1991 45295 866705 912000 95.03
1992 32624 917376 950000 96.57
1993 28522 818978 847500 96.63
1994 23003 737797 760800 96.98
1995 16199 684801 701000 97.69
1996 11234 618766 630000 98.22
1997 15805 535768 551573 97.13
1998 9850 763414 773264 98.73
1999 10000 771782 781782 98.72
2000 4000 735890 739890 99.46
Source: Adapted from Busari, 2004 Whereas sugar import is reducing over the past few years, there seems to be considerable expansion in export (Fig. 3.20). Available data from the National Bureau of Statistics between 2002 and 2005 indicate that sugar export increased from about �35.8 million in 2002 to �227.4 million in 2003 and �422.9 million in 2004. Nonetheless, Nigeria is still largely a net importer of sugar. Sugar import which stood at �30.7 billion in 2002 declined to �20.9 billion in 2003. It rose to �24.9 billion in 2004 but by 2005, it has plunged to only �4.7 billion (Fig. 3.21). 3.6.4 Characterization of the Sugar-cane Value Chain
Production Trend With the available record of sugar-cane production between 1999 and 2004 it is possible to disaggregate the relevant data by zones; but unlike the data presented earlier it is impossible to make a distinction between industrial and chewing canes. On zonal basis, the production of sugarcane is concentrated in the NW which accounts for an average of 80.44 percent of the output between 1999 and 2004 (Table 3.48). Nevertheless, production remains virtually at the same level over the period (Fig. 3.22). Production in the NE, which accounts for 8.62 per cent of the total, is highly unstable even though this is where the yield is highest in the country. The yield, which averaged 16.07mt/ha, is about double the yield recorded in the NW. The output trend is as haphazard in the SW as in NE whereas in the South-South zone, output growth is completely stagnant. It is only in the NC that sugarcane production followed an upward trend during the period. There seems to be some expansion in land area under cultivation in both the NW and NC during the period whereas in the SW and NE no significant expansion has occurred (Fig. 3.23).

136
136
Fig. 3.20: Trend in Sugar Export in Nigeria,
2002-2004
0
100
200
300
400
500
2002 2003 2004
Year
mil
lio
n n
air
a
Fig. 3.21: Trend in Sugar Import in Nigeria,
2002-2005
0
5
10
15
20
25
30
35
2002 2003 2004 2005
Year
bil
lio
n n
air
a

137
137
Table 3.48: Sugar-Cane Production in Nigeria, By Zones, 1999-2004
1999 2000 2001 2002 2003 2004
NORTHWEST
-Area(‘000Ha) -Output(‘000MT) -Share of Total (%) -Yield (MT/Ha)
93.73
838.72 85.01 9.01
95.03
835.89 81.48 8.78
95.36
838.75 80.83 8.82
97.01
839.99 80.40 8.65
97.76
843.95 99.87 8.69
102.42 844.22 74.87 8.27
NORTHEAST
-Area(‘000Ha) -Output(‘000MT) -Share of Total (%) -Yield (MT/Ha)
5.58
88.20 8.94
17.60
5.86
92.14 8.98
18.40
5.72
89.76 8.65 17.8
6.09
91.93 8.80
15.16
6.16
87.23 8.25
14.50
7.24
91.55 8.12
13.00
NORTHCENTRAL
-Area(‘000Ha) -Output(‘000MT) -Share of Total (%) -Yield (MT/Ha)
5.59
59.30 6.01
11.70
9.40
91.96 8.96
10.11
10.27
102.27 9.86
10.20
10.62
106.27 10.17 10.00
11.68
120.10 11.37 10.90
18.23
182.77 16.21 10.02
SOUTHWEST
-Area(‘000Ha) -Output(‘000MT) -Share of Total (%) -Yield (MT/Ha)
1.05 5.45 0.53
51.90
1.18 6.37 0.61 5.39
1.13 6.08 0.58 5.38
1.05 5.42 0.51 5.16
1.72 8.99 0.80 5.23
SOUTH-SOUTH -Area(‘000Ha) -Output(‘000MT) -Share of Total (%) -Yield (MT/Ha)
0.10 0.49 0.05 4.90
0.10 0.49 0.05 4.49
0.10 0.49 0.05 4.49
0.10 0.49 0.05 4.49
ALL ZONES
-Area(‘000Ha) -Output(‘000MT)
104.99 986.70
111.40
1025.90
112.60
1037.70
115.00
1044.80
116.70
1056.70
129.61
1127.50
Source: Underlying data from the Project Coordinating Unit of the Federal Ministry of Agriculture and Rural Development, Abuja

138
138
Fig. 3.22: Sugar-cane Production in Nigerian Agro-
Ecological Zones
0
100
200
300
400
500
600
700
800
900
1999 2000 2001 2002 2003 2004
Year
Ou
tpu
t ('
00
0 M
T)
NW
NE
NC
SW
Fig: 3.23: Land Area Cultivated to Sugar-cane
in Nigerian Agro-Ecological Zones
0
20
40
60
80
100
120
1999 2000 2001 2002 2003 2004
Year
'00
0 h
a
NW
NE
NC
SW

139
139
3.6.5 Results of the Sugar-cane Value Chain Analysis
The analysis focuses on key indicators of profitability in the sugar-cane value chain (production, assembly, processing, trade) as well as the indicators of performance of the value chain with a view to determining the international competitiveness of the commodity. It was possible to include only large commercial farmers (LCF) in the analysis. (a) Financial Costs and Profitability Indicators
The structure of financial costs associated with the sugar-cane value chain in Nigeria is presented in Table 3.49. The type and composition of costs vary from one stage to another. At the production stage, seeds, fertilizer and chemicals represent 48 percent of the total cost, followed by machine operation (22 percent), depreciation of fixed capital (18 percent) and hired labour (12 percent). At the assembly stage, the two important cost items are vehicle operation and maintenance (which represents 67 percent of the total cost) and hired labour whose share of total cost is 33 percent. At the processing stage, the operational cost, excluding raw materials, consists largely of hired labour leaving only a marginal share to packing and storage. At the logistics stage, the relevant cost items in order of importance are transport to delivery point (66 percent of total cost), loading and storage (31 percent) and overhead (3 percent).
Table 3.49: Structure of Financial Costs in Sugar-cane Enterprises in Nigeria percent
COST ITEMS FARM
PRODUCT
ASSEMBLY PROCESSING LOGISTICS
Hired Labour 12 33 99
Seed, Fertilizer & Chemicals 48
Spraying & Machine Operation 22
Vehicle Operation & Maintenance 67
Packing & Storage 1
Loading & Storage 31
Overhead & Management 3
Transport to Delivery Point 66
Depreciation 18
Total 100 100
Source: Author’s computations
The results show that with the exception of processing, operating profit and net profit are positive at every stage of the value chain. At the production stage, the gross margin per tonne is US$7.25 while net profit is US$4.86; whereas at the assembly stage, the gross margin per tonne (US$6.06) is the same as net profit in view of the negligible investment cost at this stage. As expected, the rate of return (16 percent) at the assembly stage is much lower than at the production stage which is 92 percent on the basis of gross margin and 47 percent based on net profit. Trading in white sugar attracts net profit per tonne of US$105.49 with 13 percent rate of return while net profit for brown sugar trade is US$29.73 with three percent rate of return (Table 3.50).

140
140
Table 3.50: Profitability Indicators of Sugar-cane Enterprises in Nigeria (Per MT)
Source: Author’s computation
NGN USD NGN USD NGN USD
Gross revenue 2,000 15.15 5,800 43.94 38,000 287.88
Production costs
Crop purchase - 2,000 15.15 5,800 43.94
Other variable costs 1,043 7.90 3,000 22.73 53,003 401.54
Investment costs 316 2.39 - - 23 0.17
Total costs 1,359 10.30 5,000 37.88 58,826 445.65
Final income
Gross margin 957 7.25 800 6.06 (20,803) (157.60)
Net profit 641 4.86 800 6.06 (20,826) (157.77)
Rates of return
Gross margin/total VCGross margin/total VC 0.92 0.16 -0.35
Net profit/total costs 0.47 0.16 -0.35
PROCESSED
RAW MATERIAL
ASSEMBLEDFARM GATE
PRODUCT RAW MATERIAL
TRADED COMMODITIES (1MT Final Product) White Sugar Brown Sugar NGN USD NGN USD
Gross revenue 120,000 909.09 130,000 984.85 Production costs Crop purchase 100,000 757.58 120,000 909.09 Other variable costs 6,075 46.02 6,075 46.02 Investment costs - - - -
Total costs 106,075 803.60 126,075 955 .11 Final income Gross margin 13,925 105.49 3,925 29.73 Net profit 13,925 105.49 3,925 29.73
Rates of return Gross margin/total VC 0.13 0.03 Net profit/total costs 0.13 0.03

141
141
(b) Value Chain Indicators
The transformation of sugar-cane into sugar (white and brown sugar) results in considerable increase in value along the chain. The transformation of sugar-cane into white sugar is associated with an increase in shipment value from US$13.14 at the sugar-cane production stage to US$803.60 at the stage of trading in white sugar. For brown sugar, the shipment value increases from US$13.14 to US$955.11 (see Table 3.51 and Figure 3.26). Sugar-cane production yields a value added (US$10.25) which represents 78 percent of the shipment value. About 87 percent of the DVA is made up of domestic costs and mark-ups. At the level of trading, value added also represents a high proportion (98 percent) of the shipment value of both white and brown sugar. About 99 percent of the DVA is accounted for by domestic costs and mark-ups. In general the major components of shipment value are domestic costs and mark-ups, official duties and tax, additional (unofficial) expenses and foreign costs. In the case of sugar-cane, at each stage of the value chain the shipment value consists largely of domestic costs and mark-ups whose share ranges from 67 percent at the production stage to 89 percent at the assembly stage and 99 percent at the processing stage. Although foreign costs seem to be
Table 3.51: Sugar-cane Value Chain Indicators in Nigeria (Per MT)
Source: Author’s computation
NGN USD NGN USD NGN USD Domestic Value Added
Costs & mark-ups 1,178 8.92 4,618 34.98 58,272 441.45 Official duties & tax 44 0.33 43 0.33 43 0.33 Additional costs 130 0.98 130 0.98 129 0.98
Total DVA 1,352 10.24 4,791 36.30 58,444 442.76 Foreign costs 382 2.89 382 2.89 -
Total Shipment Value 1,734 13.14 5,173 39.19 58,444 442.76
D.
NGN USD NGN USD NGN USD Domestic Value Added
Costs & mark-ups 103,129 781.28 122,200 925.76 - Official duties & tax 292 2.21 390 2.95 - Additional costs 745 5.64 940 7.12 -
Total DVA 104,166 789.14 123,530 935.83 - - Foreign costs 1,909 14.46 2,545 19.28 -
Total Shipment Value 106,075 803.60 126,075 955.11 - -
FARM GATE ASSEMBLED PROCESSED
TRADED COMMODITIES (1 MT Final Traded Product)
PRODUCT RAW MATERIAL RAW MATERIAL
Product 1 Product 2 Product 3

142
142
Fig. 3.24: Composition of Shipment Value for Sugar-cane
negligible at the processing stage, they represent a sizable proportion at the production stage (22 percent) and assembly stage (7 percent) (Table 3.52). For the purpose of determining the international competitiveness of sugar, the final shipment values are compared with the relevant import parity price. The final SVs for white sugar (US$803.60) and brown sugar (US$955.11) are both higher than the import parity price (US$409.7) implying that Nigerian sugar is unlikely to be competitive at the international market.
Table 3.52: Composition of Sugar-cane Shipment Values in Nigeria (%)
FARM PRODUCT
ASSEMBLY PROCESSING LOGISTICS
Domestic costs & mark-ups 67 89 99 97
Official duties and tax 3 1 - -
Additional expenses 8 3 - 1
Foreign costs 22 7 1 2
Total 100 100 100 100
( c) Build-up of Sugar-cane Final SV By Stage (%)
Analysis of the final shipment value is carried out on the basis of the incremental cost incurred (per 1 MT of raw material) at each stage of the sugar-cane value chain. At the production stage, the share of the final shipment value is 25 percent while the processing stage also has a similar share. The final delivery stage has the largest share which is 50 percent of the final shipment value.
Composition of SV
(USD per MT Traded Commodity)
-
200
400
600
800
1,000
1,200
White Sugar Brown Sugar
Costs & Mark-ups
Duties & Tax
Unofficial Extras
Foreign costs

143
143
3.6.6 Impediments to Growth in the Sugar-cane Industry
Several problems militate against the performance and growth in the sugar industry. In general the problems cut across the production, processing and marketing stages of the value chain. The main constraints are as follows. � Reliance on estate-based industrial cane production system which is bedeviled with myriads
of operational deficiencies and has thus hindered regular supply of raw materials to the sugar factories over the years.
� Low output price for sugar-cane. Only few farmers have joined the estate-based out-grower schemes due largely to unattractive prices offered to farmers. Up till the 1992 season, farmers were paid about N130 per tonne of cane delivered to the Nigerian Sugar-cane Company Ltd. The price increased thereafter to N300 and N1,500 over the years but stood at only N1,700 in the 2000 season. According to Busari (2004), local farmers obtain higher returns for putting their resources into the cultivation of other crops like rice and chewing cane which share similar ecology with industrial cane.
� Restricted market for sugar-cane which has tended to discourage increased production by small-scale farmers. The mills available are too few compared to the number of farmers. Moreover, available mills are located close to few farmers and far away from several others; thus constituting great disincentive for both producers and millers. Whereas farmers growing chewing cane can sell their products various markets, producers of industrial cane can only sell to the limited number of mills which in some instances can be reached at very high cost of transportation.
� Low yield. Sugar-cane yield in the country has been very low. This has adverse consequences for profitability and competitiveness of the commodity.
� Reliance on imported cultivars for the estate-based production systems. � Low level of capacity utilization in existing sugar mills � Inadequate and irregular supply of sugar-cane to the mills
3.7 Comparative Analysis of Value Chain By Type of Crops
The previous sections show different levels of production performance as well as profitability and value chain indicators for the three farm sectors considered in the analysis. Moreover, many of the crops are not competitive at the international market. The comparative analysis in this section is focused on the crops in order to ascertain their relative positions in terms of production, profitability and value chain performance across the sectors. This will permit a more targeted approach towards enhancing the competitiveness of each commodity. Thus, the key indicators for the comparative analysis are yield of the selected crops, unit cost of production, gross margin, net profit and shipment value.
3.7.1 Production Performance
The relative production performance of the farmers is assessed using two indicators; yield and unit production cost. The relative positions of the crops in terms of yield are illustrated in Fig. 3.25. No attempt is made to compare the yield of cassava which is a root crop with the other crops. Its inclusion in the figure is to demonstrate the huge gap between cassava yield in the FAM sector and in each of the two other sectors. The FAM sector therefore, should not be seen as necessarily backward and non-responsive to the various efforts of the government aimed at disseminating improved crop varieties and modern farming techniques in the country. Within the FAM sector, the yield of maize is the highest while that of rice is the lowest. In the case of ECF,

144
144
0
2
4
6
8
10
MT/Ha
FAM ECF LCF
SECTOR
Fig. 3.25: Yield of Selected Crops in Nigeria, 2005
Cassava
Cotton
Maize
Rice
Soybean
the yield of rice is the highest while that of soybean is the lowest. And in the LCF sector, the yield of rice is also the highest while that of soybean is the lowest. With regard to unit cost of production in the FAM sector, it is highest in the case of cotton, followed by soybean, maize and rice while the lowest is in respect of cassava. Of the four crops produced in the ECF sector, the unit cost of production for maize is the highest, followed by that of cassava and soybean while the lowest is for rice. And in the case of LCF, unit production cost is highest also in the case of maize, followed by rice and cassava while the lowest is in respect of sugar-cane (Figure 3.28). For maize, rice, and soybean it is true that unit cost of production increases with rising degree of commercial orientation. 3.7.2 Profitability Indicators
Judging by the level of operating profit (gross margins), the results show that rice is the most profitable crop across the sectors. It is followed by soybean, maize, cassava, cotton and sugar-cane. However, in specific sectors, the order of profitability changes somewhat. In the FAM sector, the most profitable crop is rice followed by soybean, maize and cassava while the least profitable is cotton. In the case of ECF, the order is: rice, soybean, cassava and maize, whereas in the LCF sector rice maintains the lead and it is followed by cassava, maize and sugar-cane (Figure 3.29). Thus, if operating profit is to be used as a criterion to select key crops that should be supported for export purposes and enhancement of international competitiveness with

145
145
Fig. 3.26: Comparison of Unit Cost of Production By
Crops in Nigeria
0
100
200
300
400
500
600
FAM ECF LCF
SECTOR
US
D/M
T
Cassava
Cotton
Maize
Rice
Soybean
Sugar-cane

146
146
Fig. 3.27: Gross Margins in Selected Farm Sectors in Nigeria,
By Crops
-50
0
50
100
150
200
250
300
350
400
450
FAM ECF LCF
SECTOR
US
D/M
T
cassava
cotton
maize
rice
soybean
sugar

147
147
continued reliance on smallholders who are responsible for the production of over 80 percent of the agricultural commodities in Nigeria, the order of increasing importance of the crops included in this study will be rice, soybean, maize, cassava and cotton. Even on the basis of net return, which is another indicator of profitability, the commodities will still be selected in that order. As shown in Figure 3.30, net returns for these crops in the FAM sector are all positive with the highest returns accruing from rice, followed by soybean, maize, cassava and cotton.
Fig. 3.28: Net Profit in Selected Farm Sectors in Nigeria, By Crops
-200
-100
0
100
200
300
400
500
FAM ECF LCF
SECTOR
US
D/M
T
cassava
cotton
maize
rice
soybean
sugar
148
148
3.7.3 Comparison of Value Chain Indicators By Crops
For the purpose of comparison, the crops can be classified into two broad categories the grains (rice, soybean and maize) and other crops (cassava, cotton sugar-cane), the processing of which involves substantial transformation into various products. Although the profitability of the crops at the production stage is crucial for the purpose of improved commercialization and competitiveness, it is important to stress that profitability is a necessary but not sufficient condition for international competitiveness. A sound judgement about the ranking of the commodities for export promotion and enhancement of competitiveness depends on the magnitude of the final shipment values and the divergence of such values from the export or import parity prices. With regard to the grains, rice has the highest shipment values irrespective of the degree of commercialization of production (see Figure 3.31). And among the sectors the shipment value is the highest in the case of the large commercial farms (LCF). The final shipment values for soybean and maize are quite close but in each sector the SV for rice is followed by that of soybean while that of maize is the lowest. For the other crops, the traded commodities vary among the sectors with only cassava products appearing in each of the sectors. Of the three cassava products, pellets have the highest shipment value followed by starch and chips in each of the sectors. Cotton appears only in the FAM sector where the shipment value of cotton lint is higher than that of cotton seed and indeed higher than any of the traded commodities in the FAM sector. Sugar appears only in the LCF sector where the shipment value of brown sugar is higher than that of white sugar and indeed higher than that of any other commodity across the sectors (Figure 3.32). For these commodities to be competitive, the shipment values should be much lower than the levels revealed in this study. Information about the divergence between the SV and the parity price is crucial in this regard as it will be required to determine the position of each commodity in terms of the support necessary for the attainment of international competitiveness. Table 3.53 presents the deviations of the SVs of the crops from parity prices across the sectors. For cassava, cotton and sugar-cane, computation of the deviations is based on the traded products with the highest shipment values as identified earlier. In a sense, the commodity with the minimum absolute deviation from the parity price can be regarded to have the best performance in terms of degree of competitiveness. On this basis, the ranking of the crops in order of competitiveness is presented in Table 3.54. The results show that efforts aimed at promoting international competitiveness of the selected crops will still need to be greatly intensified in general but most especially in respect of cassava. Such efforts cannot be limited to campaigns to expand production but should be extended to the development of appropriate and inexpensive local technologies that will reduce costs in each stage of the value chain. There will also be the need to seek international collaborative efforts to tackle the artificial barriers which create imperfections in the global agricultural market especially those barriers that distort agricultural product prices to the disadvantage of potential exporters from Nigeria.

149
149
Fig. 3.29: Final Shipment Values for Traded Grain Commodities in
Nigeria
0
100
200
300
400
500
600
700
800
FAM ECF LCF
SECTOR
US
D/M
T
MAIZE
RICE
SOYBEAN

150
150
Fig. 3.30: Final Shipment Values for SelectedTraded Products in
Nigeria
0
200
400
600
800
1000
1200
FAM ECF LCF
SECTOR
US
D/M
T
Chips
Pellets
Starch
Cotton Lint
Cotton Seed
White Sugar
Brown Sugar

151
151
Table 3.53: Deviations of SVs From Parity Prices of Selected Commodities in Nigeria CASSAVA COTTON MAIZE RICE SOYBEAN SUGAR
FAM -Domestic Price ($/MT) -SV ($/MT) -Parity Price*($/MT) -Deviation (%)
189 543 -3 -13,667
265 816 1,196 -32
371 415 131 +216
454.55 674.34 330.00 +104.35
363.64 422.41 259.56 +62.74
ECF - Domestic Price ($/MT) -SV ($/MT) -Parity Price ($/MT) -Deviation (%)
106.06 546.97 -3.00 -18,332.33
239 418 131 +219
545.45 677.76 330.00 +105.38
409.09 426.52 259.56 +64.32
LCF - Domestic Price ($/MT) -SV ($/MT) -Parity Price ($/MT) -Deviation (%)
151.52 544.39 -3.00 -18,246.33
371 423 131 +222
545 678 330 +105
341 435 259 +67
15 955 409 +133
*For cassava and cotton, parity price is on export basis while for all other commodities it is on the basis of import substitution.
Table 3.54: Ranking of Selected Commodities in Order of Degree of Competitiveness
FARM SECTORS Selected Crop
FAM ECF LCF
Cotton 1
Soybean 2 1 1
Rice 3 2 2
Maize 4 3 4
Cassava 5 4 5
Sugar 3
Source: Author’s computation

152
152
3.8 Sensitivity Analysis
This study reveals some variables that can affect the competitiveness of the selected commodities as well as the value chain and profitability indicators. The most critical of them are low level of yield and high cost of transportation. These are common problems to all the selected crops. A sensitivity analysis is carried out to examine the extent of their effects on the value chain and to determine the extent to which the inclusion of these variables in policy measures aimed at improving the degree of competitiveness of the commodities can be justified. It is expected that an increase in yield levels and a reduction in transportation costs will have desirable impact on profitability and the value chain indicators. The levels of profit and net profit are expected to increase while achieving a reduction in shipment values. Yield can be increased through improved farm management practices, the use of adequate quantity and quality of modern inputs and the planting of highly improved varieties of crops. These methods of yield improvement can be influenced by policy actions to ensure that they do not necessarily lead to an escalation of production cost. In Nigeria today, the most critical problem is inadequate supply of improved varieties of crops. Thus, even at the current level of farm management and use of complementary inputs, the yield of several crops can improve considerably if the farmers have access to improved varieties. The increase in yield achieved by rice farmers who have been planting NERICA rice in recent times tends to corroborate this assertion. With regard to transportation cost, the effects at each stage of the value chain can be deleterious. In Nigeria, the high production cost in the agricultural sector and indeed in many other sectors of the economy is policy induced. Government policies and some administrative procedures directly or indirectly lead to an increase in cost at every stage of the value chain. Indeed, over the last two decades increases in production and marketing costs in the country have been closely related to increases in transportation costs occasioned by incessant increases in the price of petroleum products. The attainment of a high degree of competitiveness of agricultural commodities which are produced in remote parts of the country and transported over long distances to final destinations for domestic consumption, industrial use and export may be difficult unless there are changes in the mode of transportation and in the frequency and magnitude of increases in the price of fuel in the country. The sensitivity analysis captures the effects of an increase in crop yield (by 50 percent) as well as a reduction in transport cost (by 50 percent). The analysis shows that neither scenario is in itself capable of yielding any appreciable result. However, simultaneous application of the variables in the analytical templates tends to have considerable effects on the profitability indicators and shipment values. The results of the sensitivity analysis are presented in Tables 3.55 and 3.56. As regards profitability indicators, the results show that (i) changes in the applied variables have no effect on operating profit of processors (except rice ECF), (ii) the changes have no effect on operating profit of assemblers in respect of maize and soybean, (iii) the changes have no effect on operating profit of farmers in the FAM sector whereas considerable improvement in profitability is observed in the ECF and LCF sectors in respect of all crops at the production stage, and (iv) the changes result in profitability improvement at the trading logistics stage which is most pronounced in the case of maize compared to other crops. As shown in Table 3.55, similar effects are observed in respect of net profit. However, unlike in the case of operating profit, changes in crop yield and transportation cost result in some improvement in net profit for all the selected crops within the FAM sector.

153
153
Table 3.55: Changes in Profitability Indicators With 50% Increase in Yield and 50% Reduction in Transport Cost
percent Change in Operating Profit
(with 50% increase in yield and 50% reduction in
transport cost)
Change in Net Profit (with 50% increase in yield and 50% reduction in
transport cost)
Logistics Logistics
Farm Product
Assem-bly
Pro-cessing Prod 1 Prod 2 Prod 3
Farm Assem-bly
Pro-cessing Prod 1 Prod 2 Prod 3
Cassava -FAM -ECF -LCF
0 150 6
20 20 692
0 0 0
12 11 11
11 10 10
11 11 11
0 -1 13.
20 21 693
0 0 0
12 11 11
11 10 10
11 11 11
Cotton -FAM
0
186
0
7
18
20
186
0
8
18
Maize -FAM -ECF -LCF
0 131 77
0 0 0
269 445 151
3 -115 -146
0 0 0
269 445 151
Rice -FAM -ECF -LCF
0 11 15
4 0 5
0 3 0
17 18 18
1 12 77
4 0 5
0 -3 0
18 18 18
Soybean -FAM -ECF -LCF
0 40 729
0 0 0
4 6 23
1 41 -37
0 0 0
4 6 23
Sugar -LCF
36.41
125.08
0
14
50
70
125
0
14
51
Note: For cassava, Prod 1 = chips; Prod 2 = pellets; Prod 3 = starch For cotton, Prod 1 = cotton lint; Prod 2 = cotton seed For sugar-cane, Prod 1 = white sugar; Prod 2 = brown sugar

154
154
Table 3.56: Changes in Shipment Value With 50% Increase in Yield and
50% Reduction in Transport Cost
Trading Logistics Farm Product
Assembly Processing
Prod 1 Prod 2 Prod 3
Cassava -FAM -ECF -LCF
-34 -33 -33
-3 -5 -3
0 0 0
-9 -9 -9
-9 -9 -9
-9 -9 -9
Cotton -FAM
-33
0
0
-4
-16
Maize -FAM -ECF -LCF
-69 0 -18
0 0 0
-1 -1 -2
Rice -FAM -ECF -LCF
-34 -32 -33
-0 0 -0
0 0 0
-2 -2 -2
Soybean -FAM -ECF -LCF
-4 0 -33
0 0 -57
-1 -1 -2
Sugar-cane -LCF
0
-19
0
-1
-1
Note: For cassava, Prod 1 = chips; Prod 2 = pellets; Prod 3 = starch For cotton, Prod 1 = cotton lint; Prod 2 = cotton seed For sugar-cane, Prod 1 = white sugar; Prod 2 = brown sugar
155
155
The ultimate effect of an increase in yield and decrease in transaction cost should be a reduction in shipment values in order to achieve an improvement in the degree of competitiveness of the commodities. As expected, the changes yielded the desired effects in the value chain but there seems to be variation from one stage to another. The results show that (i) the changes have no effect on the SVs at the processing stage, (ii) the changes have no effects on SVs at the assembly stage in respect of maize and cotton, (iii) the changes have no effect on the SVs of sugar-cane producers, (iv) the effects on SVs at the production stage are more pronounced in respect of cassava, cotton and rice compared to other crops and (v) at the trading logistics stage, the effects on SVs are more pronounced in the case of cotton, cassava and rice but marginal in the case of other crops (see Table 3.56). In sum, the reductions achieved in the SVs of the various crops is far from being sufficient to make them competitive at the international market. As noted earlier, the yield of each of the crops at the FAM level is rather low. The yield of the crops especially in the FAM sector will have to increase by much greater proportion (than 50 percent) in order to have a meaningful impact on international competitiveness. It is also important to stress, that the actions aimed at improving the degree of commercialization and competitiveness cannot be singular at any point in time. A combination of variables will be required locally by both policy makers and private investors. Actions are required within and outside the agricultural sector especially in the areas of governance, infrastructure development as well as within and outside the country in terms of redressing the global imperfections in agricultural trade. There should be vigorous negotiations within and outside the purview of WTO to ensure that the international reference prices of the selected commodities fully reflect the forces of demand and supply. More importantly, however, is the need for the government to provide well-articulated export incentives to support the drive to enhance the competitiveness of Nigerian agricultural commodities in the international market.

156
156
CHAPTER 4
SUMMARY, CONCLUSIONS AND POLICY RECOMMENDATIONS
This study has analyzed the competitiveness of selected agricultural commodities in Nigeria using the value chain approach. As a prelude to the analysis we undertake a review of the broader development situation in the country in general and in the agricultural sector in particular. A review of literature on the competitiveness of the selected commodities (cassava, cattle, cotton, maize, rice, soybean and sugar) in the targeted agro-climatic zone is also undertaken and this serves as a major source of data for the value chain analysis. Additional data had to be obtained from primary sources to augment gaps in the secondary data. This chapter presents a summary of the main findings, the constraints to profitability and competitiveness of the selected commodities, the opportunities for improved performance and recommendations of relevant policies and strategies. 4.1 Main Findings and Conclusions on Profitability and Export Competitiveness
The analysis of competitiveness of the selected commodities shows that with the exception of cotton, none of the other commodities (cassava, maize, rice, soybean and sugar-cane) is competitive at the international market. Moreover, it is found that the commodities remain uncompetitive irrespective of the level of commercialization at the production level. In other words, the commodities are not competitive in the international market notwithstanding whether or not the producer operates as a small family farm (FAM), emerging commercial farm (ECF) or large commercial farm (LCF). However, in the different farm sectors (FAM, ECF and LCF) the production of the crops appears to be profitable although as expected, the degree of profitability varies by crops and from one sector to another as indicated in the summary of the profitability analysis presented in Table 4.1. The results of the analysis show that across the sectors, rice is the most profitable crop. It is followed by soybean, maize, cassava and cotton. For maize, rice, and soybean the unit cost of production increases with rising degree of commercial orientation.
These findings imply that measures aimed at reducing cost at the farm product level in order to improve the competitiveness of the commodity should be targeted at domestic costs and mark-ups in general but in the case of ECF and LCF there is need also to address the foreign costs especially for soybean and maize production which involves the importation of different types of machines and chemical inputs. The results also imply that the intensity of efforts will not only vary across the farms but also in terms of the specific components of shipment value. For instance, in the case of soybean, improving the profitability and competitiveness will require different policy measures across the farm sectors. Whereas the LCF will benefit more from trade and other related policies, the soybean FAM and ECF may derive greater benefits from sector-specific and other domestic interventions. In general, the net return is apt to improve if there is a reduction in the cost of capital and increased access to markets that offer more remunerative prices for the farm products. It is important to stress that the findings of this study have not contradicted popular claims concerning competitiveness in Nigeria. In the case of cassava in particular, it has been argued that Nigeria is in a position of great disadvantage compared to other competitors. Daramola (2004), noted that the market price of cassava from Thailand was about a third of the production cost in Nigeria; and that even though Nigeria has been producing about 70 percent of
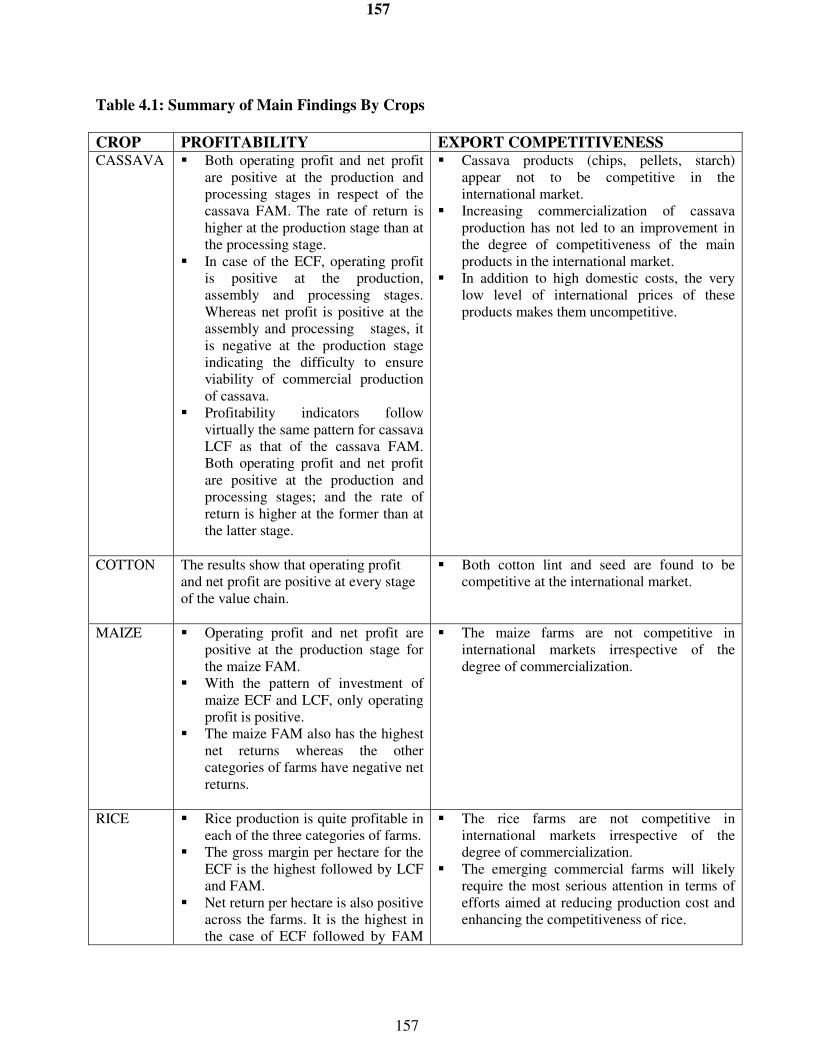
157
157
Table 4.1: Summary of Main Findings By Crops
CROP PROFITABILITY EXPORT COMPETITIVENESS CASSAVA � Both operating profit and net profit
are positive at the production and processing stages in respect of the cassava FAM. The rate of return is higher at the production stage than at the processing stage.
� In case of the ECF, operating profit is positive at the production, assembly and processing stages. Whereas net profit is positive at the assembly and processing stages, it is negative at the production stage indicating the difficulty to ensure viability of commercial production of cassava.
� Profitability indicators follow virtually the same pattern for cassava LCF as that of the cassava FAM. Both operating profit and net profit are positive at the production and processing stages; and the rate of return is higher at the former than at the latter stage.
� Cassava products (chips, pellets, starch) appear not to be competitive in the international market.
� Increasing commercialization of cassava production has not led to an improvement in the degree of competitiveness of the main products in the international market.
� In addition to high domestic costs, the very low level of international prices of these products makes them uncompetitive.
COTTON The results show that operating profit and net profit are positive at every stage of the value chain.
� Both cotton lint and seed are found to be competitive at the international market.
MAIZE � Operating profit and net profit are positive at the production stage for the maize FAM.
� With the pattern of investment of maize ECF and LCF, only operating profit is positive.
� The maize FAM also has the highest net returns whereas the other categories of farms have negative net returns.
� The maize farms are not competitive in international markets irrespective of the degree of commercialization.
RICE � Rice production is quite profitable in each of the three categories of farms.
� The gross margin per hectare for the ECF is the highest followed by LCF and FAM.
� Net return per hectare is also positive across the farms. It is the highest in the case of ECF followed by FAM
� The rice farms are not competitive in international markets irrespective of the degree of commercialization.
� The emerging commercial farms will likely require the most serious attention in terms of efforts aimed at reducing production cost and enhancing the competitiveness of rice.

158
158
and LCF.
SOYBEAN � Soybean appears to be profitable at the FAM and ECF sectors (but more so in the latter than the former) whereas in the case of the LCF the returns seem to be negative.
� The unit cost of production is lowest in the FAM sector; the level of variable cost is also the lowest compared with ECF and LCF. However, this has not translated to the highest level of performance in terms of gross margin and net return per hectare due to the fact that the farm gate price in the FAM sector is the lowest.
� Soybean is not competitive at the international market.
� Notably, domestic costs and mark-ups contribute more to the rising shipment values in the soybean chain than foreign costs as far as the FAM and ECF sectors are concerned whereas in the case of LCF the foreign costs contribute more than domestic costs.
� Foreign costs represents 81 percent of the shipment value at the LCF soybean production stage indicating the high degree of foreign dependence by large commercial farms in terms of imported inputs.
SUGAR-CANE
� With the exception of processing, both operating profit and net profit are positive at all stages of the value chain.
� Sugar appears not to be competitive at the international market.
the world cassava, domestic demand and high cost of production have made Nigerian cassava uncompetitive in the world market. Besides, the latest report on trade competitiveness of a sample of 30 African countries placed Nigeria among the five least competitive countries together with Democratic Republic of Congo, Mali, Burkina Faso and Sierra Leone. Nigeria is in this group on account of its poor institutional quality and high inflation as well as low governance and infrastructure scores (see ECA, 2004). Although, efforts to create a more favourable trade environment have been intensified over the years there seems not to have been any significant reduction in production and marketing costs in the country in general and in the agricultural sector in particular. It is therefore, not surprising that many of the crops included in this study continue to be uncompetitive in the international market.

159
159
4.2 Constraints
Several internal and external constraints account for the non-competitiveness of some of the selected crops. The major external constraints are (i) agricultural subsidies in developed countries, (ii) unfavourable international agricultural prices, (iii) imposition of high tariffs by developed countries, (iv) export dumping and (v) market concentration. It may be difficult for Nigeria alone to tackle the external constraints but joint actions can be taken at the level of African Union and within the framework of NEPAD to engage the relevant countries in the developed world. Nigerian can also mobilize other African countries that are most affected by these external constraints in engaging the WTO with a view to negotiating appropriate solutions to these problems. It is also possible to involve relevant organizations within the United Nations system especially the United Nations Conference on Trade and Development (UNCTAD) in tackling the knotty issues. With regard to the internal constraints, they are multi-dimensional. They are very critical at the production, processing and marketing stages of the value chain (see Table 4.2). 4.3 Opportunities for Improved Agricultural Commercialization and Competitiveness
Agriculture is being accorded high priority by the government in the development of the Nigerian economy. In spite of the existing constraints, there seems to be bright prospects that the government is interested in continuing to uphold this priority and in finding lasting solutions to the problems of the sector. While the smallholders are giving due recognition in the development of the sector, government has also demonstrated the willingness to make the sector attractive to the organized private sector and to encourage vertical integration between the large-scale and small-scale farmers so that the sector can fulfill its role of generating employment, creating wealth and reducing poverty in the country. This section examines the emerging opportunities for enhancing the competitiveness of the target commodities not only to demonstrate the rationale for reversing the unimpressive trend in due course, but also to identify the scope and specific areas of possible interventions by key players in the sector.
Conducive Policy Environment The economic policy environment in Nigerian is becoming increasingly conducive and investment-friendly. Indeed, it is the avowed policy of government over the past eight years to make the economy market-oriented and private-sector-led. This has been a veritable source of encouragement for increased private sector participation in the economy. For instance, some private companies have invested in integrated paddy production and rice processing activities with from which a number of out-growers are now reaping considerable returns. Indeed, the last four years have witnessed some improvement in business conditions, operations at the ports, customs procedures and the regulatory environment in general.

160
160
Table 4.2: Value Chain Constraints of Agricultural Commodities in Nigeria Crops Production Constraints Processing Constraints Marketing Constraints
Cassava � The lack of mechanization in the production process of cassava in the country is a very important problem.
� The cost of hiring labour and the tedium encountered in manual cultivation particularly during land preparation with local implements seem to discourage investment in cassava production.
� Equipment are generally not easily available locally, and when available, they are usually expensive and inefficient and their parts wear down very fast
� Public power supply is very unreliable forcing the processors to depend on the expensive alternative of using power generators in the face of ever escalating cost of fuel for the generators
� Lack of credit for processing enterprises
� Unattractive prices of products remain a serious problem
� High transportation cost arising from high and rising fuel prices
� Inadequate credit facilities for commodity marketing
� Poor storage facilities � Lack of standard measures in some markets � Poor roads and unreliable transport system prevent
timely delivery of products in profitable markets � Unofficial payments to security agents and other
government functionaries for goods in transit
Cotton � Climatic fluctuations. Since agriculture in Nigeria is mostly rain-fed, timely arrival of rain is critical. Farmers often decide against the cultivation of cotton due to late arrival of rain. The arrival of rain is as important as its cessation in maximizing yield. If rain continues beyond a particular time, it may lead to drastic reduction in output.
� Farmers tend to reduce the area cultivated in reaction to poor prices and unfavourable market dynamics
� Inadequate and untimely supply of modern inputs
� Unavailability of funds at critical times also affects production.
� Equipment are generally not easily available locally, and when available, they are usually expensive and inefficient and their parts wear down very fast
� Public power supply is very unreliable forcing the processors to depend on the expensive alternative of using power generators in the face of ever escalating cost of fuel for the generators
� Lack of credit facilities for processing enterprises
� Absence of institutional arrangement for commodity grading and quality control
� Unattractive prices of products remain a serious problem
� High transportation cost arising from high and rising fuel prices and poor state of access roads
� Due to poor access to market information, buyers often exploit the farmers by offering low prices
� Inadequate credit facilities for commodity marketing
� Lack of control over product adulteration
Maize � Inadequate and untimely supply of modern inputs
� Unavailability of funds at critical times also affects production.
� Equipment are generally not easily available locally, and when available, they are usually expensive and inefficient and their parts wear down very fast
� Public power supply is very unreliable forcing the processors to depend on the expensive alternative of using power generators in the face of ever escalating
� Unattractive prices of products � High transportation cost arising from high and
rising fuel prices � The lack of pre-planting contracts expose farmers
to unfavourable market dynamics. For instance, in August 2005 maize was sold at N80,000 ($606.06) per tonne but in August 2006 the price dropped to N28,000 ($212.12) per tonne due to the outbreak
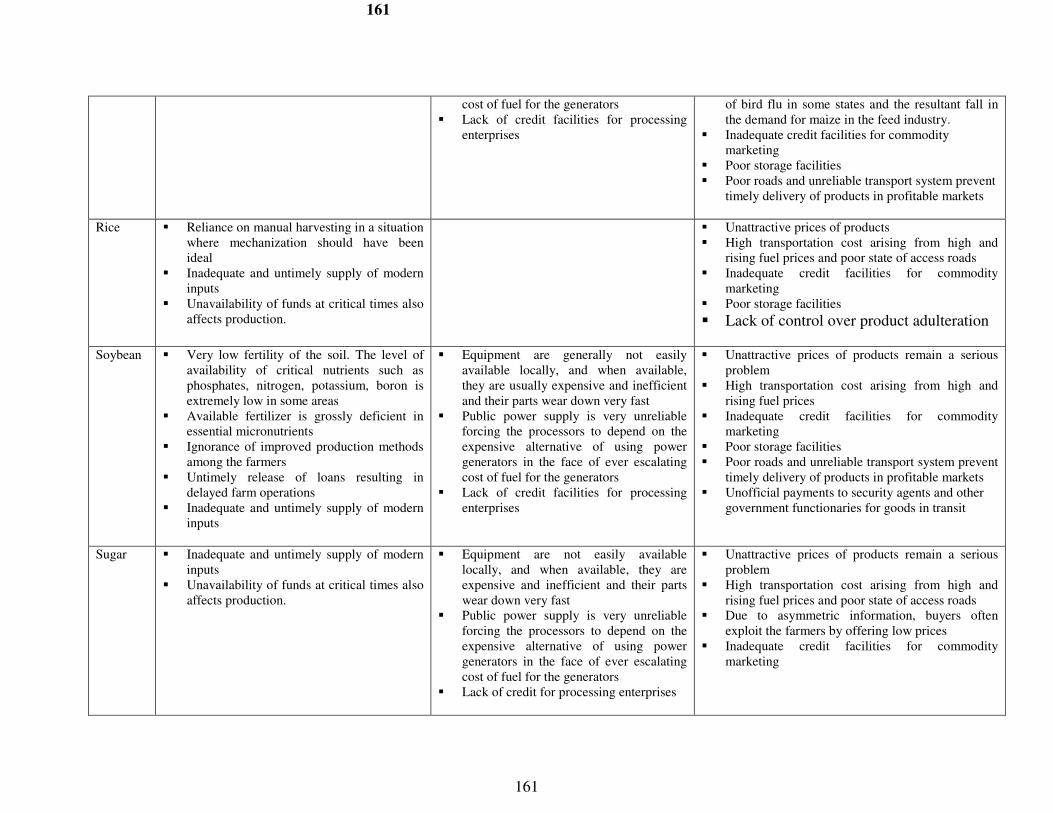
161
161
cost of fuel for the generators � Lack of credit facilities for processing
enterprises
of bird flu in some states and the resultant fall in the demand for maize in the feed industry.
� Inadequate credit facilities for commodity marketing
� Poor storage facilities � Poor roads and unreliable transport system prevent
timely delivery of products in profitable markets
Rice � Reliance on manual harvesting in a situation where mechanization should have been ideal
� Inadequate and untimely supply of modern inputs
� Unavailability of funds at critical times also affects production.
� Unattractive prices of products � High transportation cost arising from high and
rising fuel prices and poor state of access roads � Inadequate credit facilities for commodity
marketing � Poor storage facilities
� Lack of control over product adulteration
Soybean � Very low fertility of the soil. The level of availability of critical nutrients such as phosphates, nitrogen, potassium, boron is extremely low in some areas
� Available fertilizer is grossly deficient in essential micronutrients
� Ignorance of improved production methods among the farmers
� Untimely release of loans resulting in delayed farm operations
� Inadequate and untimely supply of modern inputs
� Equipment are generally not easily available locally, and when available, they are usually expensive and inefficient and their parts wear down very fast
� Public power supply is very unreliable forcing the processors to depend on the expensive alternative of using power generators in the face of ever escalating cost of fuel for the generators
� Lack of credit facilities for processing enterprises
� Unattractive prices of products remain a serious problem
� High transportation cost arising from high and rising fuel prices
� Inadequate credit facilities for commodity marketing
� Poor storage facilities � Poor roads and unreliable transport system prevent
timely delivery of products in profitable markets � Unofficial payments to security agents and other
government functionaries for goods in transit
Sugar � Inadequate and untimely supply of modern inputs
� Unavailability of funds at critical times also affects production.
� Equipment are not easily available locally, and when available, they are expensive and inefficient and their parts wear down very fast
� Public power supply is very unreliable forcing the processors to depend on the expensive alternative of using power generators in the face of ever escalating cost of fuel for the generators
� Lack of credit for processing enterprises
� Unattractive prices of products remain a serious problem
� High transportation cost arising from high and rising fuel prices and poor state of access roads
� Due to asymmetric information, buyers often exploit the farmers by offering low prices
� Inadequate credit facilities for commodity marketing
162
162
Inclusion of the Selected Crops in the Presidential Initiatives on Agriculture in Nigeria The Federal government originated the Presidential Initiatives on Agriculture (PIA) in 2002 to promote growth in the agricultural sector, reduce poverty and enhance food security. All the target crops in this study except sugar-cane are included in the programme. The objectives, achievements so far and the constraints in respect of cassava, cotton, maize, rice and soybean are presented in Table 4.3. There is no doubt that the PIA programme has provided considerable opportunity for the expansion of output in respect of each crop. It has also been reported in a recent briefing by the Ministry of Commerce and Industry that in the case of cassava a substantial amount of money ($2.1 million) has been realized from export of cassava products. Although the specified targets have not been fully met due largely to inadequate funding, the achievements are remarkable. It is expected that if the programme is continued with renewed vigour, adequate attention to timeliness in operational matters and release of budgeted funds, it should be possible to sustain the current gains and make significant improvement in the performance of agriculture in the country. High Growth in Other Developing Countries Especially China and India This has tended to stimulate increased demand for exports from Nigeria and many other African countries. In Uganda Chinese traders are buying up specialty woods, leather hides and fish innards – a delicacy that is much relished in Asia. Chinese officials are also negotiating for the purchase of a million tonnes of soybeans a year and large quantities of cassava (Zachary, 2006). Similar arrangements are going on in other countries including Nigeria. Indeed, Chinese demand for commodities in recent years appears to be unprecedented. According to UNCTAD (2005) China accounts for over 15 percent of global imports of copper, iron ore, natural rubber and soybeans. While developed country demand has largely remained stable, China has been generating much of the marginal commodity demand that has been driving up prices.
Global Economic Growth and Agricultural Trade The world economy is growing at an unprecedented pace reflecting the cessation of the Cold War and expansion of new global technologies. In what appears to be a reversal of historical trends, economic growth today is fastest in developing countries where 74% of the world’s 6.1 billion people live. Arguably, the developing countries are growing fast enough that they are now causing a restructuring of the world economy especially world commodity markets – a trend that may continue and even accelerate in the foreseeable future. Economic growth and agricultural trade have been projected to remain much more rapid in developing countries such as China, India, the Middle East and parts of Africa than in Europe, the United States and Japan. These trends are being stimulated by shifts in economic policies that are successfully attracting international investment and supporting rapid development largely focused on export growth and investment in training and education of the work force. These are opportunities that sharply stimulate food demand. Policy Shifts in Many Developing Countries
Economic policy reforms in developing counties have led to the collapse of the former self-sufficiency policies and have resulted in aggressive pursuit of competition and reliance on world markets. This pattern has boosted world trade in recent times. In view of the enormous size of many of these countries (especially China, India, Vietnam, etc) and their rapid growth, considerable pressure is being brought to bear on the structure and conduct of world commodity

163
163
Table 4.3: Achievements and Challenges of the Presidential Initiatives on Agriculture CROP OBJECTIVES/TARGETS ACHIEVEMENTS CONSTRAINTS CASSAVA -Increased cassava production
and export with the target earning of US$5.0 billion from cassava export in 7 years. The production target is 150 million metric tonnes of cassava per annum by the end of 2010.
-Increase in annual production of cassava from 33 million MT in 1999 to 49 million MT in 2006. -43 newly improved cassava varieties have been tried out of which 5 were selected and officially released. -Increase in the fabrication of small-scale processing equipment -Increase in private sector investment in cassava downstream activities -Establishment of 5 primary processing centers nationwide -Inclusion of 10 percent high quality cassava flour production in composite flour production for bread making and other confectioneries. Over 5,000 MT of cassava flour have so far been supplied to five composite flour mills for this purpose as at December 2006. -60 ha planted by NRCRI to produce 24,00 bundles of breeder stock; 80 ha planted by RTEP to produce 32,000 bundles of foundation stock, and 148 ha planted by ADPs to produce 59,200 bundles of certified stock -Over 2,500 MT of cassava chips exported to China -500 extension agents from SW, SE and NE zones trained
-Inadequate supply of planting materials -Inadequate funding -Lack of entrepreneurial skill
COTTON -Develop a viable and sustainable cotton sector covering the cotton/textile/garment chain through a market-oriented strategy -Development of 1.25 million ha to produce 1.0 million tones of seed cotton to boost vegetable oil production
-Launching of a National Cotton Rebirth programme in June 2006 -Increase in total output of seed cotton from 150,000 MT in 1999 to 350,000 MT in 2006 -Implementation of sustainable cotton seed multiplication scheme for medium and long staple cotton with about 1,800 ha cultivated to different varieties of cotton -Procurement and distribution of agro-chemicals including 3,100 litres of lambdacy halothrin, 3,190 litres of cypermetrin 10EC and 1,360 litres of pohytrin ka 315 EC/uhv for the cotton multiplication scheme. -The N50 billion Textile Rehabilitation Fund to support cotton/textile/garment industries is currently being facilitated by the Presidential Committee on Revival of the Textile Industry.
-Inadequate funding
MAIZE -the main objective is to double the production of maize from the current 7 million MT to 14 million MT within two years (2006-2007) in order to meet its
-5000 MT of improved maize seeds and 60,000 litres of agro-chemicals have been produced for distribution to farmers in participating states.
-Inability of farmers to organize themselves to take advantage of available

164
164
demand for human consumption and industrial uses.
opportunities -Lack of credit facilities for participating farmers
RICE -Increased rice production and export with a target of producing 6.0 million MT of milled rice per annum by 2005 and surplus for export by 2007.
-Area cultivated to rice increased from 2.2 million ha in 1999 to 2.8 million ha in 2006 -Annual production increased from 3.3 million MT in 1999 to 4.2 million MT in 2006. -Rice importation has reduced from 2.0 million MT in 2003 to about 500,000 MT in 2006 thereby reducing the amount of foreign exchange expended on rice imports. -A sum of N1.0 billion was released for the multiplication of NERICA and other improved varieties of rice. -Training of 370 Extension Agents (EAs) on rice production and processing technologies -Conduct of facilitation training workshops at 16 venues for 1,550 farmers, 185 EAs and 37 FDA Field Officers preparatory to the implementation of the 2004 and 2005 R-Box technology trials. -Establishment of Management Training Plots for the demonstration of the R-Box technology trials in all the 36 states of the Federation and the FCT. -Procurement of 90,505 R-Boxes for distribution to farmers. -Training of engineers and technicians on the installation, operation and maintenance of modern rice mills for improved quality of locally milled rice.
-Inadequate supply of appropriate technologies -Inadequate irrigation facilities -Irregular supply of inputs -Inadequate farm power -Poor processing infrastructure -Ineffective farmers organization and cooperation
SOYBEAN -Increased vegetable oil production with a target of 678,000 MT of soybean per annum over a five year period (2003-2007) under VODEP Initiative
-Expansion of land area under cultivation -Rehabilitation of obsolete mills -Installation of post-harvest facilities such as dryers, threshers and cleaners -Support for production of breeder seeds -Production of foundation seeds using out-growers
-Inadequate and untimely release of funds -Undue delay in Due Process Certification -High cost of farm machinery and other inputs due to inflation
Source: Underlying information from the Federal Ministry of Agriculture and Water Resources, Abuja
165
165
and transportation markets. And this seems to be driving the inflationary trends now affecting every major commodity market. There is no indication of a reversal of the policies in the foreseeable future thus the opportunity for growth in the demand for agricultural commodities should continue for some time. Innovations for Investment in Agro-Processing Enterprises The Federal Government through the Ministry of Agriculture and Water Resources is working out arrangements for investing in agro-processing enterprises in conjunction with state governments and the private sector. A total of 575 agro-processing centers across 26 states participating in the Root and Tuber Expansion Programme (RTEP) are to be established. Each centre is to have complementary root and tuber processing machines capable of producing gari, chips and high quality cassava flour. The beneficiaries are expected to contribute 20 percent of the total cost (Clement-Ogbuanu, 2007). 4.4 Recommendations for Improved Agricultural Competitiveness in Nigeria For improved agricultural competitiveness in Nigeria all the identified constraints in this study as earlier itemized should be the focus of attention with a view to providing enduring solutions within the shortest time possible. In addition, however, there are specific policies and strategies for increased profitability and competitiveness of the selected commodities which should also be considered pari pasu. These can be classified into three broad categories namely; (i) crop-specific interventions, (ii) sector-specific strategies and (iii) and macro-related and other strategies. (a) Crop-Specific Interventions
On the basis of the constraints identified in this study in respect of each of the stages of the value chains for cassava, cotton, maize, rice, soybean and sugar-cane, there are specific actions to be taken by the government, the farmers and private sector organizations to enhance the profitability and competitiveness of the various commodities. Highlights of the crop-specific interventions are presented in Table 4.4, while the other strategies are considered in what follows. (b) Sector-Specific Strategies
Adequate Funding of Research and Extension for Improved Productivity In order to improve the contribution of research towards greater competitiveness of the agricultural sector there is need to increase funding for agricultural research and extension services in the country. This is critical to productivity improvement in the sector. One of the important ways of increasing competitiveness in respect of each of the commodities included in this study is to ensure significant increase in yield. The research institutes will have a role to play in this regard by directing resources into the production of improved varieties that are high-yielding and disease resistant. And through effective funding and management of the extension services, such varieties should be widely disseminated to farmers at all levels – FAM, ECF and LCF. This will also assist in reducing production cost and thus lead to an improvement in the rate of returns. Furthermore, in order to enhance competitiveness, there is need to broaden the scope of extension services beyond on-farm technologies to include marketing, processing and business management aspects.

166
166
Table 4.4: Key Strategies for Improved Agricultural Competitiveness
Crop Strategy
PRODUCTION (FAM)
• Yield improvement. Research Institutes should intensify efforts to come up with high yielding cassava varieties of international standards. Farmers should have access to improved varieties as well as modern inputs such as herbicides, pesticides and fertilizers.
• Out-grower scheme. Contract farming should be part of the private sector initiatives in fostering vertical integration in the cassava industry.
Cassava Production: FAM
PROCESSING
• Establishment of cassava processing plants in key production zones through PPP arrangements. The state governments should be actively involved in the partnership.
• NACRDB should create a credit window to address the financial requirements of SMEs engaged in cassava processing.
PRODUCTION (FAM)
• Use of animal traction. This should be encouraged in cotton producing areas to reduce labour cost and drudgery of farming.
• Yield improvement. Research Institutes should intensify efforts to come up with high yielding cotton varieties of international standards. Farmers should have access to improved varieties as well as modern inputs such as herbicides, pesticides and fertilizers.
• Quality control. The Ministry of Agriculture in cotton producing states should design effective mechanisms for controlling the quality of cotton produced and passed through the marketing channel.
• Out-growers scheme. As part of the revitalization of the textile industry, the textile manufacturing companies should be encouraged to engage in production contracts with cotton farmers.
• Production credit. For out-growers, production credit should be part of the contract conditions; while other producers should have access to credit from NACRDB.
Cotton Production: FAM
PROCESSING
• Establishment of ginneries through PPP arrangements in key production zones. Active participation of state governments in the partnership is highly recommended.
• NACRDB should create a credit window to address the financial requirements of processing SMEs in the cotton industry.

167
167
PRODUCTION (FAM)
• Yield improvements. This will involve increased research activities, extension services and improved farm management practices. Efforts should be intensified to increase production of NERICA and other improved rice varieties to meet rising demand from farmers.
• There should be increased training and re-training of extension agents who should be actively deployed for the training of farmers in the application of emerging technological innovations.
• Irrigation. The rehabilitation of abandoned irrigation schemes should be given priority by the Federal Government. There should be a shift in emphasis from large to small and simple irrigation schemes. The smallholder beneficiaries should be involved in the management of such schemes to ensure sustainability.
• Out-grower scheme. Contract farming should be an integral component of the activities of new firms operating in the rice industry.
• Production credit. For out-growers, production credit should be part of the contract conditions; while other producers should have access to credit from NACRDB.
Rice
PROCESSING
• Establishment of modern rice mills through PPP arrangements in key production zones
• NACRDB should create a credit window to address the financial requirements of SMEs engaged in rice processing.
Maize Production: FAM
• Yield improvement. Tractor hiring services should be available to ensure timely farming operations. The formation of virile farmers associations should be encouraged so that they can serve as channels for distributing modern inputs and thus widening the coverage of users of such inputs.
• Production credit. Credit facilities should be provided for maize farmers to enable them engage in commercial cultivation of maize.
• Storage facilities (on-farm storage facilities should be provided in a scheme to be jointly funded by the government and participating farmers)
Soybean Production: FAM
• Yield improvement. Tractor hiring services should be available to ensure timely farming operations. The formation of virile farmers associations should be encouraged so that they can serve as channels for distributing modern inputs and thus widening the coverage of users of such inputs.
• Production Credit. Credit facilities should be provided for soybean farmers to enable them engage in commercial cultivation of the crop.

168
168
PRODUCTION (FAM)
• Yield improvement. Research Institutes should intensify efforts to come up with high yielding and disease resistant varieties of industrial cane that will conform to international standards in terms of yield and other production-related qualities. Farmers should have access to improved varieties as well as modern inputs such as herbicides, pesticides and fertilizers.
• There is need for deliberate efforts to discover new varieties to reduce reliance on imported cultivars and the attendant adverse consequences.
• Irrigation. Small-scale irrigation facilities should be provided to encourage non-estate-based production of industrial cane.
• Out-grower scheme. Establishment of non-estate-based out-grower schemes by sugar companies should be accorded high priority in order to ensure regular supply of industrial canes.
• Establish cooperative producers of industrial canes that will operate in close proximity to mini sugar mills.
• Production credit. For out-growers, production credit should be part of the contract conditions; while other producers should have access to credit from NACRDB.
Sugarcane
PROCESSING
• Establishment of mini sugar mills (10-1000 tonnes cane per day) through PPP arrangements in key production zones
• NACRDB should create a credit window to address the financial requirements of SMEs engaged in sugar-cane processing.
Improved Agricultural Financing
The arrangements for agricultural finance in the country has to be harmonized and properly institutionalized. The management of available loanable funds from the government should not be ad hoc, but should fall within the framework of the operations of agricultural finance institutions relating especially to the Nigerian Agricultural Cooperative and Rural Development Bank (NACRDB) and the commercial banks. All stages of the commodity chain including production, processing and marketing should be appropriately targeted as far as credit facilities are concerned in order to improve the competitiveness of the agricultural sector.
Promotion of Contract Farming to Enhance Market Access Contract farming is becoming increasingly recognized as an important approach for the modernization of peasant farming. It guarantees linkages between smallholders and large-scale producers and facilitates access to modern inputs and production credit. It is also an approach for ensuring that small-scale farmers play active role in export trade. Many agricultural products such as banana, rubber, cotton and sugar have been produced and marketed through contracting small-scale producers in some developing countries. Usually, the exporter takes responsibility

169
169
for organizing growers, arranging finance and providing technical. Contract farming is a partnership arrangement between the private sector and small-scale farmers which should be encouraged in view of its commercial orientation and employment potentials especially in ensuring longer-term contractual production relationships. In practical terms, contract farming (out-grower schemes) should be introduced into the arrangements for attracting both domestic investors and foreign direct investment into the agribusiness sector. The participating companies will process products in Nigeria using state-of-the-art technology and produce high quality products that conform to international standards while the involvement of out-growers will ensure uninterrupted supply of the required raw materials.
Improved Agricultural Market Information This study reveals that sometimes farmers sell their products at very low prices due to lack of information; and this has tended to lower the rate of returns. Thus, for efficient operation of the commodity markets there is need for a regular flow of relevant information. Fortunately, there are arrangements to upgrade the flow of agricultural market information in Nigeria. However, there is need to strengthen the process through increased funding of institutions involved so that farmers in the rural areas and the various production zones have access to relevant information at the appropriate time. This will enable them take accurate decisions concerning their involvement in the production and marketing of specific commodities. (c ) Macro-Related and Other Policies
Monetary Policy Dimension The Federal Government has worked out a single digit interest rate – 8 percent for agricultural loans as a matter of policy. The gap between this rate and the lending rate by commercial banks is to be bridged up to 14 percent by the government with debt relief funds under an arrangement involving the CBN. This policy should be implemented effectively at the level of smallholders.
Fiscal Policy Dimension
It is expected that government will continue with the policy of duty-free importation of agricultural equipment and machinery. Moreover, important agricultural inputs should be exempted from VAT. Government should avoid deficit budgeting and thus relax the pressure on frequent increase in the price of petroleum products.
Investment in Infrastructure Infrastructure plays a critical role in ensuring efficient operations in the value chains of all the targeted commodities. At the trading logistics stage in particular, transportation costs represent well over 70 percent of total cost. The high cost of transportation is due mainly to incessant increases in the prices of petroleum products and poor conditions of the road in the country. There is need for the government to (i) expedite action on the rehabilitation of the railway system, (ii) improve the conditions of existing roads, (iii) ensure regular maintenance of the roads and (iv) put a stop to the arbitrary and incessant increase in fuel prices. This will lead to improved physical access to markets and reduction transaction costs in the value chain. The government is expected to embark on sustained development of rural road network as this is apt to engender striking returns in terms of output expansion, better flow of information and commodity exchange.

170
170
Fostering Value Added Enterprises Through PPP In view of the limited financial capacity of the Nigerian private sector and reluctance to invest in agribusiness, the public sector (especially at the state level) can work out a partnership arrangement in which processing plants for relevant crops (cassava, rice, sugar-cane, cotton) will be established by the state government while the private-sector partner who would have been involved at the beginning, will be expected to operate and manage the plants on the basis of agreed concession. This innovation is currently being implemented by the government of Osun State in Southwest Nigeria. Under its Integrated Cassava Industrial Projects the State recently completed 15 processing plants as at May 2007 which are to be leased to viable companies, cooperative groups and registered associations through a competitive bidding process. Export Incentives This study has shown the wide divergence between the shipment value and parity price of each of the target commodities and has argued that bridging the gap and making the commodities competitive will warrant innovations outside the agricultural sector. In this regard, the use of export incentives by the government is imperative. It should be noted that there is no amount of reduction in production cost given the current level of technology development and general price levels in the country that will solve the problem in the short- to medium term. Nigerian farmers are not competing with only the producers in other exporting countries but also with the government in each of those countries. The world market prices of most of the commodities in question hardly reflect the production costs in those (OECD) countries. They reflect the influence of the government on the market. Such influence in the form of subsidies and all sorts of price supports, is far more important than the real forces of supply and demand in global agricultural market. For instance, according to Vorley (2005), sugar is sold on the global market at prices barely covering the variable costs of growing and processing in developing countries. The commodity is one of the most heavily subsidized in world. The US government supports domestic sugar prices through loans to sugar processors. The EU sugar regime pays European farmers three times the world price. It stabilizes the market for sugar through a system of quotas and price supports on producing and marketing beet and cane sugar from certain ACP and least developed countries. Vorley (2005) argued convincingly that under the Everything but Arms (EBA) initiative, the EU is phasing in duty and quota free market access for sugar from the 49 poorest countries in the world between 2006 and 2009; but the commodity was not part of the recent mid-term reform of the EU’s Common Agricultural Policy, so dumping of European sugar will continue to depress world markets. Clearly, the low and declining level of prices at the world market is not due to low level of production costs but high level of massive incentives by the government of developed countries to sustain domestic profitability and welfare at all cost. According to the World Bank (2006), there is little Nigeria can do to reduce the agricultural subsidies in industrialized countries other than to continue to participate actively in the global dialogue on trade policy reform. Also depressed international commodity prices are a binding reality for Nigeria given the fact that the country is basically a price-taker. The Bank however, stressed that both factors make it difficult for Nigerian producers to compete in world markets. To my mind, one way of enhancing the competitiveness of the commodities included in this study is for the Nigerian government to review the existing legislation on export incentives to ensure that not only the exporters but also the farmers derive some benefits. The incentives have to be commodity specific and will be realistically determined using hard data on the number of producers and exporters, area under cultivation, quantity produced and exported, production

171
171
costs, domestic prices and other information relevant to the value chain of each commodity. Financial resources from the Agricultural Development Fund can be earmarked to provide necessary incentives. By and large, the findings of this study are consistent with existing knowledge about the nature of trade competitiveness in Nigeria in general and competitiveness in the agricultural sector in particular. Essentially, the study provides a penetrating and innovative empirical basis for a better understanding of the performance of value chains in the sector and for the adoption of meaningful commodity-focused measures to sustain profitability of enterprises and enhance competitiveness. If agriculture must continue to make significant contribution to the growth of the Nigerian economy, there should be a sustained policy commitment to strengthen the performance of the sector. The impressive growth being experienced in the sector will be difficult to sustain unless the constraints militating against competitiveness of the sector are effectively addressed. Arguably, the solutions do not lie entirely within the sector. There is need to cleanse the governance system, sanitize the business environment and purge the economy of administrative pitfalls and corrupt tendencies that unduly escalate costs in the production and trading systems. If farmers are to become more competitive than they are at the moment, they will need to see improved access to markets and lower marketing costs. The weakness of the rural markets is not only a problem of poor infrastructure. Poor quality standards, timing, and lack of trust and confidence are also penalizing local products in both domestic and international markets. Therefore, the public sector has a role to play not only in providing necessary infrastructure but also in creating institutions to ensure quality control and maintain high standards. Finally, progress on the diversification of the economy is unlikely to follow the desired pace unless the country drastically reduces its reliance on the export of primary products and move rapidly up the value chain to export value added agricultural commodities. Urgent steps should therefore, be taken to implement the actions recommended in this study in order to enhance the competitiveness of the sector and attract the required investment from both domestic and foreign sources.
172
172
REFERENCES Baffes, John (2004) “The Cotton Problem”, Trade Department, The World Bank, Washington DC. Busari, A. D. (2004) Sugar-cane and Sugar Industry in Nigeria: The Bitter-Sweet Lessons, Spectrums Books Limited, Ibadan. Nigeria. CBN/NISER (1992) Impact of Structural Adjustment Programme on Agriculture and Rural Life in Nigeria. Nigerian Institute of Social and Economic Research (NISER), Ibadan. Central Bank of Nigeria (CBN)(1999) “Contributions of the Agricultural Credit Guarantee Scheme (ACGS) to Improved Agricultural Financing in Nigeria: Past, Present and Future”, in Ade S. Olomola and S. O. Akande (eds.) Agricultural Finance Issues in Nigeria, NISER, Ibadan. Chigunta, F., Herbert, R., Johnson, M. and R. Mkandawire (2004) “The Changing Policy Environment Facing African Agriculture” 2020 Vision for Food Agriculture and Environment, Focus 12, IFPRI, Washington, DC. April. Clement-Ogbuanu, U. (2007) “FG Set to Boost Cassava Production” The Daily Times of Nigeria, February 2. Dankoli, Y. M. and Dugje I.Y. (1994) Status Report on Irrigation Agronomy in Borno State Presented at a Workshop on Irrigation Agronomy, Plateau State ADP. Sept. 1994. Daramola, A. G. (2004) “Competitiveness of Nigerian Agriculture in a Global Economy: Any Dividends of Democracy?” Inaugural Lecture Series 36, Federal University of Technology, Akure. Nigeria. Dugje I.Y. (1995): Status of Ground Water Irrigation Potential and Management in North East Nigeria. ECA (2000) “Globalization, Regionalism and Africa’s Development Agenda”, Paper Prepared for UNCTAD X, Bangkok, Thailand, February 12-19. ECA (2004) Unlocking Africa’s Trade Potential. Economic Report on Africa. Addis Ababa. Ethiopia Economic Research Service (ERS)(2001) “Profiles of Tariffs in Global Agricultural Markets”, USDA, Washington, DC. Ekwe K. C. (1990) Crop Production System in the Niger Delta Zone. Diagnostic Survey. Ezedinma, Chuma (2005) “Impact of Trade on Domestic Rice Production and the Challenge of Self-Sufficiency in Nigeria”, International Institute of Tropical Agriculture, Ibadan

173
173
Godoy, Julio (2005) “No End to Subsidies in Sight”, Inter Press Service, June 17. Hassett K. A. and R. Shapiro (2003) “How Europe Sows Misery in Africa”, Washington Post, June 22. IAR (1998): Katsina State Agricultural and Community Development Project (KSACDP) - IFAD Assisted. Diagnostic Survey of Project Area. Main Report. December,1998. ISO (2000) Sugar – High Intensity Sweetner Blends: A Threat to Sugar Consumption? MECAS (00) 19, International Sugar Organization , October. pp. 1-22. Keyser, John C. (2006) “Competitive Commercial Agriculture in Africa: Description of Methodology and Presentation of Templates for Value Chain Analysis” Paper Prepared for The World Bank Environmental, Rural & Social Development Unit, Africa Region, Washington DC. July.
Manyong V.M., Smith J., Weber G.K, Jagtap S.S and Oyewole B (1996) Macro Characterisation of Agricultural Systems in West Africa: An Overview RCMD. Monograph No.21, IITA. Manyong, V. M., A. Ikpi, J. K. Olayemi, S. A. Yusuf, B. T. Omonona, V. Okorua and F. S. Idachaba (2005) Agriculture in Nigeria: Identifying Opportunities for Increased Commercialization and Investment. IITA, Ibadan. Nigeria 159 pp. NISER (2001) “Price and Trade Incentives in Nigerian Crop, Livestock, Fisheries and Forestry Production” Final Research Report Submitted by the Agriculture and Rural Development Department of NISER to the Federal Ministry of Agriculture and Rural Development and the World Bank, Abuja. March. Nweke, F.I, Ugwu B.O., Asadu, C.L.A. and AY p (1991) Production Costs in the Yam-Based Cropping Systems of Southwest Nigeria. RCMP Research Monograph No.6, IITA. Ogungbugbe O. H. (1997) Economics of Cassava Production by Peasant Farmers In Oriade Local Govt. Area of Osun State. Olomola, Ade S. (1995) “Sources of Growth and Performance Trends in Nigeria’s Agriculture, 1960-1992” in Ikpi, A. E. and J. K. Olayemi (eds.) Sustainable Agriculture and Economic
Development in Nigeria African Rural Social Science Research Network, Winrock International, Proceedings of a Workshop on Nigeria’s Agricultural Research, Policy, Planning and Plan Implementation Experience and Relevance to Development. Olomola, Ade S. (1996) “Agricultural Policies and Development Strategies in Nigeria: Issues and Cases” An Invited Paper Presented at the Training Programme on Macroeconomic Policy Analysis and Management Organized by NCEMA, Ibadan. September 23- December 6.

174
174
Olomola Ade S. (2006) “Can Peasant Agriculture Survive as a Business in Africa?” Paper Commissioned by the AERC and Presented at the AfDB Economic Conference on Accelerating Africa’s Development – Five Years into the Twenty-First Century Held at Le Renaissance Hotel, Tunis, Tunisia, November 22-24 Olomola Ade S. (2007) “Strategies for Managing the Opportunities and Challenges of the Current Agricultural Commodity Booms in SSA” Invited Paper Presented at the IX Senior Policy Seminar of the African Economic Research Consortium (AERC), Held at Hilton Yaounde, Cameroon, February 27-March 1. Olomola, Ade S., Nwosu, A.C. and F. Okunmadewa (1998) Market Liberalization and Its Effects on Nigerian Agriculture. A Publication of NISER/SSCN National Research Network on Liberalization Policies in Nigeria Supported by IDRC. Olukosi, J. O. Ogungbile, A.O and Kalu, B.A. (1991) Appropriate Agricultural Technologies for Resource - Poor Farmers. NFSRN. Pinstrup-Andersen, P. (2001) “To Benefit Developing Countries, the Doha Round Agriculture Agreement Must Be Ambitious”, mimeo. International Food and Agricultural Trade Policy Council, Washington, D.C. RMRDC (2004) “Soybean Survey Report” Raw Material Research and Development Council, Abuja, Nigeria (see also Survey Reports for Cassava, Cotton and Maize). Sharma, D. (2003) “Protecting Agriculture: “Zero-Tolerance” on Farm Subsidies”, Foreign Policy in Focus, February 5. Tahir, Isa (1999) “Performance and Future Outlook of NACB in Agricultural Financing” in Ade S. Olomola and S. O. Akande (eds.) Agricultural Finance Issues in Nigeria, NISER, Ibadan The NewFarm (2005) “Agriculture Export Dumping Booms Over the Last Ten Years”, The Rodale Institute. Thoenes, P. (2004) “The Role of Soybean in Fighting World Hunger”, FAO Commodities and Trade Division, Basic Foodstuffs Service, Rome UNCTAD (2005) “Trade and Development Report, 2005”. Geneva, 204 p. USDA (2002) Foreign Agricultural Services, United States Department of Agriculture, Washington DC, USA. August Vorley, Bill (2005) “Corporate Concentration From Farm to Consumer” Food Inc. UK Food Group.

175
175
Walkenhorst, Peter (2006) “Distortions to Agricultural Incentives in Nigeria”, Contribution to the Project on Poverty Alleviation Through Reducing Distortions to Agricultural Incentives, mimeo. International Trade Department, World Bank, Washington, DC. World Bank (2006) “Getting Agriculture Going in Nigeria: Framework for a National Growth Strategy” Main Report. Environment, Rural and Social Development for Central Africa, Africa Regional Office.
Yee, Peter H. and M. Paludetto (2005) “Nigeria: Value and Supply Chain Study”, Final Report Prepared for The World Bank, Consilium International Inc. Seatle, Washington, USA, March.
Zachary, G. P. (2006) “Africa in Bloom” Business 2.0 Magazine October 2.
Top Related