


Languages
Pages
Legal


2014 Vasa Basin Study
HabitatThe purpose of the Habitat Analysis study was to assess fish habitat in lower Vasa Creek (downstream of I-90) and to evaluate the capacity of the stream to support kokanee salmon spawning.
Kokanee salmon were once numerous in Lake Sammamish but today spawn only in a few streams. Kokanee do not go out to the ocean but spend their entire lifecycle in fresh water. While kokanee have been observed in Vasa Creek, their presence has been periodic and in low numbers.
Key Findings
Lower Vasa Creek has channel dimensions and sediment composition very similar to other major kokanee creeks draining Lake Sammamish, so should be considered potential habitat for kokanee. If kokanee can access the stream, it is likely they can spawn successfully.
There is potential for habitat improvement:
• Shade the Stream: Shading from trees and shrubs helps keep water cold and stabilizes stream banks. Excellent shade (greater than 90% coverage) was found in 9 of the 12 reaches. Stream areas with lawns to the stream edge could be improved by planting trees and shrubs.
• Reduce impact of barriers: Several potential fish passage barriers were discovered within the lower reaches.

2014 Vasa Basin Study
Habitat One private and two city-owned culverts were identified as potentially slowing
migration unless there is adequate rain to increase the stream depth, thereby giving fish more space to jump.
Five grade control weirs (small waterfalls, see photo) need deeper pools to allow fish to jump over logs or rocks installed to stabilize the stream bed. The barriers are located on private property between 137th Ave SE and 164th Pl SE.
• Increase Wood: Lower Vasa Creek needs more large pieces of wood in the stream to create complex habitat, especially deep pools. Lack of pools limits the ability for kokanee to rest, find cover from predators, and jump over barriers.
• Improve the first point of access: The lowest portion of Vasa Creek, near Lake Sammamish, could benefit the most from improvements. There is development close to the stream, limited shade, rock armoring (riprap), lack of wood in the channel, and few pools. Because all kokanee and other salmon need to pass through this section to spawn, the whole system would benefit from improvements in this area.
Fish Studies
• Lack of pool habitat may be limiting fish diversity and the number of older trout residing in Vasa Creek. Only cutthroat trout were observed in a 151 foot survey area of lower Vasa Creek. Most (95%) of the 86 trout captured were less than 3 inches long, indicating they were less than one year old. Only two fish were more than one year old.

2014 Vasa Basin Study
HabitatWhat will Bellevue Utilities do with this information?
• Fix fish passage at public culverts through the Bellevue Utilities Fish Passage Improvement Capital Program, D-81.
• Provide or coordinate technical assistance to property owners wanting to improve habitat.
What can you do to help?
• Plant native trees and shrubs near the stream to provide shade and habitat.
• Place wood to create pools. Construct better fish passage over grade control weirs. This will require local and state permits.
Contact Angie Peace, Washington Department of Fish and Wildlife, Regional Habitat Biologist [email protected], 425-427-0570 for technical assistance.
Contact Mark Taylor, Trout Unlimited, for volunteer help and assistance. Personal Cell (206) 200-2840. Email [email protected]. Trout unlimited web information www.tu-bi.org/kokaneeproject.htm
• If you see kokanee, call or email Bellevue Stream Team at 425-452-5200 or [email protected].
For Additional Information
Questions? Kit Paulsen, Bellevue Utilities, 425-452-4861
Technical reports are available at: http://bellevuewa.gov/pdf/Utilities/Vasa_Creek_Final_Habitat_Memo.pdf
Kokanee Workgroup Information: www.kingcounty.gov/environment/animalsAndPlants/salmon-and-trout/kokanee.aspx

Vasa Creek Fish Habitat Assessment
Prepared for:
City of Bellevue
450 110th Ave. NE Bellevue, WA 98009
Prepared by:
19803 North Creek Parkway
Bothell, WA 98011
August 2014

Vasa Creek Fish Habitat Assessment
Prepared for:
City of Bellevue
450 110th Ave. NE Bellevue, WA 98009
Prepared by:
19803 North Creek Parkway
Bothell, WA 98011
August 2014

Vasa Creek Fish Habitat Assessment
City of Bellevue iii
Contents
1. INTRODUCTION ............................................................................................................................ 1
1.1 Background Information ....................................................................................................... 1
1.2 Project Overview .................................................................................................................... 1
2. METHODS ........................................................................................................................................ 3
2.1 Data Collection ........................................................................................................................ 3
2.2 Methodology Limitations ...................................................................................................... 7
3. SUMMARY OF FINDINGS ........................................................................................................... 7
3.1 Habitat Assessment ................................................................................................................ 7
3.1.1 Habitat Units .............................................................................................................. 8
3.1.2 Channel Dimensions ............................................................................................... 10
3.1.3 Shading and Riparian Vegetation ........................................................................ 11
3.1.4 Fish Cover and LWD .............................................................................................. 14
3.1.5 Substrate Size and Embeddedness ........................................................................ 15
3.2 Outfall Reconnaissance Inventory ..................................................................................... 16
4. MACROINVERTEBRATE SAMPLES ....................................................................................... 17
5. ELECTROFISHING ....................................................................................................................... 17
6. DISCUSSION AND RECOMMENDATIONS ......................................................................... 18
7. REFERENCES .................................................................................................................................. 20
Attachments
ATTACHMENT A – Maps
ATTACHMENT B – Habitat Assessment Field Forms
ATTACHMENT C – Lower Vasa Outfall Reconnaissance Inventory/Sample Collection Field
Forms
ATTACHMENT D – Digital Deliverables
ATTACHMENT E – 2014 Vasa Creek Electro‐fishing Summary Report
ATTACHMENT F – 2011 Vasa Creek Macroinvertebrate Summary Report

Vasa Creek Fish Habitat Assessment
City of Bellevue iv
List of Tables
Table 1. Habitat Unit Length ................................................................................................................... 8
Table 2. Pool Habitat Units ....................................................................................................................... 9
Table 3. Channel Dimensions at Habitat Assessment Transects ...................................................... 11
Table 4. Summary of Densitometer Readings ..................................................................................... 12
Table 5. Summary of Riparian Vegetation Assessment ..................................................................... 13
Table 6. Summary of Fish Cover ........................................................................................................... 14
Table 7. Summary of Large Woody Debris Inventory ....................................................................... 15
Table 8. Summary of Substrate Size and Embeddedness .................................................................. 16
Table 9. Outfall Reconnaissance Inventory ......................................................................................... 17
List of Figures
Figure 1. Location Map of Lower Vasa Creek Basin and Fish Habitat Assessment
Transects ............................................................................................................................. 2
Figure 2. Field survey sampling layout of major and minor transects. Adapted from
WADOE (2006). ................................................................................................................... 4
Figure 3. Plunge Pool A4 .......................................................................................................................... 8
Figure 4. Vegetation at Transect A ....................................................................................................... 12
Figure 5. View Upstream of Transect K ............................................................................................... 13
Figure 6. Vegetation at Transect B ........................................................................................................ 13
Figure 7. AUC Escapement Estimates for the Four Primary Kokanee Spawning
Tributaries (LSKWG 2013) .............................................................................................. 19
Figure 8. Split Plunge Pool D4 from Constructed Grade Control .................................................... 19

Vasa Creek Fish Habitat Assessment
City of Bellevue 1
1. Introduction
1.1 Background Information
Vasa Creek is a 1,085‐acre basin located in the Puget Lowland that drains into the southwestern
end of Lake Sammamish. The watershed is highly developed with a mixture of predominately
residential, commercial and institutional development. Forty percent of the land cover is
classified as impervious surface. The basin elevation ranges from 31 to 1,195 feet (City of
Bellevue 2009).
The portion of Vasa Creek (lower Vasa Creek) downstream of Interstate 90 (I‐90) is migratory
fish bearing, with occasional rainbow trout, cutthroat trout, coho salmon, and late‐run kokanee
salmon present. The presence of I‐90 is a complete fish passage barrier, preventing upstream
access beyond this point. Furthermore, kokanee spawning habitat within the tributary creeks to
Lake Sammamish is relatively limited. Suitable spawning habitat in most Lake Sammamish
tributaries occurs in short reaches due to migration barriers or poor channel conditions
upstream (Connor et al. 2000).
Recent results from the Lake Sammamish Kokanee Technical Work Group (LSKTWG) highlight
the importance of the Lake Sammamish tributaries for kokanee salmon. The LSKTWG (2013)
report results have shown a major spike in escapement estimates from 2013 demonstrating the
success of the supplementation program that began in 2010‐2011 and underscoring the need for
evaluating kokanee habitat and restoration potential in Lake Sammamish tributaries.
1.2 Project Overview
Tetra Tech was contracted by the City to assist with ongoing efforts to study fish habitat and
slope stability in the Vasa Creek (State Stream #08‐0156) and the East Tributary to Vasa Creek
stream corridors. The objective of this project is to evaluate kokanee salmon habitat in the
accessible portions of lower reach of Vasa Creek (downstream of I‐90) and slope stability
concerns upstream that may negatively impact habitat quality and/or restoration potential. This
work builds on the technical report (master’s thesis) by Britton (2013) that examined Vasa Creek
channel conditions and slope stability in a stream segment upstream of the I‐90 crossing, which
is a complete barrier to fish passage.
This project has two discrete components; a landslide assessment, and a fish habitat assessment.
The landslide assessment component of the field work occurred in May of 2014. The results
from that effort are available in the Vasa Creek Landslide Inventory and Slope Stability
Reconnaissance technical memo (Tetra Tech 2014). The fish habitat assessment field work was
completed in June of 2014. During the habitat assessment survey, Tetra Tech staff surveyed

Vasa Creek Fish Habitat Assessment
City of Bellevue 2
lower Vasa Creek assessing habitat conditions using the assessment protocols of the
Washington Department of Ecology for Status and Trends Monitoring (WADOE 1999). In
addition to the habitat data collected, Outfall Reconnaissance Inventory/Sample Collection
forms were completed for observed discharges.
The habitat assessment surveys were conducted on the extent of lower Vasa Creek between the
outlet of the I‐90 crossing and the mouth of Vasa Creek at Lake Sammamish (approximately
1,270 meters). Within this reach, a series of relatively evenly spaced representational stream
transects were identified starting at Transect A (near the mouth) and ending at Transect K (at
the fish passage barrier). Section 2 describes the layout of transects and data collection methods
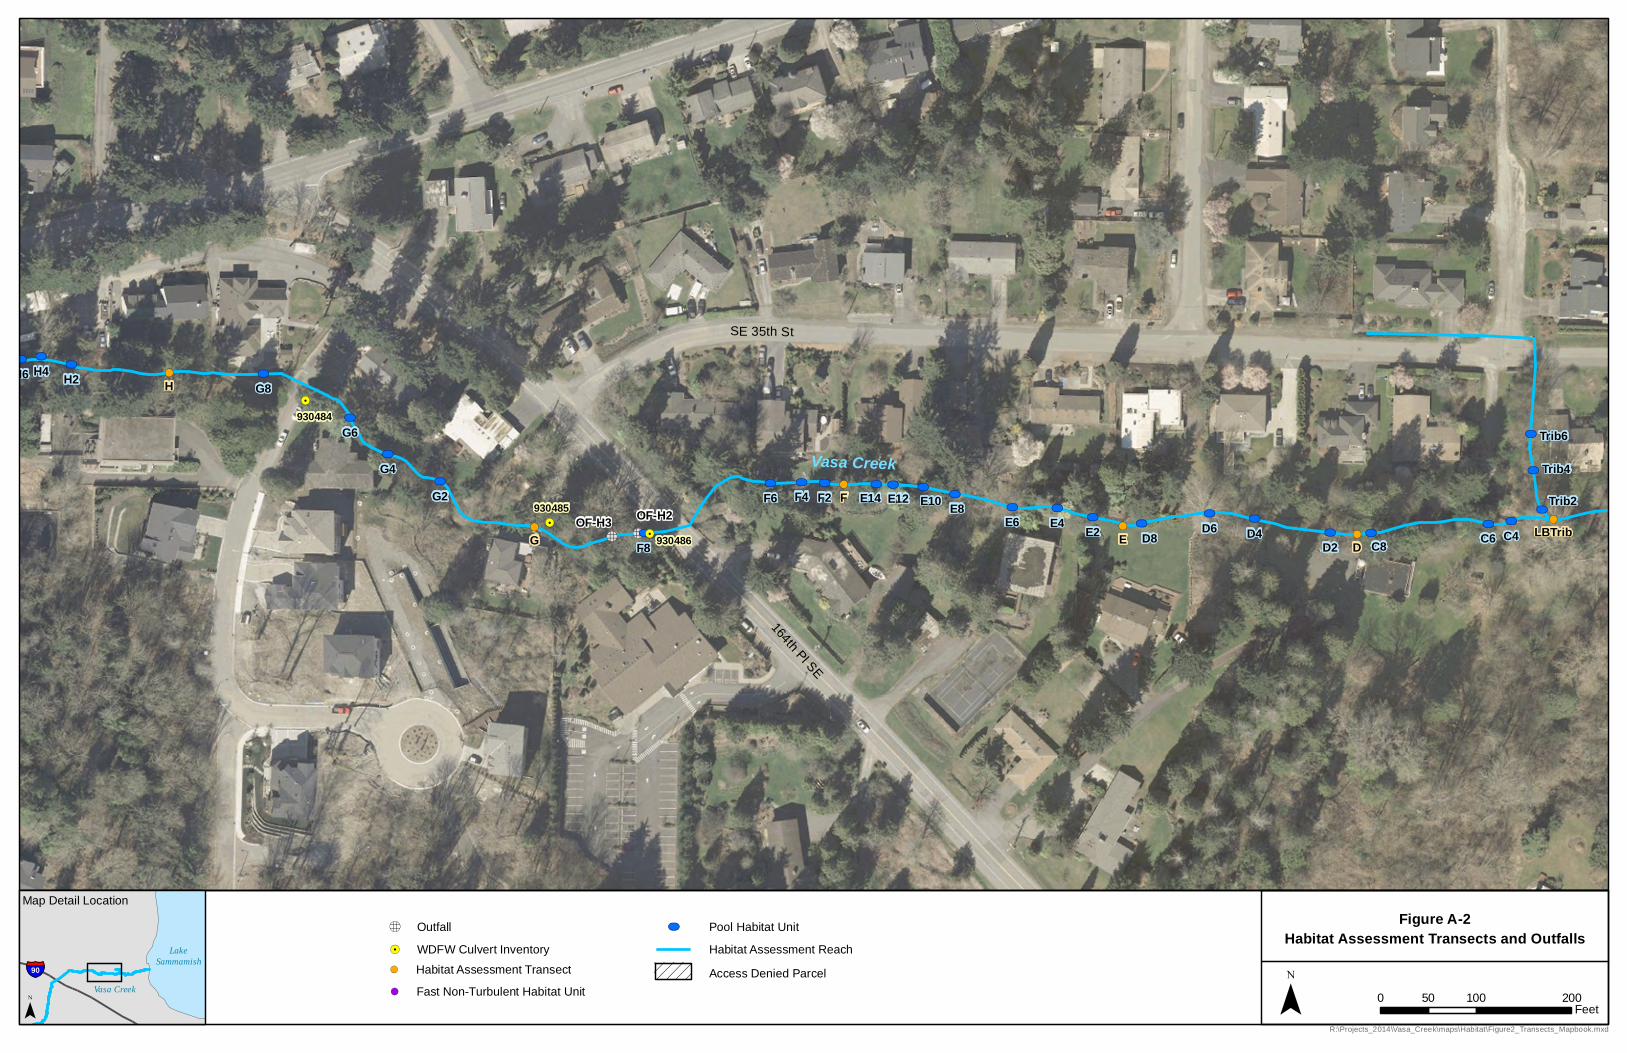
in greater detail. Figure 1 contains the habitat assessment area surveyed and the habitat survey
transect locations. The gaps in the survey area downstream of Transect A and between Transect
B and West Lake Sammamish Parkway were not surveyed due to access being denied by
landowners for those parcels (Figure 1). Data were also collected to characterize a left bank
(facing downstream) tributary to Vasa Creek following the same methods described in
Section 2.
Figure 1. Location Map of Lower Vasa Creek Basin and Fish Habitat Assessment Transects
Vasa Creek Fish Habitat Assessment
City of Bellevue 3
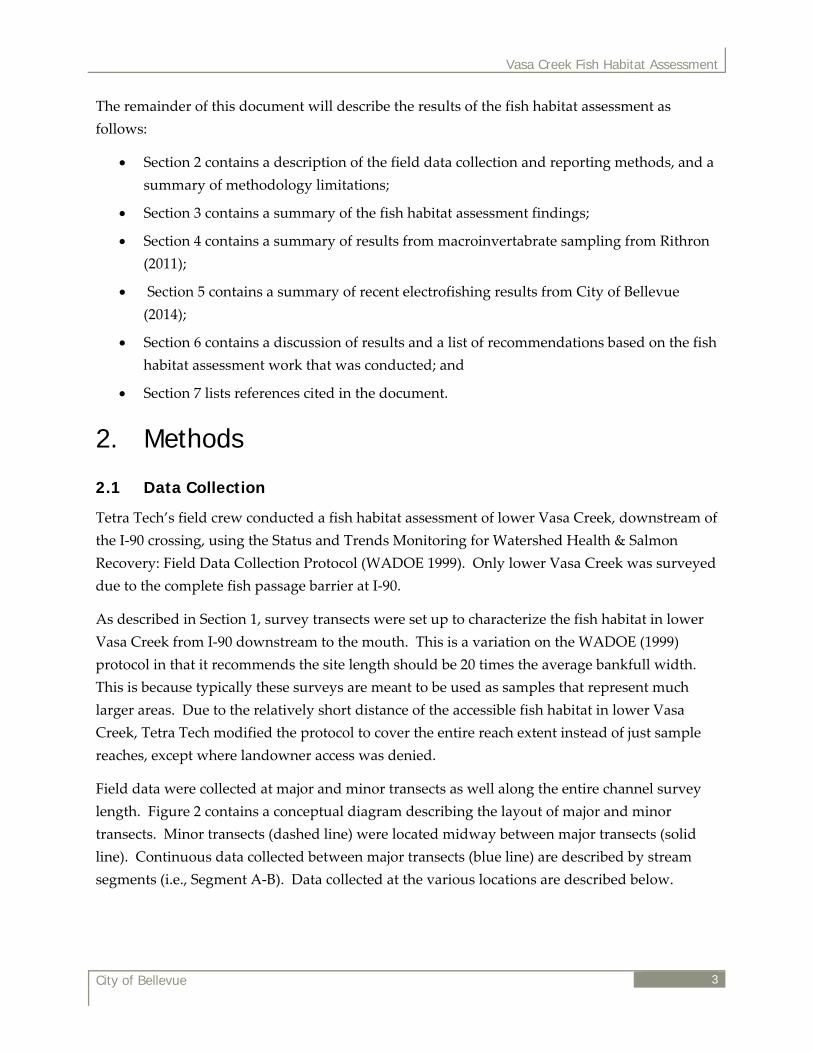
The remainder of this document will describe the results of the fish habitat assessment as
follows:
Section 2 contains a description of the field data collection and reporting methods, and a
summary of methodology limitations;
Section 3 contains a summary of the fish habitat assessment findings;
Section 4 contains a summary of results from macroinvertabrate sampling from Rithron
(2011);
Section 5 contains a summary of recent electrofishing results from City of Bellevue
(2014);
Section 6 contains a discussion of results and a list of recommendations based on the fish
habitat assessment work that was conducted; and
Section 7 lists references cited in the document.
2. Methods
2.1 Data Collection
Tetra Tech’s field crew conducted a fish habitat assessment of lower Vasa Creek, downstream of
the I‐90 crossing, using the Status and Trends Monitoring for Watershed Health & Salmon
Recovery: Field Data Collection Protocol (WADOE 1999). Only lower Vasa Creek was surveyed
due to the complete fish passage barrier at I‐90.
As described in Section 1, survey transects were set up to characterize the fish habitat in lower
Vasa Creek from I‐90 downstream to the mouth. This is a variation on the WADOE (1999)
protocol in that it recommends the site length should be 20 times the average bankfull width.
This is because typically these surveys are meant to be used as samples that represent much
larger areas. Due to the relatively short distance of the accessible fish habitat in lower Vasa
Creek, Tetra Tech modified the protocol to cover the entire reach extent instead of just sample
reaches, except where landowner access was denied.
Field data were collected at major and minor transects as well along the entire channel survey
length. Figure 2 contains a conceptual diagram describing the layout of major and minor
transects. Minor transects (dashed line) were located midway between major transects (solid
line). Continuous data collected between major transects (blue line) are described by stream
segments (i.e., Segment A‐B). Data collected at the various locations are described below.

City of Be
At major
Sl
W
W
Su
W
B
B
C
F
N
R
G
P
At minor
W
Su
W
G
P
Figure 2
ellevue
r transects (s
lope and bea
Wetted and b
Wetted and b
ubstrate size
Water depth,
ar width
ank instabili
Canopy shad
ish cover
Near bank hu
Riparian vege
GPS coordina
hotographs
r transects (d
Wetted and b
ubstrate size
Water depth
GPS coordina
hotographs
2. Field surve
olid line):
aring
bankfull wid
bankfull heig
e and embed
bankfull de
ity
de
uman disturb
etation struc
ates of transe
dashed line)
bankfull wid
e and embed
and bankful
ates of transe
y sampling lay
dth
ght
ddedness
epth
bance
cture
ects
:
dth
ddedness
ll depth
ects
yout of majorr and minor tr
Vasa
ransects. Adap
a Creek Fish H
pted from WA
Habitat Assess
ADOE (2006).
sment
4

Vasa Creek Fish Habitat Assessment
City of Bellevue 5
Along the entire survey length:
Habitat units
Thalweg depth
Presence of side channels
Presence of bars
Tally of Large woody Debris (LWD)
GPS coordinates of transects
Photographs
In total, 12 major survey transects were established: 11 on Vasa Creek (A to K), and 1 on a left
bank tributary (LBTrib) located 420 meters (1,378 feet) upstream of the mouth (Figure 1). Minor
transects, where less detailed data collection took place (described below), were located mid‐
way between each major transect. The downstream extent of the survey (Transect A) was
located 90 meters (295 feet) upstream of the mouth of Vasa Creek and the upstream extent
(Transect K) was near the I‐90 crossing outlet (Figure 1). The distribution of habitat units and
amount of LWD was collected throughout the length of the segments between major transects.
Two sections, totaling 230 meters (754 feet), were not surveyed due to access to those parcels
being denied. In total, 1,020 meters (3,346 feet) were surveyed on Vasa Creek as part of the fish
habitat assessment. A length of 50 meters (164 feet) was surveyed on the left bank tributary
before it reached the residential road network.
Habitat Units
Habitat unit type, length, and characteristics were identified throughout the length of the
survey reach. Habitat units were classified into the following habitat unit types:
Fast non‐turbulent – habitat unit with flow that has a smooth surface and is less deep
than in pools.
Fast turbulent – habitat unit with supercritical flow, with hydraulic jumps sufficient to
have a water surface that is rippled or contains whitewater.
Pools – habitat units with a maximum depth at least 1.5 times the pool tail crest depth
(WADOE 1999).
The locations of all habitat unit breaks were identified in the field. Where there were
consecutive pools in a series, all were included as a single habitat unit with the downstream
pool dimensions being measured and the others tallied.
Channel Dimensions
Physical channel dimensions were measured at each major and minor transect using standard
field methods. At major transects, these dimensions included wetted width, bankfull width, bar

Vasa Creek Fish Habitat Assessment
City of Bellevue 6
width, wetted depth, slope, and bearing. The same data were collected at minor transects,
except for bankfull depth.
Shading and Riparian Vegetation
Densitometer readings were taken at each major transect to evaluate the percent shade.
Readings were taken from the center of the channel facing upstream, downstream, right bank,
left bank, and at the channel banks.
A categorical assessment of the riparian vegetation structure was also conducted at each major
transect. Vegetation type and abundance was evaluated for the canopy, under‐canopy, and
ground cover.
Fish Cover and LWD
The amount of available fish cover including woody debris, brush, over‐hanging vegetation,
undercut banks, boulders, ledges, and artificial structures was evaluated at each major transect.
The presence of algae and macrophytes/bryophytes was also recorded.
Pieces of LWD with a diameter greater than 0.1 meter and length greater than 2 meters were
tallied between each major transect. Only pieces of LWD located within the bankfull channel
were counted.
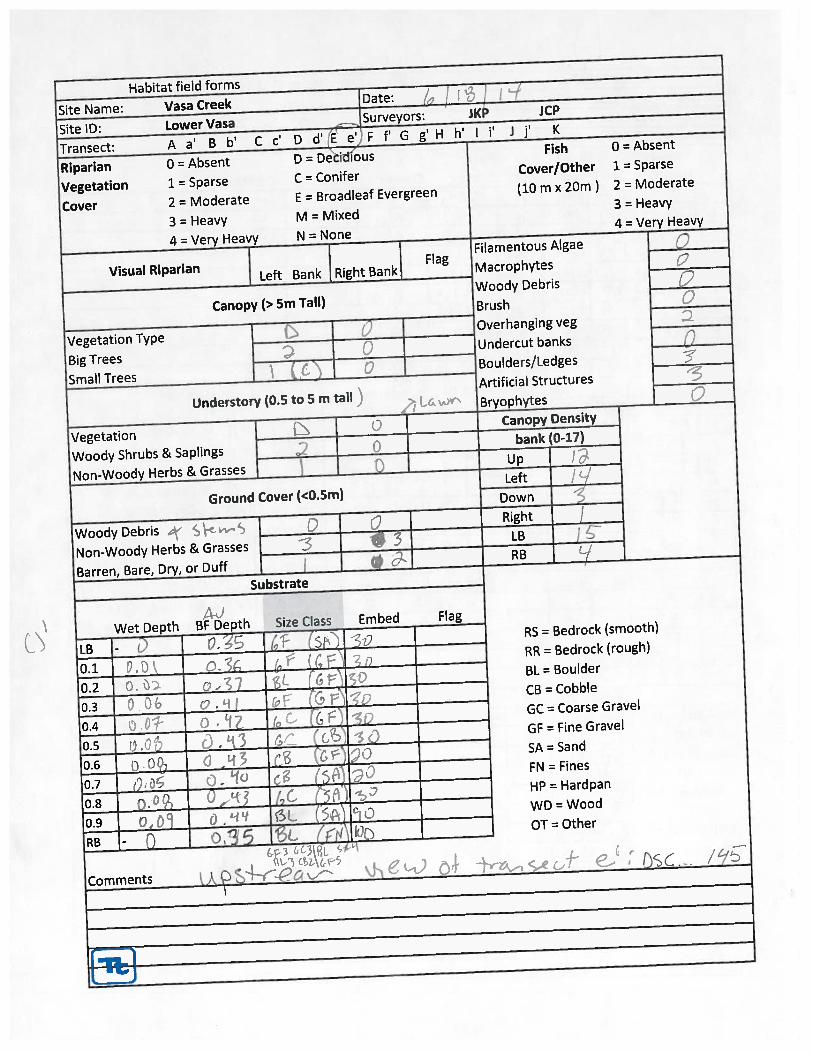
Substrate Size and Embeddedness
Substrate size and fine sediment embeddedness were evaluated at major and minor transects.
The dominate and sub‐dominate substrate size classes and percent relative abundance were
visually estimated at sample points across each transect. Substrate sizes classes included
boulder, cobble, coarse gravel, fine gravel, sand, fines and hardpan.
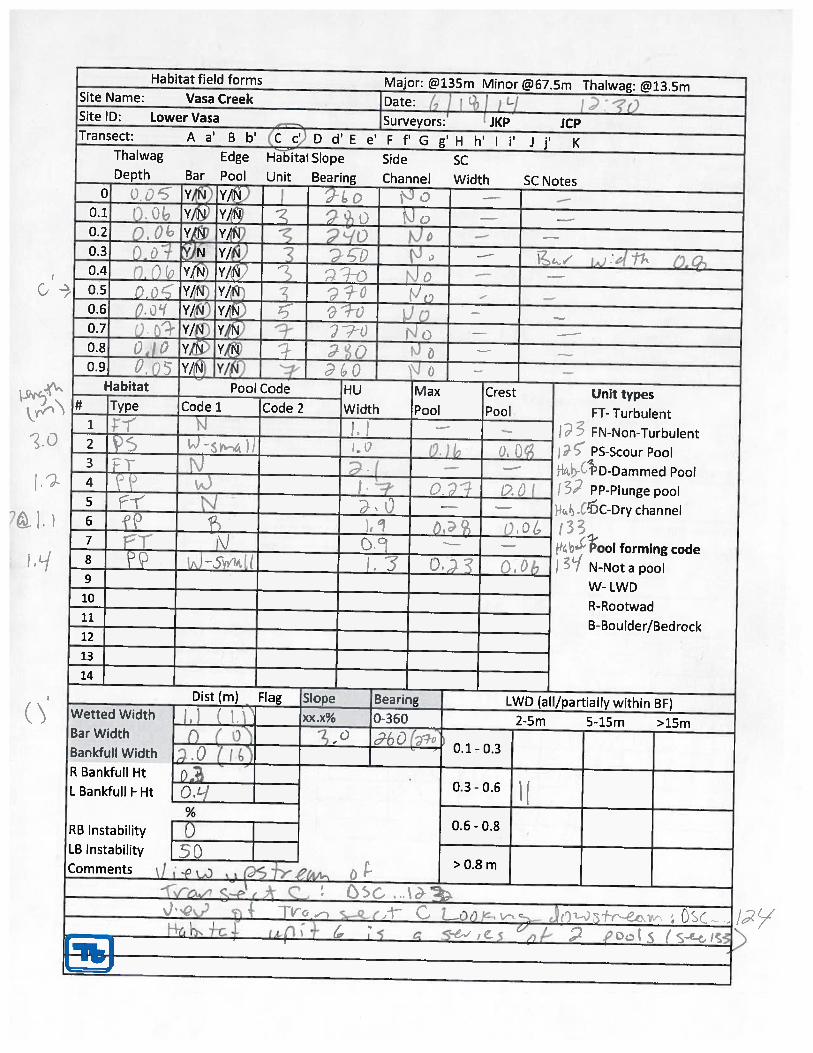
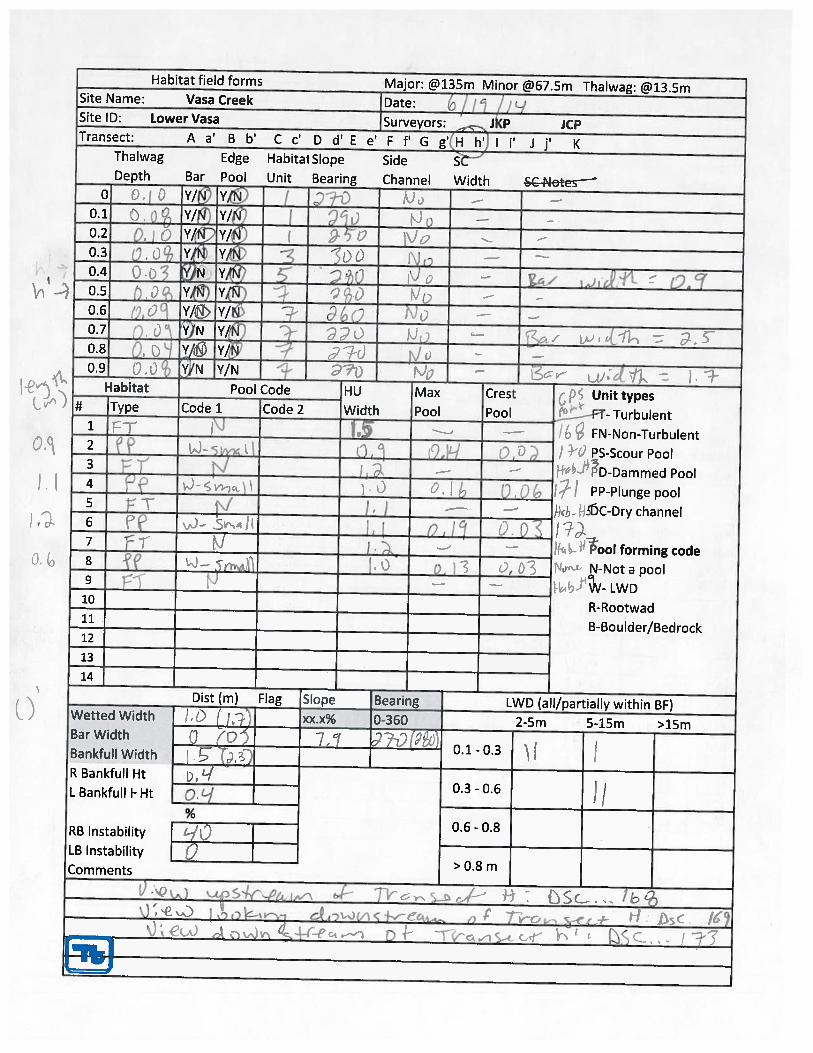
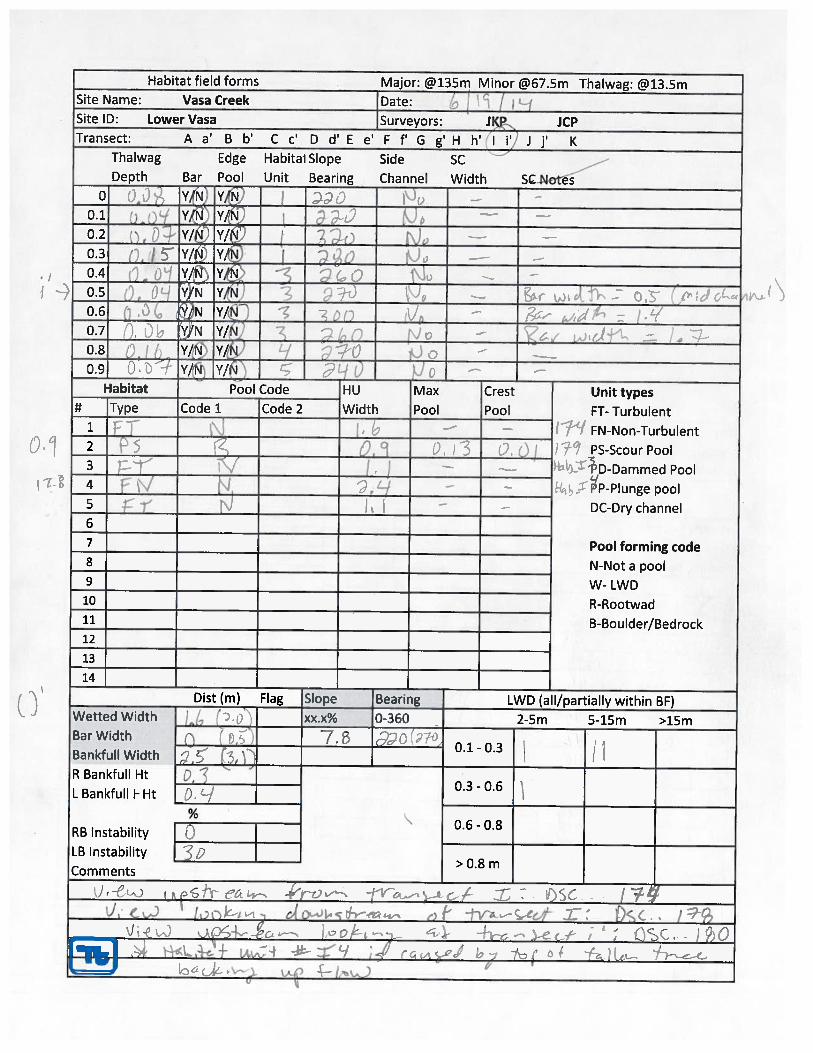
Habitat Assessment Field Forms were used to document habitat characteristics according to
field protocols. The entire set of completed field forms is included in Attachment B (Habitat
Assessment Field Forms).
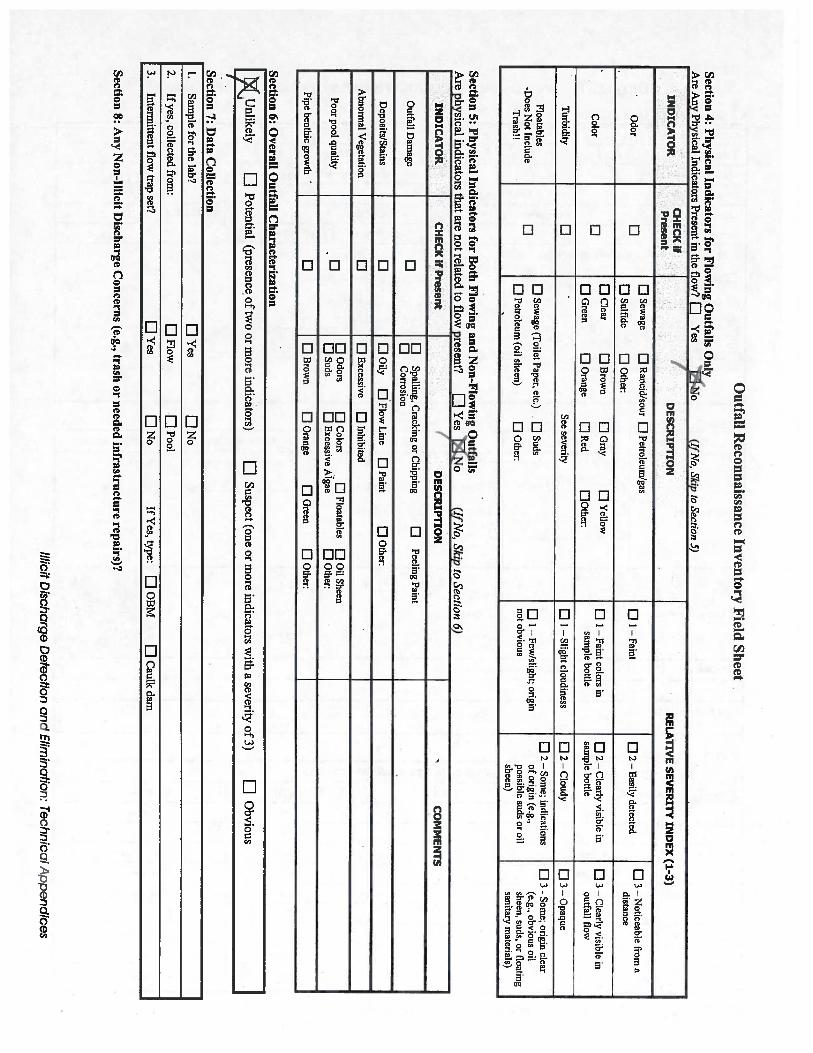
Additionally, the City Outfall Reconnaissance Inventory/Sample Collection Field Forms were
completed to document characteristics of all outfalls observed during the habitat field surveys
downstream of 163rd Avenue SE. Outfalls upstream of 163rd Avenue SE were inventoried
during the landslide inventory and included in Tetra Tech (2014). There may have been
additional outfalls within the project area that were not detected due to vegetation cover and
therefore not surveyed. The field data collected included the following items regarding
detected outfalls:
Location data (GPS Point, Photo)
Outfall type (Material, Shape, Size)
Vasa Creek Fish Habitat Assessment
City of Bellevue 7
Flow dependent indicators (Odor, Color, Turbidity, Floatables)
Site indicators (Outfall Damage, Deposits/Stains, Abnormal Vegetation, Poor Pool
Quality, Pipe Benthic Growth)
The entire set of completed field forms is included in Attachment C (Lower Vasa Outfall
Reconnaissance Inventory/Sample Collection Field Forms).
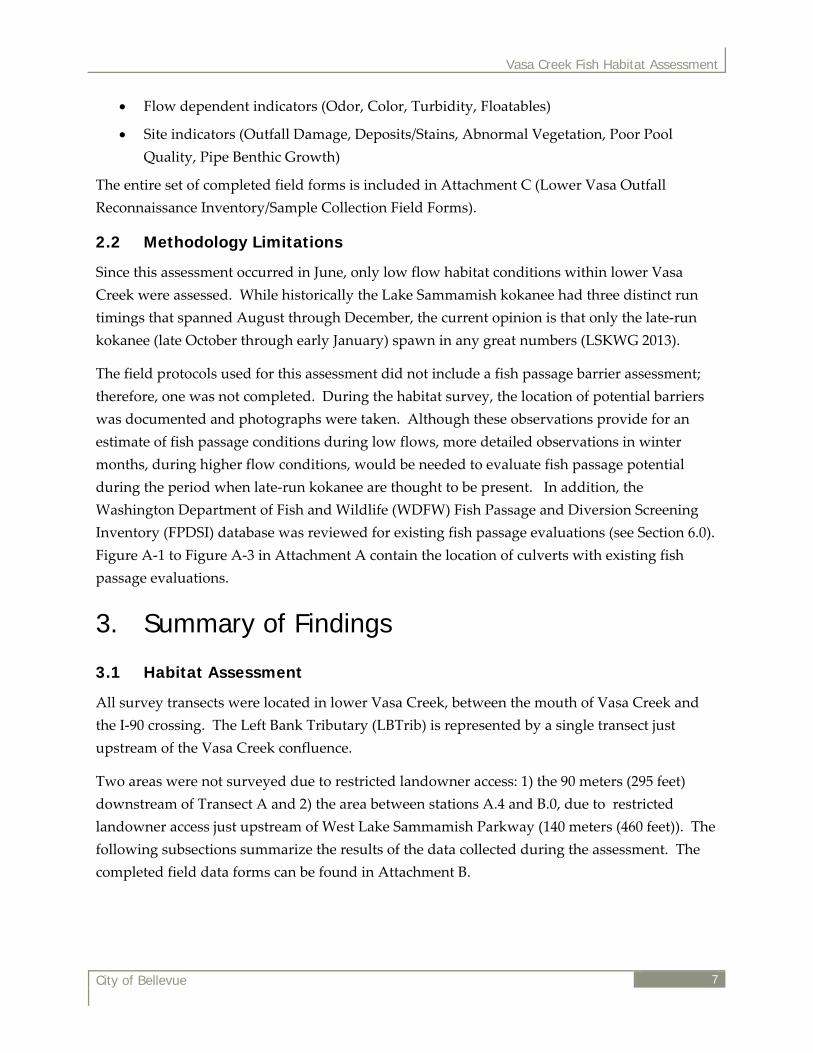
2.2 Methodology Limitations
Since this assessment occurred in June, only low flow habitat conditions within lower Vasa
Creek were assessed. While historically the Lake Sammamish kokanee had three distinct run
timings that spanned August through December, the current opinion is that only the late‐run
kokanee (late October through early January) spawn in any great numbers (LSKWG 2013).
The field protocols used for this assessment did not include a fish passage barrier assessment;
therefore, one was not completed. During the habitat survey, the location of potential barriers
was documented and photographs were taken. Although these observations provide for an
estimate of fish passage conditions during low flows, more detailed observations in winter
months, during higher flow conditions, would be needed to evaluate fish passage potential
during the period when late‐run kokanee are thought to be present. In addition, the
Washington Department of Fish and Wildlife (WDFW) Fish Passage and Diversion Screening
Inventory (FPDSI) database was reviewed for existing fish passage evaluations (see Section 6.0).
Figure A‐1 to Figure A‐3 in Attachment A contain the location of culverts with existing fish
passage evaluations.
3. Summary of Findings
3.1 Habitat Assessment
All survey transects were located in lower Vasa Creek, between the mouth of Vasa Creek and
the I‐90 crossing. The Left Bank Tributary (LBTrib) is represented by a single transect just
upstream of the Vasa Creek confluence.
Two areas were not surveyed due to restricted landowner access: 1) the 90 meters (295 feet)
downstream of Transect A and 2) the area between stations A.4 and B.0, due to restricted
landowner access just upstream of West Lake Sammamish Parkway (140 meters (460 feet)). The
following subsections summarize the results of the data collected during the assessment. The
completed field data forms can be found in Attachment B.

City of Be
3.1.1
Habitat u
identified
number i
of the ha
as riffles.
common
1 summa
forms inc
assessme
Table 1.
Habitat
Turbul
Non-Turb
Fast WSu
Scour Poo
Plunge (55)
Slow WSu
A total of
Creek (0.
summari
Pool hab
surveyed
was varia
pools and
debris ste
plunge p
barriers t
the shallo
structure
ellevue
Habitat U
units were d
d with an alp
incrementin
bitat in the s
. A smaller p
nly referred t
arizes the len
cluded in At
ent of lower
. Habitat U
Type L
lent
bulent
Water btotal
ol (10)
Pool )
Water btotal
Total
f 65 pools w
.06 pools per
izes the dim
itat was fou
d; however, t
able (Table 2
d plunge po
eps (Figure 3
pools (D2, D4
to upstream
ow pool dep
es.
nits
delineated fo
phanumeric
ng in the ups
survey area
proportion (
to as glides o
ngth of the h
ttachment B
Vasa Creek.
Unit Length
Length Prese
849.5
44.2
893.7
17.9
108.4
126.3
1,020
were identifie
r meter surv
ensions for e
nd in each o
the number
2). The pools
ools formed b
3). Some of
4, D6, E4, an
passage by
pths compare
r the entire l
c code beginn
tream direct
was classifie
(4 percent) w
or runs. Poo
habitats foun
. There wer
.
h
ent (m)
5
7
4
3
0
ed along low
veyed). Tabl
each pool id
of the segme
of pools per
s identified w
by boulder o
the structur
nd G6) may b
adult kokan
ed to the hei
length of the
ning with do
tion (e g., A‐
ed as fast, tu
was classified
ols represent
nd in Vasa C
e no side‐ch
Percent of
wer Vasa
le 2
dentified.
nts
r segment
were scour
or woody
res creating
be potential
nee due to
ight of the
Vasa
e survey. In
ownstream t
‐1, A‐2, A‐3)
urbulent hab
d as fast, non
ted 12 percen
Creek. The fi
hannels detec
f Reach Leng
83
4
88
2
11
12
100
Figure 3
a Creek Fish H
ndividual hab
transect lette
. The major
bitat, commo
n‐turbulent
nt of the tota
ield data can
cted during
gth (%)
3. Plunge Poo
Habitat Assess
bitat units w
er followed b
rity (83 perce
only referred
habitat,
al length. Ta
n be found in
the habitat
ol A4
sment
8
were
by a
ent)
d to
able
n the

Vasa Creek Fish Habitat Assessment
City of Bellevue 9
Table 2. Pool Habitat Units
Habitat Unit
Habitat Type1/
Pool Code
Pool Width (m)
Pool Length
(m)
Max Pool
Depth (m)
Pool Crest Depth
(m) Notes
A2 PS B 1.3 0.5 0.16 0.08
A4 PS B 1.9 0.8 0.35 0.03
B4 PP SWD 2.2 1.0 0.12 0.04
B8 PS B 0.5 1.1 0.13 0.08
B10 PS B 0.8 3.0 0.2 0.1
B12 PS B 1.1 3.5 0.19 0.08
C2 PS SWD 1.0 3.0 0.16 0.08
C4 PP LWD 1.7 1.2 0.27 0.01
C6 PP B 1.9 1.1 0.28 0.06 2 pools
C8 PP SWD 1.3 1.4 0.23 0.06
D2 PP B 1.9 1.2 0.27 0.04 Potential Barrier
D4 PP B 1.0 0.8 0.17 0.06 Potential Barrier
D6 PP LWD 2.2 1.5 0.17 0.04 2 pools, Potential Barrier
D8 PP B 1.8 6.3 0.2 0.04 2 Consecutive pools
E2 PS LWD 0.7 1.5 0.17 0.05 2 pools
E4 PP LWD 1.3 1.2 0.3 0.06 2 pools, Potential Barrier
E6 PP B 1.7 1.1 0.2 0.09 2 pools
E8 PP B 2.0 1.3 0.21 0.06
E10 PP B 0.8 0.8 0.13 0.09
E12 PP B 1.8 1.0 0.25 0.08
E14 PP B 1.3 1.0 0.15 0.05
F2 PP B 1.4 1.1 0.19 0.04
F4 PP B 1.1 6.0 0.15 0.07 3 Consecutive pools
F6 PP B 0.9 7.5 0.26 0.07 2 Consecutive pools
F8 PP Concrete 1.9 27 0.24 0.07 9 Consecutive
micro pools
F10 PP B 2.0 1.1 0.26 0.06
G2 PS R 0.8 2.6 0.16 0.07
G4 PP B/SWD 1.2 0.8 0.18 0.09
G6 PP B 1.2 7.3 0.26 0.08 3 Consecutive pools, Potential
Barrier

Vasa Creek Fish Habitat Assessment
City of Bellevue 10
Table 2. Pool Habitat Units (continued)
Habitat Unit
Habitat Type1/
Pool Code
Pool Width (m)
Pool Length
(m)
Max Pool
Depth (m)
Pool Crest Depth
(m) Notes
G8 PP B 0.6 1.4 0.22 0.09
H2 PP SWD 0.9 0.9 0.14 0.02
H4 PP SWD 1.0 1.1 0.16 0.06
H6 PP SWD 1.1 1.2 0.19 0.03
H8 PP SWD 1.0 0.6 0.13 0.03
I2 PS B 1.6 0.9 0.13 0.01
J2 PS LWD 0.8 1.0 0.15 0.06
J4 PP B/SWD 1.1 1.3 0.16 0.08
J6 PP SWD 1.1 18 0.16 0.05 4 Consecutive pools
J8 PP B 1.0 5.5 0.20 0.04
J10 PP B 2.1 1.7 0.28 0.04
Trib2 PP LWD 2.4 2.0 0.37 0.04 Installed LWD
Trib4 PP LWD 2.3 1.5 0.31 0.06 Installed LWD
Trib6 PP LWD 2.0 1.5 0.35 0.04 Installed LWD
Mean 1.4 2.9 0.21 0.06
SD 0.5 4.8 0.07 0.02 1/ PP‐ Plunge Pool, PS‐ Scour Pool, B‐Boulder, SWD‐Small Woody Debris, LWD‐Large Woody Debris
3.1.2 Channel Dimensions
Channel dimensions, slope, and bearing were measured at major and minor transects. Table 3
contains channel dimensions collected at each transect and summary statistics. Wetted channel
widths at the time of survey ranged from 0.7 meter to 2.0 meters, with a mean of 1.4 meters.
Wetted channel depths ranged from 0.04 meters (4 cm) to 0.10 meters (10 cm), with a mean of
0.06 meter (6 cm). Mean bankfull width and depth are 2.2 meters and 0.33 meter, respectively.
Channel gradient ranged from 1.3 percent in downstream extent to 8 percent, excluding the
steep (>20 percent) gradient barrier at the upstream extent. Additional water depths were taken
as part of the habitat survey and can be found on the field forms in Attachment B.

Vasa Creek Fish Habitat Assessment
City of Bellevue 11
Table 3. Channel Dimensions at Habitat Assessment Transects
Transect
Wetted Width (m)
Wetted Depth
(m)
Bankfull Width (m)
Bankfull Depth
(m) Bar Width
(m)
Percent Slope (ft/ft)
Bearing (degrees)
A 1.5 0.10 2.9 0.4 0 1 270
A’ 1.7 0.04 3.0 -- 0 1 270 B 1.7 0.09 2.5 0.3 0 2 240 B’ 1.1 0.07 1.4 -- 0 2 270 C 1.1 0.05 2.0 0.3 0 3 260 C’ 1.1 0.05 1.6 -- 0 3 270 D 1.1 0.09 2.9 0.35 0 5 280 D’ 1.0 0.06 2.2 -- 0.5 5 270 E 1.6 0.06 1.8 0.3 0 5 305 E’ 1.1 0.08 1.7 -- 0 5 210
F 0.7 0.04 1.1 0.5 0 5 290 F’ 1.8 0.06 1.6 -- 0 5 240 G 2.0 0.04 2.8 0.2 0 5 270 G’ 0.7 0.05 1.2 -- 0 5 300 H 1.0 0.10 1.5 0.4 0 8 270 H’ 1.7 0.08 2.3 -- 0 8 280 I 1.6 0.08 2.5 0.3 0 8 220 I’ 2.0 0.04 3.1 -- 0.5 8 270 J 1.8 0.07 2.5 0.3 0 4 300 J’ 1.1 0.07 4.0 -- 0.6 4 280 K 0.9 0.04 1.4 0.3 0 20 330 Mean 1.4 0.06 2.2 0.33 0.08 4.7 271.2
SD 0.4 0.02 0.8 0.08 0.19 2.1 NA LBTrib 0.9 0.03 1.7 0.3 0 4.7 320
3.1.3 Shading and Riparian Vegetation
The results of the densitometer measurements are representative of overall streamside shading
present along lower Vasa Creek, showing fairly high percentages of shading along the survey
area, with a few exceptions (Table 4).

City of Be
The secti
Sammam
through
backyard
overhang
reflected
(Table 4)
the right
ran up to
shading.
Figure 5
vegetatio
resulting
Table 4.
Transec
A
B
C
D
E
F
G
H
I
J
K
LBTrib
ellevue
ion downstre
mish Parkwa
a residential
d lawns with
ging vegetat
in the resul
. Transect E
bank consis
o the bank ed
and Figure 6
on at Transec
g in 100 perce
. Summary
ct Center
Upstrea
2
17
17
11
12
17
17
15
17
15
17
17
eam of West
ay (Transect
l area and is
h some patch
tion (Figure 4
t of 23 perce
E occurred at
sted of an op
dge, resultin
6 show the d
cts K and B,
ent shading.
y of Densito
r am
CenterLeft Bank
1
17
17
17
14
17
17
15
17
16
17
17
t Lake
A) flows
mostly
hy
4). This is
ent shading
t a bend whe
pen lawn tha
ng in 49 perc
dense riparia
respectively
.
ometer Rea
r Cente
Downstr
0
17
17
15
3
17
17
14
17
13
17
17
ere
at
cent
an
y,
adings
er ream
CenRigBa
4
1
1
14
1
1
1
1
1
1
1
1
Figu
Vasa
nter ght nk
LefBan
4 6
7 17
7 17
4 17
1 15
6 17
7 17
5 17
7 17
5 17
7 16
7 17
ure 4. Vegetat
a Creek Fish H
ft nk
RighBank
10
7 17
7 17
7 14
5 4
7 15
7 17
7 16
7 17
7 17
6 17
7 17
tion at Transe
Habitat Assess
t k
PerceShad
23
100
100
88
49
99
100
92
100
93
100
100
ect A
sment
12
ent ing
3
0
0
8
9
9
0
2
0
3
0
0

City of Be
A summ
is contain
survey ar
which di
transects
present a
Table 5.
Transect-Bank
A-LB
A-RB
B-LB
B-RB
C-LB
C-RB
D-LB
D-RB
E-LB
Figure 5. V
ellevue
ary of veget
ned in Table
rea. At Tran
irectly correl
s with greate
and the cano
. Summary
-
C
Type1/ T
N
N
D
D
M
M
C
D
D
View Upstream
ation type a
e 5. The ripa
nsects A, E, a
lates with th
er shading, s
opy was dom
y of Riparia
Canopy
Big rees2/
SmaTre
0 0
0 0
3 2
3 1
2 1
2 0
2 0
1 0
2 1
m of Transect
nd abundan
arian canopy
and F, ripari
he low percen
uch as Trans
minated by la
an Vegetati
all es Type
D
M
D
D
D
D
D
D
D
K
nce for the ca
y varied by ty
ian canopy w
ntage of sha
sect B, all th
arge trees (T
ion Assessm
Under-can
e1/ Wood
1
2
1
0
2
3
0
1
2
Figure
Vasa
anopy, unde
ype and abu
was either ab
ading in thos
hree layers of
Table 5).
ment
nopy
dy Non-
woody
1
0
2
2
3
3
0
2
1
e 6. Vegetation
a Creek Fish H
er‐canopy, an
undance thro
bsent or min
se areas. Alt
f riparian ve
y Woody
0
0
1
1
2
2
0
0
0
n at Transect
Habitat Assess
nd ground c
oughout the
nimal (Table
ternatively, a
egetation we
Ground
Non-woody B
3
3
2
2
1
1
3
3
3
B
sment
13
cover
e
5),
at
ere
Bare
1
1
2
2
2
1
0
0
1

Vasa Creek Fish Habitat Assessment
City of Bellevue 14
Table 5. Summary of Riparian Vegetation Assessment (continued)
Transect-Bank
Canopy Under-canopy Ground
Type1/ Big
Trees2/ Small Trees Type1/ Woody
Non-woody Woody
Non-woody Bare
E-RB N 0 0 N 0 0 0 3 2
F-LB N 0 1 D 2 3 3 0 0
F-RB N 0 0 N 0 2 0 3 0
G-LB M 3 2 D 2 3 2 1 2
G-RB N 0 0 D 2 1 1 1 2
H-LB M 2 1 D 1 1 1 2 2
H-RB M 2 1 D 1 1 2 3 1
I-LB M 3 1 D 3 2 1 2 2
I-RB M 3 2 D 3 2 2 2 2
J-LB M 2 0 D 3 1 2 1 2
J-RB D 2 1 D 3 1 2 1 2
K-LB D 3 1 D 1 1 2 1 2
K-RB M 3 0 D 3 1 2 1 2
LBTrib-LB C 3 2 D 1 2 2 1 2
LBTrib-RB D 3 2 D 2 1 2 1 2 1/ D=Deciduous, C=Conifer, M=Mixed, and N=None. 0=Absent, 1=Sparse (<10%), 2=Moderate (10‐40%), 3=Heavy (40‐
75%) and 4=Very Heavy (>75%). 2/ Big trees are defined as greater than 5 meters in height.
3.1.4 Fish Cover and LWD
Fish cover is limited throughout the survey area with most resulting from in‐stream boulders
and overhanging vegetation. All of the transects were documented as having some fish cover,
mostly documented as sparse or moderate (Table 6). Three transects were noted as having
“heavy” (40‐75%) fish cover of some type, Transects E, G, and K, and none were documented as
having “very heavy” (>75%) fish cover of any type (Table 6). Table 6 summarizes the
abundance of fish cover by type for each of the major transects.
Table 6. Summary of Fish Cover
Transect Algae Macrophytes/
Bryophytes Woody Debris Brush
Overhanging Veg
Undercut Banks
Boulders Ledges
Artificial Structures
A 0 1/0 0 0 0 0 2 1
B 0 0/0 1 1 1 0 0 1
C 0 0/0 0 0 2 0 0 0
D 0 0/0 0 0 1 0 0 0
E 0 0/0 0 0 2 0 3 3

Vasa Creek Fish Habitat Assessment
City of Bellevue 15
Table 6. Summary of Fish Cover (continued)
Transect Algae Macrophytes/
Bryophytes Woody Debris Brush
Overhanging Veg
Undercut Banks
Boulders Ledges
Artificial Structures
F 0 0/0 0 1 2 0 2 0
G 0 0/0 0 0 2 1 0 3
H 0 0/0 1 0 1 1 2 0
I 0 0/1 2 0 2 1 1 0
J 0 0/0 2 1 2 0 1 0
K 0 0/3 1 0 2 0 3 0
LB Trib 0 0/0 1 1 2 0 2 0 Scale: 0=Absent, 1=Sparse (<10%), 2=Moderate (10‐40%), 3=Heavy (40‐75%), and 4=Very Heavy (>75%)
The quantity of LWD (diameter greater than 0.1 meter and length greater than 2 meters) in the
survey area is also limited. Some LWD was found in all segments, with the exception of F‐G,
where no LWD was documented (Table 7). The smaller pieces of wood were more abundant
and did function in the channel to form steps and scour pools. Table 7 includes LWD quantities
for stream segments between the major transects.
Table 7. Summary of Large Woody Debris Inventory
Segment
Log Dimensions (length / diameter)
2-5 (m) / 0.1-0.3 (m)
2-5 (m) / 0.3-0.6 (m)
5-15 (m) / 0.1-0.3 (m)
5-15 (m) / 0.3-0.6 (m)
A-B 1 0 0 0
B-C 1 1 0 0
C-D 0 2 0 0
D-E 1 1 0 0
E-F 3 0 0 0
F-G 0 0 0 0
G-H 0 0 1 0
H-I 2 0 1 2
I-J 1 1 2 0
J-K 2 0 1 1
K 0 0 1 0
LBTrib 0 4 0 0
3.1.5 Substrate Size and Embeddedness
Channel substrates in the survey area ranged from fines to cobbles with the most common
dominate substrate type being fine gravel. Boulders placed along the channel for bank
protection and within the channel for grade control are common. Table 8 contains the dominant
and sub‐dominant substrate types, as well as embeddedness for each of the major and minor

Vasa Creek Fish Habitat Assessment
City of Bellevue 16
transects. The field data taken from the substrate cross‐sections can be found on the field forms
in Attachment B.
Table 8. Summary of Substrate Size and Embeddedness
Transect Dominant Substrate
Dominant (%)
Sub-Dominant Substrate
Sub-Dominant
(%)
Mean Embeddedness
(%) A GF 46 SA 36 56
A’ GF 46 GC 36 --
B GF 64 GC 27 30
B’ CB 36 SA 27 --
C GF 82 FN 18 26
C’ GF 36 CB 27 --
D GF 36 FN 27 57
D’ GF 55 GC 27 --
E BL 36 GC 36 40
E’ GF 45 SA 36 --
F GF 45 SA 18 66
F’ GC 55 GF 27 --
G GF 36 GC 18 61
G’ GC 82 BL 2 --
H CB 45 SA 36 53
H’ GF 55 GC 18 --
I GF 36 GC 27 56
I’ GC 45 GF 18 --
J CB 27 GC 27 37
J’ SA 55 GC 27 --
K SA 73 CB 9 84
LBTrib SA 73 GC 18 78
BL=Boulder, CB=Cobble, GC=Gravel Coarse, GF=Gravel Fine, SA=Sand, FN=Fines, HP=Hardpan
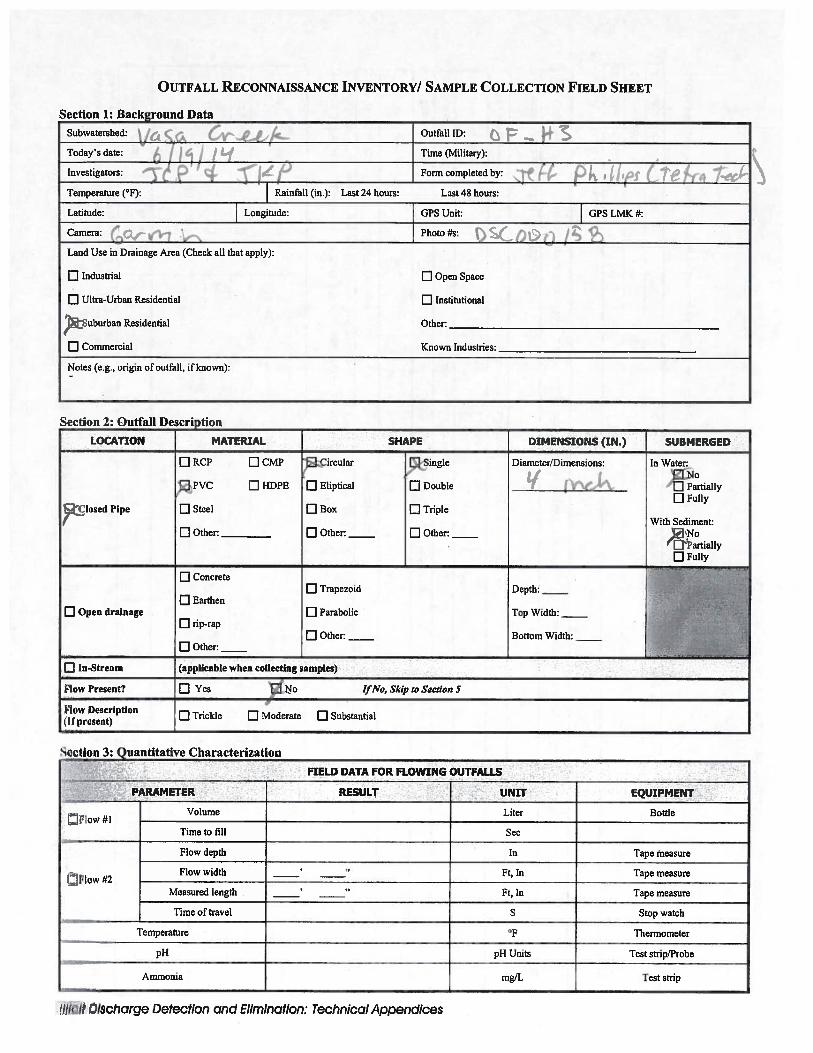
3.2 Outfall Reconnaissance Inventory
During the habitat assessment, the location of additional previously unobserved outfalls was
documented and Outfall Reconnaissance Inventory/Sample Collection Filed Forms completed.
The completed Outfall Reconnaissance Inventory/Sample Collection Filed Forms are included
as Attachment C.
Three additional outfalls were inventoried during the habitat assessment, which were dry at the
time of survey. These were added to the eighteen outfalls detected during the landslide
assessment, for a total of twenty‐one out falls recorded on the surveyed portions of Vasa Creek.

Vasa Creek Fish Habitat Assessment
City of Bellevue 17
Table 9 contains a summary of the data collected at the outfall reconnaissance inventory sites.
The locations of the outfalls inventoried are shown on Figures 2 and 3 in Attachment A.
Table 9. Outfall Reconnaissance Inventory
ID# Reach Material Diameter (inches) Flow Notes about Discharge
OF-H1 F-G PVC 4in None None OF-H2 F-G Concrete 8in None None OF-H3 F-G PVC 4in None None
4. Macroinvertebrate Samples
In 2011, macroinvertebrate samples were collected from Vasa Creek and delivered to Rithron
and Associates for assessment (Rithron 2011). Analysis indicated that the B‐IBI (Benthic
Inventory of Biotic Integrity) site score was 24, typically a “poor” rating, however the RIVPACS
(River Invertebrate Prediction and Classification System) result was 0.81, indicating unimpaired
conditions. The B‐IBI is a method of evaluating stream health by looking at the local
macroinvertebrate community across ten metrics. Each metric is given a score of 5, 3 or 1,
where 5 is little to no degradation, 3 is moderate degradation and 1 is serious degradation.
These ten metrics are summed together creating a score ranging from 10 to 50. The RIVPACS is
a statistical model that uses macroinvertebrate communities to evaluate stream conditions.
The analysis also revealed the presence of sensitive taxa, indicating decent water quality
conditions. The overall species composition indicated a preference towards to cool water
temperatures, while the cold stenotherm taxa (only lives in water less than 10 degrees Celsius)
were not present in substantial numbers. Stoneflies were found to be common, which suggests
the availability of coarse organic matter and that the macroinvertebrate community is not
adversely affected by sediment deposition. Overall, taxa richness was high, with proportions
that are typically appropriate for a lowland stream that ultimately feeds into the Puget Sound.
The summary results from this sampling effort are included as Attachment F, and the full report
is available from the City of Bellevue (Rithron 2011).
5. Electrofishing
A fish survey was conducted in July 2014 by the City of Bellevue to assess status and trends of
resident populations of fish in Vasa Creek and identify resident species diversity and size
classes (City of Bellevue 2014). Electrofishing was conducted along 151 feet of Vasa Creek at
approximately river mile 0.38 using a backpack electrofishing unit. A total of 86 cutthroat trout
were captured during this effort and no other fish species were found. Almost 92 percent of the

Vasa Creek Fish Habitat Assessment
City of Bellevue 18
fish captured were less than 80 mm, with only 8 percent being between 80 mm and 150 mm. A
description of the methods used and the data from this effort are included as Attachment E.
6. Discussion and Recommendations
During the habitat assessment, habitat metrics were collected to create a baseline data set with
which to describe the current conditions of lower Vasa Creek. These data were summarized
and presented in the above sections of this report, and the field data are contained in
Attachment B. The field data can be used for additional analysis and comparison with other
spawning tributaries to Lake Sammamish, and in support of future surveys on Vasa Creek.
These field observations were also used to develop the recommendations included in this
section.
Habitat conditions appear adequate for kokanee spawning (similar to existing Lake
Sammamish tributaries where active spawning occurs). Yet, anecdotal evidence of kokanee
usage of Vasa Creek is limited to downstream of the West Lake Sammamish Drive crossing
(WDFW 2009). Immediately upstream of the crossing is a forested corridor, where casual
observation may have been limited in the past. The 2008/2009 Lake Sammamish Late‐Run
Kokanee Survey and Summary report indicated that Vasa Creek was spot‐checked (time
permitting) three times during the standard run‐timing for late‐run kokanee (mid‐November
2008 to the end of January 2009) (WDFW 2009). No live or dead kokanee were detected during
these spot checks. Additionally, the escapement at the primary spawning streams during this
same timeframe was nearly nonexistent when compared to other years (Figure 7).
Overall, conditions in Vasa Creek are adequate for kokanee spawning throughout the survey
area. The active channel width, depth, and sediment composition are similar to that found in
the three major kokanee spawning creeks that flow into Lake Sammamish: Ebright, Laughing
Jacobs, and Lewis Creeks. Despite having a “poor” rating from the Benthic Inventory of Biotic
Integrity index, the rest of the macroinvertebrate assessment indicates relatively unimpaired
conditions.
The lowest portion of Vasa Creek, downstream of West Lake Sammamish Parkway, exhibits the
most human impact with a heavily confined channel and armored stream banks surrounded by
managed residential lawns. Additionally, that area was limited in fish cover, pool habitat, and
LWD. Upstream of West Lake Sammamish Parkway there is more established riparian
vegetation, although some intermittent residential lawns still occur within the riparian area, and
other habitat elements are more diverse and abundant.

City of Be
Although
several p
height re
two feet (
None of t
depth cri
heights w
part of th
the follow
as being
upstream
unfavora
and G6.
For exam
the limite
mostly fu
current p
Figure 7.2013)
ellevue
h a fish pass
potential fish
commended
(0.6 meter) (F
the plunge p
iteria of 0.6 m
were not spec
he methods u
wing plunge
potential pa
m adult koka
able jump he
mple, the plu
ed flow and
ull of fines an
pool depth is
. AUC Escape
sage barrier a
h passage ba
d for adult ko
FHW 2007).
pools docum
meter. Altho
cifically mea
used during
e pools were
assage barrie
anee movem
eights: D2, D
unge pool at
the resultin
nd sand (Fig
s shallow (0.
ement Estimat
assessment w
rriers identi
okanee is six
mented within
ough jump
asured as
this survey,
e observed
ers to
ment due to
D4, D6, E4,
D4 splits
ng pool is
gure 8). The
17 meter)
tes for the Fou
was not cond
fied during
x inches, with
n the survey
e Figure Grade
ur Primary K
Vasa
ducted as pa
field survey
h a minimum
area met the
8. Split PlunControl
Kokanee Spawn
a Creek Fish H
art of this su
ys. The maxi
m approach p
e minimum
ge Pool D4 fro
ning Tributar
Habitat Assess
urvey, there
imum jump
pool depth o
approach po
om Construct
ries (LSKWG
sment
19
were
of
ool
ted

Vasa Creek Fish Habitat Assessment
City of Bellevue 20
and does not have sufficient depth for adult kokanee to attempt jumping upstream over the
structure. Fish passage conditions may improve at higher flows.
There were also culverts that have been identified as partial fish passage barriers in the survey
area. There were five culverts in the WDFW FPDSI database in the survey area (ID# 930484,
930485, 930486, 930487, and 930488). Two of these culverts were assessed as partial barriers;
one culvert (930488) on private ownership near the mouth (Figure A‐1 ) and the other culvert
(930484) on City of Bellevue ownership under 163rd Avenue SE (Figure A‐2) (WDFW, 2014).
The following recommendations are based on the findings of the fish habitat assessment and a
review of existing data:
Incorporate Vasa Creek into the late‐run Lake Sammamish kokanee spawner surveys to
develop baseline data prior to any restoration actions and to establish the upstream
extent of kokanee access and redds. If possible, spawner surveys should cover the entire
length of habitat surveyed (approximately 1,270 meters). However, if there are no
kokanee or redds observed from the mouth to the second partial barrier culvert at 163rd
Avenue SE (670 meters), surveys could be concluded.
Conduct additional surveys of near‐shore Lake Sammamish to detect littoral spawning
activity by kokanee.
Conduct a more thorough fish passage assessment including the two partial barrier
culverts and other potential passage barriers identified during this assessment.
Identify the factors limiting productivity in Vasa Creek and develop restoration
alternatives to improve kokanee habitat.
Overall, the existing data coupled with the information gathered through this assessment
indicate that habitat in the lower portion of Vasa Creek may be suitable to support kokanee.
However, additional information regarding current use of Vasa Creek and nearshore Lake
Sammamish by spawning kokanee, as well as any fish passage barriers or other limiting factors
that kokanee may encounter in Vasa Creek would be helpful in better understanding the
potential. This additional information would also help to focus restoration efforts within the
Vasa Creek Watershed to implement the most effective projects to support kokanee.
7. References
Britton, A.C. 2013. Vasa Creek Channel Conditions and Slope Stability, Bellevue, Washington.
Master’s Thesis, Department of Earth and Space Sciences: Applied Geosciences,
University of Washington, Seattle, Washington. MESSAGe Technical Report Number:
005.
Vasa Creek Fish Habitat Assessment
City of Bellevue 21
City of Bellevue. 2009. Vasa Creek Basin, Lake Washington Watershed (WRIA 8). State Stream
#08‐0156 Fact Sheet. City of Bellevue, Bellevue, WA.
City of Bellevue. 2014. Vasa Creek 2014 Summer Electrofishing Study. City of Bellevue,
Bellevue, WA.
Connor, E., B. Kvam, and L. Mighetto. 2000. Historic and current status of kokanee in the Lake
Washington Basin (Discussion Draft). Prepared for King County Department of Natural
Resources, Seattle, WA, by R2 Resource Consultants, Inc. with historical research by
Historical Research Associates, Inc.
FHA (Federal Highway Administration). 2007. Design for Fish Passage at Roadway‐Stream
Crossings: Synthesis Report. Federal Highway Administration Publication No. FHWA‐
HIF‐07‐033. McLean, Virginia. June 2007.
LSKTWG (Lake Sammamish Kokanee Technical Work Group). 2013. Conservation
Supplementation Plan for Lake Sammamish Late‐run (winter‐run) Kokanee. Lake
Sammamish Kokanee Technical Work Group.
Rithron. 2011. Aquatic Invertebrate Assemblages and Biological Assessment of Stream Sites in
the City of Bellevue, Washington: 2011. Wease Bollman Rhithron Associates, Inc. p. 12‐
13.
Tetra Tech. 2014. Vasa Creek Landslide Inventory and Slope Stability Reconnaissance.
Prepared for the City of Bellevue, Bellevue, WA.
WADOE (Washington Department of Ecology). 1999. Status and Trends Monitoring for
Watershed Health & Salmon Recovery: Field Data Collection Protocol.
WADOE (Washington Department of Ecology). 2006. Status and Trends Monitoring for
Watershed Health & Salmon Recovery: Quality Assurance Monitoring Plan.
WDFW (Washington Department of Fish and Wildlife). 2014. WDFW website: Fish Passage
Program. http://wdfw.wa.gov/conservation/habitat/fish_passage/data_maps.html
WDFW. 2011. Lake Sammamish Late‐Run Kokanee 2010‐2011 Spawning Ground Survey
Summary and Escapement Estimate.
WDFW . 2009. 2008/2009 Lake Sammamish Late‐Run Kokanee Survey and Escapement
Summary.

Vasa Creek Fish Habitat Assessment
City of Bellevue
ATTACHMENT A
MAPS

!(
!(
!(!(
!@
öõ
öõ
öõöõöõöõöõöõ
öõ
öõ
öõöõöõ !(
!(
!.
!.
!.
!.
!.
!.
!.
!.
!.
!.
!.
!.
!.
!.
!.
!.
!.
!.
!.
!.
!.
!.
!.
!.
!.
!. !.
!.
!.
WLa
keS
amm
amis
hP
kwy
SE
SE 35th St
Vasa CreekB6 B2OF-H1C
B
A
LBTribC6 C4C2
B8 B4
A4
A2
B12B10
Trib6
Trib4
Trib2
930488
930487
¯R:\Projects_2014\Vasa_Creek\maps\Habitat\Figure2_Transects_Mapbook.mxd
0 100 20050Feet
Figure A-1Habitat Assessment Transects and Outfalls
¯
LakeSammamish
Vasa Creek
Map Detail Location
!@ Outfall
!( Habitat Assessment Transect
Habitat Assessment Reach
§̈¦90
!( Fast Non-Turbulent Habitat Unit
Pool Habitat Unitöõ
Access Denied Parcel
WDFW Culvert Inventory!.
!(!(
!(!(
!(
!(
!(
!@!@
öõöõ
öõ
öõ
öõöõöõöõ
öõöõöõöõ
öõöõöõ
öõöõöõöõöõöõ
öõ
öõ
öõ
öõ
öõöõ
öõöõ
!.
!.
!.
!.
!.
!.
!.
!.
!.
!.
!.
!.
!.
!.
!.
!.
!.
!.
!.
!.
!.
!.
!.
!.
!.
!. !.
!.
!.
SE 35th St
164th Pl SE
Vasa Creek
OF-H3 OF-H2
H
G
F
E DLBTrib
H6 H4 H2 G8
G6
G4G2
F8
F6 F4 F2 E8E6 E4 E2 D8 D6 D4
D2 C8 C6 C4
E14 E12 E10
Trib6
Trib4
Trib2930485
930484
930486
¯R:\Projects_2014\Vasa_Creek\maps\Habitat\Figure2_Transects_Mapbook.mxd
0 100 20050Feet
Figure A-2Habitat Assessment Transects and Outfalls
¯
LakeSammamish
Vasa Creek
Map Detail Location
!@ Outfall
!( Habitat Assessment Transect
Habitat Assessment Reach
§̈¦90
!( Fast Non-Turbulent Habitat Unit
Pool Habitat Unitöõ
Access Denied Parcel
WDFW Culvert Inventory!.

!(
!(!(
!(
öõ
öõ
öõöõ
öõöõ
öõ
öõ
öõöõöõ
!(
!.
!.
!.
!.
!.
!.
!.
!.
!.
!.
!.
!.
!.
!.
!.
!.
!.
!.
!.
!.
!.
!.
!.
!.
!.
!.
!.
!.
!.
!.
!.
!. !.
!. !.
!.
!.
!.
!.
!.
§̈¦90
Vasa Creek
SE 35th Pl
I4K
J I
HJ8J6
J2
I2
H6 H4 H2 G8
G6
J10930484
¯R:\Projects_2014\Vasa_Creek\maps\Habitat\Figure2_Transects_Mapbook.mxd
0 100 20050Feet
Figure A-3Habitat Assessment Transects and Outfalls
¯
LakeSammamish
Vasa Creek
Map Detail Location
!@ Outfall
!( Habitat Assessment Transect
Habitat Assessment Reach
§̈¦90
!( Fast Non-Turbulent Habitat Unit
Pool Habitat Unitöõ
Access Denied Parcel
WDFW Culvert Inventory!.

Vasa Creek Fish Habitat Assessment
City of Bellevue
ATTACHMENT B
HABITAT ASSESSMENT FIELD FORMS


Vasa Creek Fish Habitat Assessment
City of Bellevue
ATTACHMENT C
LOWER VASA OUTFALL RECONNAISSANCE INVENTORY/SAMPLE COLLECTION FIELD FORMS


Vasa Creek Fish Habitat Assessment
City of Bellevue
ATTACHMENT D
DIGITAL DELIVERABLES (PROVIDED SEPARATELY)

Vasa Creek Fish Habitat Assessment
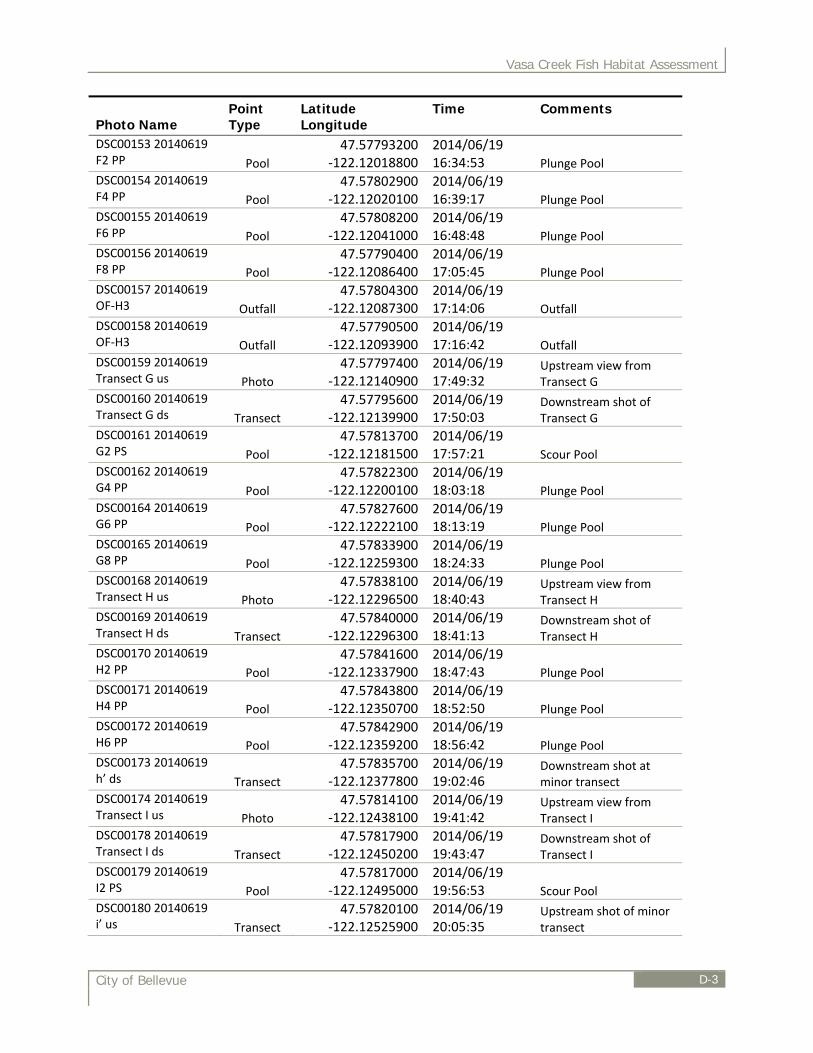
City of Bellevue D-1
Attachment D contains a summary of digital data that will be delivered separately including: 1)
GPS point locations and associated digital photographs, and 2) a list of the GIS data that will be
included the project geodatabase.
1) Photolog of Digital Photographs
Photo Name Point Type
Latitude Longitude
Time Comments
DSC00109 20140618 Transect A us Photo
47.57852500 ‐122.11260800
2014/06/18 17:20:49
Upstream view from Transect A
DSC00110 20140618 Transect A ds Transect
47.57855200 ‐122.11261500
2014/06/18 17:22:30
Downstream shot of Transect A
DSC00111 20140618 A2 PS Pool
47.57851300‐122.11292600
2014/06/18 17:30:16 Plunge Pool
DSC00112 20140618 a’ and crossing Transect
47.57843000‐122.11310300
2014/06/18 17:37:05
Upstream shot of minor transect looking at road crossing
DSC00113 20140618 Transect B us Photo
47.57839600‐122.11335900
2014/06/18 17:50:55
Upstream view fromTransect B
DSC00114 20140618 Transect B ds Transect
47.57800700‐122.11526300
2014/06/18 18:19:38
Downstream shot of Transect B
DSC00118 20140618 B4 PP Pool
47.57804300‐122.11585400
2014/06/18 18:38:51 Plunge Pool
DSC00119 20140618 B8 and b’ us Transect
47.57799600‐122.11600500
2014/06/18 18:57:11
Upstream shot of minor transect
DSC00120 20140618 OF‐H1 Outfall
47.57810300‐122.11608400
2014/06/18 19:03:32 Outfall
DSC00121 20140618 B10 PS Pool
47.57805500‐122.11614100
2014/06/18 19:09:29 Scour Pool
DSC00122 20140618 B12 PS Pool
47.57814800‐122.11639900
2014/06/18 19:17:49 Scour Pool
DSC00123 20140618 Transect C us Photo
47.57808100‐122.11675700
2014/06/18 19:29:24
Upstream view from Transect C
DSC00124 20140618 Transect C ds Transect
47.57821400‐122.11667200
2014/06/18 19:30:34
Downstream shot of Transect C
DSC00125 20140618 C2 PS Pool
47.57807800‐122.11676200
2014/06/18 19:41:41 Scour Pool
DSC00126 20140618 Transect LB Trib us and LBT2 PP Photo
47.57801300‐122.11721300
2014/06/18 20:10:00
Upstream view from Transect LBTrib
DSC00127 20140618 Transect LB Trib ds Transect
47.57805200‐122.11722500
2014/06/18 20:10:34
Downstream shot of Transect LBTrib
DSC00128 20140618 LBT 4 PP Pool
47.57807700‐122.11711000
2014/06/18 20:24:21 Plunge Pool
DSC00129 20140618 LBT 6 PP Pool
47.57829000‐122.11716500
2014/06/18 20:31:08 Plunge Pool

Vasa Creek Fish Habitat Assessment
City of Bellevue D-2
Photo Name Point Type
Latitude Longitude
Time Comments
DSC00130 20140618 LBTrib input at road Photo
47.57847300‐122.11719100
2014/06/18 20:38:55 Culvert on LB trib
DSC00131 20140618 LBTrib roadside ditch on 35th Photo
47.57854800‐122.11765700
2014/06/18 20:40:32
Roadside ditch line on LB trib
DSC00132 20140618 C4 PP Pool
47.57807900‐122.11729500
2014/06/18 21:12:56 Plunge Pool
DSC00133 20140618 C6 PP Pool
47.57810900‐122.11736100
2014/06/18 21:22:08 Plunge Pool
DSC00134 20140618 C8 PP Pool
47.57806000‐122.11787200
2014/06/18 21:34:47 Plunge Pool
DSC00135 20140618 Transect D us Photo
47.57804300‐122.11792600
2014/06/18 21:46:28
Upstream view from Transect D
DSC00136 20140618 Transect D ds Transect
47.57805000‐122.11796100
2014/06/18 21:47:04
Downstream shot of Transect D
DSC00137 20140618 D2 PP Pool
47.57808500‐122.11802400
2014/06/18 21:51:26 Plunge Pool
DSC00138 20140618 D4 PP Pool
47.57807100‐122.11836500
2014/06/18 22:02:28 Plunge Pool
DSC00139 20140618 D6 PP Pool
47.57806200‐122.11855700
2014/06/18 22:14:16 Plunge Pool
DSC00140 20140618 D8 PP Pool
47.57815800‐122.11884900
2014/06/18 22:24:15 Plunge Pool
DSC00141 20140618 Transect E us Photo
47.57800500‐122.11891800
2014/06/18 22:49:31
Upstream view from Transect E
DSC00142 20140618 Transect E ds Transect
47.57799000‐122.11893600
2014/06/18 22:50:12
Downstream shot of Transect E
DSC00143 20140618 E2 PS Pool
47.57804300‐122.11919600
2014/06/18 22:57:18 Scour Pool
DSC00144 20140618 E4 PP Pool
47.57811500‐122.11936900
2014/06/18 23:06:07 Plunge Pool
DSC00145 20140618 E6 PP Pool
47.57800500‐122.11952800
2014/06/18 23:12:12 Plunge Pool
DSC00146 20140618 E8 PP Pool
47.57808700‐122.11963100
2014/06/18 23:21:54 Plunge Pool
DSC00147 20140618 E10 PP Pool
47.57811900‐122.11976600
2014/06/18 23:27:56 Plunge Pool
DSC00148 20140618 E12 PP Pool ‐‐ ‐‐
Plunge Pool
DSC00150 20140618 E14 PP Pool
47.57807100 ‐122.11992500
2014/06/18 23:40:09 Plunge Pool
DSC00151 20140619 Transect F us Photo
47.57798600‐122.12004200
2014/06/19 16:29:50
Upstream view from Transect F
DSC00152 20140619 Transect F ds Transect
47.57800900‐122.12001300
2014/06/19 16:30:22
Downstream shot of Transect F
Vasa Creek Fish Habitat Assessment
City of Bellevue D-3
Photo Name Point Type
Latitude Longitude
Time Comments
DSC00153 20140619 F2 PP Pool
47.57793200‐122.12018800
2014/06/19 16:34:53 Plunge Pool
DSC00154 20140619 F4 PP Pool
47.57802900‐122.12020100
2014/06/19 16:39:17 Plunge Pool
DSC00155 20140619 F6 PP Pool
47.57808200‐122.12041000
2014/06/19 16:48:48 Plunge Pool
DSC00156 20140619 F8 PP Pool
47.57790400‐122.12086400
2014/06/19 17:05:45 Plunge Pool
DSC00157 20140619 OF‐H3 Outfall
47.57804300‐122.12087300
2014/06/19 17:14:06 Outfall
DSC00158 20140619 OF‐H3 Outfall
47.57790500‐122.12093900
2014/06/19 17:16:42 Outfall
DSC00159 20140619 Transect G us Photo
47.57797400‐122.12140900
2014/06/19 17:49:32
Upstream view from Transect G
DSC00160 20140619 Transect G ds Transect
47.57795600‐122.12139900
2014/06/19 17:50:03
Downstream shot of Transect G
DSC00161 20140619 G2 PS Pool
47.57813700 ‐122.12181500
2014/06/19 17:57:21 Scour Pool
DSC00162 20140619 G4 PP Pool
47.57822300‐122.12200100
2014/06/19 18:03:18 Plunge Pool
DSC00164 20140619 G6 PP Pool
47.57827600‐122.12222100
2014/06/19 18:13:19 Plunge Pool
DSC00165 20140619 G8 PP Pool
47.57833900‐122.12259300
2014/06/19 18:24:33 Plunge Pool
DSC00168 20140619 Transect H us Photo
47.57838100‐122.12296500
2014/06/19 18:40:43
Upstream view from Transect H
DSC00169 20140619 Transect H ds Transect
47.57840000‐122.12296300
2014/06/19 18:41:13
Downstream shot of Transect H
DSC00170 20140619 H2 PP Pool
47.57841600‐122.12337900
2014/06/19 18:47:43 Plunge Pool
DSC00171 20140619 H4 PP Pool
47.57843800‐122.12350700
2014/06/19 18:52:50 Plunge Pool
DSC00172 20140619 H6 PP Pool
47.57842900‐122.12359200
2014/06/19 18:56:42 Plunge Pool
DSC00173 20140619 h’ ds Transect
47.57835700‐122.12377800
2014/06/19 19:02:46
Downstream shot at minor transect
DSC00174 20140619 Transect I us Photo
47.57814100‐122.12438100
2014/06/19 19:41:42
Upstream view from Transect I
DSC00178 20140619 Transect I ds Transect
47.57817900‐122.12450200
2014/06/19 19:43:47
Downstream shot of Transect I
DSC00179 20140619 I2 PS Pool
47.57817000‐122.12495000
2014/06/19 19:56:53 Scour Pool
DSC00180 20140619 i’ us Transect
47.57820100‐122.12525900
2014/06/19 20:05:35
Upstream shot of minor transect

Vasa Creek Fish Habitat Assessment
City of Bellevue D-4
Photo Name Point Type
Latitude Longitude
Time Comments
DSC00181 20140619 Transect J us Photo
47.57816800 ‐122.12599300
2014/06/19 20:40:38
Upstream view from Transect J
DSC00182 20140619 Transect J ds Transect
47.57822400 ‐122.12593100
2014/06/19 20:41:17
Downstream shot of Transect J
DSC00183 20140619 J2 PS Pool
47.57838700‐122.12604500
2014/06/19 20:47:03 Scour Pool
DSC00184 20140619 J4 PP Pool ‐‐ ‐‐
Plunge Pool
DSC00185 20140619 J6 PP Pool
47.57831400‐122.12641500
2014/06/19 20:58:43 Plunge Pool
DSC00186 20140619 j’ us Transect
47.57829600‐122.12653900
2014/06/19 21:06:15
Upstream shot at minor transect
DSC00189 20140619 J8 PP Pool
47.57830300‐122.12668100
2014/06/19 21:14:24 Plunge Pool
DSC00190 20140619 J10 PP Pool
47.57832000‐122.12697100
2014/06/19 21:21:11 Plunge Pool
DSC00191 20140619 Transect K us Photo
47.57832500‐122.12694400
2014/06/19 21:33:44
Upstream view from Transect K
DSC00192 20140619 Transect K ds Transect
47.57834200‐122.12685400
2014/06/19 21:34:37
Downstream shot of Transect K

Vasa Creek Fish Habitat Assessment
City of Bellevue D-5
2) Geodatabase Structure:

Vasa Creek Fish Habitat Assessment
City of Bellevue
ATTACHMENT E
2014 VASA CREEK ELECTRO-FISHING SUMMARY REPORT

City of Bellevue E-1
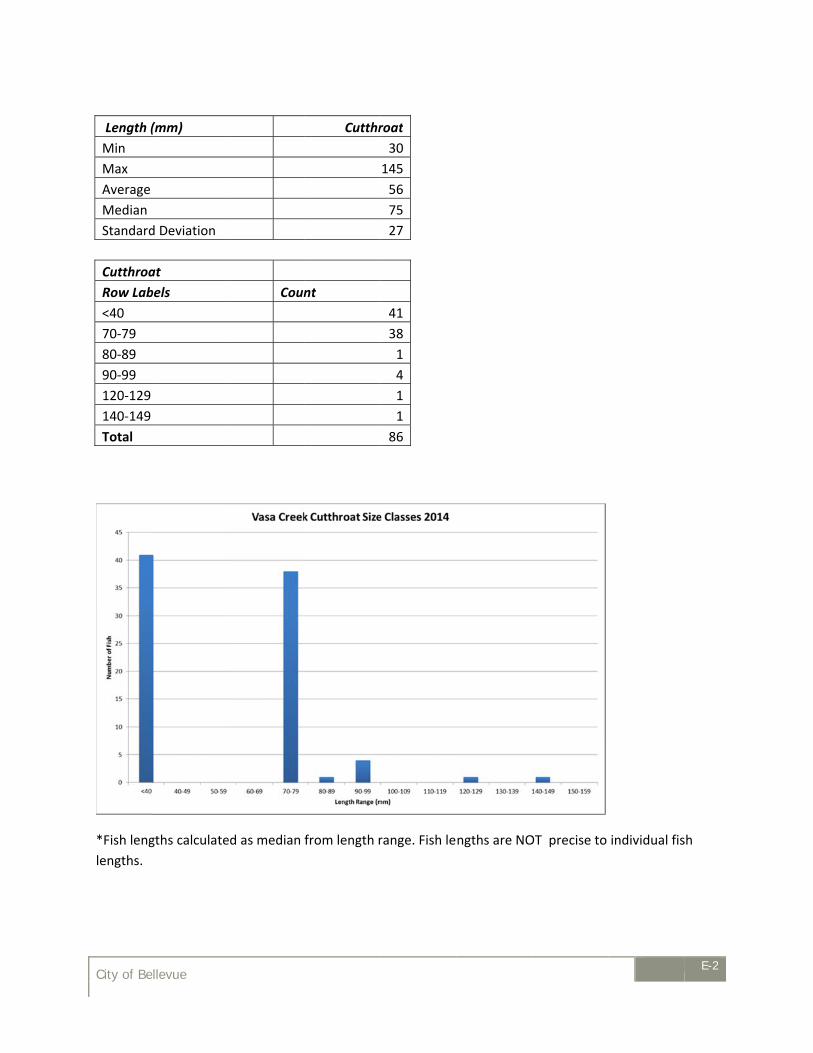
Vasa Creek 2014 Summer Electrofishing Study On July 9, 2014, summer fish sampling was conducted on a 151 foot reach of Vasa Creek starting at approximately river mile 0.38. This was the first sample for status and trends of resident fish populations at a macroinvertebrate monitoring location. The purpose of the sampling was to determine fish species diversity and size classes of resident fish. The reach was 100% shallow riffle, so aquatic habitat was limited. The only fish observed were cutthroat trout, the majority (95%) were less than 80 mm in length. Only two fish were likely older than young‐of‐the‐year. Two large stoneflies and three crayfish were also captured.
Methods Methods of sampling in 2014 were consistent with previous efforts by the City. Electrofishing was
conducted using a Smith‐Root Backpack Electrofisher Model 12b. Settings on the electrofishing
equipment for Vasa Creek were most effective at 200 volts (v), 40 Hertz (Hz), and 6 milliseconds (ms).
Block nets were placed at the bottom and top of the reach and a single pass was made with the
electrofisher. One person utilized the electrofishing backpack and two people with long‐handled dip
nets followed closely alongside to capture stunned fish. Two netters were used throughout each reach.
Netters were consistently swapped out and the team was comprised of at least one experienced netter
and usually one inexperienced netter. Team members followed the electrofishing team with buckets of
fresh stream water. Fish were tracked by habitat type (riffle or pool) and captured fish were placed in
corresponding buckets. Captured fish were temporarily anesthetized on site using a dilute solution of
MS‐222 (Tricaine methanesulfonate) in water for identification and fork length measurements. Fish
were then placed in fresh stream water supplied with an aerator until fully recovered. Once recovered,
they were released on the outside of block nets so they would not be counted twice. Fish were
captured as authorized under a Washington State Scientific Collection Permit.
Results Species Total Percent of Total
Cutthroat 86 95%
Crayfish 3 3%
Stonefly 2 2%
Total organisms 91 100.0%
Total Percent of Total
Size (cutthroat)
<80mm 79 91.9%
80‐150 mm 7 8.1%
>150 mm 0 0.0%
Total 86 100.0%
City of Be
Length (
Min
Max
Average
Median
Standard
Cutthroa
Row Lab
<40
70‐79
80‐89
90‐99
120‐129
140‐149
Total
*Fish leng
lengths.
ellevue
(mm)
d Deviation
at
bels
gths calculate
Coun
ed as median
Cutthr
nt
from length r
roat
30
145
56
75
27
41
38
1
4
1
1
86
range. Fish lengths are NO
OT precise to
individual fis
E-2
sh

City of Bellevue E-3
Date: 7/9/2014
Stream: Vasa Creek
River Mile: 0.38
Latitude: 47.57
Longitude: ‐122.12
Visibility: Clear
Water: 14.8 °C
Total Reach Length: 151 ft.
Pool Length: N/A
Riffle Length: 151 ft
Wetted Width: 3.0‐4.5 ft.
Wetted Depth 2‐2.5 inches
Bank Full Width: 5.9 ft.
Electrofishing Setting: 200 v, 50 Hz, 6 mS
Start Time 0.36458
End Time 0.4375
Netter Success: Moderate‐High
Sampling done by: Kit Paulsen (employee ‐ fish ID)
Jim Starkes (consultant‐electrofishing)
Laurie Devereaux (employee)
Zane Beall (intern)
Volunteers: Jim McRoberts, Donna Oliver, Betty Peltzer, Christina Green
Fish # Species Length (mm) Habitat Type Length Range
1 Cutthroat 75 Riffle 70‐79
2 Cutthroat 75 Riffle 70‐79
3 Cutthroat 95 Riffle 90‐99
4 Cutthroat 75 Riffle 70‐79
5 Cutthroat 75 Riffle 70‐79
6 Cutthroat 75 Riffle 70‐79
7 Cutthroat 75 Riffle 70‐79
8 Cutthroat 85 Riffle 80‐89
9 Cutthroat 75 Riffle 70‐79
10 Cutthroat 30 Riffle <40
11 Cutthroat 30 Riffle <40
12 Cutthroat 30 Riffle <40
13 Cutthroat 30 Riffle <40
14 Cutthroat 30 Riffle <40

City of Bellevue E-4
Fish # Species Length (mm) Habitat Type Length Range
15 Cutthroat 30 Riffle <40
16 Cutthroat 30 Riffle <40
17 Cutthroat 75 Riffle 70‐79
18 Cutthroat 75 Riffle 70‐79
19 Cutthroat 75 Riffle 70‐79
20 Cutthroat 75 Riffle 70‐79
21 Cutthroat 75 Riffle 70‐79
22 Cutthroat 30 Riffle <40
23 Cutthroat 30 Riffle <40
24 Cutthroat 30 Riffle <40
25 Cutthroat 30 Riffle <40
26 Cutthroat 30 Riffle <40
27 Cutthroat 145 Riffle 140‐149
28 Cutthroat 30 Riffle <40
29 Cutthroat 30 Riffle <40
30 Cutthroat 30 Riffle <40
31 Cutthroat 30 Riffle <40
32 Cutthroat 30 Riffle <40
33 Cutthroat 30 Riffle <40
34 Cutthroat 30 Riffle <40
35 Cutthroat 30 Riffle <40
36 Cutthroat 30 Riffle <40
37 Cutthroat 95 Riffle 90‐99
38 Cutthroat 30 Riffle <40
39 Cutthroat 30 Riffle <40
40 Cutthroat 30 Riffle <40
41 Cutthroat 30 Riffle <40
42 Cutthroat 30 Riffle <40
43 Cutthroat 30 Riffle <40
44 Cutthroat 30 Riffle <40
45 Cutthroat 30 Riffle <40
46 Cutthroat 30 Riffle <40
47 Cutthroat 30 Riffle <40
48 Cutthroat 30 Riffle <40
49 Cutthroat 30 Riffle <40
50 Cutthroat 30 Riffle <40
51 Cutthroat 30 Riffle <40
52 Cutthroat 30 Riffle <40
53 Cutthroat 30 Riffle <40
54 Cutthroat 30 Riffle <40
55 Cutthroat 30 Riffle <40

City of Bellevue E-5
Fish # Species Length (mm) Habitat Type Length Range
56 Cutthroat 30 Riffle <40
57 Cutthroat 30 Riffle <40
58 Cutthroat 125 Riffle 120‐129
59 Cutthroat 75 Riffle 70‐79
60 Cutthroat 75 Riffle 70‐79
61 Cutthroat 75 Riffle 70‐79
62 Cutthroat 75 Riffle 70‐79
63 Cutthroat 75 Riffle 70‐79
64 Cutthroat 75 Riffle 70‐79
65 Cutthroat 95 Riffle 90‐99
66 Cutthroat 75 Riffle 70‐79
67 Cutthroat 75 Riffle 70‐79
68 Cutthroat 75 Riffle 70‐79
69 Cutthroat 75 Riffle 70‐79
70 Cutthroat 75 Riffle 70‐79
71 Cutthroat 95 Riffle 90‐99
72 Cutthroat 75 Riffle 70‐79
73 Cutthroat 75 Riffle 70‐79
74 Cutthroat 75 Riffle 70‐79
75 Cutthroat 75 Riffle 70‐79
76 Cutthroat 75 Riffle 70‐79
77 Cutthroat 75 Riffle 70‐79
78 Cutthroat 75 Riffle 70‐79
79 Cutthroat 75 Riffle 70‐79
80 Cutthroat 75 Riffle 70‐79
81 Cutthroat 75 Riffle 70‐79
82 Cutthroat 75 Riffle 70‐79
83 Cutthroat 75 Riffle 70‐79
84 Cutthroat 75 Riffle 70‐79
85 Cutthroat 75 Riffle 70‐79
86 Cutthroat 75 Riffle 70‐79
87 Crayfish 47 Riffle 40‐49
88 Crayfish 65 Riffle 60‐69
89 Crayfish 42 Riffle 40‐49

Vasa Creek Fish Habitat Assessment
City of Bellevue
ATTACHMENT F
2011 VASA CREEK MACROINVERTEBRATE SUMMARY REPORT

City of Bellevue F-1
Vasa Creek River Mile 0.38 Bioassessment scores: 2011 The B-IBI site score for this site was 24, indicating "poor" conditions. In contrast, the RIVPACS result (0.81) indicated unimpaired conditions. Indicators of ecological condition: 2011
a. Water quality A single mayfly taxon was collected at the Vasa Creek site in 2011: this was the ubiquitous taxon Baetis tricaudatus. Although low mayfly taxa richness suggests impaired water quality, the biotic index value (3.87) was not different from expectations for a Puget Sound Lowlands stream. The moderately-sensitive benthic fauna suggests that water quality was good in this reach. The presence of relatively sensitive taxa such as the stonefly Sweltsa sp. and the caddisfly Glossosoma sp. also suggest good water quality. The metals tolerance index value (3.79) indicates that metals contamination probably did not influence the biota. b. Thermal condition The composition of the benthic fauna suggested cool water temperatures: the calculated preference for the assemblage was 13.7ºC. Cold stenotherm taxa were not well represented in the samples collected in this reach. c. Sediment deposition Fifteen "clinger" taxa and 6 caddisfly taxa were collected: it seems likely that colonization of benthic substrates was not limited by sediment deposition. The FSBI value (4.17) indicated a moderately sediment-tolerant assemblage. The nemourid stonefly Zapada cinctipes was abundant, suggesting that leafy and woody debris may have littered the channel floor. d. Habitat diversity and integrity Taxa richness (39) was relatively high, suggesting diverse instream habitats. The site supported at least 4 stonefly taxa: high richness in this group may be related to stable streambanks, natural channel morphology, and functional riparian zones. Four semivoltine taxa were collected in 2011; several of these taxa were common in the samples, suggesting stable instream conditions. Scour, toxic inputs, and thermal extremes seem unlikely. The abundance of shredders and the scarcity of scrapers suggest that riparian inputs of leafy and woody debris were ample, and that the channel may have been shaded. All other expected functional components were present in proportions that seemed appropriate for a Puget Sound Lowlands stream.