


Languages
Pages
Legal

1
Pathogenesis of Fragility Fractures:A Biomechanical View
Mary L. BouxseinOrthopaedic Biomechanics LaboratoryBeth Israel Deaconess Medical CenterBoston, MAUSA
2
Outline
• Pathogenesis of fractures and determinants of bone strength
• Age-related changes that contribute to skeletal fragility
• Interaction between skeletal loading and bone strength
• Non-invasive assessment of bone strength
3
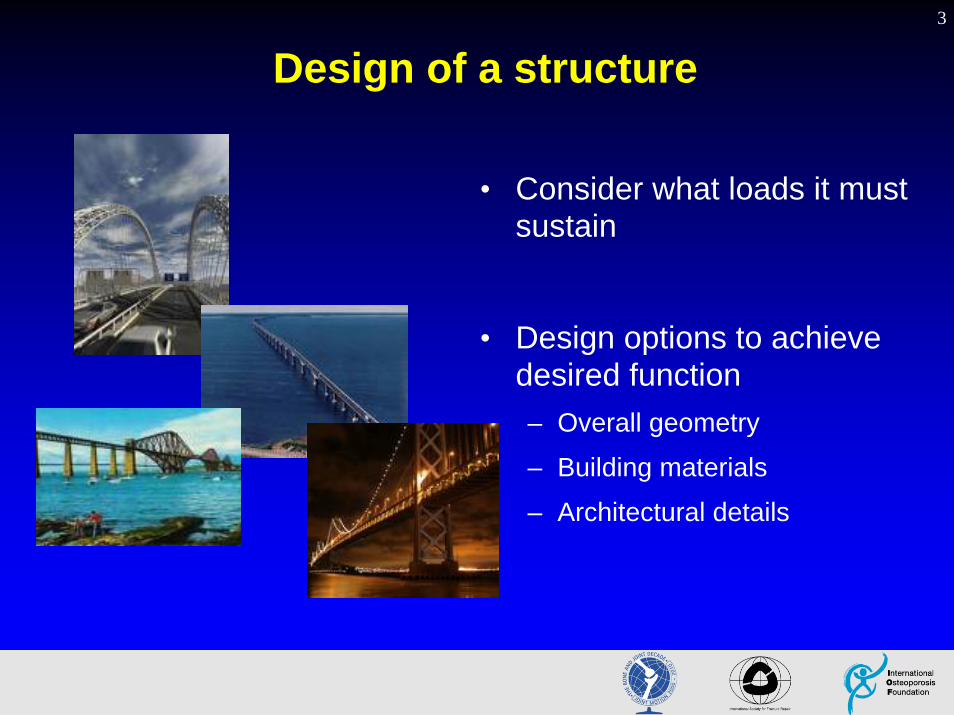
Design of a structure
• Consider what loads it must sustain
• Design options to achieve desired function– Overall geometry
– Building materials
– Architectural details

4
Determinants of whole bone strength
• Geometry– Gross morphology (size & shape)
– Microarchitecture
• Properties of Bone Material / Bone Matrix– Mineralization
– Collagen characteristics
– Microdamage
5
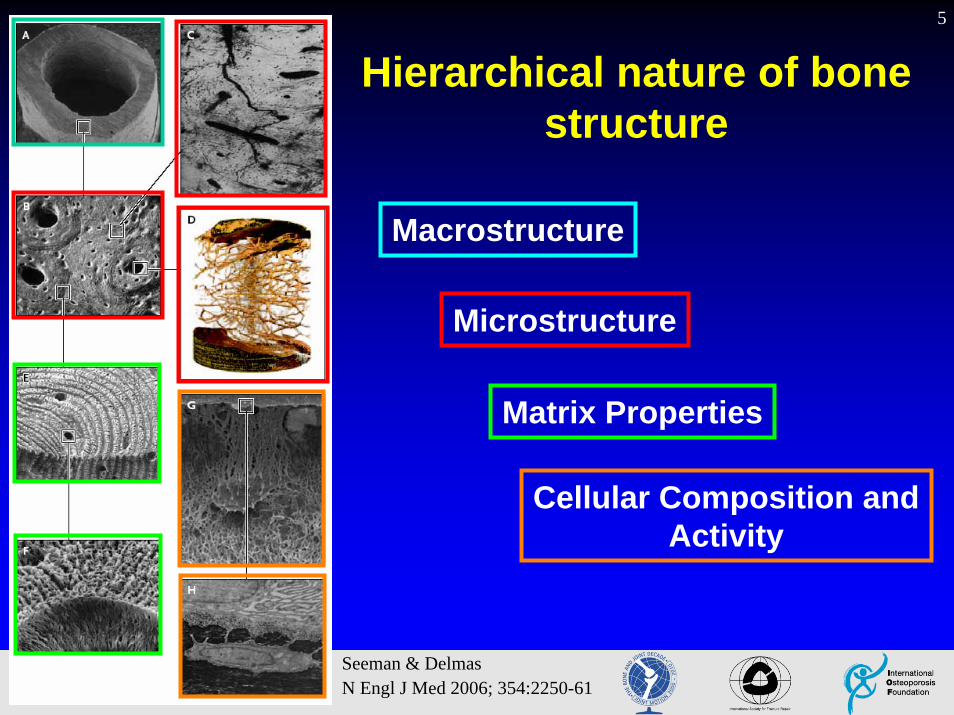
Hierarchical nature of bone structure
Seeman & DelmasN Engl J Med 2006; 354:2250-61
Macrostructure
Microstructure
Matrix Properties
Cellular Composition and Activity

6
FRACTURE?
Loads applied to the bone
Bone strength
Hayes et al. Radiol Clin N Amer. 1991; 29:85-96Bouxsein et al. J Bone Miner Res. 2006; 21:1475-82
Applied loadBone strength
> 1 fractureFactor ofrisk
Bone MassGeometry
Material properties
Fall traitsProtective responses
Bending, lifting
Biomechanical approach to fractures
7
Pathogenesis of fragility fractures
Age-related changes that contribute to fragility fractures:
1) Decreased bone strength
2) Increased propensity to fall

8
Assessing bone biomechanical properties
Deformation
Force
StructuralProperties
MaterialProperties
9
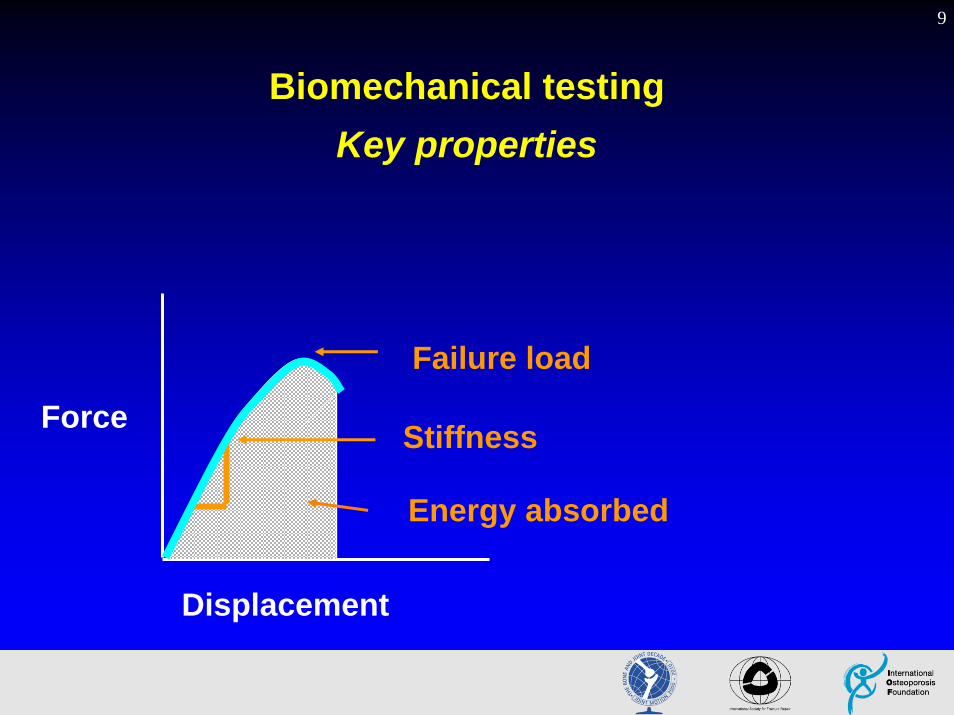
Biomechanical testingKey properties
Displacement
Force
Failure load
Energy absorbed
Stiffness
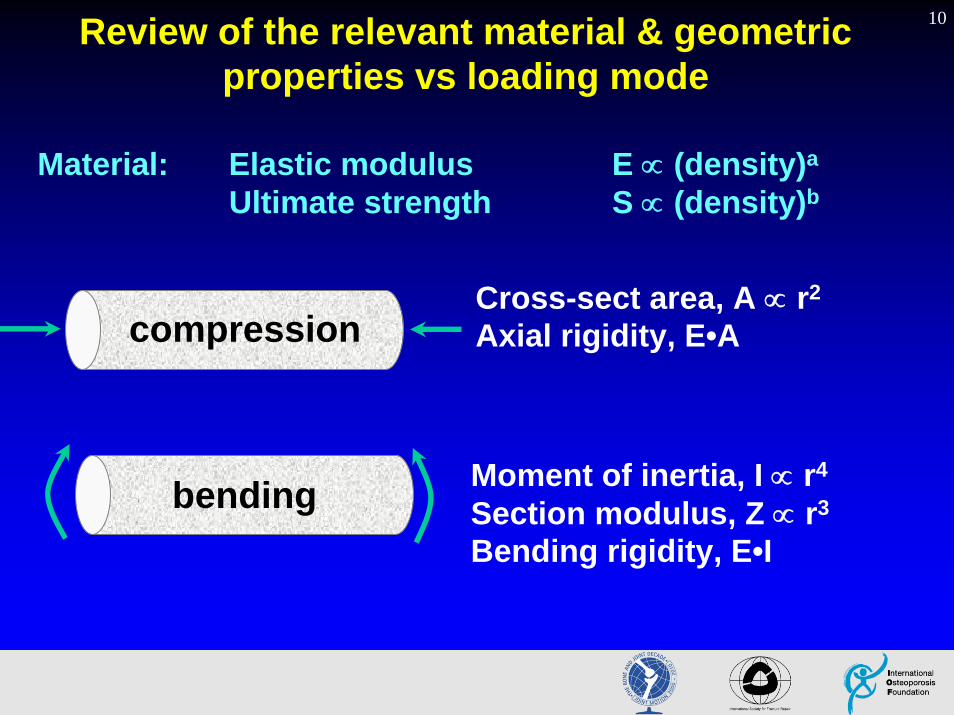
10Review of the relevant material & geometric properties vs loading mode
compression
bending
Cross-sect area, A ∝ r2
Axial rigidity, E•A
Moment of inertia, I ∝ r4
Section modulus, Z ∝ r3
Bending rigidity, E•I
Material: Elastic modulus E ∝ (density)a
Ultimate strength S ∝ (density)b

11
Effect of cross-sectional geometry on long bone strength
aBMD (by DXA) = = ↓
Compressive strength
Bending strength
=
=
↑
↑↑
↑
↑↑↑
Bouxsein, Osteoporos Int, 2001
12
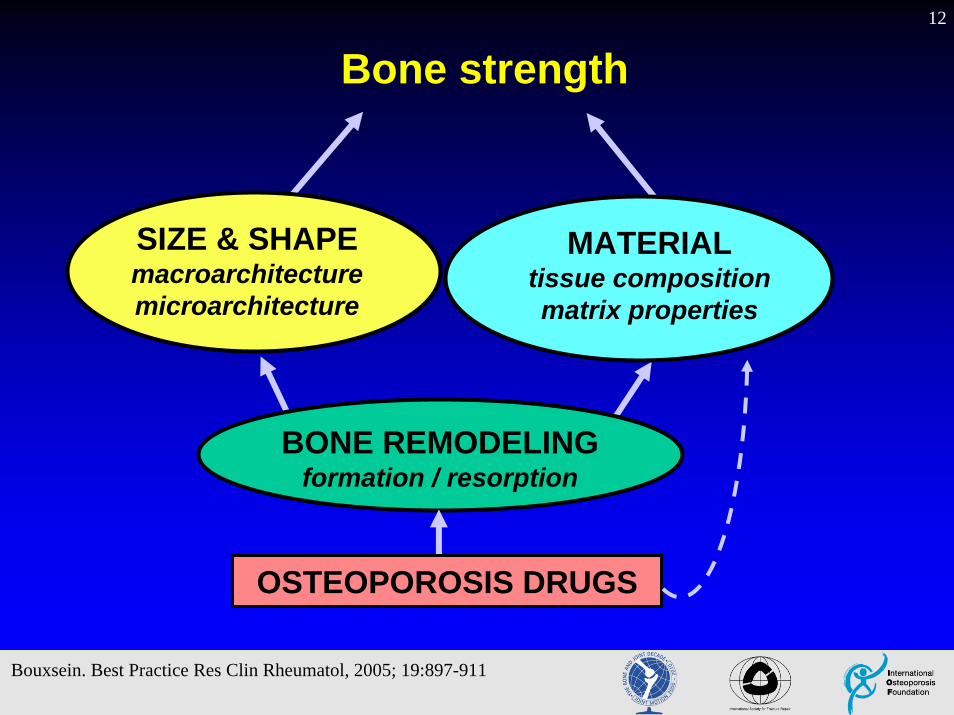
Bone strength
SIZE & SHAPE macroarchitecturemicroarchitecture
MATERIAL tissue compositionmatrix properties
BONE REMODELINGformation / resorption
OSTEOPOROSIS DRUGS
Bouxsein. Best Practice Res Clin Rheumatol, 2005; 19:897-911
13
Outline
• Determinants of bone strength
• Age-related changes that contribute to skeletal fragility

14
Age-related changes in mechanical properties of bone tissueCortical bone
% loss 30-80 yrs
-8%
-11%
-34%
Elastic modulus, E
Ultimate strength, S
Toughness
Cancellous bone% loss 30-80 yrs
-64%
-68%
-70%
Bouxsein & Jepsen, Atlas of Osteoporosis, 2003

15Whole bone strength declines
dramatically with age
0
2000
4000
6000
8000
10000
young
old
Femoral neck(sideways fall)
Courtney et al. J Bone Joint Surg Am. 1995; 77:387-95 Mosekilde. Technology and Health Care 1998; 6:287-97
Lumbar vertebrae(compression)
Who
le b
one
stre
ngth
(New
tons
)
0
2000
4000
6000
8000
10000
young old
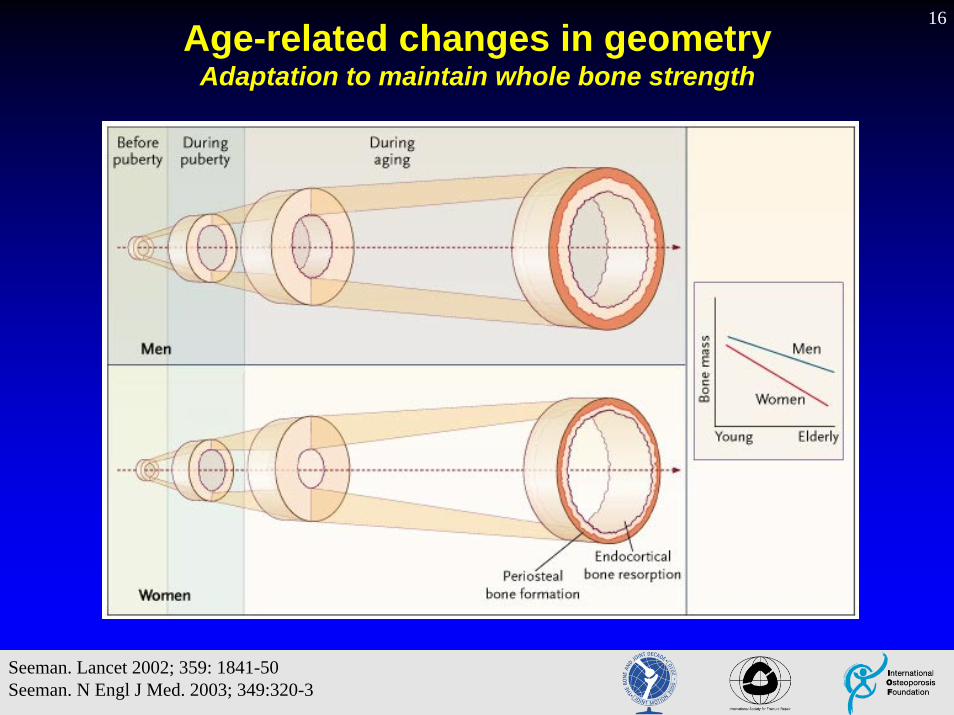
16Age-related changes in geometry
Adaptation to maintain whole bone strength
Seeman. Lancet 2002; 359: 1841-50 Seeman. N Engl J Med. 2003; 349:320-3
17
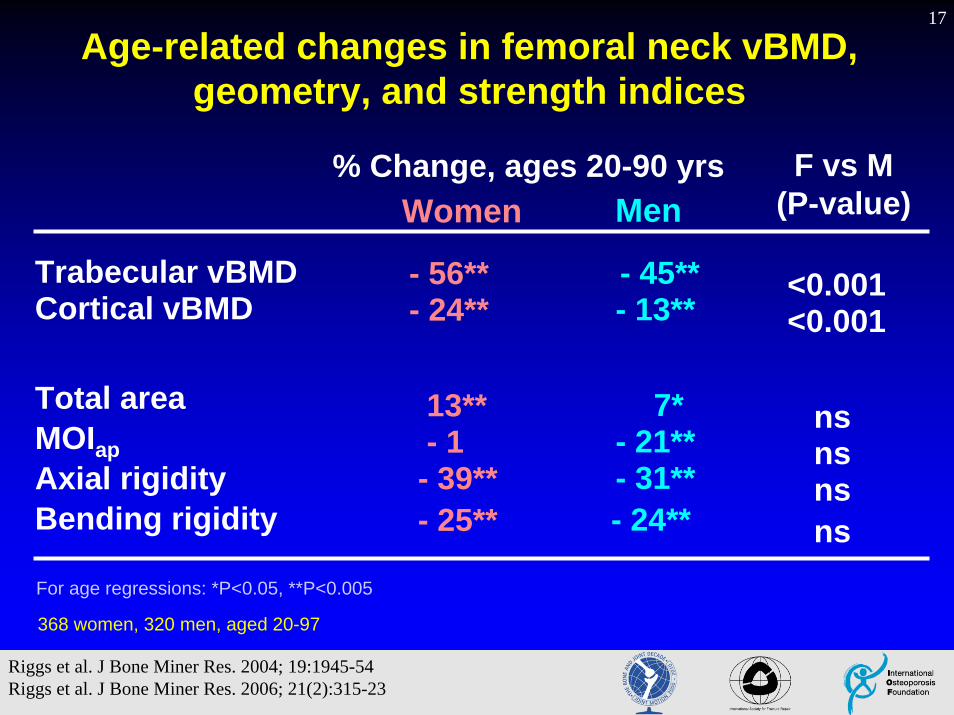
Age-related changes in femoral neck vBMD, geometry, and strength indices
Trabecular vBMDCortical vBMD
Total areaMOIapAxial rigidityBending rigidity
WomenF vs M
(P-value)Men% Change, ages 20-90 yrs
- 56**- 24**
13**- 1- 39**- 25**
- 45**- 13**
7*- 21**- 31**- 24**
<0.001<0.001
nsnsnsns
For age regressions: *P<0.05, **P<0.005
Riggs et al. J Bone Miner Res. 2004; 19:1945-54Riggs et al. J Bone Miner Res. 2006; 21(2):315-23
368 women, 320 men, aged 20-97

18
Age-related changes in trabecular microarchitecture
• Decreased bone volume, trabecular thickness and number
• Decreased connectivity
• Decreased mechanical strength
Image courtesy of David Dempster

19
Microarchitectural changes that influence bone strength
Force required to cause a slender column to buckle:
• Directly proportional to– Column material
– Cross-sectional geometry
• Inversely proportional to– (Length of column)2 www.du.edu/~jcalvert/tech/machines/buckling.htm

20
Theoretical effect of cross-struts on buckling strength
# Horizontal Effective Buckling Trabeculae Length Strength
0 L S
1 1/2 L 4 x S
Bouxsein. Best Practice Res Clin Rheumatol, 2005; 19:897-911

21
Cortical porosity increases with age(41 iliac biopsies, age 19-90)
Age (years)
0
3
6
9
12
15
0 20 40 60 80
r = 0.78 P < 0.001
(%)
4-fold increase incortical porosity from
age 20 to 80
Increased heterogeneity with age
Brockstedt et al. Bone 1993; 14:681-91

22
20-year-old 80-year-oldMayhew et al, Lancet 2005
Age-related changes in femoral neck cortex and association with hip fracture
Those with hip fractures have:
• Preferential thinning of the inferior anterior cortex• Increased cortical porosity
Bell et al. Osteoporos Int 1999; 10:248-57Jordan et al. Bone, 2000; 6:305-13
23
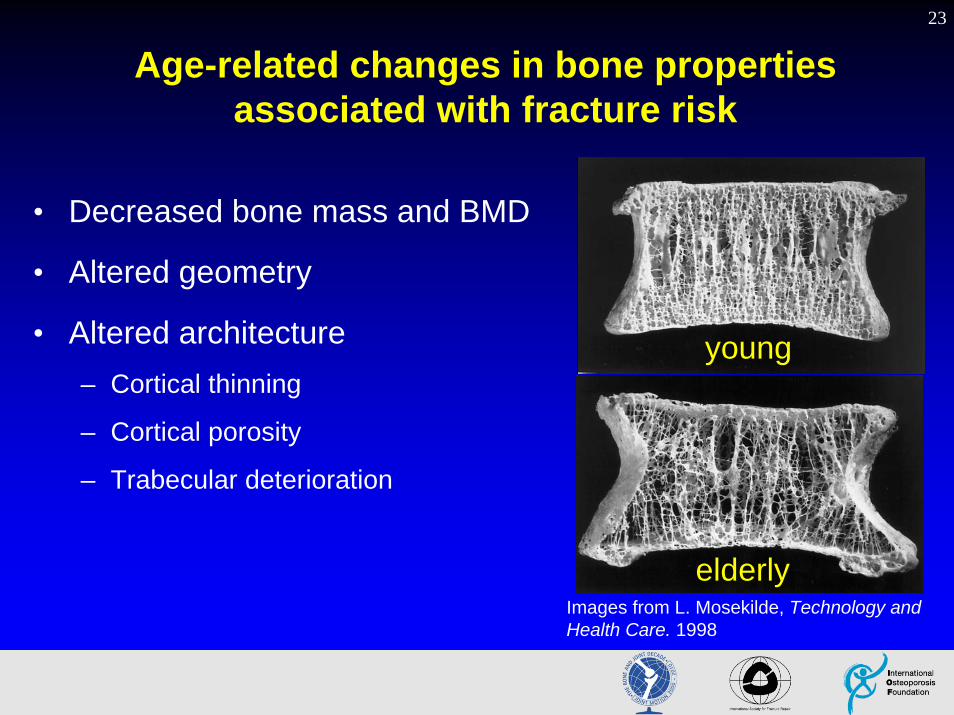
Age-related changes in bone properties associated with fracture risk
• Decreased bone mass and BMD
• Altered geometry
• Altered architecture– Cortical thinning
– Cortical porosity
– Trabecular deterioration
Images from L. Mosekilde, Technology and Health Care. 1998
young
elderly
24
Outline
• Determinants of bone strength
• Age-related changes that contribute to femoral fragility
• Interaction between skeletal loading and bone strength
25
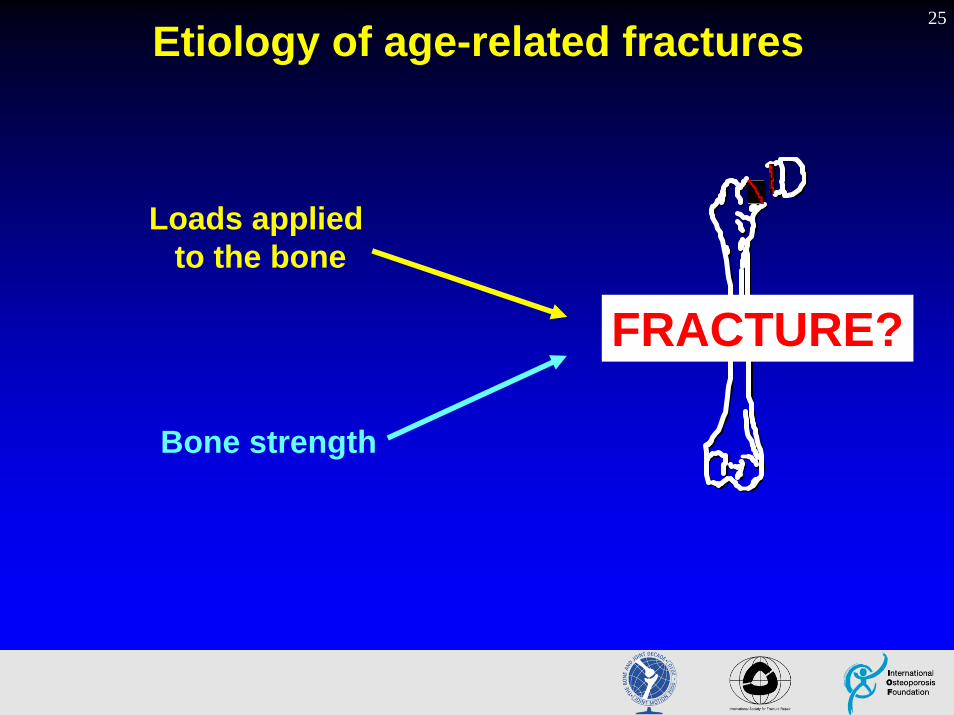
Etiology of age-related fractures
FRACTURE?
Loads applied to the bone
Bone strength

26
Φ > 1, FrxΦ < 1, no Frx
Applied loadBone strength
The factor of risk concept
• Identify activities associated with fracture
• Use biomechanical models to determine loads applied to bone for those activities
• Estimate bone failure load for those activities
Φ =
Hayes et al. Radiol Clin N Amer. 1991; 29:85-96 Bouxsein et al. J Bone Miner Res. 2006; 21:1475-82

27
Falls and hip fracture
• Over 90% of hip fx’s associated with a fall
• Less than 2% of falls result in hip fracture
• Fall is necessary but not sufficient condition
• Sideways falls are most dangerous
• What factors dominate fracture risk?

28
Factor Adjusted Odds Ratio
Fall to side 5.7 (2.3 - 14)Femoral BMD 2.7 (1.6 - 4.6)*Fall energy 2.8 (1.5 - 5.2)**Body mass index 2.2 (1.2 - 3.8)*
* calculated for a decrease of 1 SD** calculated for an increase of 1 SD
Greenspan et al, JAMA, 1994; 271(2):128-33
Independent risk factors for hip fracture

29Estimating loads applied to the hip during a
sideways fall
Human cadavers
Human volunteers
Crash dummy
Mathematical models and simulations
Peak impact forces applied to greater trochanter: 270 - 730 kg (2400 - 6400 N)
(for 5th to 95th percentile woman)
Robinovitch et al. 1991; Biomech Eng. 1991; 113:366-74Robinovitch et al.1997; Ann Biomed Eng. 1997; 25:499-508
van den Kroonenberg et al J BiomechanicEngl.1995; 117:309-18 van den Kroonenberg et al J Biomech.
1996; 29:807-11

30
Femur is strongest in habitual loading conditions
Keyak et al. J Biomech. 1998; 31:125-33
0123456789
Stance Sideways fall
Failu
re lo
ad (k
N)
P < 0.0012318 ± 300 N7978 ± 700 N

31
Femur is strongest in habitual loading conditions
Keyak et al. J Biomech. 1998; 31:125-33 van den Kroonenberg et al. J Biomech. 1996; 29:807-11
0123456789
Stance Sideways fall
Failu
re lo
ad (k
N)
P < 0.0012318 ± 300 N7978 ± 700 N
Φ =Applied loadFailure load
Thus, Φ > 1 for sideways fall in elderly persons
Fall load
32
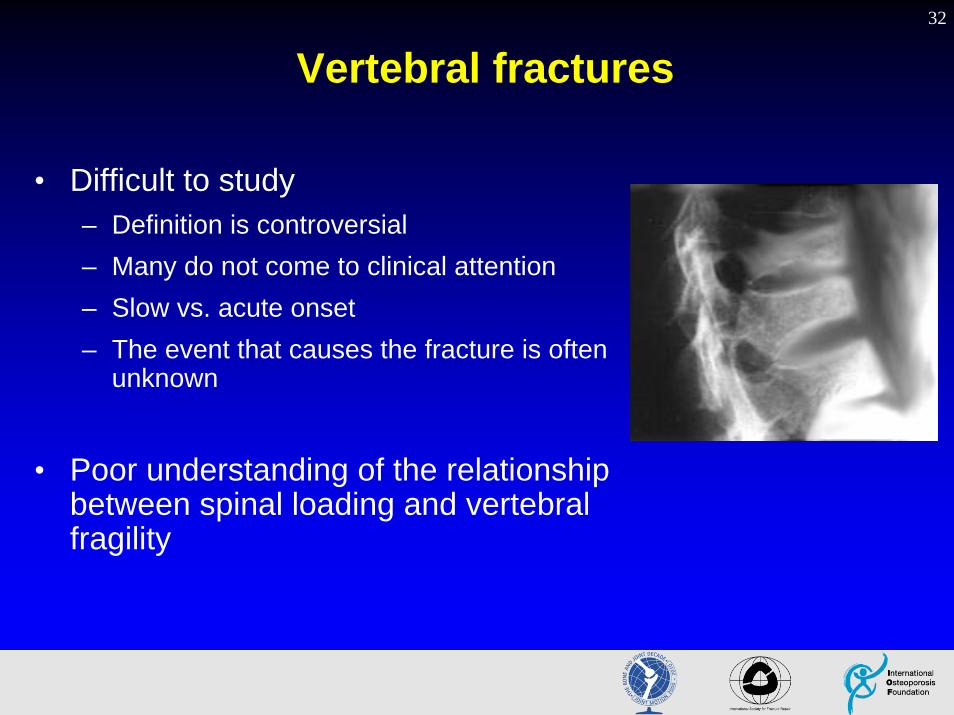
Vertebral fractures
• Difficult to study– Definition is controversial– Many do not come to clinical attention– Slow vs. acute onset– The event that causes the fracture is often
unknown
• Poor understanding of the relationship between spinal loading and vertebral fragility
33
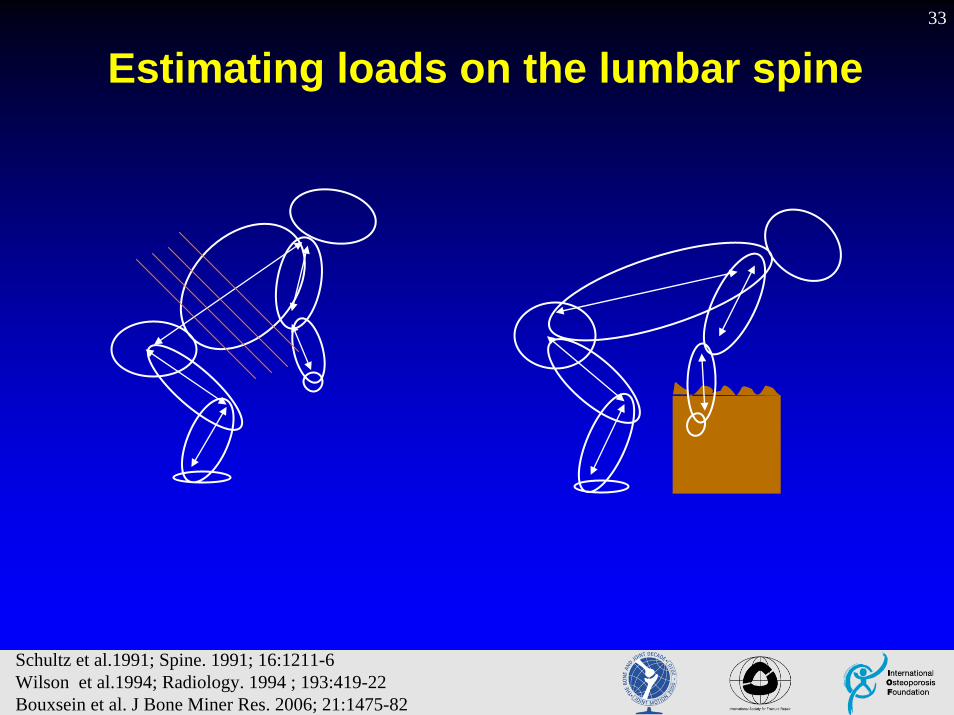
Estimating loads on the lumbar spine
Schultz et al.1991; Spine. 1991; 16:1211-6 Wilson et al.1994; Radiology. 1994 ; 193:419-22 Bouxsein et al. J Bone Miner Res. 2006; 21:1475-82

34
Factor of risk for vertebral fracture (L2)Bending forwards 90o with 10 kg weight in hands
Age
0.00.20.40.60.81.01.21.41.61.8
10 20 30 40 50 60 70 80 90 100
Men
0.00.20.40.60.81.01.21.41.61.8
10 20 30 40 50 60 70 80 90 100Age
Women
11.9% 30.1%
+92% over life** †+28% over life**
** P<0.005 for age-regressions† p<0.01 for comparison of age-related change in M and W
Bouxsein et al. J Bone Miner Res. 2006; 21:1475-82

35
Proportion of individuals with
Φ > 1, per decade
0102030405060
20-29 30-39 40-49 50-59 60-69 70-79 80+
%
4%4% 11% 12%
21%11%
27%
42%
53%
Age
(Bending forwards 90o lifting 10 kg weight)
0200400600800
100012001400
40 50 60 70 8030 90
Incidence / 100,000 person-years
Bouxsein et al. J Bone Miner Res. 2006; 21:1475-82

36
Outline
• Determinants of bone strength
• Age-related changes that contribute to femoral fragility
• Interaction between skeletal loading and bone strength
• Non-invasive assessment of bone strength

37
Bouxsein et al, 1999
• Does not distinguish– Specific attributes of 3D geometry– Cortical vs cancellous density– Trabecular architecture– Intrinsic properties of bone matrix
Clinical assessment of bone strength by DXA• Areal BMD by DXA
– Bone mineral / projected area (g/cm2)
• Reflects (indirectly)– Geometry / Mass / Size– Mineralization
• Moderate to strong correlation with whole bone strength at spine, radius & femur (r2 = 50 - 90%)
• Strong predictor of fracture risk

38
Estimating hip geometry from 2D DXA“Hip Strength Analysis”
Estimate femoral geometry and strength indices• Use 2D image data to derive 3D geometry• Requires assumptions that have not been tested for all populations and
treatmentsBeck et al. 1999, 2001

39
QCT assessment of bone density and geometry
Images courtesy of Dr. Thomas Lang, UCSF
40
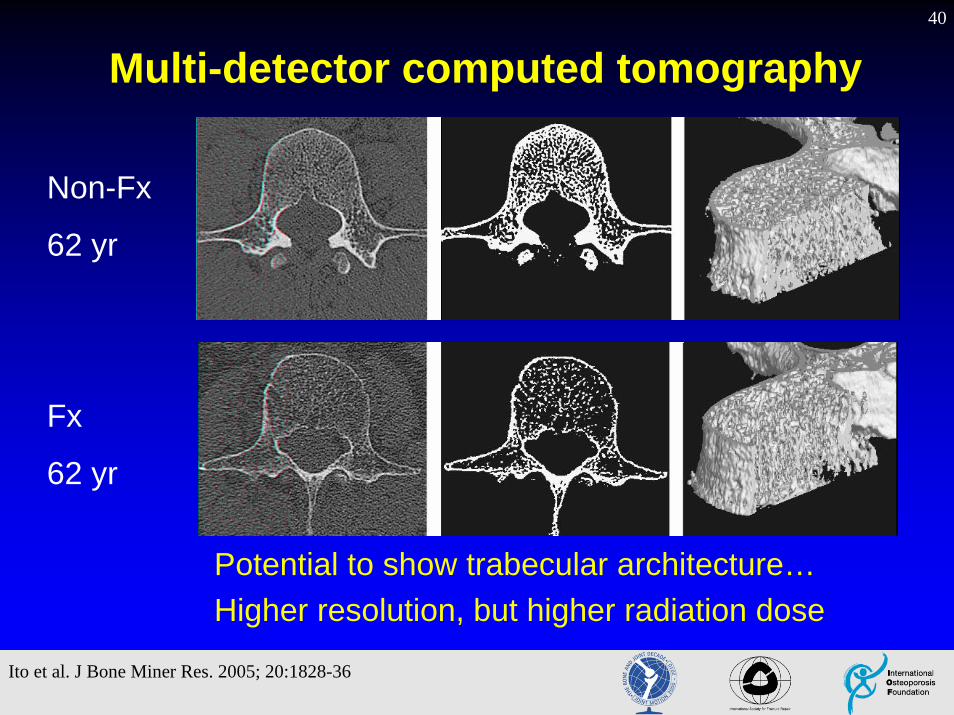
Non-Fx
62 yr
Fx
62 yr
Ito et al. J Bone Miner Res. 2005; 20:1828-36
Multi-detector computed tomography
Potential to show trabecular architecture…Higher resolution, but higher radiation dose

41
Trabecular architecture in vivowith high resolution pQCT
~ 80 µm3 voxel size
~ 3 min scan time, < 4 µSv
Distal radius and tibia only
Reproducibility: density: 0.7 - 1.5% *µ-architecture: 1.5 - 4.4% *
Xtreme CT, Scanco
* Boutroy et al. J Clin Endocrinol Metab. 2005; 90:6508-15

42
Premenopausal
PostmenopausalOsteopaenia
Postmenopausal Osteoporosis
PostmenopausalSevere Osteoporosis
Boutroy et al. J Clin Endocrinol Metab. 2005; 90:6508-15
Tibia Radius

43
Discrimination of osteopaenic women with and without history of fracture by HR-pQCT
(age = 69 yrs, n=35 with prev frx, n=78 without fracture)
* p < 0.05 vs fracture free controls
Boutroy et al. J Clin Endocrinol Metab. 2005; 90:6508-15
0.4%
-12%*-9%*
13%*
26%*
-0.3%
-10%
0%
10%
20%
30%
SpineBMD
Fem NeckBMD BV/TV TbN
TbSp TbSpSD
% D
iffer
ence
TbTh
-5%
44
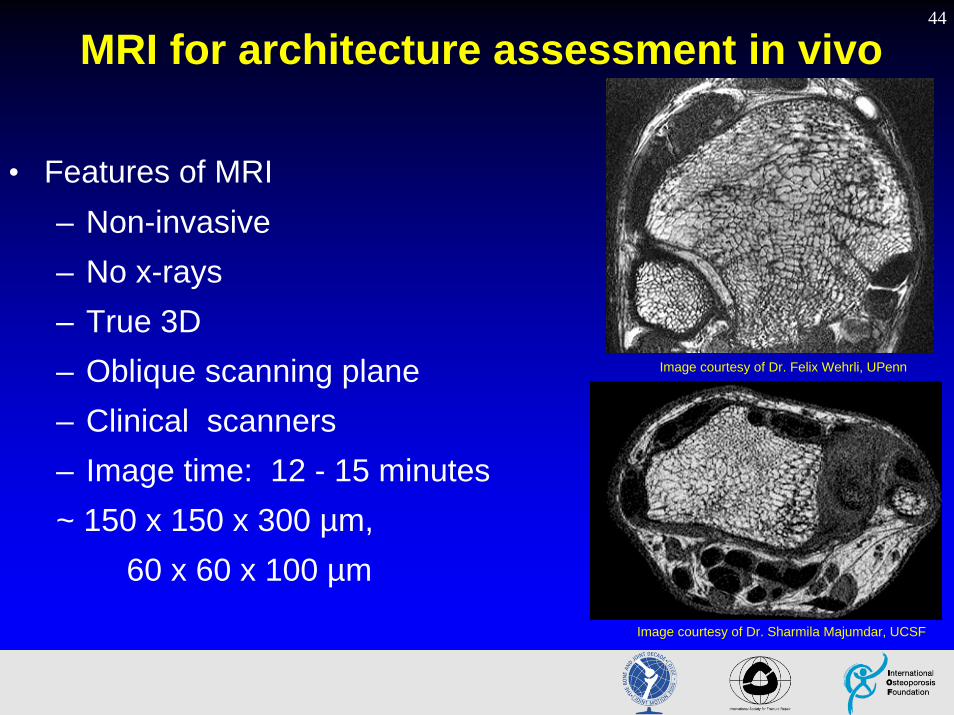
MRI for architecture assessment in vivo
• Features of MRI– Non-invasive– No x-rays– True 3D – Oblique scanning plane– Clinical scanners– Image time: 12 - 15 minutes~ 150 x 150 x 300 µm,
60 x 60 x 100 µm
Image courtesy of Dr. Felix Wehrli, UPenn
Image courtesy of Dr. Sharmila Majumdar, UCSF

45
Images from two women with similar BMD
www.micromri.com
MRI assessment of trabecular structure

46
Crawford et al, Bone 2003; 33: 744-750
QCT-based finite element analysis
• FEA is a well-established engineering method for analysis of complex structures
• Integrates geometry and density information from QCT scan to provide measures of bone strength
• In some cases, more strongly associated with whole bone strength in cadavers than DXA
• Further clinical validation needed
Image courtesy of T. Keaveny
Faulkner et al, Radiology 1991; Keyak et al, J Biomechanics 1998; Pistoia, Bone 2002; van Rietbergen JBMR 2003; Crawford et al, Bone 2003

47
Conclusions
• Whole bone strength is determined by bone mass, geometry, microarchitecture and characteristics of bone material
• Hip fractures result from an increase in traumatic loading —in particular, falls to the side — coupled with a deterioration in bone strength with increased age
• Biomechanically based assessment of fracture risk may improve diagnosis and understanding of treatment effects
• New tools are being developed for non-invasive assessment of bone strength and fracture risk
Top Related