


Languages
Pages
Legal


Paddy Power Betfair plc
2016 Prelim Results

[find new imagery for cover]
Financial &
Operating Review

3
Financial highlights
18% revenue growth (Sports +19%, Gaming +14%)
Operating costs up 12% (cc +4%):− 27% increase in sales & marketing (cc +21%)
− 4% increase in other costs (cc -3%)
Operating leverage led to 35% increase in EBITDA vs 18% revenue growth
Final dividend of 113p per share results in total dividends for the year of 165p per share
Cash position of £36m after merger related exceptional payments of £104m and dividends of £179m
£m, Proforma1 2016 2015 YOY % YOY %CC2
Revenue 1,551 1,318 +18% +11%
Cost of sales (357) (311) +15% +9%
Gross profit 1,194 1,007 +19% +12%
Operating costs (794) (711) +12% +4%
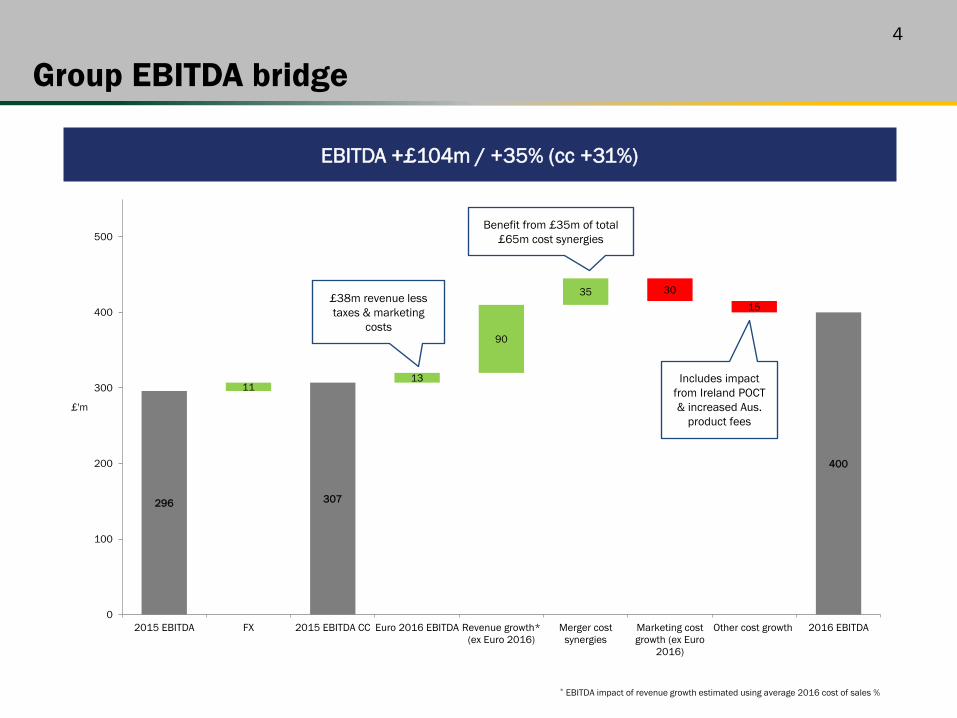
EBITDA 400 296 +35% +31%
EBITDA margin % 25.8% 22.4% +3.4% +3.8%
Depreciation & amortisation (70) (67) +4% +5%
Underlying operating profit 330 229 +44% +42%
Separately disclosed items (318) (9) n/a n/a
Operating profit 12 219 -94% -95%
Underlying earnings per share 330.9p 229.8p +44% +43%
Dividends per share 165p n/a
Net cash at end of year £36m £84m
1 Note throughout this presentation results are shown prepared on a “Proforma” basis for the Group as if the merger completed on 1 January 2015
2 Constant currency (“cc”) growth throughout this presentation is calculated by retranslating non-sterling denominated component of 2015 at 2016 exchange rates
4
296 307
1113
90
35 3015
400
0
100
200
300
400
500
2015 EBITDA FX 2015 EBITDA CC Euro 2016 EBITDA Revenue growth*(ex Euro 2016)
Merger costsynergies
Marketing costgrowth (ex Euro
2016)
Other cost growth 2016 EBITDA
£'m
Group EBITDA bridge
EBITDA +£104m / +35% (cc +31%)
Benefit from £35m of total £65m cost synergies
Includes impact from Ireland POCT & increased Aus.
product fees
* EBITDA impact of revenue growth estimated using average 2016 cost of sales %
£38m revenue less taxes & marketing
costs

5
Divisional overview
£m, ProformaUnderlying
ONLINE AUSTRALIA RETAIL US GROUP
2016 YOY % 2016 YOY % 2016 YOY % 2016 YOY % 2016 YOY %
Sportsbook stakes 5,266 +19% 2,911 +42% 1,713 +12% - - 9,890 +24%
Sportsbook net rev % 6.6% Flat 10.7% -0.6% 11.6% -0.1% - - 8.7% -0.1%
Sports revenue 609 +14% 312 +34% 198 +11% 79 +24% 1,198 +19%
Gaming revenue 245 +14% - - 97 +10% 12 +56% 353 +14%
Total revenue 853 +14% 312 +34% 295 +11% 91 +28% 1,551 +18%
EBITDA 289 +27% 94 +35% 62 +21% 12 +25% 400 +35%
Operating profit 255 +34% 84 +38% 45 +23% 4 +39% 330 +44%
Regulated Online50%
Unregulated Online
5%
Australia20%
US6%
Retail19%
2016 Net Revenue
By Market
Online Sportsbook
42%
Exchange, US Sports & B2B
22%
Online Gaming
17%
Retail Sportsbook
13%
Retail Gaming
6%
By Product
2016 Operating Profit
By division2
Online66%
Australia22%
US1%
Retail12%
1 Group EBITDA and operating profit includes unallocated central costs2 Before unallocated central costs of £58m
1

6
Online
Regulated revenues up 16% (cc +13%) with unregulated -2% (cc -11%), primarily due to exiting Portugal in July 2015
Exchange & B2B revenue +7% (cc +3%)
Gaming growth slowed in Q4
Sales & marketing costs increase includes continued asset inflation and Euro 2016
Decrease in other operating costs reflects benefit of merger synergies & underlying operating efficiencies
£m, Proforma 2016 2015 YOY % CC YOY %
Sportsbook stakes 5,266 4,416 +19% +16%
Sportsbook net revenue % 6.6% 6.6% Flat Flat
Sports revenue 609 534 +14% +10%
Gaming revenue 245 214 +14% +12%
Total revenue 853 748 +14% +11%
Cost of sales (193) (178) +8% +5%
Gross Profit 661 570 +16% +12%
Sales & marketing (195) (159) +23% +19%
Product & technology (111) (117) -6% -13%
Operations (65) (66) -2% -8%
Total operating costs (371) (343) +8% +3%
Underlying EBITDA 289 227 +27% +28%
Depreciation & amortisation (34) (36) -6% -13%
Underlying operating profit 255 191 +34% +36%
Active customers (000’s)* 3,904 3,511 +11%
Online division includes the UK/Ireland telephone business
* Active customers throughout are defined as those who have deposited real money and have bet in the reporting period, excluding indirect B2B customers. Note that the active customer numbers have not been adjusted for customers who were active on both the Paddy Power and Betfair brands.
7
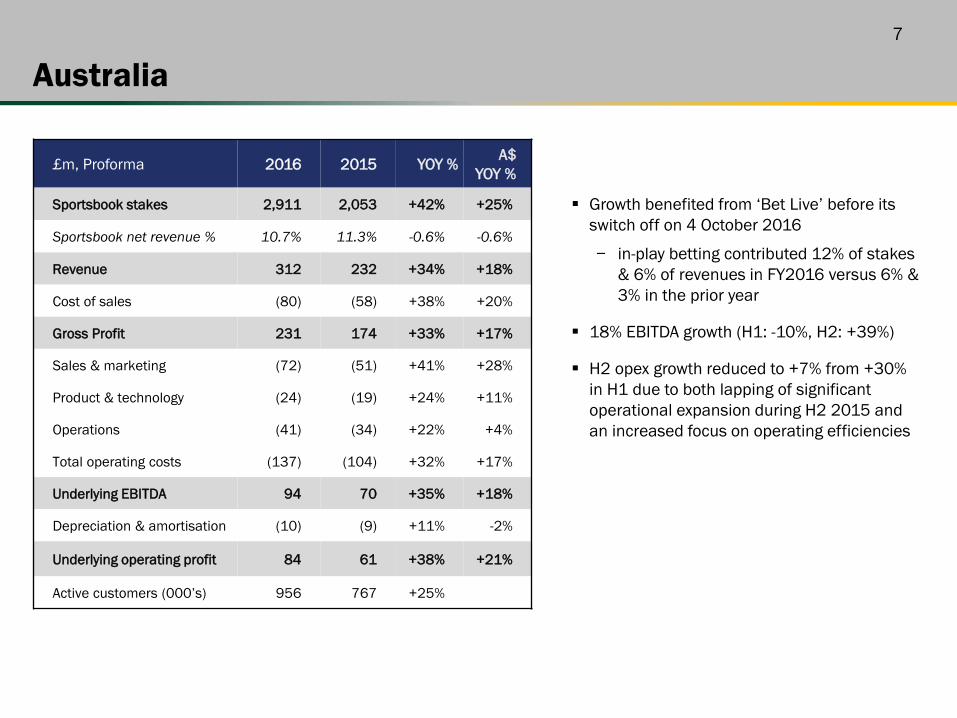
Australia
£m, Proforma 2016 2015 YOY % A$YOY %
Sportsbook stakes 2,911 2,053 +42% +25%
Sportsbook net revenue % 10.7% 11.3% -0.6% -0.6%
Revenue 312 232 +34% +18%
Cost of sales (80) (58) +38% +20%
Gross Profit 231 174 +33% +17%
Sales & marketing (72) (51) +41% +28%
Product & technology (24) (19) +24% +11%
Operations (41) (34) +22% +4%
Total operating costs (137) (104) +32% +17%
Underlying EBITDA 94 70 +35% +18%
Depreciation & amortisation (10) (9) +11% -2%
Underlying operating profit 84 61 +38% +21%
Active customers (000’s) 956 767 +25%
Growth benefited from ‘Bet Live’ before its switch off on 4 October 2016
− in-play betting contributed 12% of stakes & 6% of revenues in FY2016 versus 6% & 3% in the prior year
18% EBITDA growth (H1: -10%, H2: +39%)
H2 opex growth reduced to +7% from +30% in H1 due to both lapping of significant operational expansion during H2 2015 and an increased focus on operating efficiencies

8
Retail
Good revenue growth in both estates:― UK +8%― Ireland +15% (+2% in constant currency)
Like-for-like KPIs in constant currency:― Sportsbook stakes +1%― Sportsbook revenue +1%― Machine gaming revenue +7%― Total revenue +3%― Opex +2%
16 new shops opened in 2016 (12 in the UK & 4 in Ireland) & 1 UK closure
£m, Proforma 2016 2015 YOY % CC YOY %
Sportsbook stakes 1,713 1,530 +12% +4%
Sportsbook net revenue % 11.6% 11.7% -0.1% -0.1%
Sportsbook revenue 198 178 +11% +3%
Machine gaming revenue 97 88 +10% +10%
Total revenue 295 266 +11% +6%
Cost of sales (63) (58) +7% +4%
Gross Profit 233 208 +12% +6%
Operating costs (170) (156) +9% +5%
Underlying EBITDA 62 52 +21% +10%
Depreciation & amortisation (18) (15) +16% +10%
Underlying operating profit 45 36 +23% +10%
Shops at year end 613 598 +3%
9
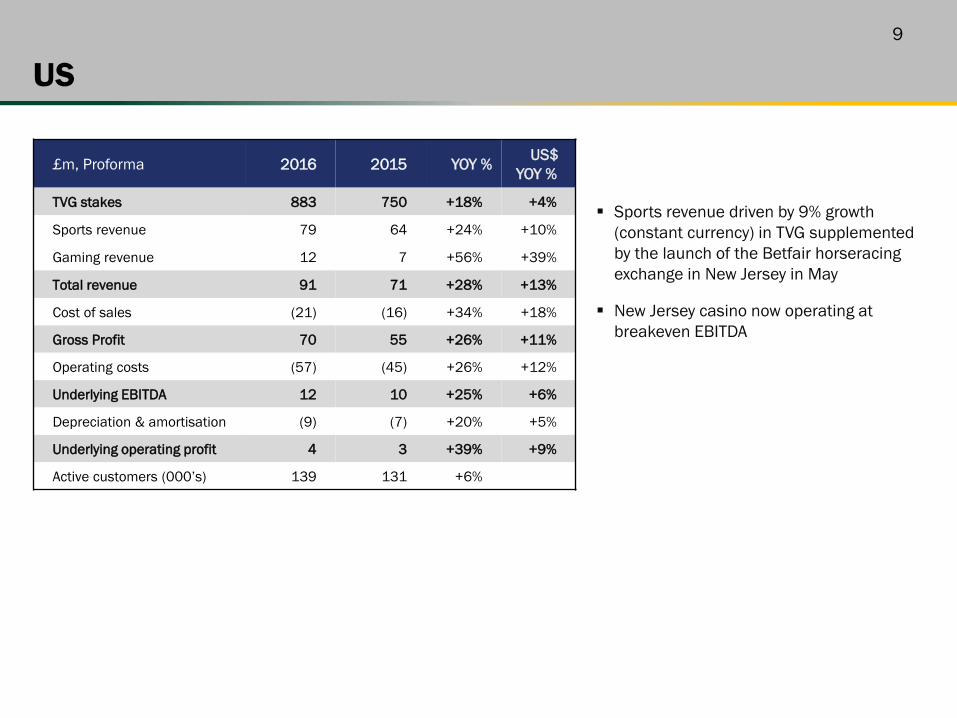
US
Sports revenue driven by 9% growth (constant currency) in TVG supplemented by the launch of the Betfair horseracing exchange in New Jersey in May
New Jersey casino now operating at breakeven EBITDA
£m, Proforma 2016 2015 YOY % US$YOY %
TVG stakes 883 750 +18% +4%
Sports revenue 79 64 +24% +10%
Gaming revenue 12 7 +56% +39%
Total revenue 91 71 +28% +13%
Cost of sales (21) (16) +34% +18%
Gross Profit 70 55 +26% +11%
Operating costs (57) (45) +26% +12%
Underlying EBITDA 12 10 +25% +6%
Depreciation & amortisation (9) (7) +20% +5%
Underlying operating profit 4 3 +39% +9%
Active customers (000’s) 139 131 +6%
10
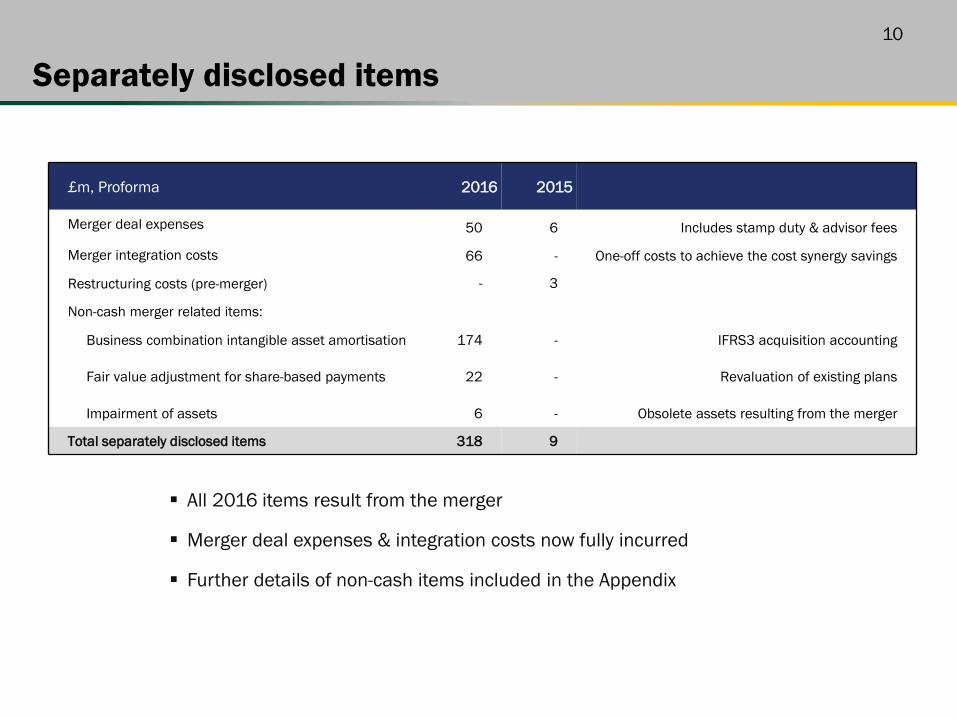
Separately disclosed items
£m, Proforma 2016 2015
Merger deal expenses 50 6 Includes stamp duty & advisor fees
Merger integration costs 66 - One-off costs to achieve the cost synergy savings
Restructuring costs (pre-merger) - 3
Non-cash merger related items:
Business combination intangible asset amortisation 174 - IFRS3 acquisition accounting
Fair value adjustment for share-based payments 22 - Revaluation of existing plans
Impairment of assets 6 - Obsolete assets resulting from the merger
Total separately disclosed items 318 9
All 2016 items result from the merger
Merger deal expenses & integration costs now fully incurred
Further details of non-cash items included in the Appendix

11
Cash flow
£m, Proforma 2016 2015 YOY %
Underlying EBITDA 400 296 +35%
Capex1 (85) (92) -8%
Working capital (15) 62 n/a
Corporation tax paid (48) (30) +58%
Underlying free cash flow 252 236 +7%
Cash flow from separately disclosed items (104) (9) n/a
Free cash flow 148 227 -35%
Dividends paid (179) (88) +103%
Return of capital (incl. fees) - (484) n/a
Interest & other borrowing costs (2) (1) +33%
Other 2 (11) n/a
Net decrease in cash (31) (357) n/a
Net cash at start of year 84 453 -81%
Movement to restricted cash (8) - n/a
FX translation impact (9) (12) n/a
Net cash at end of year 36 84 -57%
Working capital:
2016 was adversely affected by one-off timing impacts including historical international tax payments and harmonisation of UK POCT payments
2015 included a one-off benefit from the introduction of UK POCT
1 Includes retail and HRTV acquisitions

12
Financial guidance & regulatory update
• 2017 benefits from £30m cost synergies versus 2016 (£65m vs £35m) • One-off cash costs to achieve synergies all fully incurred in 2016
Financial guidance
Capex
Effective tax rate
FX
• Online gaming POCT change from Aug 2017 (c.£6m annual impact)• Horse Betting Levy extension to online from April 2017 (c. £10m annual impact)• Government’s Review of Gaming Machines & Social Responsibility Measures ongoing• CMA investigation into online gaming operators• EU 4th Directive on AML to be implemented by June 2017
• Full-year 2017 capex expected to be £80m to £90m
• Full-year 2017 underlying effective tax rate expected to be approximately 15%
• c.70% of Group EBITDA is GBP denominated with c.30% AUD, USD & other currencies (Euro currency EBITDA is circa nil with Euro denominated costs offsetting Euro revenues)
Cost synergies
Regulatory update
UK
Australia• Government’s credit betting ban & series of consumer protection measures to be
implemented (impact on PPB not expected to be material) • South Australian POCT effective from July 2017 (impacts 7% of Australian revenues)

up
Business Review

14
1
2
3
Combining the best assets and capabilities of each legacy business
Optimising our brand positioning
Capitalising on our enhanced scale
Key priorities

15
1
Online scale drives value
Capitalising on our enhanced scale
Invest in pricing,
product & brand
Grow revenues / increase scale
Reduced cost to serve
Grow profit
• Virtuous cycle of profitable growth within existing markets
• Better positioned to withstand regulatory headwinds
• Enhanced ability to enter new markets
Invest in pricing, product & brand
Grow revenues / increase scale
Reduced cost to serve
Grow profit
• c.£300m annual marketing spend• c.1000 product development staff• Leading promotional offers & pricing
• £1.3bn of online revenues = #2 operator globally• #1 online operator in the UK, Ireland & Australia
• 2016 opex per active down 18%1
• Further efficiency following platform integration
• 2016 online operating margin expanded by 4ppts to 27%
1 Online operating costs, excluding marketing spend. YoY in constant currency
16Combining the best assets and capabilities2
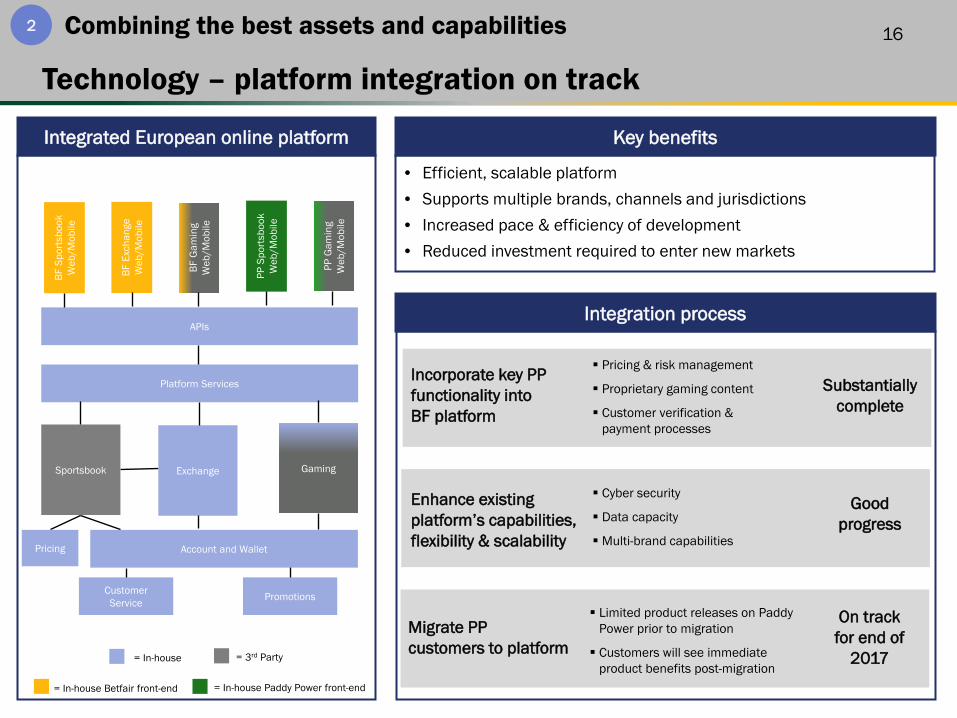
Technology – platform integration on track
Account and Wallet
Exchange
Platform Services
Sportsbook Gaming
APIs
BF S
ports
book
W
eb/M
obile
Customer Service Promotions
Pricing
= 3rd Party= In-house
BF E
xcha
nge
Web
/Mob
ile
BF G
amin
g W
eb/M
obile
PP S
ports
book
W
eb/M
obile
PP G
amin
g W
eb/M
obile
• Efficient, scalable platform• Supports multiple brands, channels and jurisdictions• Increased pace & efficiency of development • Reduced investment required to enter new markets
= In-house Betfair front-end = In-house Paddy Power front-end
Integrated European online platform
Substantially complete
Good progress
On track for end of
2017
Incorporate key PP functionality into BF platform
Enhance existing platform’s capabilities, flexibility & scalability
Migrate PP customers to platform
Pricing & risk management
Proprietary gaming content
Customer verification & payment processes
Limited product releases on Paddy Power prior to migration
Customers will see immediate product benefits post-migration
Key benefits
Integration process
Cyber security
Data capacity
Multi-brand capabilities

17Combining the best assets and capabilities2
Product – investing in our proposition

18
Benefitting from integrated operations
Combining the best assets and capabilities2
Risk & trading
Improved pricing & risk management capability:• Sharing of data & processes between brands• Increased volume of bets• Pooled risk management data• Use of Exchange
Continuing to invest in proprietary models
Improved efficiency:• Enhanced scale driving lower average cost to serve• Greater automation• Reduced use of third-party suppliers • Flexibility to price once and offer different odds
across brands / jurisdictions
Improved capability facilitates our pricing strategy
Next Generation football model launched Jan 2017• More accurate pricing with greater automation• Reduced in-play market suspension (<1 minute per match
vs c.5 minutes previously) • Greater range of markets (e.g. 1/5/10 min betting, next
set piece betting) • Addresses some key customer pain points: Industry leading bet delay time reduces failed bets
Industry leading post goal suspension times
Greater cash-out availability
Faster bet settlement
Typical football in-play betting stats
Bet delay time (seconds)
Post goal suspension time
(seconds)
PPB new model <1 <1
Previous PP model 3 45
Previous BF 3rd Party model 5 42
Major UK competitors average1 6 33
1 Includes Bet365, Ladbrokes, William Hill and Sky Bet

19
Communicating differently
Optimising our brand positioning3

20
0%10%20%30%40%50%60%70%
William Hill
BetVictor
Ladbrokes Bet365
SkyBet
107%
106%
105%
104%
103%
102%
101%
100%
Bet365
BetVictor Ladbrokes
WilliamHill
SkyBet
Consistently strong pricing, supported by the Exchange & innovative product features
Best odds on popular bets, supported by attractive promotions
Market leading sportsbook overrounds1 Market leading odds on most-backed favourites
1 Premier League average overrounds (W-D-W, all matches, taken 30mins pre kick-off)
Dec-Feb 2017
Jan-Mar 2016
% Best / Joint Best Price on Favourite - 2016/17 Season2
2 Favourite to win in W-D-W market, matches involving big 6 clubs (Chelsea, Man City, Liverpool, Man Utd, Arsenal and Spurs), taken 30 mins pre kick-off
Distinct value propositions
Optimising our brand positioning3
21
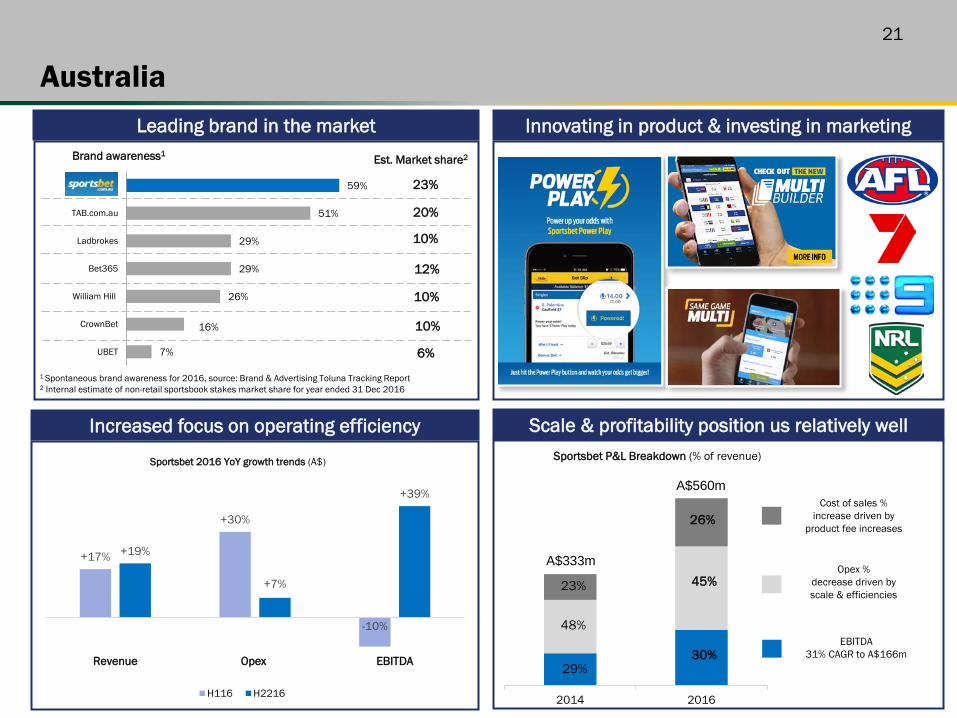
Australia
7%
16%
26%
29%
29%
51%
59%
UBET
CrownBet
William Hill
Bet365
Ladbrokes
TAB.com.au
1 Spontaneous brand awareness for 2016, source: Brand & Advertising Toluna Tracking Report2 Internal estimate of non-retail sportsbook stakes market share for year ended 31 Dec 2016
Leading brand in the market
Increased focus on operating efficiency
Innovating in product & investing in marketing
Scale & profitability position us relatively well
2014 2016
Sportsbet P&L Breakdown (% of revenue)
Brand awareness1 Est. Market share2
+17%
+30%
-10%
+19%
+7%
+39%
Revenue Opex EBITDA
H116 H2216
Sportsbet 2016 YoY growth trends (A$)
23%
26%
48%
45%
29%30%
23%
10%
20%
12%
10%
10%
6%
Cost of sales % increase driven by
product fee increases
Opex %decrease driven by scale & efficiencies
EBITDA 31% CAGR to A$166m
A$560m
A$333m

22
US
TVG Betfair New Jersey Casino
Betfair New Jersey Exchange
Launched in 2013
c.12% share of NJ online casino market
New ad campaign driving good customer growth
Now operating at breakeven EBITDA after two years of start-up losses
Launched in May 2016; first online exchange wagering platform in US market
70% of revenues from non-ADW customers
Market leader in low growth market (c.35% share)
New distribution deal from Nov 2016 with AT&T, for HD TV & streaming
Launched re-designed desktop & mobile products in 2016

23
Retail
3 10
20 14 4
44
57
55
21
12
2012 2013 2014 2015 2016
UK Shops
Ire Shops
High quality openings still being identified
Paddy Power new shop openings(includes acquisitions)
Investing in customer experience
Sector leading shop profitability
£103k
Last 12 months reported FY 2016
Average EBITDA per shop, last 12 months reported
Estimated listed peer average2
1 William Hill is H2 2016 YoY growth as Q4 stakes growth not disclosed 2 Listed peer average is estimated based on William Hill’s full year 2016 disclosures, Ladbrokes disclosures for the 12 months ended 30 June 2016 and Coral disclosures for 12 months ended 2 July 2016
c..£76k
UK sports stakes(Q4’16 YoY growth)
PP estate continues to deliver leading top-line growth
+2%
c.(4%) (5%)
UK machines revenue(Q4’16 YoY growth)
LFL +7%
+4%
LFL
William Hill1
LadbrokesCoral
c.+3%
William Hill
LadbrokesCoral

24
Summary
Outlook 2017 trading to date in line with our expectations
Scale, market positions and leading capabilities; well placed for sustainable, profitable growth
Key integration actions and operational changes required to realise cost synergies completed in 2016
Now focused on fully unlocking the combined operations potential
Platform integration on track for Q4’17
Good strategic progress

[find new imagery for cover]
Q & A

[find new imagery for cover]
Appendix

27
Separately disclosed items
MERGER ACQUISITION ACCOUNTING £m
Consideration 4,314 Market value at completion of shares issued plus fair value of replacement share options issued
Less:
Betfair net assets on completion 36 Net of fair value adjustments
Identified intangible assets (comprising brands, customer relationships, technology & licences)
Amortised to income statement over useful lives of up to 8 years:
FY16 FY17 FY18 FY19 FY20 – FY23
628 174 132 83 67 43 p.a.
Deferred tax on identified intangible assets (95) (23) (18) (12) (10) (8) p.a.
EqualsGoodwill 3,745 Not amortised, reviewed annually for impairment
OTHER FAIR VALUE ADJUSTMENTS £m
Fair value adjustment for share-based payments
Revaluation of existing plans required on completion, additional charge to income statement over vesting period reflecting increased market value of shares:
FY16 FY17 FY18 Total P&L impact
22 11 2 35
Top Related