


Languages
Pages
Legal


Oxycombustion Flue Gas Measurements from Coal
Fired Plants: Analytical Challenges
Morgane Riviere, Daniel Missault,, Patrick Mauvais, Martine Carre, Tracey Jacksier
20 October 2015

Presentation Outline
Oxy-combustion for Power Generation
Demonstration Project Objectives
Analytical Challenges
Analysis Campaign Results
Summary
Air Liquide, world leader in gases for industry, health and the environment Research & Development 2 2015
Presentation Outline
Oxy-combustion for Power Generation
Demonstration Project Objectives
Analytical Challenges
Analysis Campaign Results
Summary
Air Liquide, world leader in gases for industry, health and the environment Research & Development 3 2015

Clean Coal Combustion
Coal is the most abundant fuel Lowest cost for fuel production
Impact of CO2 on global warming is still under intense debate
Coal is the most carbon intensive fuel Economical means of carbon management important to coal’s future use
Air Liquide, world leader in gases for industry, health and the environment Research & Development 4 2015
Clean Coal Combustion
Clean coal development is very important to reduce CO2 emissions in the environment.
Electricity production can generate significant amounts of CO2 emission contribution to almost 39% of WW emission.
Carbon Capture and Sequestration (CCS) can reduce the CO2 emission by
Injecting CO2 at high pressure under ground for geological storage Enhanced oil recovery applications
Air Liquide, world leader in gases for industry, health and the environment Research & Development 5
T. Chaubey, P. Terrien, J-P. Tranier, R. Prabhakar and A. Delebecque, “Greenhouse Gas Capture and Mitigation Techniques for Different Industries” in "CO2 Summit: Technology and Opportunity", Frank Zhu, UOP, LLC, USA Eds, ECI Symposium Series, Volume P12 (2010).
2015

Most Viable Options
Main options for capturing carbon from coal-fired systems
1. Flue gas scrubbing with amine • Most mature, but requires significant scale-up
2. Integrated gasification combined cycle (IGCC) • Greenfield option that has long been favored • Major scale-up of water shift reactor and H2 burning gas turbine
as well as proof of reliability • Costs have been much higher than anticipated, and
performance estimates have fallen far short of expectations
Air Liquide, world leader in gases for industry, health and the environment Research & Development 6
M. McDonald, D. DeVault, R. Varagani, “Oxy-combustion in Pulverized Coal Power Plants for Carbon Dioxide Concentration”, Presented at 2007 Electric Power Conference, Chicago, May 2007
2015

Most Viable Options
Main options for capturing carbon from coal-fired systems
3. Oxy-Coal combustion • Commercially available equipment • Oxygen mixing, control of flue gas flow O2 mixture and heat
transfer performance must be optimized • Predicted to have the highest overall efficiency and promises to
be the low-cost option
OCC more readily deployable for capture and storage ofCO2
Air Liquide, world leader in gases for industry, health and the environment Research & Development 7
M. McDonald, D. DeVault, R. Varagani, “Oxy-combustion in Pulverized Coal Power Plants for Carbon Dioxide Concentration”, Presented at 2007 Electric Power Conference, Chicago, May 2007
2015

Air Liquide, world leader in gases for industry, health and the environment Research & Development 8
What is Oxy-Coal Combustion?
Uses O2 as the oxidant rather than air diluted with recycled flue gas in the combustion process
Combustion with pure O2 would result in too high of a flame temperature for the boiler • Dilute with recycled flue gas Yields a flue gas stream primarily of CO2 and H2O After removal of H2O, nearly pure CO2 stream can be produced
It is assumed that: • NOx, CO, unburned hydrocarbons, and SOx do not interfere with the
sequestration process However, impurities need to be reduced to prevent corrosion • Transportation, piping, etc…
2015

OCC + Sequestration
Oxy-Fuel combustion has significant advantages overtraditional air fired plants
Flue gas volume is reduced, decreasing the heat loss in the flue gas Concentration of pollutants making separation easier Most of flue gases are condensable making sequestration possible Because air is not used for combustion, NOx production will be greatly reduced
Air Liquide, world leader in gases for industry, health and the environment Research & Development 9 2015

Air Liquide, world leader in gases for industry, health and the environment Research & Development
2015
Oxy-Coal Combustion
10
Boiler
Water Steam
~
Stack
ESP FGD
Sulfur Ash
Coal
Pulverizer
Raw coal
AIR
Water, inert gases
CO2 storage
CO2
CO2 cryogenic purification unit
Flue Gas Recycle (FGR)
Mixer
*ASU – Air separation unit
Added for CO2 capture vs reference plant(air-fired PC without CO2 capture)
ASU*
Pure Oxygen
Air
2015
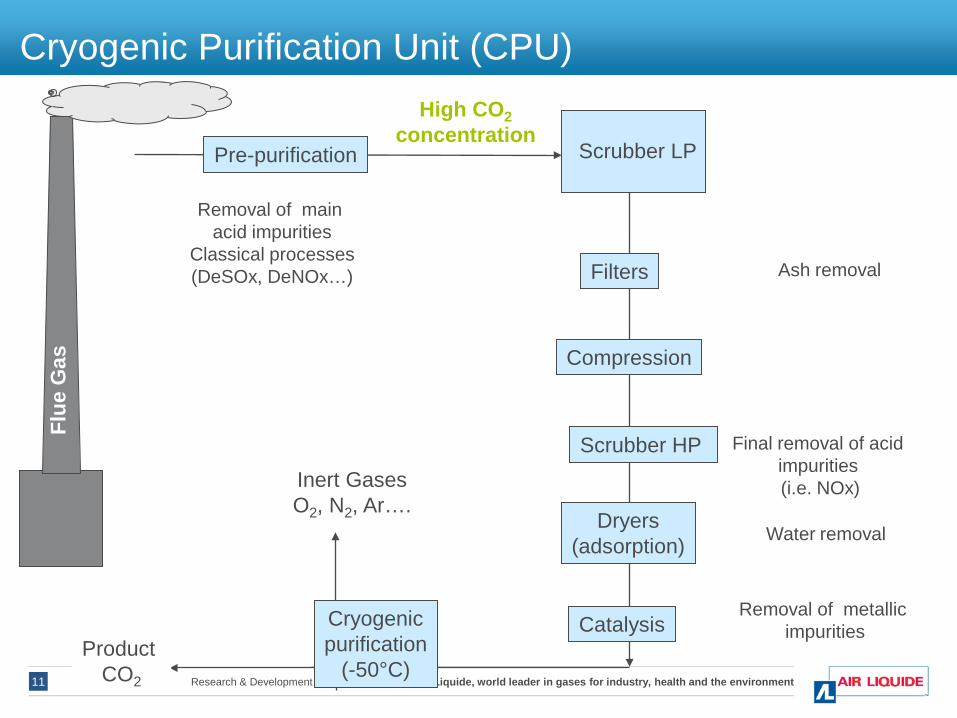
Cryogenic Purification Unit (CPU)
Liquide, world leader in gases for industry, health and the environment Research & Development 11
Pre-purification Scrubber LP
Compression
Filters
Catalysis
Scrubber HP
Cryogenic purification
(-50°C) Product
CO2
Dryers (adsorption)
Removal of main acid impurities
Classical processes (DeSOx, DeNOx…)
High CO2 concentration
Inert Gases O2, N2, Ar….
Flue
Gas
Ash removal
Final removal of acid impurities (i.e. NOx)
Water removal
Removal of metallic impurities

Presentation Outline
Oxy-combustion for Power Generation
Demonstration Project Objectives
Analytical Challenges
Analysis Campaign Results
Summary
Air Liquide, world leader in gases for industry, health and the environment Research & Development 12 2015
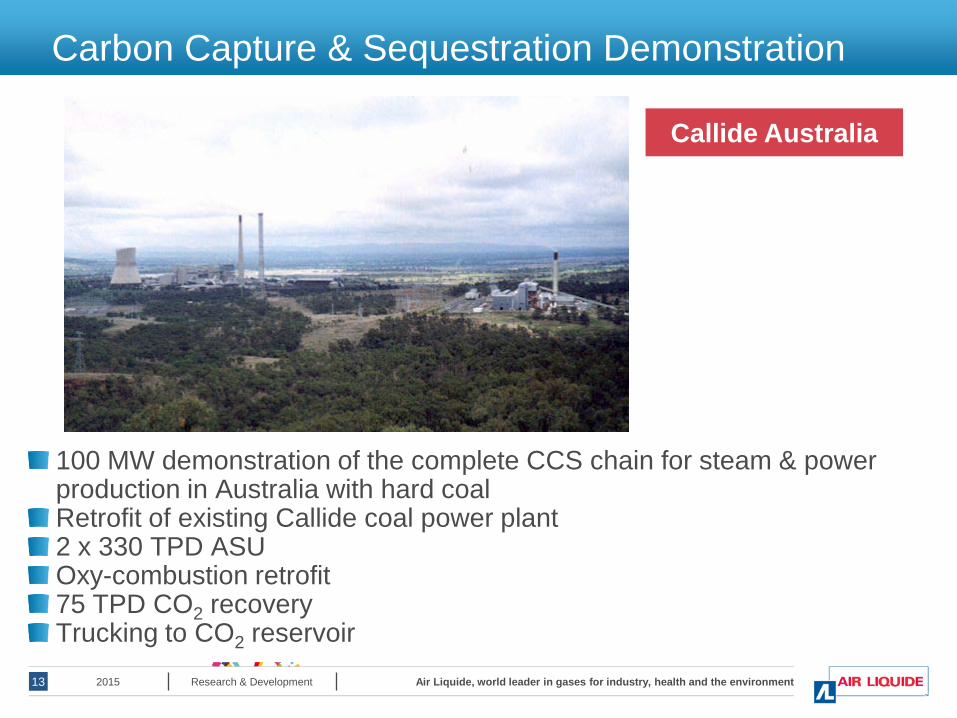
Carbon Capture & Sequestration Demonstration
Callide Australia
Air Liquide, world leader in gases for industry, health and the environment Research & Development 13
100 MW demonstration of the complete CCS chain for steam & powerproduction in Australia with hard coalRetrofit of existing Callide coal power plant2 x 330 TPD ASU Oxy-combustion retrofit75 TPD CO2 recoveryTrucking to CO2 reservoir
2015

Carbon Capture & Sequestration Demonstration
Air Liquide, world leader in gases for industry, health and the environment Research & Development 14
Objectives Validate “Near Zero Emissions” Understand & validate mass balance of “impurities” throughout the entire process • Impurity management
–Particle Matter, SOx, NOx, Hg • Equipment efficiency • Equipment sizing
Enable cost reduction and performance improvement for large scale units
Provide feed back from operation • Corrosion • Aging
2015

Presentation Outline
Oxy-combustion for Power Generation
Demonstration Project Objectives
Analytical Challenges
Analysis Campaign Results
Summary
Air Liquide, world leader in gases for industry, health and the environment Research & Development 15 2015
-
Analytical Challenges
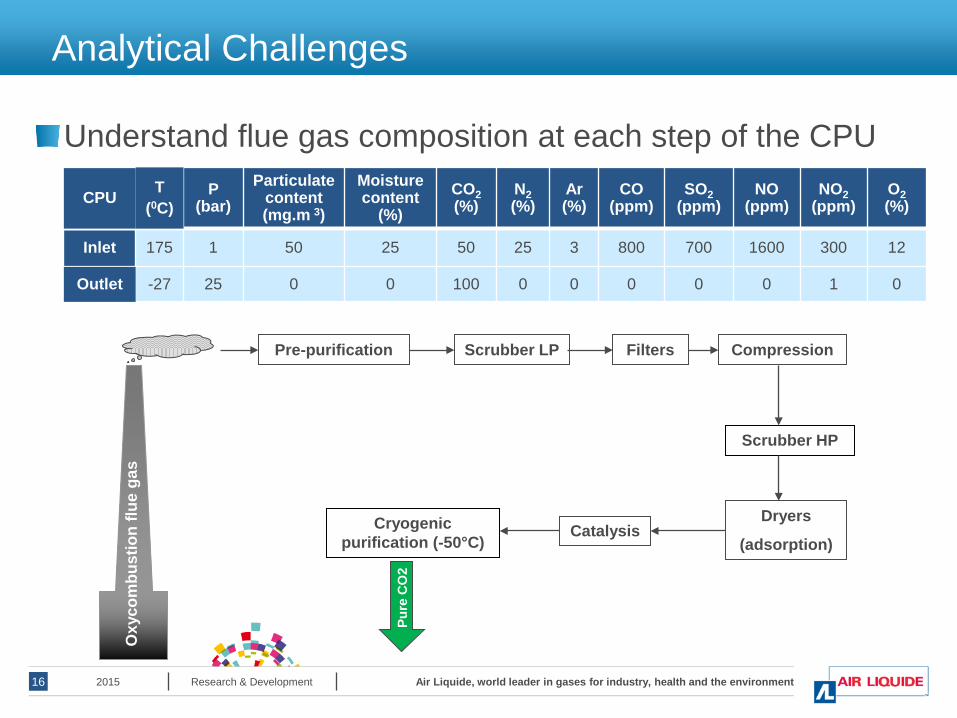
Understand flue gas composition at each step of the CPU
CPU T (0C)
P (bar)
Particulate content (mg.m 3)
Moisture content
(%) CO2 (%)
N2 (%)
Ar (%)
CO (ppm)
SO2 (ppm)
NO (ppm)
NO2 (ppm)
O2 (%)
Inlet 175 1 50 25 50 25 3 800 700 1600 300 12
Outlet -27 25 0 0 100 0 0 0 0 0 1 0
Air Liquide, world leader in gases for industry, health and the environment Research & Development 16
Oxy
com
bust
ion
flue
gas
Pre-purification Scrubber LP Filters Compression
Scrubber HP
Dryers
(adsorption) Catalysis Cryogenic
purification (-50°C)
Pure
CO
2
2015

Analytical Challenges
The analyzers need to be able to analyze multi-componentmixtures containing high levels of impurities
NOx, SOx, H2O, HCl, etc. in CO2
Since the gas composition will change as it progressesthrough the CPU
Analyzers need to detect variations with a high degree of accuracy as gas composition changes
Air Liquide, world leader in gases for industry, health and the environment Research & Development 17 2015

Analytical Challenges
Reliability of measurements MUST be validated for each analytical tool
Critical when matrix, temperature & pressure vary significantly
Air Liquide, world leader in gases for industry, health and the environment Research & Development 18 2015

Analytical Challenges – Sampling System
Sampling system for a CO2 rich flue gas over the entire process
Must be appropriately specified for accurate analysis • Wide range of conditions • Fast loops for rapid sample transfer Prior to cryogenic purification • Heated lines (up to 60 M) • Heated sample panels & specific heated
sample probes • Specific materials for Hg analysis (Teflon,
Silcosteel)
Air Liquide, world leader in gases for industry, health and the environment Research & Development 19 2015
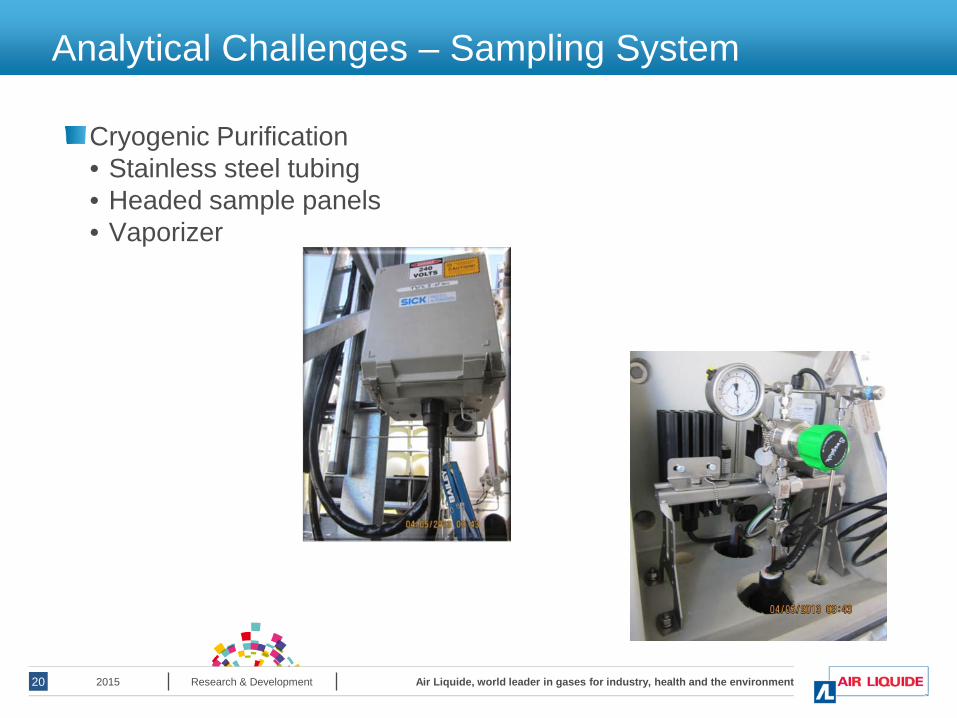
Analytical Challenges – Sampling System
Cryogenic Purification • Stainless steel tubing • Headed sample panels • Vaporizer
Air Liquide, world leader in gases for industry, health and the environment Research & Development 20 2015
Air Liquide, world leader in gases for industry, health and the environment Research & Development 21
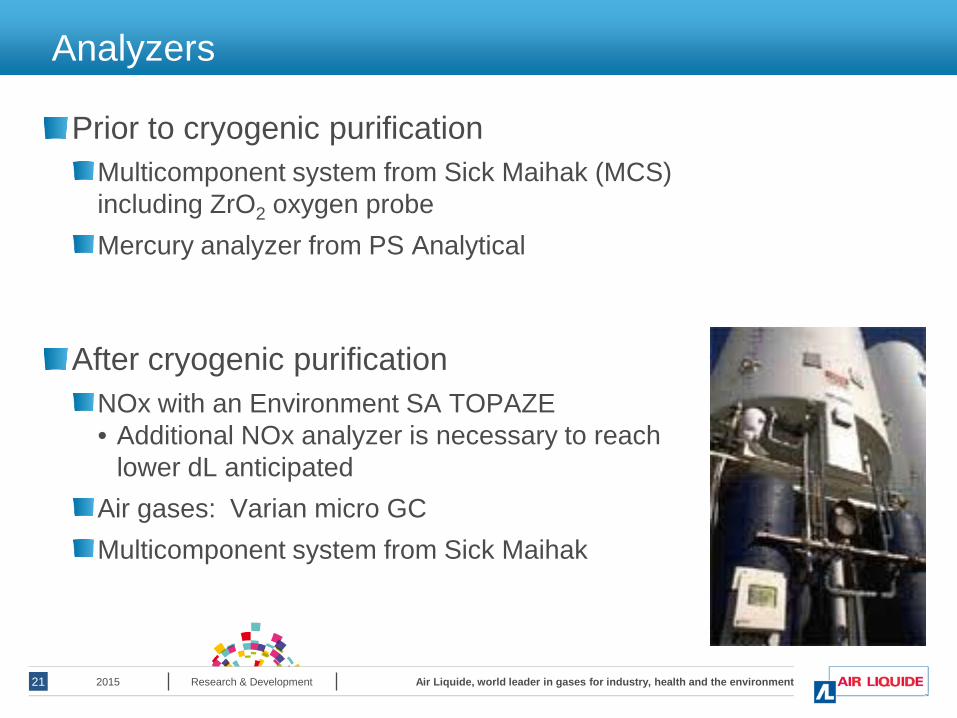
Analyzers
Prior to cryogenic purification Multicomponent system from Sick Maihak (MCS) including ZrO2 oxygen probe Mercury analyzer from PS Analytical
After cryogenic purification NOx with an Environment SA TOPAZE • Additional NOx analyzer is necessary to reach
lower dL anticipated Air gases: Varian micro GC Multicomponent system from Sick Maihak
2015
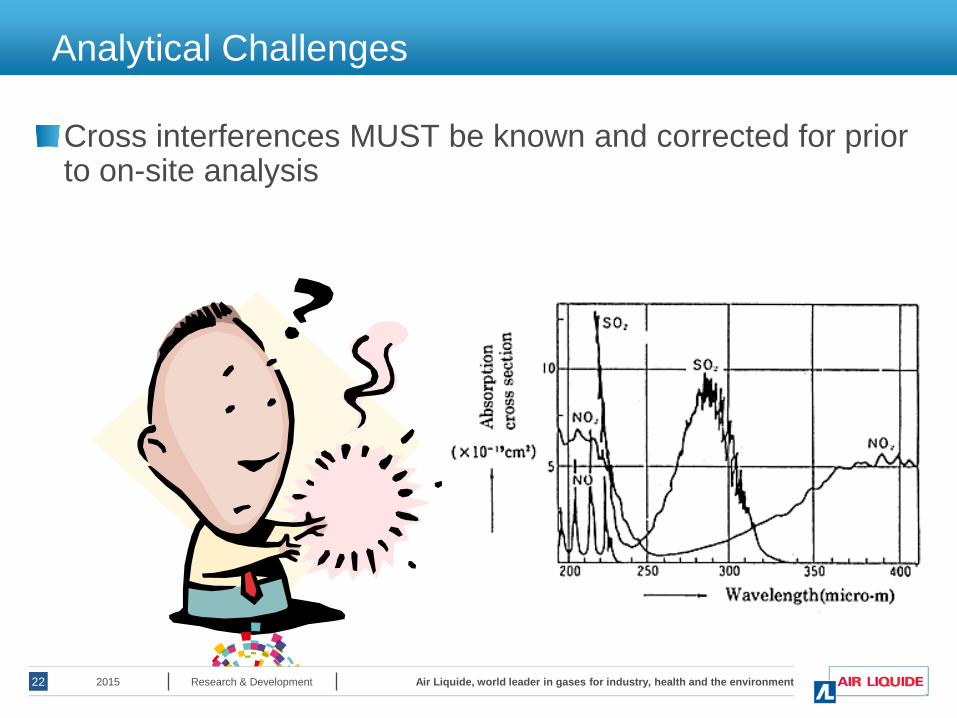
Analytical Challenges
Cross interferences MUST be known and corrected for priorto on-site analysis
Air Liquide, world leader in gases for industry, health and the environment Research & Development 22 2015

Cross Interference Identification
Synthetic gas generator Composition representative of the oxy-combustion flue gas at each step of the process • NO, NO2, SO2, HF, HCl, O2, N2, H2O, CO2 and Hg Performance of analyzers can be correctly evaluated
Air Liquide, world leader in gases for industry, health and the environmentResearch & Development23
Hg / Hg2+
generator
Moisturegenerator
Hg / Hg2+
geHg
nerator / Hg2+
generator
MoisturegeneratorMoisture generator
FFFTITITIR NR NR Niiicococollleeettt 444666000
ResResResooolllutututiiiooon:n:n: 222 cmcmcm---111
ConcConcConceeentntntrrraaatttiiiooon ran ran rannngegegesss CCCOOO === 000 ––– 222000000000 ppppppmmm NNNOOO === 000 ––– 333000000000 ppppppmmm NONONO222 = 0= 0= 0 ––– 333000000 ppppppmmm COCOCO222 === 505050 ––– 999999 %%% SOSOSOXXX = 0= 0= 0 ––– 222000000000 ppppppmmm HClHClHCl === 000 ––– 111000000 ppppppmmm HFHFHF === 000 ––– 555000 ppmppmppm
HHH222OOO = 0= 0= 0 ––– 3335 %5 %5 %
HgHgHg === 000 ––– 333000 μμμggg...mmm---333
MMMastastastererer CCCyyyllliiindendenderrrsss
2015
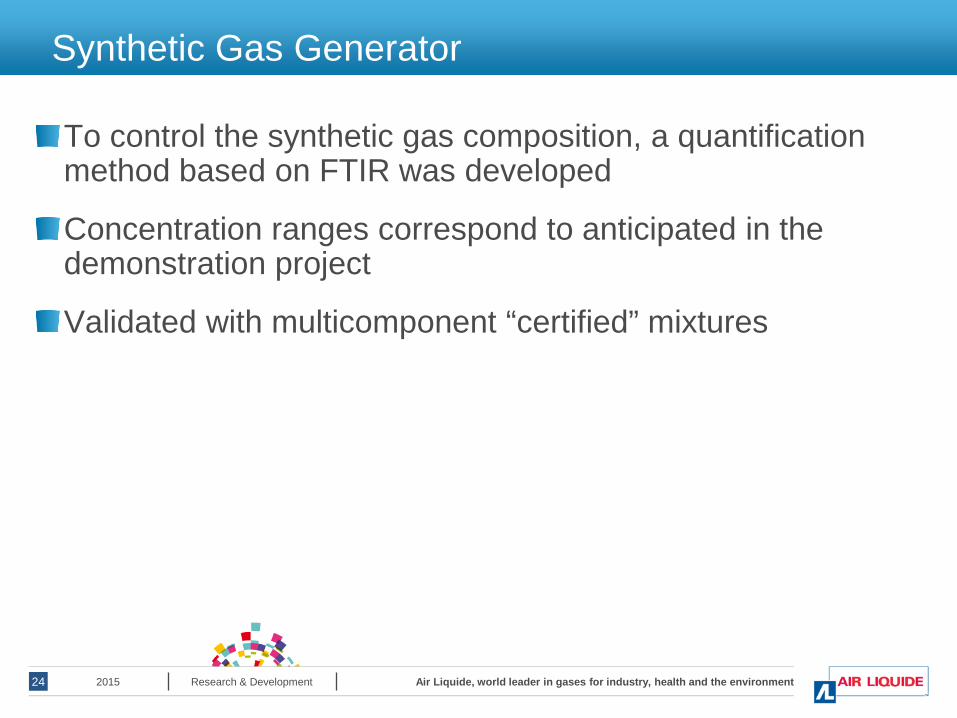
Synthetic Gas Generator
To control the synthetic gas composition, a quantification method based on FTIR was developed
Concentration ranges correspond to anticipated in the demonstration project
Validated with multicomponent “certified” mixtures
Air Liquide, world leader in gases for industry, health and the environment Research & Development 24 2015
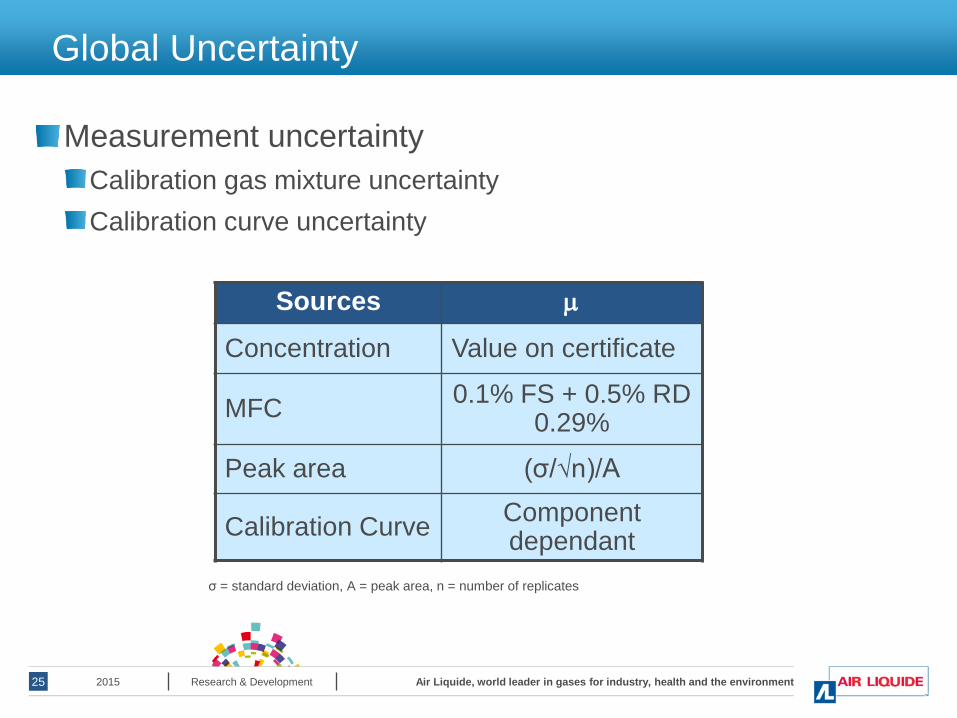
Global Uncertainty
Measurement uncertainty Calibration gas mixture uncertainty Calibration curve uncertainty
Sources µ
Concentration Value on certificate
MFC 0.1% FS + 0.5% RD 0.29%
Peak area (σ/√n)/A
Calibration Curve Componentdependant
Air Liquide, world leader in gases for industry, health and the environment Research & Development 25
σ = standard deviation, A = peak area, n = number of replicates
2015

Global Uncertainty
For the uncertainty of the calibration curve, uncertainties in dilution must also be calculated
Conc (ppm)
UCO (ppm) RSD (%)
20.5 2.0 9.6
49.8 1.5 3.0
103.3 3.9 3.7
206.6 6.2 3.0
413.2 25.4 6.2
620.0 31.4 5.1
825.8 25.5 3.1
1034.3 31.0 3.0
2070.0 65.6 3.2
Air Liquide, world leader in gases for industry, health and the environment Research & Development 26
95% confidence interval 2015

Chemiluminescence Based Analyzer
TOPAZE 32M from Environment SA
NOx analysis Potential interfering species in oxy-fuel combustion gas • CO2, H2O, CO Dedicated to analysis of “dry gas” • H2O does not considered
Use “Design of Experiments” to quantify potentialinterferences
A systematic approach to variation of a system JMP software from SAS
Air Liquide, world leader in gases for industry, health and the environment Research & Development 27 2015

Chemiluminescence Based Analyzer
Experimental plan based on JMP DOE
Air Liquide, world leader in gases for industry, health and the environment Research & Development 28
Experimental Plan
Experiment NOx (ppm)
CO (ppm)
CO2 (%)
1 36.3 500 50
2 36.3 20 95
3 554 500 95
4 36.3 500 95
5 556 500 50
6 556 20 50
7 288 260 72.5
8 554 20 95
9 36.3 20 50 2015

Chemiluminescence Based Analyzer
Effect of CO2 on NOx measurement
Air Liquide, world leader in gases for industry, health and the environment Research & Development 29 2015
Experimental Plan
Experiment NOx (ppm)
CO (ppm)
CO2 (%)
1 36.3 500 50
2 36.3 20 95
3 554 500 95
4 36.3 500 95
5 556 500 50
6 556 20 50
7 288 260 72.5
8 554 20 95
9 36.3 20 50
Experimental Results
NOx (ppm) Stdev ppm
35.39 0.52
30.84 0.07
445.89 1.81
31.18 0.06
495.36 2.99
497.75 3.09
250.52 0.11
448.08 0.92
35.86 0.56
• Concentrations of NOx and CO are
identical
• Concentration of CO2 varied
Measured NOx concentration
varies by >50ppm from theoretical
value

Chemiluminescence Based Analyzer
Effect of CO on NOx measurement
Air Liquide, world leader in gases for industry, health and the environment Research & Development 30 2015
Experimental Plan
Experiment NOx (ppm)
CO (ppm)
CO2 (%)
1 36.3 500 50
2 36.3 20 95
3 554 500 95
4 36.3 500 95
5 556 500 50
6 556 20 50
7 288 260 72.5
8 554 20 95
9 36.3 20 50
Experimental Results
NOx (ppm) Stdev ppm
35.39 0.52
30.84 0.07
445.89 1.81
31.18 0.06
495.36 2.99
497.75 3.09
250.52 0.11
448.08 0.92
35.86 0.56
• Concentrations of NOx and CO2
are identical
• Concentration of CO varied
Negligible variation in
measured NOx concentration

Chemiluminescence Based Analyzer
Key result: CO2 concentration in the gas stream hassignificant impact on NOx measurement
RResuesullttss ststatatiiststiicalcalllyy ssiiggnniifificcaannttModelModelModelModel
Y(Y(NONOxx)) == CConsonstt + a+ a[[NONOxx] +] + bb[C[COO22] +] + cc[[NONOxx][C][COO22]]
CO2 concentration must be known to use the correction
Air Liquide, world leader in gases for industry, health and the environmentResearch & Development31 2015

DOE for NDIR Based Measurements
Potential interfering species
Components Interfering Components
NO NO2 CO CO2 SO2 HCl H2O
NO X X X
NO2 X X X
CO X
CO2
SO2 X HCl X H2O X X X
Validate manufacturers internal corrections
32 Air Liquide, world leader in gases for industry, health and the environment Research & Development 2015

NDIR Based Analyzer: MCS
Air Liquide, world leader in gases for industry, health and the environment Research & Development 33
Experiment NO (ppm) NO2 (ppm)
SO2 (ppm)
CO (ppm)
HCl (ppm)
H2O (%)
4 C theo Cexp σ
100.00 107.94 0.88
250.00 246.80 0.56
600.00 607.21 5.03
550.00 560.51 0.51
30.00 25.61 0.67
2.00 2.81 0.03
14 C theo Cexp σ
100.00 112.91 0.81
250.00 206.19 1.17
600.00 636.34 0.90
50.00 37.09 01.3
30.00 24.57 0.32
20.00 20.11 0.02
10
C theo Cexp σ
1500.00 1620.03
1.58
250.00 249.15 2.64
50.00 550.00 571.30 0.36
30.00 24.26 0.16
20.00 19.73 0.06
16
C theo Cexp σ
100.00 113.36 0.77
250.00 190.76 1.68
50.00 77.49 6.06
550.00 580.72 2.02
2.00 20.00 20.04 0.33
2015
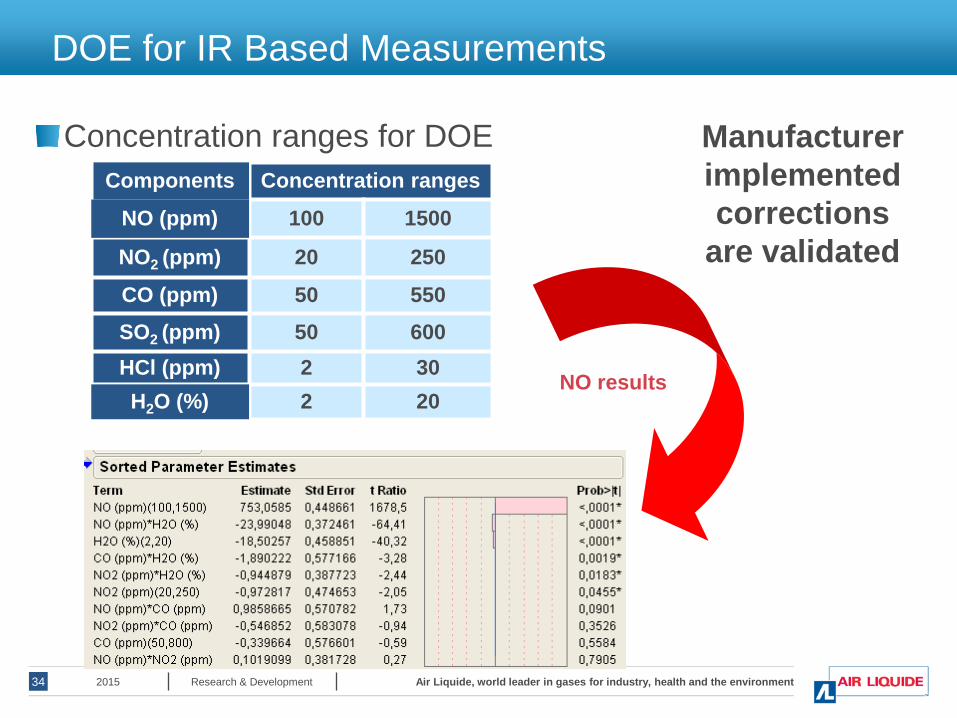
DOE for IR Based Measurements
Concentration ranges for DOE Manufacturer Components Concentration ranges
NO (ppm) 100 1500
NO2 (ppm) 20 250
CO (ppm) 50 550
SO2 (ppm) 50 600 HCl (ppm) 2 30 H2O (%) 2 20
Air Liquide, world leader in gases for industry, health and the environment Research & Development 34
implemented corrections
are validated
NO results
2015

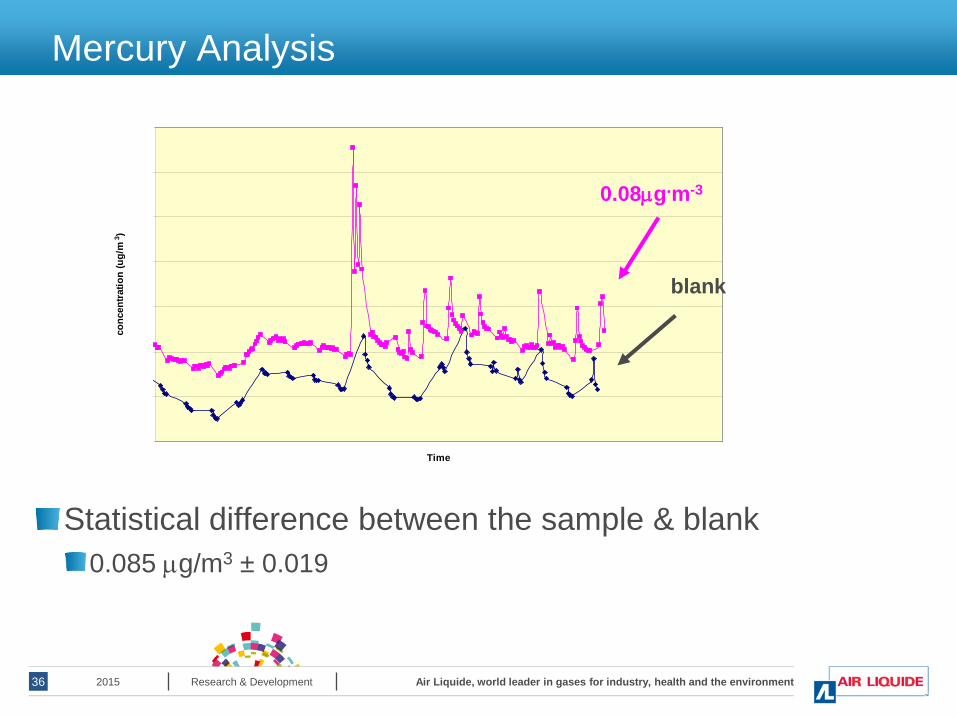
Mercury Analysis
Detection limit validation 0.08 µg/m3 elemental Hg generated using the calibration system of the mercury analyzer Connected to multi-component mixer
Measurements made on mercury analyzer • 10 minute collection time • Alternating analysis sequence
–5 blanks –10 samples
Air Liquide, world leader in gases for industry, health and the environment Research & Development 35 2015
-0.35
-0.25
-0.15
-0.05
0.05
0.15
0.25
0.35
Mercury Analysis
conc
entra
tion
(ug/
m 3 )
blank
0.08µg.m-3
Time
Statistical difference between the sample & blank 0.085 µg/m3 ± 0.019
Air Liquide, world leader in gases for industry, health and the environment Research & Development 36 2015

Mercury Analysis
Balance gas comparison HovaCal system used to generate Hg vapor from Hg(NO3)2
CO2 or N2 was mixed at a total flow of 3 L/min into analyzer
Balance gas
Average concentration
(µg/m3)
Standard deviation (µg/m3)
N2 34.5 3.1 CO2 37.2 3.6
Data is statistically insignificant
Air Liquide, world leader in gases for industry, health and the environment Research & Development 37 2015

Air Liquide, world leader in gases for industry, health and the environment Research & Development 38
Mercury Analysis
Catalyst conversion rate Probe is used to sample gas from process stream Contains a catalyst chamber at 700oC • Convert Hg2+ to Hgo
At ambient temperatures, Hg2+ will not be converted • Can not simultaneously measure Hgo & Hg2+
Aqueous solutions of oxidized & elemental mercury generated with HovaCal system Same concentrations (5*10-6 g.mol-1)
2015

Mercury Analysis
Catalyst conversion rate 30 replicate analyses
Average concentration (µg/m3)
Standard deviation (µg/m3)
Hgo 53.4 4.7
Hg2+ 33.8 2.8
60% difference between elemental & oxidized form Hg2+ is not totally converted by catalyst
Uncertainty of total Hg measurements will be highLooking into alternative solutions
Proportion of Hg2+ in the flue gas is unknown and conversion efficiencyis significantly below 100%
Air Liquide, world leader in gases for industry, health and the environment Research & Development 39 2015

Presentation Outline
Oxy-combustion for Power Generation
Demonstration Project Objectives
Analytical Challenges
Analysis Campaign Results
Summary
Air Liquide, world leader in gases for industry, health and the environmentResearch & Development40 20152015

Analysis Campaigns – Multi-Component Analyzer Multi-Component analyzer based on NDIR
Good results obtained over the whole process on specified sample points Correlations found between NO, CO and O2 concentrations at CPU inlet
NO
and
CO
con
cent
ratio
ns (p
pm)
O2 C
oncentration (%)
Linked to combustion conditions in the boiler
Time
Air Liquide, world leader in gases for industry, health and the environment Research & Development 41 2015

Analysis Campaigns – Operation Conditions Influence
Analysis of the same flue gas at two different sample points
Different results of CO2 concentrations depending on process conditions
Air Liquide, world leader in gases for industry, health and the environment Research & Development 42
Unstable process conditions
Dryer outlet - MCS Dryer outlet – process analyzer De-Nox column inlet – GC/TCD Importance of:
- sample point location- process conditions
2015

Analysis Campaign – Multi-component Analyzer
Air Liquide, world leader in gases for industry, health and the environment Research & Development 43
Multi-Component analyzer based on NDIR Good results obtained over the whole process on specified sample points, however….. Measurement of SO2 concentration at the LP scrubber outlet gave inconsistent results • Process NDIR >10ppm SO2
–Not part of R&D analytical system • Other methods <1ppm
Consequence • High SO2 level will trip the plant
Which is the correct value?
2015

Analysis Campaign – Multi-component Analyzer Test with calibration gas cylinders on the process analyzer
Gas Cylinder SO2 reading (ppmv) CO2 reading (%)
55% CO2 balance N2
6.6 55.2
75% CO2 balance N2
24.3 76.8
100% N2 0 0
CO2 interference Manufacturer’s Correction model underestimated
Manufacturer contacted and updated correction model installed
Significance of prework clearly validated
Air Liquide, world leader in gases for industry, health and the environment Research & Development 44 2015
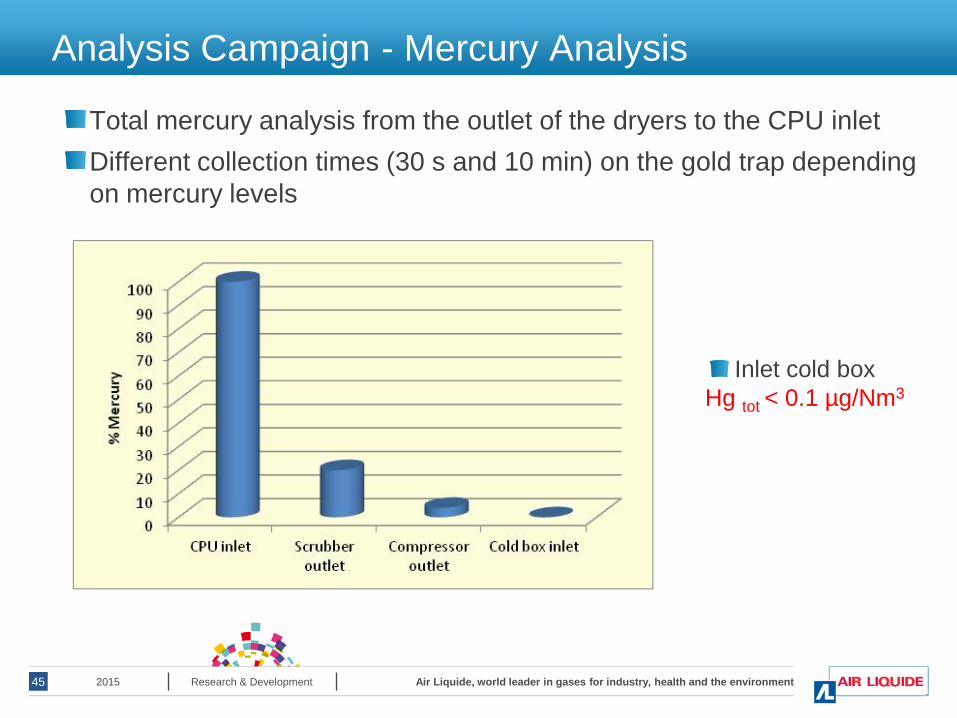
Analysis Campaign - Mercury Analysis
Total mercury analysis from the outlet of the dryers to the CPU inlet Different collection times (30 s and 10 min) on the gold trap depending on mercury levels
Hg tot
Inlet cold box < 0.1 µg/Nm3
Air Liquide, world leader in gases for industry, health and the environment Research & Development 45 2015
Analysis Campaign – CO2 Product Analysis
Ar, O2, N2, CO and CO2 analysis Frequent column reconditioning for good resolution of Ar/O2 peaks Determination of % levels O2 as well as low O2 concentrations
NO/NOx analysis Concentration levels between low ppm to low % levels
Air Liquide, world leader in gases for industry, health and the environment Research & Development 46 2015

Analysis Campaign – CO2 Product Analysis
Results
Good analytical measurements obtained on site
High purity CO2 achieved at the CPU outlet
Analysis of the CO2 gas product Component Concentration
CO2 >99.9% vol
SO2 <1ppmv
NOx <20ppmv
H2O <20ppmv
O2 <30ppmv
Air Liquide, world leader in gases for industry, health and the environment Research & Development 47 2015

Presentation Outline
Oxy-combustion for Power Generation
Demonstration Project Objectives
Analytical Challenges
Analysis Campaign Results
Air Liquide, world leader in gases for industry, health and the environment Research & Development 48
Summary
2015

Summary
Reliable results were obtained owing to prior analyzerevaluation
Data obtained helped to better understand the CPU
Performances of the CPU were as expected
Calide pilot test results are a good contribution to furtherdemonstration projects
Demonstration of concept with more than 5500 hours ofoperation
Air Liquide, world leader in gases for industry, health and the environment Research & Development 49 2015

Collide
'Xyfuel Projec~
• AIR LIQUIDE
Acknowledgements
2015 Research & Development Air Liquide, world leader in gases for industry, health and the environment 50

Research & Development
Opening new ways
THANK YOU FOR YOUR ATTENTION
Air Liquide, world leader in gases for industry, health and the environment Research & Development 51 2015
Top Related