


Languages
Pages
Legal

OREGON WINEINDUSTRY STATISTICS
UPDATED 2.21.17
THE SECRET'S OUT: OREGON IS AN EXTRAORDINARY PLACE FOR WINE.
Oregon’s grapegrowers and winemakers continue to raise the bar through their commitment to sustainability, artisan practices and making wines that stand among the world’s best.
And the world has noticed.
INDUSTRY STATISTICSINDUSTRY STATISTICSOregon Wine Board
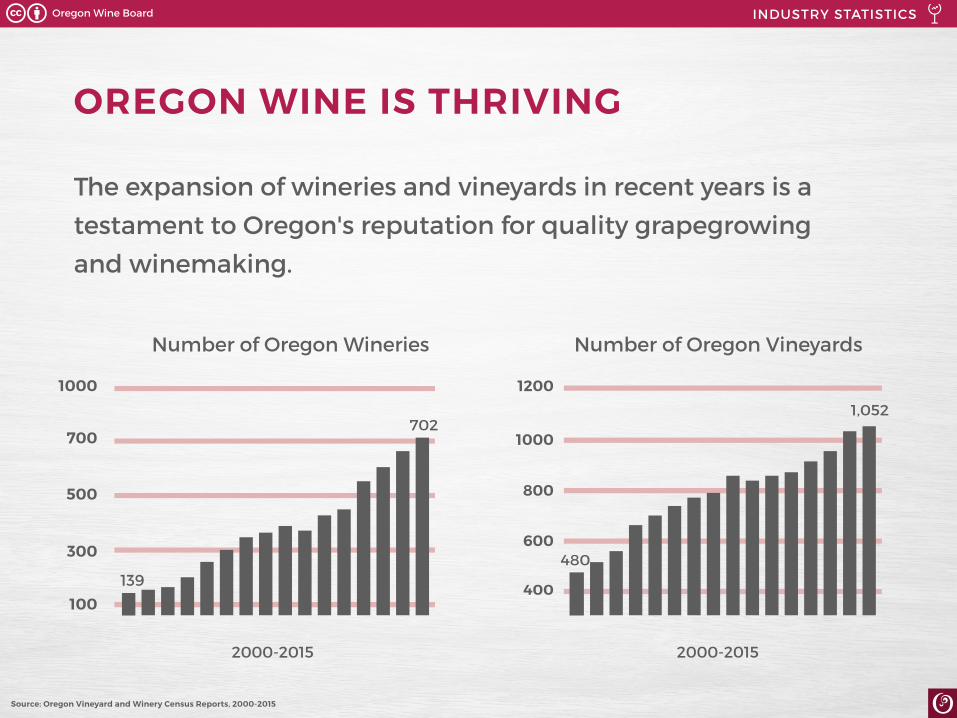
OREGON WINE IS THRIVING
The expansion of wineries and vineyards in recent years is a
testament to Oregon's reputation for quality grapegrowing
and winemaking.
INDUSTRY STATISTICS
Source: Oregon Vineyard and Winery Census Reports, 2000-2015
Number of Oregon Wineries
2000-2015
700
1000
500
300
100139
702
Number of Oregon Vineyards
1000
1200
800
600
400
2000-2015
480
1,052
INDUSTRY STATISTICSOregon Wine Board
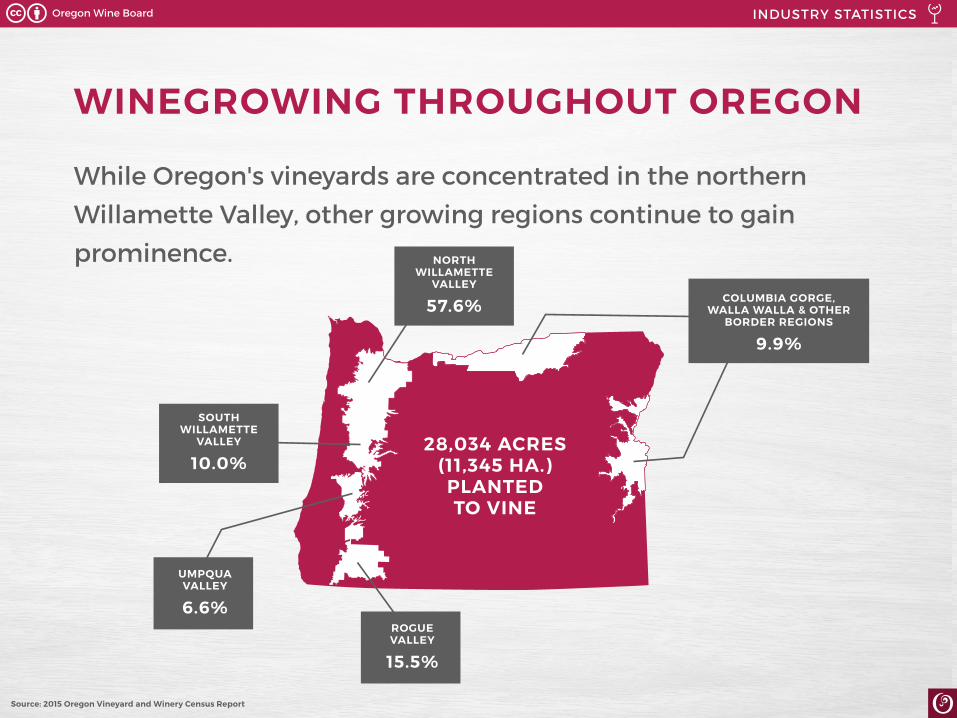
WINEGROWING THROUGHOUT OREGON
While Oregon's vineyards are concentrated in the northern
Willamette Valley, other growing regions continue to gain
prominence.
SOUTHWILLAMETTE
VALLEY
10.0%
ROGUEVALLEY
15.5%
UMPQUAVALLEY
6.6%
COLUMBIA GORGE, WALLA WALLA & OTHER
BORDER REGIONS
9.9%
INDUSTRY STATISTICS
Source: 2015 Oregon Vineyard and Winery Census Report
28,034 ACRES (11,345 HA.)
PLANTED TO VINE
NORTH WILLAMETTE
VALLEY
57.6%
INDUSTRY STATISTICSOregon Wine Board
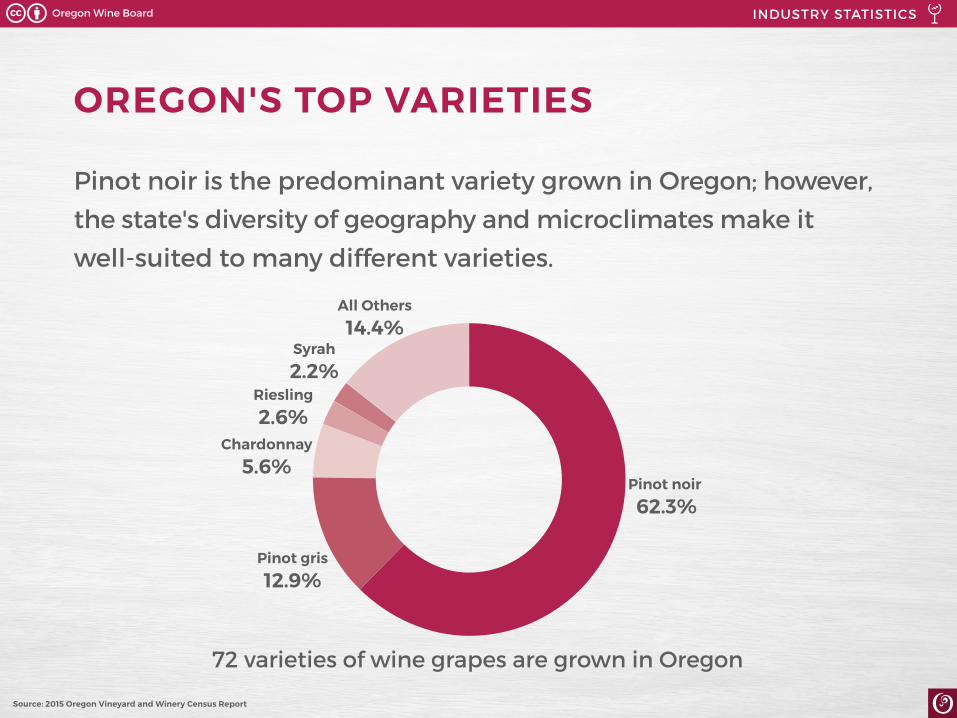
OREGON'S TOP VARIETIES
Pinot noir is the predominant variety grown in Oregon; however,
the state's diversity of geography and microclimates make it
well-suited to many different varieties.
Pinot noir
62.3%
All Others
14.4%Syrah
2.2%Riesling
2.6%Chardonnay
5.6%
Pinot gris
12.9%
INDUSTRY STATISTICS
Source: 2015 Oregon Vineyard and Winery Census Report
72 varieties of wine grapes are grown in Oregon
INDUSTRY STATISTICSOregon Wine Board
– PAUL GREGUTT
Wine Enthusiast
Oregon’s modern winemaking era recently
passed the half century mark, and it’s really just
in the past two decades that its industry growth
has accelerated… Oregon’s grape growers and
vintners have accomplished near miracles in a
very short time.
INDUSTRY STATISTICS
January 2016
INDUSTRY STATISTICSOregon Wine Board
SOURCES: 2014 OLCC License Data, 2014 Oregon Vineyard & Winery Census Report, Wine Spectator Total 2014 Scores, The Wine Advocate Total 2014 Scores, 2015 Oregon Sustainable Acreage Report
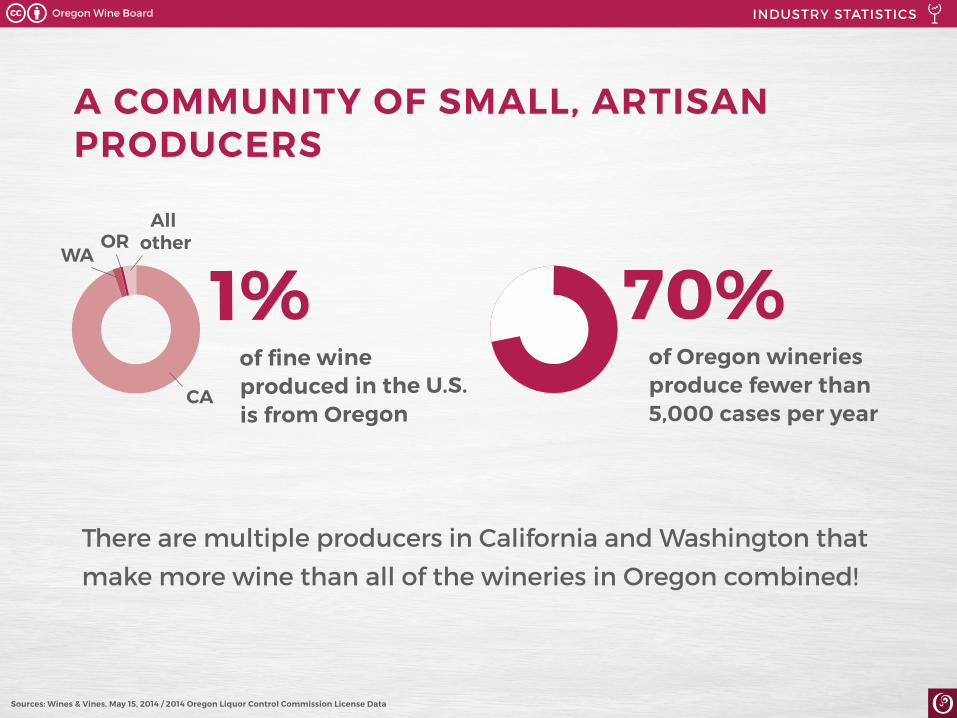
A COMMUNITY OF SMALL, ARTISAN PRODUCERS
INDUSTRY STATISTICS
Sources: Wines & Vines, May 15, 2014 / 2014 Oregon Liquor Control Commission License Data
of Oregon wineries produce fewer than 5,000 cases per year
70%of fine wineproduced in the U.S. is from Oregon
1%
There are multiple producers in California and Washington that
make more wine than all of the wineries in Oregon combined!
CA
All other
WAOR
INDUSTRY STATISTICSOregon Wine Board
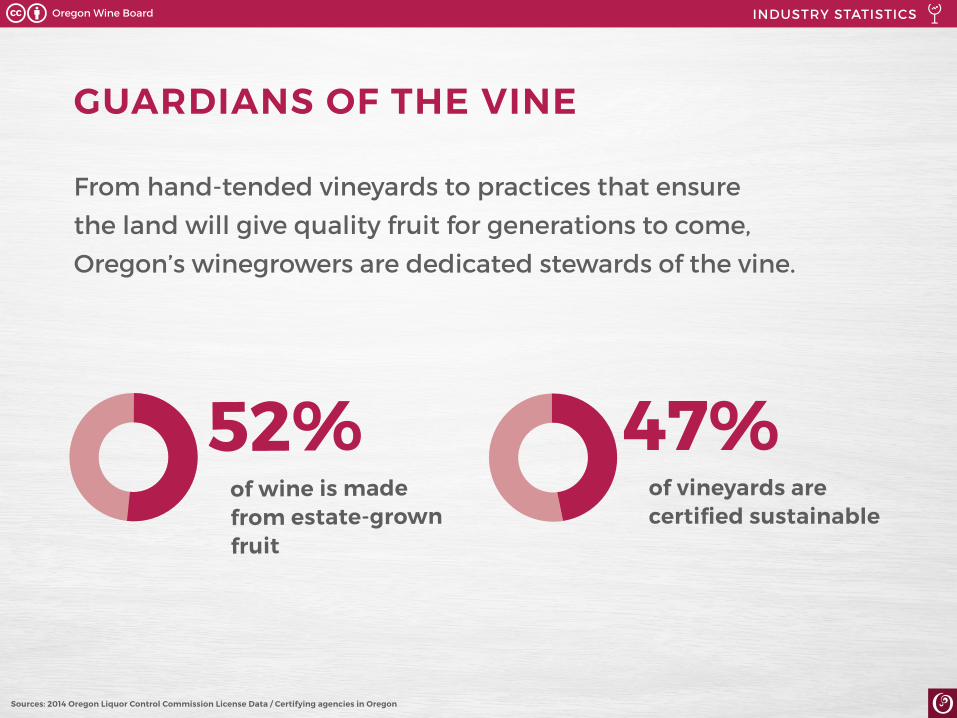
GUARDIANS OF THE VINE
From hand-tended vineyards to practices that ensure
the land will give quality fruit for generations to come,
Oregon’s winegrowers are dedicated stewards of the vine.
of vineyards are certified sustainable
47%of wine is made from estate-grown fruit
52%
INDUSTRY STATISTICS
Sources: 2014 Oregon Liquor Control Commission License Data / Certifying agencies in Oregon
INDUSTRY STATISTICSOregon Wine Board
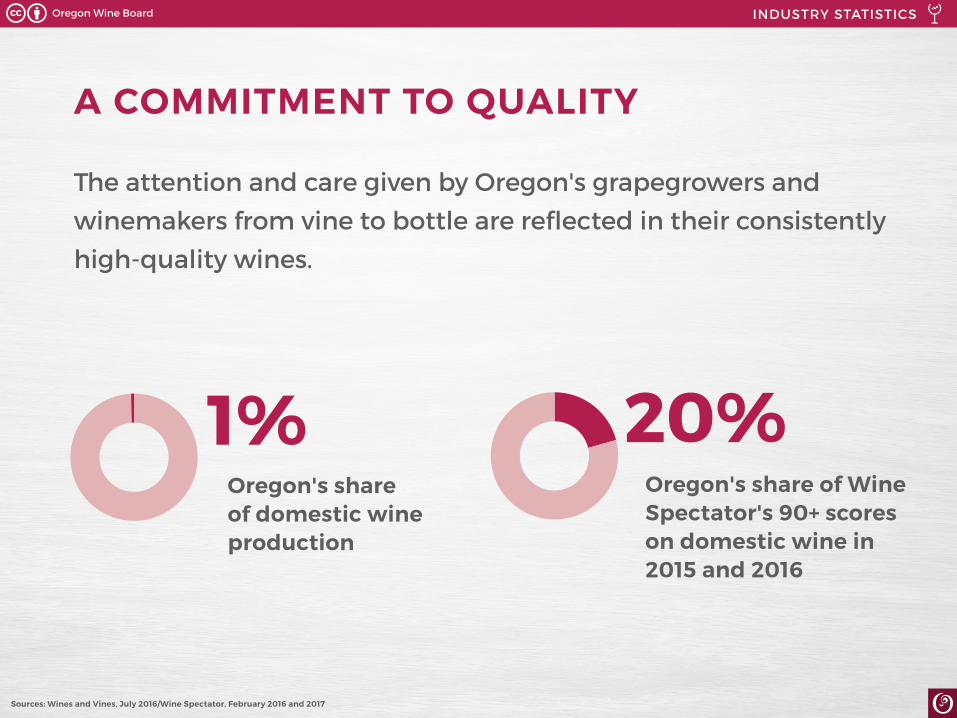
A COMMITMENT TO QUALITY
The attention and care given by Oregon's grapegrowers and
winemakers from vine to bottle are reflected in their consistently
high-quality wines.
Oregon's share of Wine Spectator's 90+ scores on domestic wine in 2015 and 2016
20%Oregon's share of domestic wine production
1%
INDUSTRY STATISTICS
Sources: Wines and Vines, July 2016/Wine Spectator, February 2016 and 2017
INDUSTRY STATISTICSOregon Wine Board
– GREGORY DAL PIAZ
Snooth
I can't think of another region that is producing such a compelling
collection of pure, vibrant, varietally correct wines that excite the palate
and please the pocketbook.
INDUSTRY STATISTICS
November 2013
INDUSTRY STATISTICSOregon Wine Board
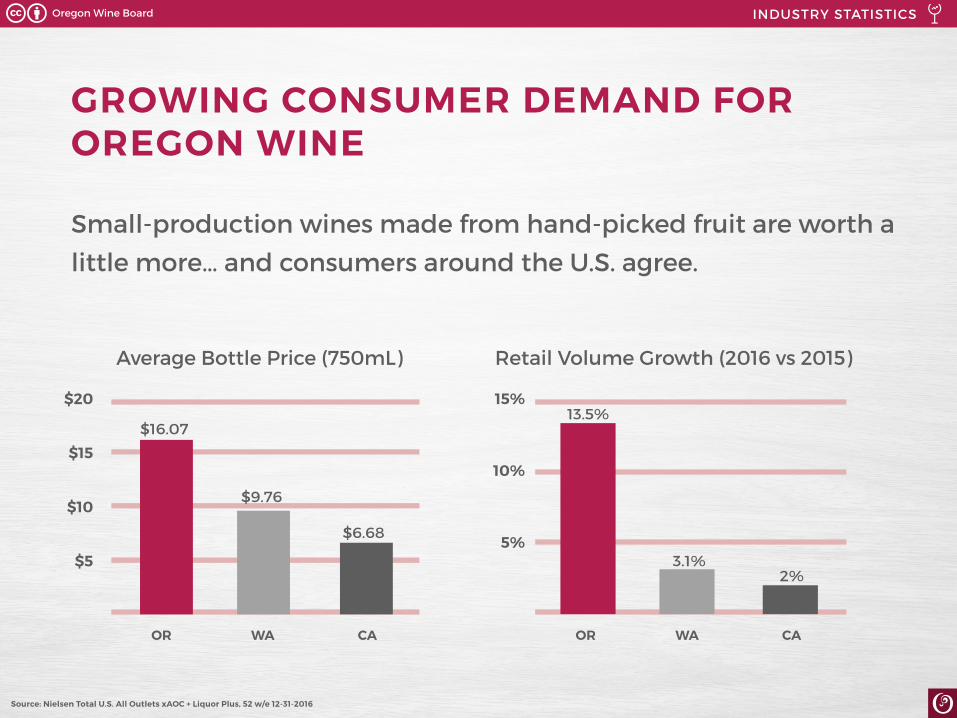
GROWING CONSUMER DEMAND FOR OREGON WINE
Small-production wines made from hand-picked fruit are worth a
little more… and consumers around the U.S. agree.
INDUSTRY STATISTICS
Source: Nielsen Total U.S. All Outlets xAOC + Liquor Plus, 52 w/e 12-31-2016
Average Bottle Price (750mL)
$5
$10
$15
$20
$6.68
$9.76
$16.07
OR WA CA
Retail Volume Growth (2016 vs 2015)
5%
10%
15%13.5%
3.1%2%
OR WA CA
INDUSTRY STATISTICSOregon Wine Board
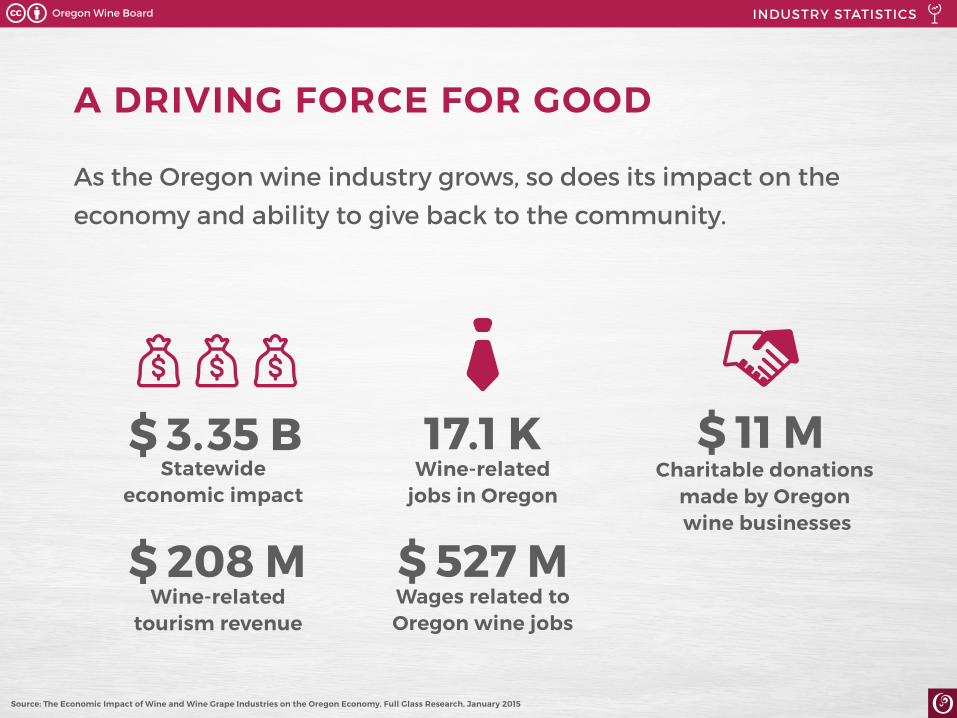
A DRIVING FORCE FOR GOOD
As the Oregon wine industry grows, so does its impact on the
economy and ability to give back to the community.
$ 3.35 B Statewide
economic impact
$ 208 M Wine-related
tourism revenue
$ 11 MCharitable donations
made by Oregon wine businesses
17.1 KWine-related
jobs in Oregon
$ 527 MWages related to Oregon wine jobs
INDUSTRY STATISTICS
Source: The Economic Impact of Wine and Wine Grape Industries on the Oregon Economy, Full Glass Research, January 2015
INDUSTRY STATISTICSOregon Wine Board

– ROBERT M. PARKER, JR.
Food & Wine
Oregon is finally fulfilling its vast potential.
INDUSTRY STATISTICS
February 2013
INDUSTRY STATISTICSOregon Wine Board
Top Related