


Languages
Pages
Legal

Oregon Commercial and Recreational Fishing Industry Economic Activity Coastwide and in Proximity to Marine
Reserve Sites for Years 2016 and 2017
Dungeness crab pots queued for season opening in Newport, Oregon. Photo credit ODFW.
Oregon Department of Fish and Wildlife
Reproduction of Material Authorization is granted for the report contents to be quoted either orally or in written form without the prior consent of the authors. Customary reference to authorship, however, is requested. Suggested Citation The Research Group, LLC. Oregon Commercial and Recreational Fishing Industry Economic Activity Coastwide and in Proximity to Marine Reserve Sites for Years 2016 and 2017. Prepared for Marine Reserve Program, Oregon Department of Fish and Wildlife. November 2018.
Oregon Commercial and Recreational Fishing Industry Economic Activity Coastwide and in Proximity to Marine
Reserve Sites for Years 2016 and 2017
Version 1.7
prepared by
The Research Group, LLC Corvallis, Oregon
prepared for
Marine Reserve Program Oregon Department of Fish and Wildlife
November 2018

(this page intentionally left blank)

i
Preface
This report was sponsored by the Marine Reserve Program (MR Program), Oregon Department of Fish and Wildlife (ODFW). The report was prepared by The Research Group, LLC, Corvallis, Oregon. Shannon Davis was the lead author who was greatly assisted by Kari Olsen. The author and not the sponsors is solely responsible for analysis methods, interpretations, and conclusions. The author has completed other MR effect analysis projects for ODFW. This report advances material from those projects in a paraphrasing and non-attributed writing style for readability reasons. When reports are referenced, full citations are included in a bibliography chapter. The ODFW Marine Resource Program fish managers and staff need to be acknowledged for their help in generating the summary fisheries descriptions. Tommy Swearingen (MR human dimension project leader) and Troy Buell (fisheries management project leader) were especially helpful. Data was provided by Eric Schindler (Ocean Recreational Boat Survey), Shari Beals (Salmon-Steelhead, Halibut, and Sturgeon Tag Return Program), Jimmy Watts (Columbia River Creel Program), and Brian Riggers and Shelly Miller (both from the Coastal Chinook Research and Monitoring Program). ODFW coastal district fish biologists also assisted. The federal agency people providing information and advice include Robin Ehlke (Pacific Fishery Management Council (PFMC) salmon fishery officer), John Devore (PFMC groundfish fishery officer), Brad Stenberg (Pacific States Marine Fisheries Commission (PSMFC) PacFIN representative), and Steve Williams (PSMFC RecFIN representative). Hans Radtke (natural resource consulting economist), Gil Sylvia (Marine Resource Economist and OSU Coastal Oregon Marine Experiment Station (COMES) Director), and Chris Carter (retired ODFW economist) provided valuable guidance and insight in the development of methods and review of draft material. The authors do not make any warranties with respect to the project including fitness for any particular purpose. In no event shall the authors assume any liability for use of the program or derived information and shall not be responsible for any direct, indirect, or consequential damages that might arise from application.
ii
Table of Contents
Preface Table of Contents Glossary Executive Summary I. Introduction II. Commercial Fisheries III. Marine Recreational Fisheries
A. Methods B. Description C. Discussion
IV. Nearshore Fisheries
A. Overview B. Fleet Characteristics C. Fisheries Engagement D. Marine Reserve Fisheries
V. Bibliography
List of Tables, Figures, and Maps
Figure ES.1: Economic Contributions From Onshore Landings in 1973 to 2017 and Distant Water Fisheries in 1986 to 2017
Figure ES.2: Oregon Selected Commercial Fisheries Volume and Price Annual Change for 2016 and 2017
Figure ES.3: Recreational Angler Days for the Study Selected Fisheries in 1976 to 2017 Figure ES.4: Recreational Ocean and Inland Fisheries Economic Contribution Shares for 2017 Figure ES.5: Oregon Fishing Industry Economic Contribution and Nearshore Fisheries
Component in 2016 Table ES.1: Marine Reserve Sites Annual Average Regional Economic Impacts From
Assessed and Displaced Commercial and Recreational Fisheries for 2013-2015 Map I.1: Salmon Fishery Management Areas and Port Group Regions Map I.2: Recreational Sampling Sections on the Columbia River Below Bonneville Dam Map I.3: Coastal Basins Within the Oregon Coastal Multispecies Conservation and
Management Plan Area Map I.4: Oregon Marine Reserve Sites
iii
Table of Contents (cont.)
Table II.1: Oregon Harvest Volume and Value by Fishery for Five-Year Average, 2016, and 2017
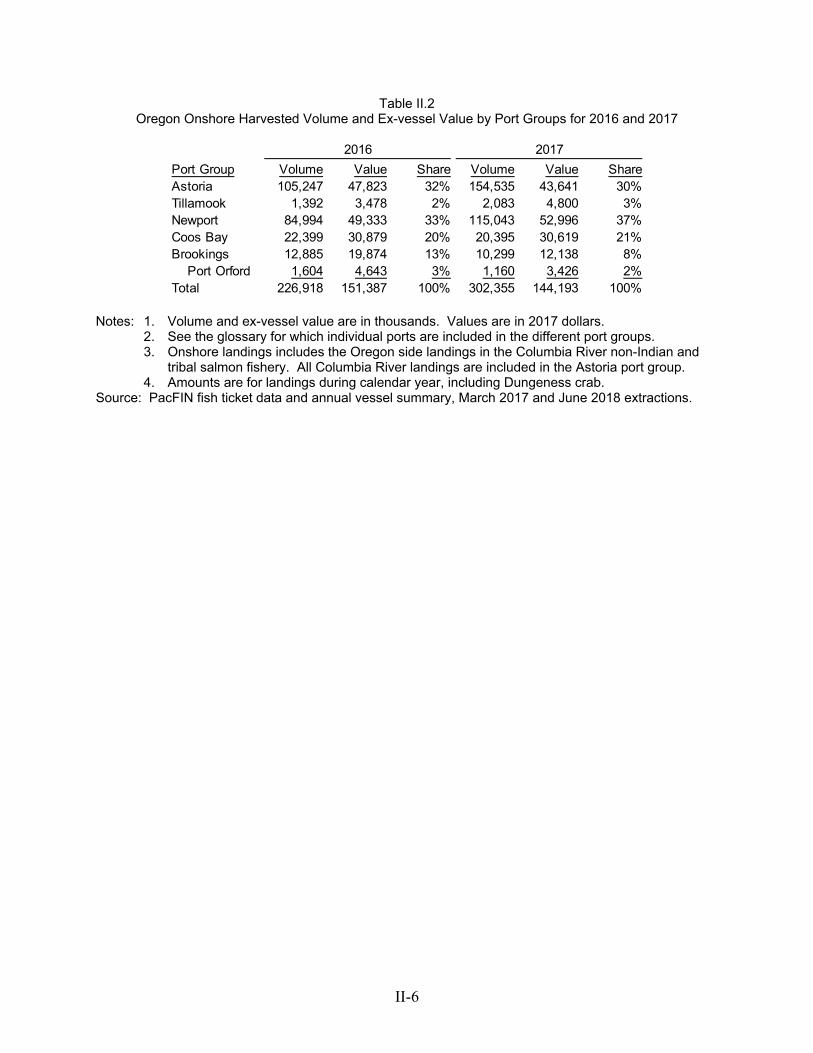
Table II.2: Oregon Onshore Harvested Volume and Ex-vessel Value by Port Groups for 2016 and 2017
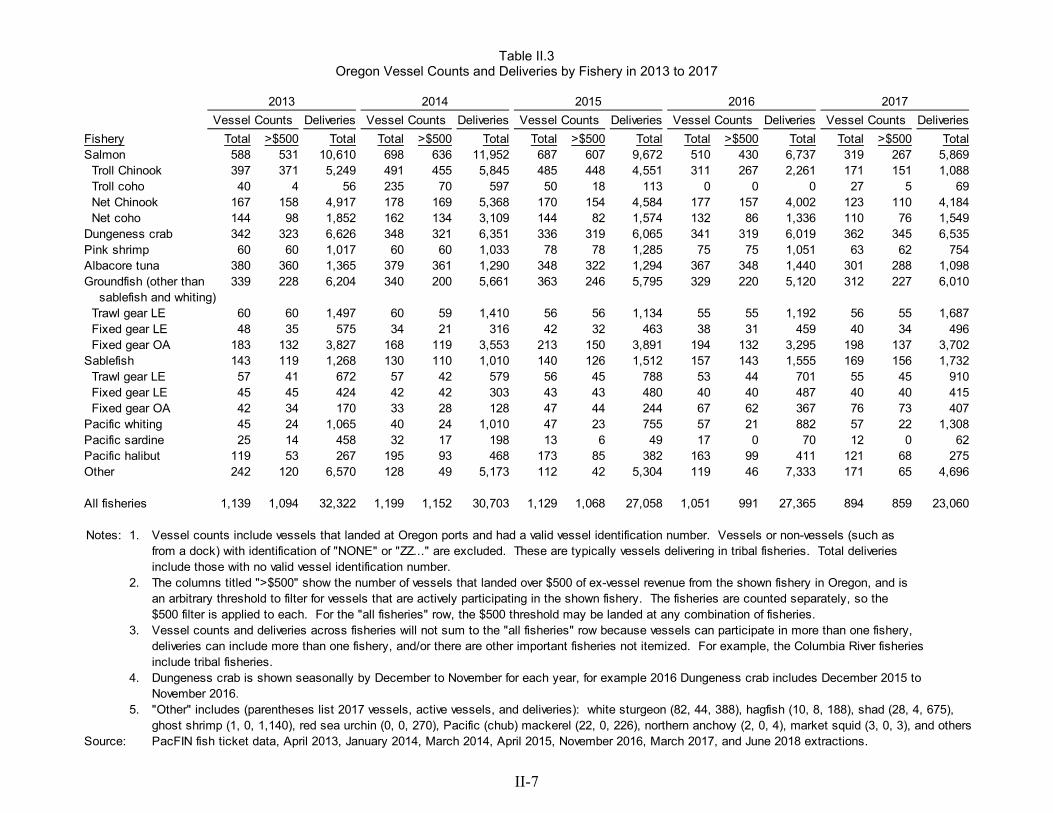
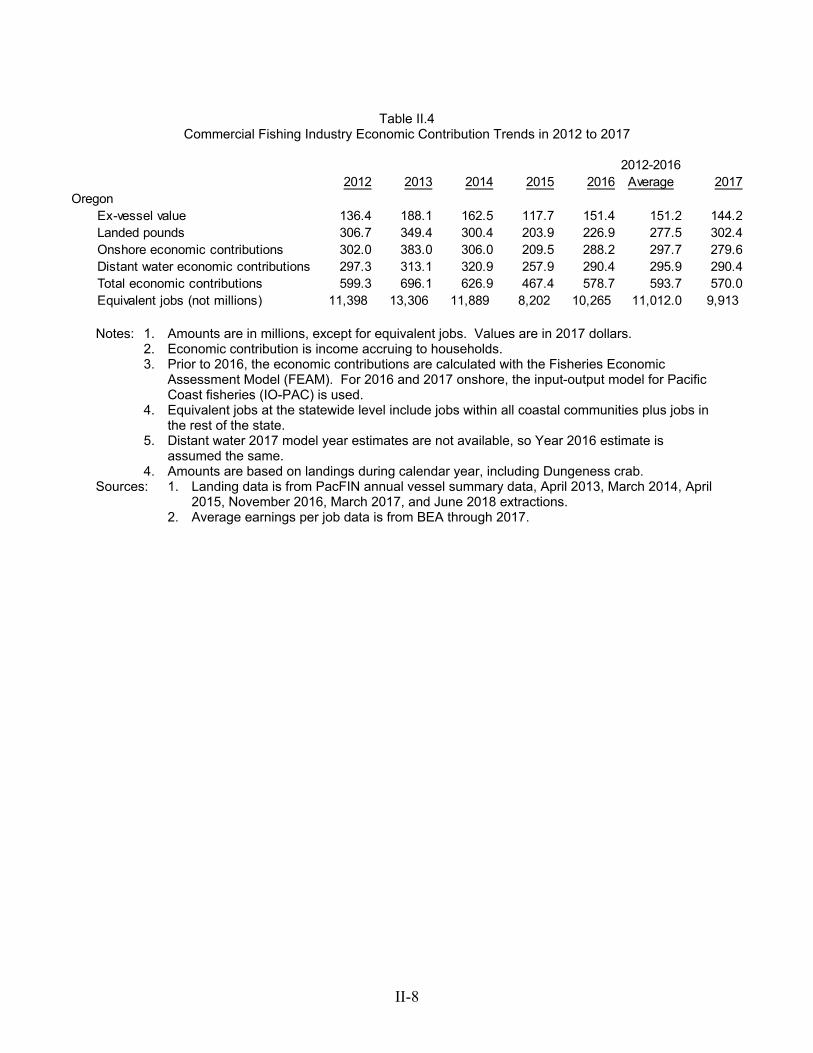
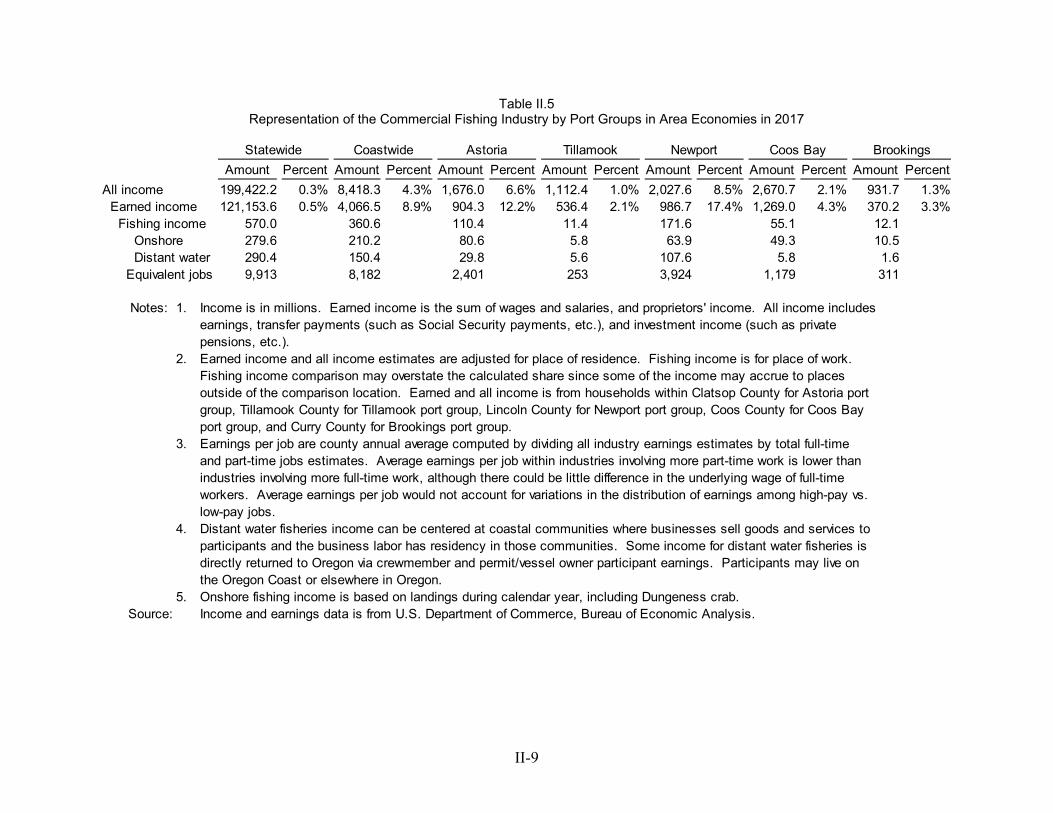
Table II.3: Oregon Vessel Counts and Deliveries by Fishery in 2013 to 2017 Table II.4: Commercial Fishing Industry Economic Contribution Trends in 2012 to 2017 Table II.5: Representation of the Commercial Fishing Industry by Port Groups in Area
Economies in 2017 Table III.1: Ocean and Inland Recreational Fisheries Trips in 2010 to 2017 Table III.2: Ocean and Inland Recreational Fisheries Economic Contributions in 2016 and 2017 Table III.3: Recreational Fisheries Economic Contribution at Port Groups in 2017 Figure III.1: Ocean Recreational Salmon and Non-Salmon Fishing Effort in 1995 to 2017 Table IV.1 Landed Value for Nearshore and Other Fisheries by Port Groups in 2016 Table IV.2: Vessel Average Annual Exit/Entry for All Fisheries at Port Groups in 2006 to 2016 Table IV.3: Nearshore Groundfish Fisheries Vessel Revenue Distribution in 2016 Figure IV.1: Commercial and Recreational Fisheries Engagement at Port Groups in 2016 Figure IV.2: Oregon Rankings of Port Group Area Commercial Fishing Industry Reliance,
Commercial Nearshore Fisheries Dependency, and Social Vulnerability in 2016 Figure IV.3: Vessel Exit/Entry Trends for Nearshore Groundfish Fishery Vessels at Port Groups
and Coastwide in 2006 to 2016
Appendix
Appendix A: Recreational Fisheries Trips by Target Species Appendix B: Vessel Exit/Entry Trends at Port Groups and Coastwide Appendix C: Commercial Vessel and Landings Trend Information Appendix D: Revenue Portfolios for Vessels Participating in the Nearshore Groundfish Fishery Appendix E: Demographic and Well-Being Indicators at Port Groups
iv
Glossary
Acronyms ACS U.S. Census Bureau, American Community Survey BEA U.S. Bureau of Economic Analysis CCRMP Coastal Chinook Research and Monitoring Program COMES Coastal Oregon Marine Experiment Station CRCP Columbia River Creel Program CROOS Collaborative Research on Oregon Ocean Salmon FEAM Fisheries Economic Assessment Model GDP Gross Domestic Product IO-PAC input-output model for Pacific Coast fisheries MR's Oregon marine reserve system sites MRFSS Marine Recreational Fisheries Statistics Survey ODFW Oregon Department of Fish and Wildlife ORBS Ocean Recreational Boat Survey PacFIN Pacific Coast Fisheries Information Network PSMFC Pacific States Marine Fisheries Commission RecFIN Recreational Fisheries Information Network SEB Shore and Estuary Boat survey SSHSTRP Salmon-Steelhead, Halibut, and Sturgeon Tag Return Program TRG The Research Group, LLC TS Oregon Territorial Sea WDFW Washington Department of Fish and Wildlife Data Provenances PacFIN annual vessel summary data and RecFIN data from the PSMFC. ORBS effort and catch from ODFW. SSHSTRP recreational catch from ODFW. Fisheries logbook program records from ODFW. Creel surveys on Elk River and Salmon River performed annually for the CCRMP from ODFW. CRCP surveys on lower Columbia River performed annually from ODFW and WDFW. Area income from U.S. Bureau of Economic Analysis. Demographic and well-being indicator data from ACS. Terms Angler day Sometimes the word "trip" is used in this report's narrative, but the unit of
measurement for effort is an angler day. Trip expenditures for overnight lodging is factored into the average angler day spending. The hours actually spent fishing in a calendar day are not a consideration. The amount of money spent for the fishing experience is not appreciably different whether fishing was for a few or many hours. Literature use of the word trip is usually associated with a fishing experience duration that may be more or less than a
v
calendar day. Trip counts in this study have been adjusted to account for multiple days when fishing occurred during a single trip.
Catch recreational The term catch used in this study is retained fish. Catch is expanded to
include non-retained fish counts using angler preference survey factors in order to calculate total effort using success rates. Success rates are angler days per retained and non-retained catch. Catch per unit effort is the multiplicative inverse of success rates.
Distant water The distant water fisheries are the West Coast offshore fishery, Alaska fisheries fisheries, western Pacific highly migratory species fishery, fisheries in
Washington and California, and elsewhere. Revenue generated from vessel deliveries in Oregon is referenced in this report as "onshore." Revenue returned to Oregon in the form of wages and salaries or profits and revenue derived from expenditures made in Oregon for repairs, provisioning, or moorage is referenced in this report as "distant water" fisheries revenue. For example, the revenue generated from the at-sea deliveries for the Pacific whiting fishery is categorized as distant water fishery revenue. Another example is Oregon residents own harvesting permits in Alaska, but keep vessels year around at Alaska ports. Sometimes owners will lease permits for others to harvest the permit quota shares.
Dollar Where dollar values are noted to be real, the adjustment index was the GDP adjustments implicit price deflator developed by the U.S. Bureau of Economic Analysis. Economic Economic contributions include effects of harvesting and primary processing. contribution The estimates include direct, indirect, and induced impacts, therefore include
"multiplier effects." New fishing vessel construction, fishery management, and fishery research and education are not included.
An economic contribution metric relates to a short-term perspective for how
an industry is represented in the local economy. If there is a change in the economy's industry activity, there may very well be adjustments in the longer term that may cause increased economic contributions. For example, a tourism business start-up may replace a fishing industry business closure.
Economic contributions and economic impacts are sometimes used
interchangeably in literature. Other authors will differentiate the two terms - the latter being reserved for defining a short term disruption in economic activity. An example would be the lost commercial fishing economic activity due to implementing marine reserves if there was no replacement activity.
The economic contribution measurement selected for this study is income and
job equivalents. It could just as well have been other metrics that would describe the same economic direct and secondary effects, but in a different
vi
dimension. Other example metrics are business output (analogous but different than sales), value added, and taxes generated.
Economic Prior to 2016, the model used to calculate economic contributions was the modeling Fisheries Economic Assessment Model (FEAM). The FEAM was originally
developed by Hans Radtke and William Jensen for the West Coast Fisheries Development Foundation in 1988. The estimates include direct, indirect, and induced impacts, therefore include "multiplier effects." The FEAM relies on response coefficients from IMPLAN to estimate household income generated from harvester and processor activities. The FEAM has been useful because much of the commercial fishing industry information is not described in published employment data. The Research Group, LLC updated the FEAM periodically using new fleet and processor structural information, changed industry cost-earnings profiles, and new data IMPLAN models. The FEAM methods are described in Seung and Waters (2006). Application of the FEAM adjusts fisheries' multipliers to the current year's harvest prices. IMPLAN is a product of IMPLAN Group LLC, 16740 Birkdale Commons Parkway, Suite 212, Huntersville, NC 28078.
For years 2016 and 2017, the economic model used to calculate economic
contributions is the input-output model for Pacific Coast fisheries (IO-PAC), which is maintained by the NMFS Northwest Fisheries Science Center. The model was designed to estimate the changes in economic contributions and economic impacts resulting from policy, environmental, or other changes that affect fishery harvest. IO-PAC was built by customizing IMPLAN software. The development and design of IO-PAC is documented in detail in Leonard and Watson (2011). Discussions about the similarities and differences between FEAM and IO-PAC are found in SSC (2009). The PFMC now uses the IO-PAC instead of the FEAM for analyzing management alternatives.
Fisheries While this report's purpose is to describe commercial and recreational engagement fisheries economic activity, a broader context for how the activity is
embedded in the social fabric of communities is offered. The brief context is provided using secondary demographic and well-being indicators (source is ACS) and three indexes of fisheries engagement. The demographic and well-being indicators at port groups in 2016 are generally: population (age, ethnicity), households (numbers, size), housing (costs, vacancy, second-home, tenure), labor force (employment in occupations and industries, unemployment), wealth (income sources, poverty), and education. Fisheries engagement is measured by the economic contribution generated (measured by income including multiplier effect) from commercial and recreational fishing activity. The fisheries engagement indexes are regional economy reliance (measured by economic contribution divided by area total earnings), fisheries dependency (measured by the ratio of nearshore fisheries commercial landings divided by total landings), and social vulnerability
vii
(measured by the Shannon Index of occupational diversity). Index port group rankings for Year 2016 are described.
Harvester and Harvest revenue and price (sometimes called ex-vessel revenue) is the processor amount paid to fishers at the time of fish delivery to processors or when sold revenue directly to the public. The term ex-processor revenue is from the wholesale
price fetched by processors for manufactured seafood products. Home-port Home-port vessels are where a majority of landings measured by ex-vessel vessels revenue occurs. Oregon home-port vessels can deliver to other states (such as
Astoria area vessels delivering to Ilwaco processors) and other state home-port vessels can deliver to Oregon processors.
Income Income accrues to households in the form of net earnings (sometimes called
earned income) from wages, salaries, proprietorship income, etc. For example, it can include the contract payments based on share of catch value that is paid to a commercial fishing vessel crewman/skipper and the net income after operating and fixed expenses for the vessel owner. Total household income would include other sources such as transfer payments (e.g. social security, unemployment insurance, etc.) and investments (e.g. rental income, dividends, interest, etc.). There can be small differences between total income in area that is from households and the area's total personal income because of how BEA calculates the income.
Job equivalents Statewide and regional average annual earnings per job are computed by
dividing the economies all industry earned income estimates by total full-time and part-time jobs estimates. Average earnings per job within industries involving more part-time work is lower than industries involving more full-time work, although there could be little difference in the underlying wage of full-time workers. Since average earnings per job are just a simple average, it does not account for variations in the distribution of earnings among high-pay vs. low pay jobs. Equivalent jobs at the statewide level include jobs within all coastal communities plus jobs in the rest of the state.
Multiplier effect Basic economic impact analysis attempts to sort out the driving economic
activities in regional economies (Scott 1984). Local industries with markets outside of the region bring new money into the region and are called basic industries. Industries with markets within the region are called secondary or support industries. Thus, when there is an increase in spending in basic industries, there is a resultant increase in secondary industries. Trade leakage occurs when spending and respending for labor, supplies, and services occurs outside the region. The relationship between an activity's total impact on the region's economy that includes the effect from the secondary industries, and the basic industry, is known as the multiplier effect. In the vernacular of input-output modeling terminology, the total impact on an economy included the direct, indirect, and induced effects of the activity.
viii
Marine reserve Ocean areas within the Territorial Sea set aside for research and management system effectiveness monitoring. Oregon's five legislatively recognized areas have
unique management specifications for non-take zones (referred to as marine reserve area) and selective take zones (referred to as marine protected area).
Nearshore area The part of the continental shelf closest to shoreline and includes an intertidal
zone. The intertidal zone extreme is the high tide splash zone and includes lower bay saline dominated estuarine waters. Some nearshore fisheries have management specifications using depth restrictions. Management depth closures can vary during the year.
Nearshore species The fisheries chosen to represent nearshore fisheries are Dungeness crab,
salmon troll, and nearshore groundfish. Nearshore groundfish species include selections of rockfish, roundfish, and flatfish. An estimate of the nearshore harvested portion of lingcod is included. The landings for lingcod were determined using species and gear filter queries to include open access landings with longline, other hook and line, or pot gear; and limited entry landings with longline, other hook and line, or selective FF trawl (small footrope) if it was on the same fish ticket with black or blue rockfish or certain other nearshore species. The criteria used to select species that are nearshore groundfish is discussed in TRG and GMC (2012). The selection is inclusive of State managed nearshore species for which an Oregon Nearshore Fishery Permit is needed. There are other federal managed species in the selection that are typically caught in nearshore areas. Some report tables only show nearshore species harvests for vessels that have an Oregon Nearshore Fishery Permit. Other tables' content is for all selected nearshore species determined without filtering on vessels associated with permits.
LE and OA Limited entry and open access refer to federal permit types that allow groundfish nearshore groundfish to be harvested either as a directed fishery or incidental permits in other fisheries. The LE permit types have gear restrictions for being trawl
(bottom net, mid-water net, etc.) or fixed gear (longline, pot, etc.). Only a prior qualified vessel can be used to hold a LE permit. Open access is a misnomer in that a permit still needs to be acquired and associated with a vessel. An Oregon Nearshore Fishery Permit is required to harvest certain groundfish species up to maximum bimonthly limits set by ODFW. There can be small harvests per trip made without the permit. The permit is limited entry. ODFW (September 2017) has a detailed description about permit requirements and discusses landing histories and fishery management. There are agency and many scholarly reports about the federal limited entry groundfish permits including NOAA Fisheries (2017), Lian et al. (2009), Pfeiffer and Gratz (2016), and Holland et al. (2017).
ix
Oregon The ocean that is three nautical miles seaward of shoreline. The seaward Territorial Sea extent can be approximated to be the 30 fathom depth contour along the
Oregon Coast. Shannon index The Shannon index is a measure of the occupational diversity within a
community. Occupation data is compiled at the ACS 17 categories level. Less occupational diversity would mean higher vulnerability for accommodating worker adaption change. With little occupational diversity, community members may be forced to look for work elsewhere when there are job losses within their particular occupation. The index was originally proposed by Claude Shannon to quantify entropy (Shannon 1948). It is more commonly used to describe diversity in physical systems, such as species in a given marine environment.
Commercial Trips are approximated using fish tickets. A fish ticket represents the landing fishing trips of fish or shellfish product from one fishing trip. Ticket counts may not
reflect fishing trips, because multiple tickets can be issued for a single trip when a vessel delivers to more than one dealer after returning to port, and vessels issue tickets when a sale is made directly to the public. Trip undercounts could occur in the occasion when tendering services are used because more than one vessel's harvest could be combined onto a single fish ticket. Delivery counts are not additive across fisheries because a fish ticket may include more than one species.
Recreational Sometimes the word "trip" is used in this report's narrative, but the unit of fishing trips measurement for effort is an angler day. The hours actually spent fishing in a
calendar day are not a consideration. The amount of money spent for the fishing experience is not appreciably different whether fishing was for a few or many hours. Literature use of the word trip is usually associated with a fishing experience duration that may be more or less than a calendar day. Trip counts in this study have been adjusted to account for multiple days when fishing occurred during a single trip.
Recreational The mode can be charter boat, private boat, bank fishing, or diving. A charter fishing mode boat is owned by a private business which provides for-hire services on daily
and fishing season schedules. The services are usually recreational fishing, but can for non-angling trips such as whale watching or just touring. The boat may make more than one trip per day depending on the distance to fishing grounds. Private boats do not provide for-hire services, although it is not uncommon that friends and relatives on the trip contribute to cost reimbursement. Bank fishing distinguishes an angling trip when the fishing opportunity will not rely on a boat. It can occur on piers and water shorelines. Dive trips can originate from a boat or shore. There are very few ocean bank or dive fishing trips in Oregon and they are not included in the analysis.
x
Spillover effect Increased fish production from ecological functions occurring within MR sites that may result in increased recreational angler effort and commercial catch outside of a MR site.
Typical and Typical are averages for only the actual number of vessels that had landings representative in a particular fishery. Representative are averages for all vessels regardless averages of whether they had landings in a particular fishery. Port Group The following table lists the major ports, acronyms, Census Bureau
geographic areas (cities, counties, and zip code areas), and river/streams that are mapped to port groups.
Port Group
Area Economic Data
Cities and Source of Demographic/Well-being Data
Major Rivers and Streams
Astoria (AST)
Clatsop County
Astoria, Hammond/Warrenton, Gearhart, Seaside, and Cannon Beach. Clatsop County used for Census Bureau data.
Columbia, Klaskanine, Lewis and Clark, Youngs, and Necanicum rivers; Big Creek, Gnat Creek, and Bear Creek
Tillamook (TIL)
Tillamook County
Tillamook, Garibaldi, Netarts, and Pacific City. Tillamook County used for Census Bureau data.
Tillamook, Kilchis, Miami, Nehalem, Nestucca, Trask, and Wilson rivers
Newport (NPT)
Lincoln County
Newport and Depoe Bay. Lincoln County plus zip code 97439 used for Census Bureau data.
Yaquina, Siletz, Alsea, and Salmon rivers; Big Elk Creek, Drift Creek
Coos Bay (CSB)
Coos County
Coos Bay, Florence, Winchester Bay, and Charleston. Coos County plus zip code 97467 used for Census Bureau data.
Siuslaw, Umpqua, Smith, Coos, Slough
Port Orford (PRD)
Port Orford. Zip codes 97465, 97476, and 97450 used for Census Bureau data.
Elk and Sixes rivers
Brookings (BRK)
Curry County
Brookings and Gold Beach. Curry County less Port Orford zip codes used for Census Bureau data.
Chetco and Rogue rivers
Note: Area economic data is used for showing commercial fisheries (distant water
fisheries are included) representation in local economies in 2017. Demographic and well-being data is used to show an area's commercial (distant water fisheries are excluded) and recreational fisheries engagement in 2016. (The time disparity is due to data availability.) Both measures have their unique purpose in showing the importance of fisheries in an area and how different Oregon Coast areas contrast. A more complete discussion of fisheries importance would be to show historical trends for the measures.
xi
Executive Summary
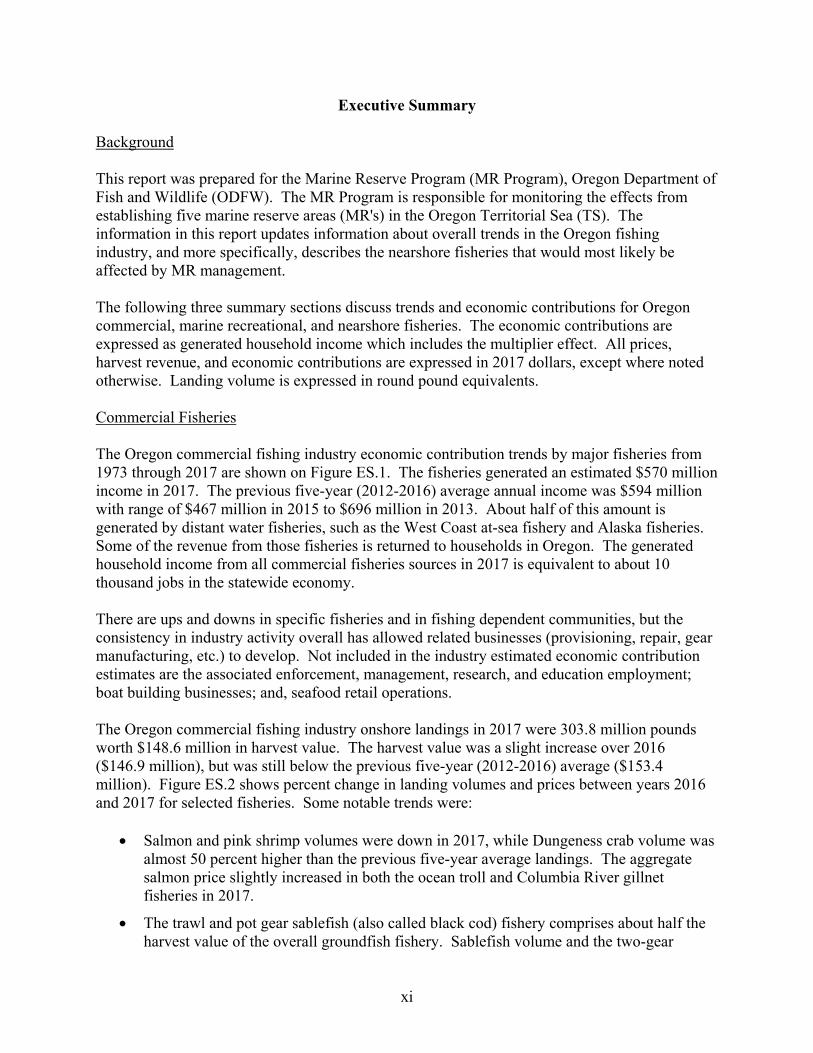
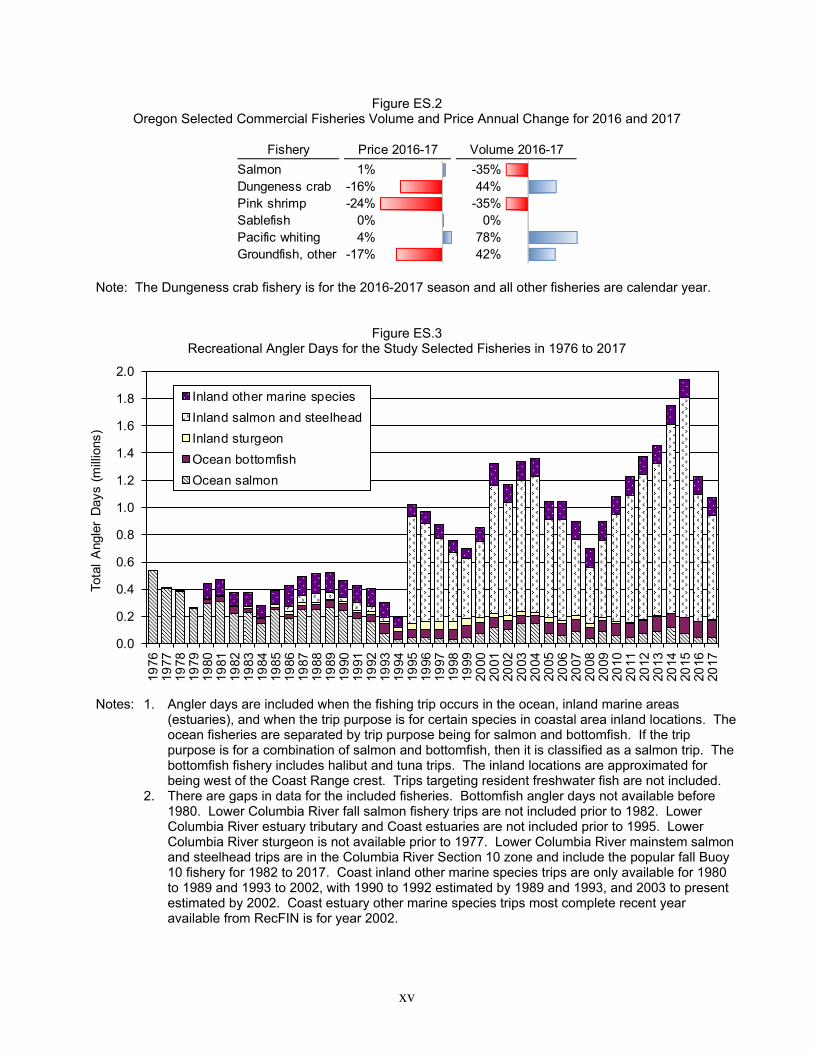
Background This report was prepared for the Marine Reserve Program (MR Program), Oregon Department of Fish and Wildlife (ODFW). The MR Program is responsible for monitoring the effects from establishing five marine reserve areas (MR's) in the Oregon Territorial Sea (TS). The information in this report updates information about overall trends in the Oregon fishing industry, and more specifically, describes the nearshore fisheries that would most likely be affected by MR management. The following three summary sections discuss trends and economic contributions for Oregon commercial, marine recreational, and nearshore fisheries. The economic contributions are expressed as generated household income which includes the multiplier effect. All prices, harvest revenue, and economic contributions are expressed in 2017 dollars, except where noted otherwise. Landing volume is expressed in round pound equivalents. Commercial Fisheries The Oregon commercial fishing industry economic contribution trends by major fisheries from 1973 through 2017 are shown on Figure ES.1. The fisheries generated an estimated $570 million income in 2017. The previous five-year (2012-2016) average annual income was $594 million with range of $467 million in 2015 to $696 million in 2013. About half of this amount is generated by distant water fisheries, such as the West Coast at-sea fishery and Alaska fisheries. Some of the revenue from those fisheries is returned to households in Oregon. The generated household income from all commercial fisheries sources in 2017 is equivalent to about 10 thousand jobs in the statewide economy. There are ups and downs in specific fisheries and in fishing dependent communities, but the consistency in industry activity overall has allowed related businesses (provisioning, repair, gear manufacturing, etc.) to develop. Not included in the industry estimated economic contribution estimates are the associated enforcement, management, research, and education employment; boat building businesses; and, seafood retail operations. The Oregon commercial fishing industry onshore landings in 2017 were 303.8 million pounds worth $148.6 million in harvest value. The harvest value was a slight increase over 2016 ($146.9 million), but was still below the previous five-year (2012-2016) average ($153.4 million). Figure ES.2 shows percent change in landing volumes and prices between years 2016 and 2017 for selected fisheries. Some notable trends were:
Salmon and pink shrimp volumes were down in 2017, while Dungeness crab volume was almost 50 percent higher than the previous five-year average landings. The aggregate salmon price slightly increased in both the ocean troll and Columbia River gillnet fisheries in 2017.
The trawl and pot gear sablefish (also called black cod) fishery comprises about half the harvest value of the overall groundfish fishery. Sablefish volume and the two-gear
xii
harvested average price was steady in 2017 as compared to 2016. The sablefish price has not returned to the record level prices received in 2011.
Pacific whiting volume was way up (over 50 percent greater) in 2017 as compared to the previous five-year average, while price remained about 30 percent below the average.
There was a bump up in some groundfish management quota volumes due to several species recently being declared recovered from an overfished status. Consequently, the fishery category for all other groundfish species had a big volume jump in 2017 as compared to the previous five-year average. The other groundfish overall price slightly decreased in 2017 compared to the previous five-year average.
Other fishery news for 2017 was the continued closure for the Pacific sardine directed fishery, a small herring fishery emerged at Yaquina Bay, and the market squid fishery that was big in 2016 did not return.
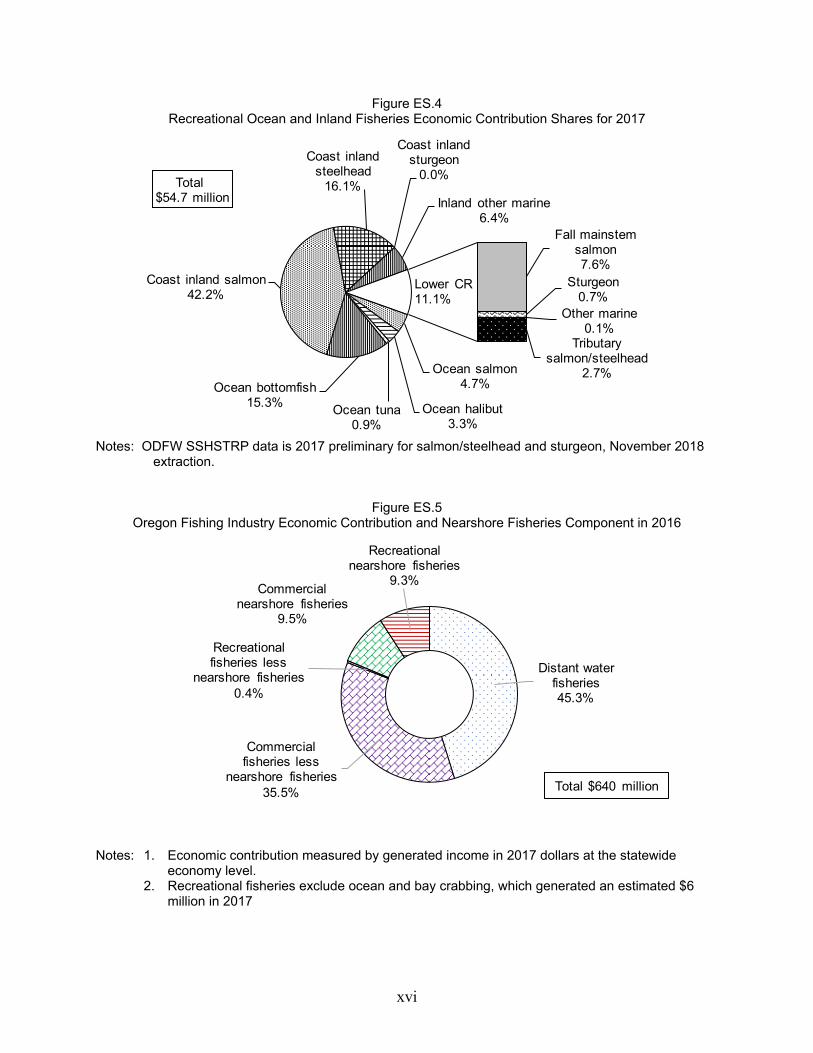
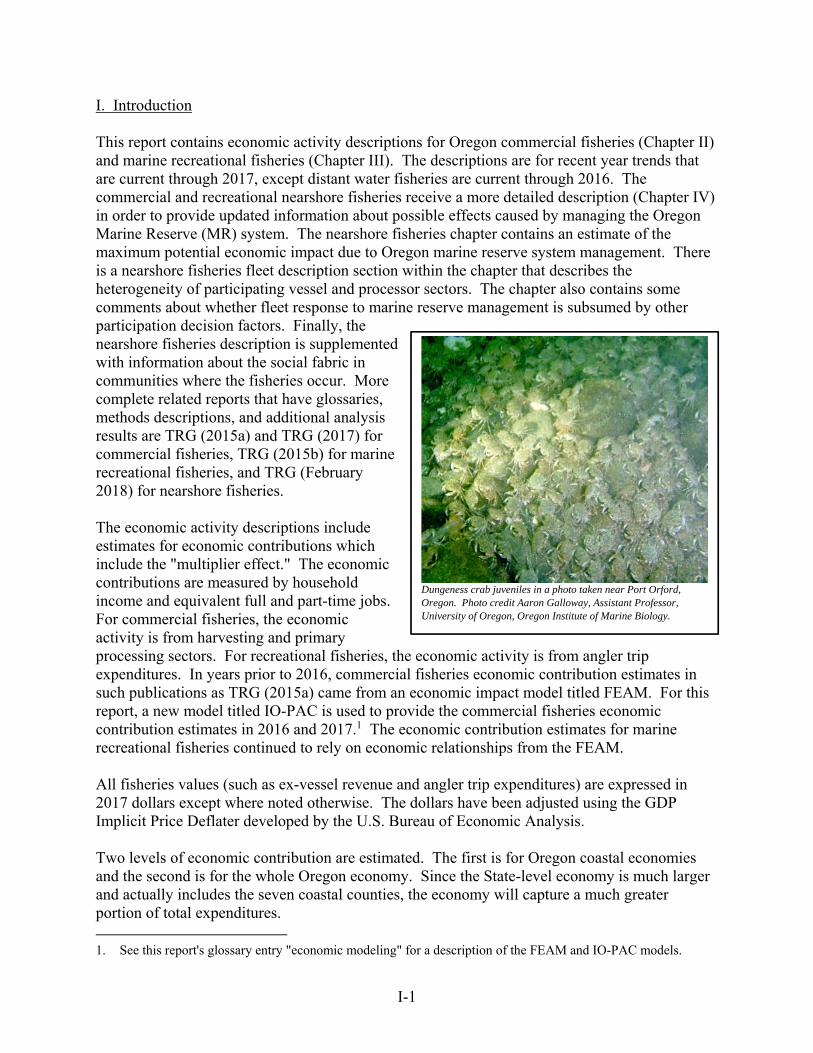
Economic contribution due to the commercial fishing industry may also be generated from many activities other than just harvesting and seafood processing – for example, visitors attracted to food service and retail markets selling local harvests, and tourists drawn to working waterfronts. There are boat building and gear manufacturing businesses at some ports. Management, enforcement/safety, research, education, and training are related economic contributors. The commercial fishing industry is one component in a larger context maritime industry that would include these additional economic contribution activities. Recreational Fisheries Commercial wild harvesting activities share natural resources with a large ocean and inland recreational fisheries sector. Complex management by federal and state agencies ensure reasonable access by both sectors, yet conserve the resource to achieve sustainability. There is scattered and disparate information available about the economic contributions from marine recreational finfish fisheries in Oregon's coastal areas. This report pulls together existing economic information and provides additional economic analysis results so that magnitudes and trends can be discerned. Still, the accounting is selective leaving out trips targeting freshwater resident fish. The notes on Figure ES.3 explain the included target fisheries. Economic contribution shares for the targeted recreational ocean and inland targeted fisheries in 2017 are shown on Figure ES.4. Total trips for the selective fisheries increased in the late 2000's through 2015. Trips for years 2016 and 2017 are in a downward trend mostly due to decreased participation in the inland fall salmon and steelhead fisheries. Ocean trips for salmon have also been decreasing in recent years. Trips for ocean bottomfishing have grown ostensibly as replacement for decreased success rates and fishing opportunities for ocean salmon. There were about 1.2 million total trips in 2016 and 1.1 million in 2017. Economic contribution from trip spending generated $61.8 million income in 2016 and $54.7 million income in 2017 (Figures ES.4). Recreational anglers make additional contributions to local economies in ways other than trip spending, such as purchasing fishing equipment and boats, and owning second homes. Vibrant
xiii
and year-around fisheries access is an indicator of healthy natural resources and can be considered an economic development asset. Living in such an environment is attractive to entrepreneurs and prospective employees. The attraction will be an important business location decision variable, along with more straightforward considerations such as the markets and suppliers logistics, and labor costs. Fishery managers are often presented with economic effects information from different user groups wanting more favorable access to fisheries. The report counsels there are different ways to measure economic effects and that misuse of information can occur. Economic information can be valuable to decision making when there is forethought in proper data collection, economic modeling, and tradeoff discussions. Nearshore Fisheries Economic activity descriptions are provided for nearshore fisheries, i.e. commercial and recreational fisheries that take place within the TS and adjacent bays. The descriptions are provided to assist in characterizing the potential economic impact from marine reserve management. The nearshore commercial and recreational fisheries economic contribution share was 19 percent of the estimated $640 million income in 2016 (Figure ES.5). The total income includes commercial onshore and distant water fisheries and selective recreational target fisheries that are located in ocean and bays. A model was developed in another project to estimate the economic contributions from fisheries within alternative marine reserve boundary designs. The model informed decision making in the geographic shaping and fisheries management plan formulation process that ultimately led to the existing system of marine reserves. The model shows, based on average 2013-2015 harvesting, that the maximum potential economic impact (i.e. no fishing would occur elsewhere) from marine reserve management is 3.6 percent of all nearshore commercial and recreational fishing economic contributions which take place in the TS (Table ES.1). Since the marine reserve system is less than 10 percent of the TS, it would seem likely that the 90 percent commercial harvesting and recreation angling area opportunities would provide satisfactory substitute fishing grounds for most species. However, some individual fishermen may have experience with the bottom features and water conditions at these sites and decide not to fish elsewhere given management closures. The fishing costs may rise from increased transit distances and changed catch per effort. If recreational fishers do not fish in new areas, they may instead spend the same trip expenditures in non-fishing activities in the local economy. Not included in the displaced fisheries estimates are potential biological spillover effects resulting from possible increased stock abundances that might raise catch per effort in the new fishing area. There are other MR Program human dimension investigative projects underway and planned that address the extent of effort shift and leaving fisheries. The problem will be to find the degree and outcome of any influence from marine reserve implementation within participation variability given that fishers are also responding to such factors as fish resource conditions, other regulations, market conditions, personal investment choices, and even weather.
xiv
Figure ES.1
Economic Contributions From Onshore Landings in 1973 to 2017 and Distant Water Fisheries in 1986 to 2017
0
100
200
300
400
500
600
700
1973
1975
1977
1979
1981
1983
1985
1987
1989
1991
1993
1995
1997
1999
2001
2003
2005
2007
2009
2011
2013
2015
2017
Eco
nom
ic C
ontr
ibut
ion
(mill
ions
of 2
017
dolla
rs)
Distant Water
Salmon
D. Crab
Pink Shrimp
Groundfish
Whiting
Other
FisheriesDistant Water Fisheries
not estimated prior to 1986
Economic Contributions by Major Fishery in 2017
Distant water fisheries50.9%
Salmon1.6%
D. crab18.4%
P. shrimp4.4% Groundfish
12.5%
P. whiting7.5%
P. sardines0.0%
A. tuna3.4%
P. halibut0.4%
Other0.8%
Other4.6%
Total $570.0 million
Notes: 1. Economic contributions are expressed as household income in millions of 2017 dollars. The
contributions are for the state level economy. 2. The economic contribution estimates prior to 2016 come from the Oregon Fisheries
Economic Assessment Model (FEAM). For 2016 and 2017 onshore, the input-output model for Pacific Coast fisheries (IO-PAC) is used for the calculations.
xv
Figure ES.2 Oregon Selected Commercial Fisheries Volume and Price Annual Change for 2016 and 2017
Fishery Price 2016-17 Volume 2016-17
Salmon 1% -35%Dungeness crab -16% 44%Pink shrimp -24% -35%Sablefish 0% 0%Pacific whiting 4% 78%Groundfish, other -17% 42%
Note: The Dungeness crab fishery is for the 2016-2017 season and all other fisheries are calendar year.
Figure ES.3 Recreational Angler Days for the Study Selected Fisheries in 1976 to 2017
0.0
0.2
0.4
0.6
0.8
1.0
1.2
1.4
1.6
1.8
2.0
1976
1977
1978
1979
1980
1981
1982
1983
1984
1985
1986
1987
1988
1989
1990
1991
1992
1993
1994
1995
1996
1997
1998
1999
2000
2001
2002
2003
2004
2005
2006
2007
2008
2009
2010
2011
2012
2013
2014
2015
2016
2017
Tota
l A
ngle
r D
ays
(mill
ions
)
Inland other marine species
Inland salmon and steelhead
Inland sturgeon
Ocean bottomfish
Ocean salmon
Notes: 1. Angler days are included when the fishing trip occurs in the ocean, inland marine areas (estuaries), and when the trip purpose is for certain species in coastal area inland locations. The ocean fisheries are separated by trip purpose being for salmon and bottomfish. If the trip purpose is for a combination of salmon and bottomfish, then it is classified as a salmon trip. The bottomfish fishery includes halibut and tuna trips. The inland locations are approximated for being west of the Coast Range crest. Trips targeting resident freshwater fish are not included.
2. There are gaps in data for the included fisheries. Bottomfish angler days not available before 1980. Lower Columbia River fall salmon fishery trips are not included prior to 1982. Lower Columbia River estuary tributary and Coast estuaries are not included prior to 1995. Lower Columbia River sturgeon is not available prior to 1977. Lower Columbia River mainstem salmon and steelhead trips are in the Columbia River Section 10 zone and include the popular fall Buoy 10 fishery for 1982 to 2017. Coast inland other marine species trips are only available for 1980 to 1989 and 1993 to 2002, with 1990 to 1992 estimated by 1989 and 1993, and 2003 to present estimated by 2002. Coast estuary other marine species trips most complete recent year available from RecFIN is for year 2002.
xvi
Figure ES.4 Recreational Ocean and Inland Fisheries Economic Contribution Shares for 2017
Ocean salmon4.7%
Ocean halibut3.3%
Ocean tuna0.9%
Ocean bottomfish15.3%
Coast inland salmon42.2%
Coast inland steelhead
16.1%
Coast inland sturgeon
0.0%
Inland other marine6.4%
Fall mainstem salmon7.6%
Sturgeon0.7%
Other marine0.1%
Tributary salmon/steelhead
2.7%
Total $54.7 million
Lower CR11.1%
Notes: ODFW SSHSTRP data is 2017 preliminary for salmon/steelhead and sturgeon, November 2018
extraction.
Figure ES.5 Oregon Fishing Industry Economic Contribution and Nearshore Fisheries Component in 2016
Distant water fisheries45.3%
Commercial fisheries less
nearshore fisheries35.5%
Recreational fisheries less
nearshore fisheries0.4%
Commercial nearshore fisheries
9.5%
Recreational nearshore fisheries
9.3%
Total $640 million
Notes: 1. Economic contribution measured by generated income in 2017 dollars at the statewide
economy level. 2. Recreational fisheries exclude ocean and bay crabbing, which generated an estimated $6
million in 2017

xvii
Table ES.1 Marine Reserve Sites Annual Average Regional Economic Impacts From
Assessed and Displaced Commercial and Recreational Fisheries for 2013-2015
Assessed Fisheries Displaced FisheriesArea Share of Economic Impact Economic Impact
Harvest Area Territorial Sea Comm. Rec. Total Comm. Rec. Total
Marine Reserve SitesCape Falcon 1.6% 661 77 737 341 62 403Cascade Head 2.6% 877 472 1,349 256 145 401Otter Rock 0.1% 32 24 56 30 24 53Cape Perpetua 4.4% 1,480 228 1,708 332 103 434Redfish Rocks 0.6% 224 78 302 99 71 169 Total 9.3% 3,273 878 4,152 1,057 404 1,461
Economic Impact Assess. Displ.
Comparison Areas Comm. Rec. Total Share Share
Territorial Sea 100.0% 34,212 6,701 40,914 10.1% 3.6%Onshore landed commercial fisheries 224,575Ocean recreational fisheries 16,948Ocean commercial and recreational fisheries 241,523 1.7% 0.6%
Notes: 1. Economic impacts are expressed as household income in thousands of 2015 dollars. 2. Assessed fisheries are all of those that took place in the marine reserve and marine protected
area portions. Displaced fisheries are those that are closed due to marine reserve management.
3. The economic impacts for displaced fisheries should be considered the maximum potential effects from marine reserve management. Fishermen may elect to use other locations for same fisheries or participate in other fisheries as substitutes for the marine reserve management closures.
I-1
I. Introduction This report contains economic activity descriptions for Oregon commercial fisheries (Chapter II) and marine recreational fisheries (Chapter III). The descriptions are for recent year trends that are current through 2017, except distant water fisheries are current through 2016. The commercial and recreational nearshore fisheries receive a more detailed description (Chapter IV) in order to provide updated information about possible effects caused by managing the Oregon Marine Reserve (MR) system. The nearshore fisheries chapter contains an estimate of the maximum potential economic impact due to Oregon marine reserve system management. There is a nearshore fisheries fleet description section within the chapter that describes the heterogeneity of participating vessel and processor sectors. The chapter also contains some comments about whether fleet response to marine reserve management is subsumed by other participation decision factors. Finally, the nearshore fisheries description is supplemented with information about the social fabric in communities where the fisheries occur. More complete related reports that have glossaries, methods descriptions, and additional analysis results are TRG (2015a) and TRG (2017) for commercial fisheries, TRG (2015b) for marine recreational fisheries, and TRG (February 2018) for nearshore fisheries. The economic activity descriptions include estimates for economic contributions which include the "multiplier effect." The economic contributions are measured by household income and equivalent full and part-time jobs. For commercial fisheries, the economic activity is from harvesting and primary processing sectors. For recreational fisheries, the economic activity is from angler trip expenditures. In years prior to 2016, commercial fisheries economic contribution estimates in such publications as TRG (2015a) came from an economic impact model titled FEAM. For this report, a new model titled IO-PAC is used to provide the commercial fisheries economic contribution estimates in 2016 and 2017.1 The economic contribution estimates for marine recreational fisheries continued to rely on economic relationships from the FEAM. All fisheries values (such as ex-vessel revenue and angler trip expenditures) are expressed in 2017 dollars except where noted otherwise. The dollars have been adjusted using the GDP Implicit Price Deflater developed by the U.S. Bureau of Economic Analysis. Two levels of economic contribution are estimated. The first is for Oregon coastal economies and the second is for the whole Oregon economy. Since the State-level economy is much larger and actually includes the seven coastal counties, the economy will capture a much greater portion of total expenditures. 1. See this report's glossary entry "economic modeling" for a description of the FEAM and IO-PAC models.
Dungeness crab juveniles in a photo taken near Port Orford, Oregon. Photo credit Aaron Galloway, Assistant Professor, University of Oregon, Oregon Institute of Marine Biology.

I-2
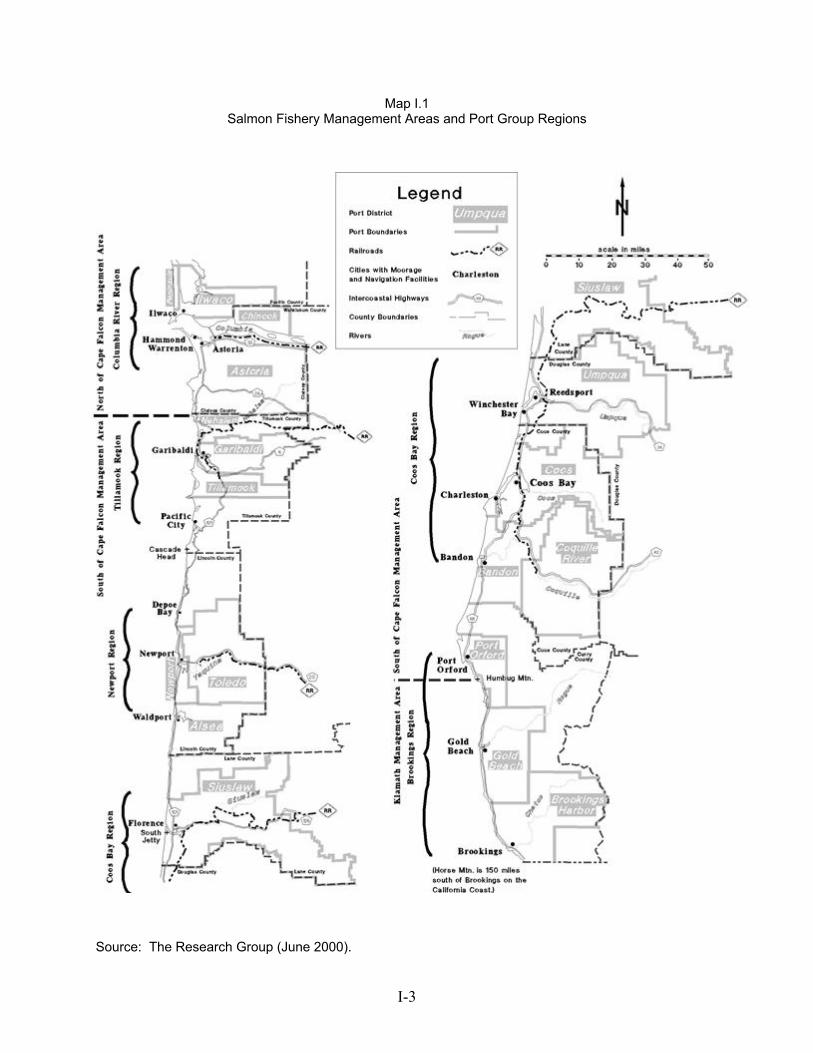
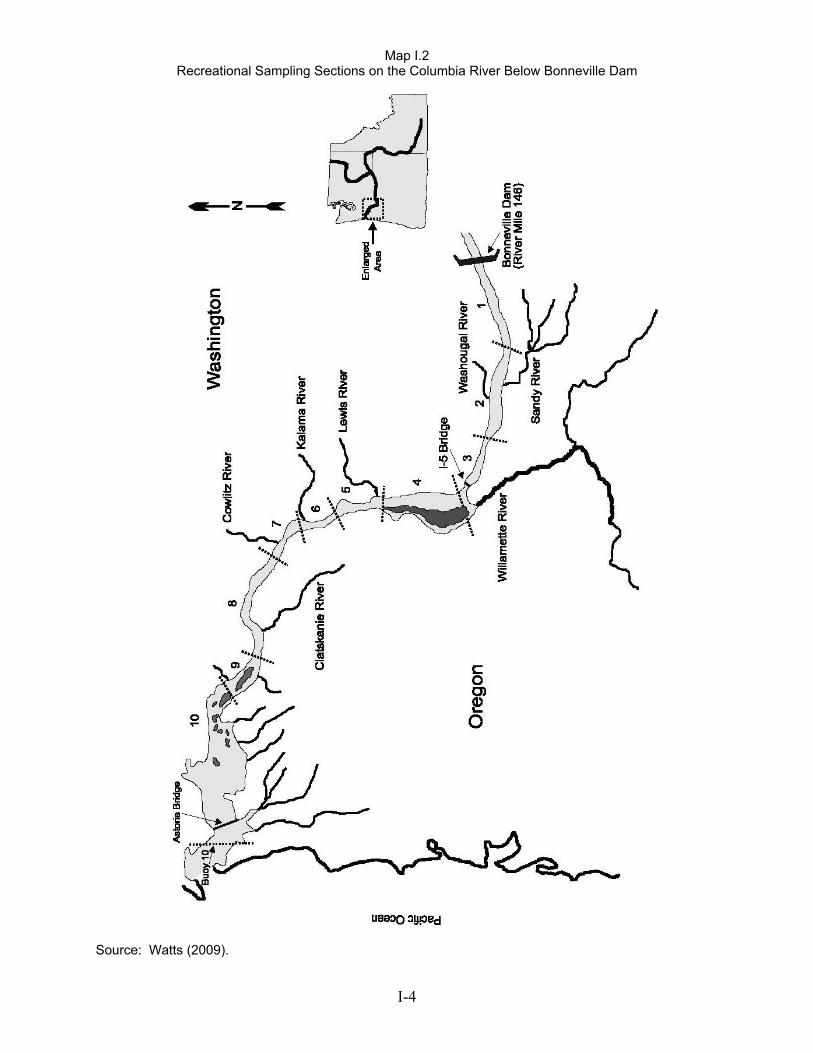
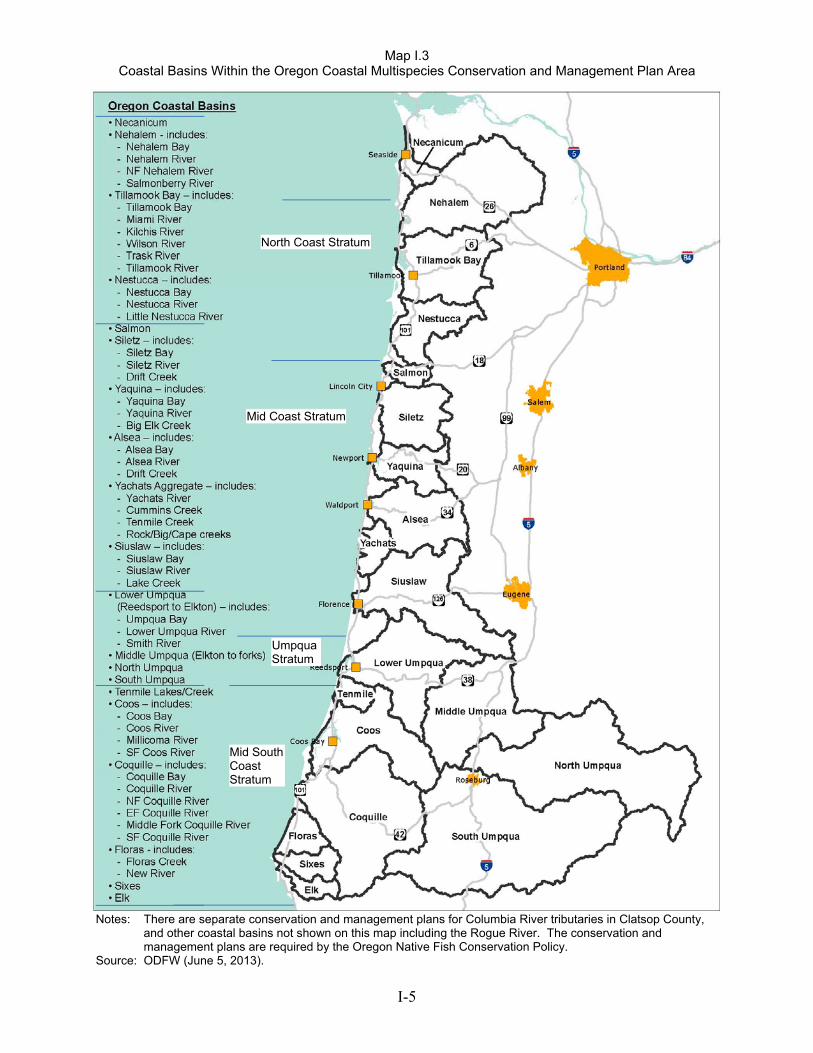
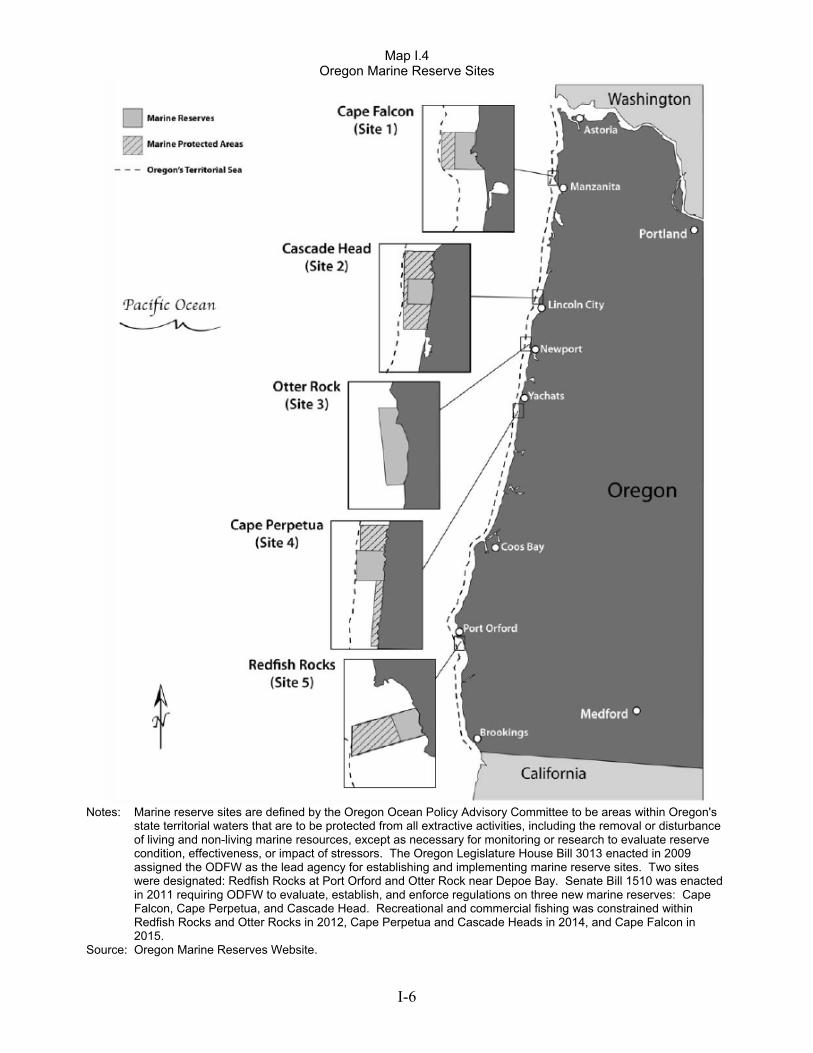
Commercial and recreational fisheries vicinity maps are shown as Maps I.1 through I.4. Map I.1 shows port group regions and salmon management areas. Maps I.2 and I.3 show watersheds included in compiling recreational trips in lower estuaries that target anadromous fish on the Columbia River and Oregon Coast. The location of the MR sites are shown on Map I.4.
I-3
Map I.1 Salmon Fishery Management Areas and Port Group Regions
Source: The Research Group (June 2000).
I-4
Map I.2 Recreational Sampling Sections on the Columbia River Below Bonneville Dam
Source: Watts (2009).
I-5
Map I.3 Coastal Basins Within the Oregon Coastal Multispecies Conservation and Management Plan Area
Notes: There are separate conservation and management plans for Columbia River tributaries in Clatsop County,
and other coastal basins not shown on this map including the Rogue River. The conservation and management plans are required by the Oregon Native Fish Conservation Policy.
Source: ODFW (June 5, 2013).
North Coast Stratum
Mid Coast Stratum
Umpqua Stratum
Mid South Coast Stratum
I-6
Map I.4 Oregon Marine Reserve Sites
Notes: Marine reserve sites are defined by the Oregon Ocean Policy Advisory Committee to be areas within Oregon's
state territorial waters that are to be protected from all extractive activities, including the removal or disturbance of living and non-living marine resources, except as necessary for monitoring or research to evaluate reserve condition, effectiveness, or impact of stressors. The Oregon Legislature House Bill 3013 enacted in 2009 assigned the ODFW as the lead agency for establishing and implementing marine reserve sites. Two sites were designated: Redfish Rocks at Port Orford and Otter Rock near Depoe Bay. Senate Bill 1510 was enacted in 2011 requiring ODFW to evaluate, establish, and enforce regulations on three new marine reserves: Cape Falcon, Cape Perpetua, and Cascade Head. Recreational and commercial fishing was constrained within Redfish Rocks and Otter Rocks in 2012, Cape Perpetua and Cascade Heads in 2014, and Cape Falcon in 2015.
Source: Oregon Marine Reserves Website.
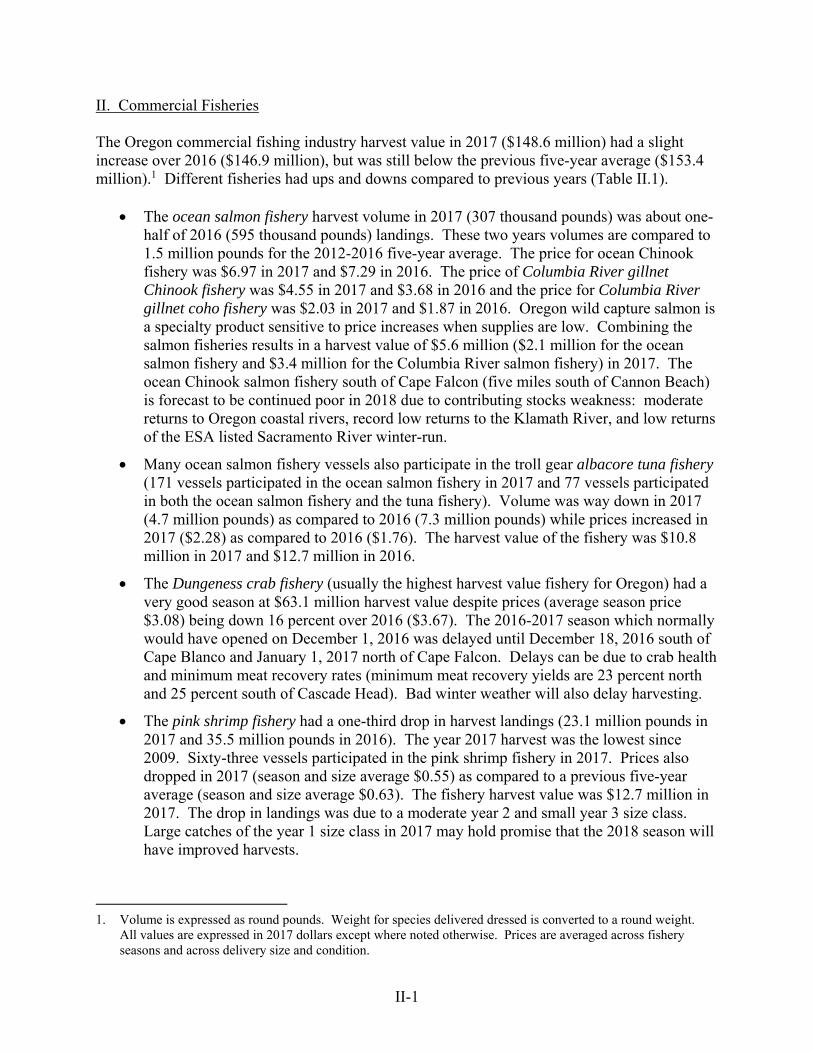
II-1
II. Commercial Fisheries The Oregon commercial fishing industry harvest value in 2017 ($148.6 million) had a slight increase over 2016 ($146.9 million), but was still below the previous five-year average ($153.4 million).1 Different fisheries had ups and downs compared to previous years (Table II.1).
The ocean salmon fishery harvest volume in 2017 (307 thousand pounds) was about one-half of 2016 (595 thousand pounds) landings. These two years volumes are compared to 1.5 million pounds for the 2012-2016 five-year average. The price for ocean Chinook fishery was $6.97 in 2017 and $7.29 in 2016. The price of Columbia River gillnet Chinook fishery was $4.55 in 2017 and $3.68 in 2016 and the price for Columbia River gillnet coho fishery was $2.03 in 2017 and $1.87 in 2016. Oregon wild capture salmon is a specialty product sensitive to price increases when supplies are low. Combining the salmon fisheries results in a harvest value of $5.6 million ($2.1 million for the ocean salmon fishery and $3.4 million for the Columbia River salmon fishery) in 2017. The ocean Chinook salmon fishery south of Cape Falcon (five miles south of Cannon Beach) is forecast to be continued poor in 2018 due to contributing stocks weakness: moderate returns to Oregon coastal rivers, record low returns to the Klamath River, and low returns of the ESA listed Sacramento River winter-run.
Many ocean salmon fishery vessels also participate in the troll gear albacore tuna fishery (171 vessels participated in the ocean salmon fishery in 2017 and 77 vessels participated in both the ocean salmon fishery and the tuna fishery). Volume was way down in 2017 (4.7 million pounds) as compared to 2016 (7.3 million pounds) while prices increased in 2017 ($2.28) as compared to 2016 ($1.76). The harvest value of the fishery was $10.8 million in 2017 and $12.7 million in 2016.
The Dungeness crab fishery (usually the highest harvest value fishery for Oregon) had a very good season at $63.1 million harvest value despite prices (average season price $3.08) being down 16 percent over 2016 ($3.67). The 2016-2017 season which normally would have opened on December 1, 2016 was delayed until December 18, 2016 south of Cape Blanco and January 1, 2017 north of Cape Falcon. Delays can be due to crab health and minimum meat recovery rates (minimum meat recovery yields are 23 percent north and 25 percent south of Cascade Head). Bad winter weather will also delay harvesting.
The pink shrimp fishery had a one-third drop in harvest landings (23.1 million pounds in 2017 and 35.5 million pounds in 2016). The year 2017 harvest was the lowest since 2009. Sixty-three vessels participated in the pink shrimp fishery in 2017. Prices also dropped in 2017 (season and size average $0.55) as compared to a previous five-year average (season and size average $0.63). The fishery harvest value was $12.7 million in 2017. The drop in landings was due to a moderate year 2 and small year 3 size class. Large catches of the year 1 size class in 2017 may hold promise that the 2018 season will have improved harvests.
1. Volume is expressed as round pounds. Weight for species delivered dressed is converted to a round weight.
All values are expressed in 2017 dollars except where noted otherwise. Prices are averaged across fishery seasons and across delivery size and condition.
II-2
The groundfish fishery (other than sablefish and whiting) quotas have increased over recent years. This increase was partially due to lifting restrictions on some species previously classified for being in overfished status. Landings in 2017 were 42.8 million pounds compared to 30.2 million pounds in 2016. Prices for nearshore groundfish landed live had been decreasing in recent years, but there was a bump-up to $3.00 per pound in 2017 compared to $2.91 in 2016. Aggregate prices for flatfish (soles, flounders, etc.) and groundfish (other than sablefish and whiting) in 2017 decreased from 2016. With the mix of increase volume and decreased prices, the harvest value at $20.2 million was up in 2017. The sablefish fishery (also called black cod) had steady prices ($2.79 in both 2017 and 2016 when averaged over trawl and fixed gear sub-fisheries) and generated $15.5 million harvest value in 2017.
The large 2014 year class in the Pacific whiting fishery raised quotas in 2017. Onshore landings in 2017 (201.5 million pounds) were almost 80 percent higher than in 2016 (113.0 million pounds). More surimi was produced in 2017 as compared to several years ago which means processors cannot afford to pay harvesters as much as when headed and gutted is the product form. There was continued demand in 2017 for a new product form frozen, whole, and boxed that is shipped to Africa markets. Prices in 2017 were $0.081 as compared to a five-year average $0.112. The harvest value was $16.4 million in 2017 as compared to $14.5 million for the previous five-year average.
The seine gear Pacific sardine fishery was restricted to a research and incidental fishery in 2017 as resource abundances have disappeared from what they were a few years ago. The unusually high volume of northern anchovy landings (11.7 million pounds) and market squid (2.8 million pounds) in 2016 did not continue in 2017. Another coastal pelagic species with significant landings in the past was Pacific (chub) mackerel, but landings were absent in 2016 and 2017. There is a limited market as bait or human consumption for this species. It could be abundances did not make targeting viable or processors were reluctant to purchase harvests.
The other notable Oregon fisheries in 2017 were hagfish, also called slime eel (1.6 million pounds, $1.6 million harvest value), Pacific halibut (269 thousand pounds, $1.4 million), red sea urchin (282 thousand pounds, $362 thousand), gaper clam (327 thousand pounds, $297 thousand), and basket cockle (285 thousand pounds, $261 thousand).1
The central coast port groups (Tillamook, Newport, and Coos Bay) have increased harvest value in 2017 as compared to 2016 (Table II.2). Astoria's share of coastwide landings dropped from 32 percent in 2016 to 30 percent in 2017. The Brookings port group (includes Port Orford) share also decreased from 13 percent in 2016 to eight percent in 2017. A new processor facility with a pink shrimp line owned by BC Fisheries, LLC opened at the Port of Brookings Harbor in the spring 2016. Landings at ports do not always correspond with processing occurring at those ports. Buyers will transport the landings to central processing facilities that can be in Oregon or other states. 1. Commercially harvested shellfish (such as razor clams, gaper clams, and basket cockle) is included in onshore
delivery data, therefore included in economic contribution estimates. Aquaculture products such as oysters grown in estuaries are not included in the delivery database and must be treated separately for modeling economic contributions.

II-3
The harvest value represents revenue for 894 different vessels making 23,060 deliveries to Oregon ports in 2017 (Table II.3). This is a decrease in vessels and deliveries (1,051 and 27,365) in 2016. The average revenue for active vessels (harvest revenue more than $500) was $160,601 in 2017. The active vessel median revenue was $37,700 in 2017. The significant differences between the average and the median indicate that the industry is comprised of mostly lower revenue producing vessels and lesser numbers of high revenue producing vessels.1 There were 108 processing plants, restaurants, etc. that each purchased at least $10 thousand of Oregon landings. The top five parent processing companies purchased 77 percent of landings measured by harvest value in 2017.2 Oregon onshore landings from harvests in the Pacific Ocean and Columbia River catch areas are processed into seafood products that are sold locally or are shipped to high volume processing
and distribution centers. The seafood products enter niche or commodity markets, both domestic and global. Those commodity markets include product substitutes that influence the price paid to processors and distributors that buy from Oregon harvesters. For example, many of the species landed in Oregon also are landed in greater numbers in Alaska and British Columbia (BC). For a comparison, Oregon's harvest value in 2014
was only six percent of all U.S. West Coast, Alaska, and BC landings (TRG 2017). Some Oregon fisheries have a higher harvest value proportion in this northern Pacific Ocean area, such as Dungeness crab at 19 percent and pink shrimp at 56 percent in 2014. The Oregon commercial fishing industry is an important contributor to the State's economy. The industry's onshore fisheries (not including distant water fisheries) generated $280 million household income in 2017 (Table II.4 and Figure ES.1). This compares to a 2016 economic contribution of $288 million. Distant water fisheries are a significant component of the commercial fishing industry's total economic effects in Oregon. These fisheries include harvests adjacent to the three West Coast continental states and delivered by catcher-vessels to motherships or caught by catcher processors, harvests in Alaska waters, and harvests in the western Pacific. Detailed estimates are not yet available for 2017.3 Distant water fisheries were 50 percent of the commercial fishing industry statewide economic contributions in 2016.
1. Another statistic showing revenue heterogeneity is 79 percent of vessels had less than $100 thousand harvest
value in 2015 and their landings were 17 percent of all harvest value. Another way of saying this is 21 percent of the vessels in 2015 had 83 percent of all harvest value.
2. The top five parent companies in 2017 are (alphabetical order): Bornstein Seafoods; California Shellfish Co.; Da Yang Seafoods Inc., Oceanic Logistics LLC; and Pacific Seafood Group.
3. The most recent year that distant water fisheries model results are available is 2016. The results show $290 million (2017 dollars) household income was contributed to the statewide economy.
BC Fisheries located in Brookings, Oregon was established 2007. The business is a family owned seafood wholesaler, offloader and processor. Photo credit BC Fisheries, LLC.
II-4
The estimated household income generated by the Oregon commercial fishing industry (includes distant water fisheries) is $570 million in 2017.1 Using a statewide ratio of household net earnings to full and part time jobs, the economic contribution is equivalent to about 10 thousand jobs. This job estimate is a slight decrease over 2016, and about a 10 percent decrease over the previous five-year average. The Oregon commercial fishing industry representation along Oregon Coast economies varies. The industry in 2017 represented about one-half percent of statewide net earnings and nine percent of Oregon Coast net earnings. The commercial fishing industry share of local net earnings in 2017 ranged from over 17 percent in Lincoln County to two percent in Tillamook County (Table II.5). Economic contribution due to the commercial fishing industry may also be generated from many activities other than just harvesting and seafood processing – for example, visitors attracted to food service and retail markets selling local harvests, and tourists drawn to working waterfronts. There are boat building and gear manufacturing businesses at some ports. Management, enforcement/safety, research, education, and training are related economic contributors. The commercial fishing industry is one component in a larger context maritime industry that would include these additional economic contribution activities. While individual fisheries harvest value and economic contributions are important indicators for showing commercial fishing industry trends, the health of the industry has a social context for the well-being of harvesters, processor workers, affected communities, and ultimately the public. Studies show Oregonians not only care about natural resource conservation, but have empathy and appreciate the life style of the participants. Those involved in the industry know its vagaries: part-time employment, changes in abundances, dangerous weather conditions, volatile prices, and seeming unending surprises in management and regulations. Families and businesses must be dynamic and flexible to survive and prosper. Their resilience and innovation is celebrated by those that enjoy Oregon seafood.
1. Shellfish aquaculture is not included in the economic contribution which has been estimated to be $10 million
(2017 dollars) household income in 2003 (TRG 2006).

II-5
Table II.1 Oregon Harvest Volume and Value by Fishery for Five-Year Average, 2016, and 2017
2012-2016 Five
2012-2017 Year Average 2016 2017
Fishery Value Volume Value Price Volume Value Price Volume Value PriceSalmon 3,371 12,456 3.69 1,844 8,467 4.59 1,196 5,556 4.64 Troll Chinook 1,454 7,960 5.47 595 4,335 7.29 304 2,118 6.97 Troll coho 24 36 1.46 0 0 3 8 2.64 Net Chinook 1,418 3,797 2.68 1,001 3,680 3.68 648 2,949 4.55 Net coho 443 626 1.41 216 404 1.87 223 454 2.03 Other species/gear 32 37 1.15 31 49 1.55 18 27 1.49Dungeness crab 13,907 47,354 3.41 14,246 52,303 3.67 20,483 63,144 3.08Pink shrimp 47,556 29,999 0.63 35,528 25,575 0.72 23,057 12,688 0.55Albacore tuna 8,739 13,407 1.53 7,250 12,742 1.76 4,745 10,803 2.28Groundfish (other than 26,844 15,367 0.57 30,179 17,172 0.57 42,817 20,154 0.47 sablefish and whiting) Trawl gear LE 26,166 13,849 0.53 29,464 15,796 0.54 42,029 18,382 0.44 Fixed gear LE 139 174 1.25 134 167 1.25 163 197 1.21 Fixed gear OA 492 1,326 2.69 488 1,197 2.45 612 1,562 2.55Sablefish 4,487 11,506 2.56 5,538 15,430 2.79 5,557 15,519 2.79 Trawl gear LE 1,998 3,895 1.95 2,323 4,763 2.05 2,555 4,885 1.91 Fixed gear LE 2,303 7,073 3.07 2,859 9,551 3.34 2,705 9,692 3.58 Fixed gear OA 186 538 2.89 356 1,116 3.14 296 942 3.18Pacific whiting 130,264 14,531 0.112 113,035 8,861 0.078 201,499 16,385 0.081Pacific sardine 34,758 4,175 0.120 9 0 0.037 3 0 0.097Pacific halibut 224 1,232 5.50 248 1,419 5.71 269 1,413 5.25Other 8,280 3,367 0.41 17,572 4,916 0.28 4,196 2,947 0.70 Hagfish 1,906 1,633 0.86 1,499 1,325 0.88 1,635 1,573 0.96 Red sea urchin 484 292 0.60 252 156 0.62 282 362 1.29 Pacific (chub) mackerel 1,519 124 0.082 18 2 0.086 100 0 0.004
Total 278,430 153,393 0.55 225,448 146,886 0.65 303,822 148,609 0.49
Notes: 1. Volume and value are in thousands. The harvest value and prices are in 2017 dollars.2. Prices are annual and sometimes are averaged across harvests made using different gear types.
Prices are expressed in round weight equivalents. Average prices for salmon are across seasons and sizes.
3. Acronyms: LE - limited entry, OA - open access.4. D. crab is shown seasonally by December to November for each year, for example 2016 D. crab
includes December 2015 to November 2016.5. Starting in 2011 a small amount of sablefish in the LE trawl individual transferable quota (ITQ)
program is harvested with fixed gear.6. "Other" includes northern anchovy (11.7 million pounds) and market squid (2.8 million pounds) in
2016; and jack mackerel (668 thousand pounds, $8 thousand), shad (375 thousand pounds, $14 thousand), gaper clam (327 thousand pounds, $297 thousand), and basket cockle (285 thousand pounds, $261 thousand) in 2017.
Source: PacFIN fish ticket data, April 2013, March 2014, April 2015, November 2016, March 2017, and June 2018 extractions.
II-6
Table II.2 Oregon Onshore Harvested Volume and Ex-vessel Value by Port Groups for 2016 and 2017
2016 2017
Port Group Volume Value Share Volume Value ShareAstoria 105,247 47,823 32% 154,535 43,641 30%Tillamook 1,392 3,478 2% 2,083 4,800 3%Newport 84,994 49,333 33% 115,043 52,996 37%Coos Bay 22,399 30,879 20% 20,395 30,619 21%Brookings 12,885 19,874 13% 10,299 12,138 8% Port Orford 1,604 4,643 3% 1,160 3,426 2%Total 226,918 151,387 100% 302,355 144,193 100%
Notes: 1. Volume and ex-vessel value are in thousands. Values are in 2017 dollars. 2. See the glossary for which individual ports are included in the different port groups. 3. Onshore landings includes the Oregon side landings in the Columbia River non-Indian and
tribal salmon fishery. All Columbia River landings are included in the Astoria port group. 4. Amounts are for landings during calendar year, including Dungeness crab. Source: PacFIN fish ticket data and annual vessel summary, March 2017 and June 2018 extractions.
II-7
Table II.3 Oregon Vessel Counts and Deliveries by Fishery in 2013 to 2017
2013 2014 2015 2016 2017
Vessel Counts Deliveries Vessel Counts Deliveries Vessel Counts Deliveries Vessel Counts Deliveries Vessel Counts Deliveries
Fishery Total >$500 Total Total >$500 Total Total >$500 Total Total >$500 Total Total >$500 TotalSalmon 588 531 10,610 698 636 11,952 687 607 9,672 510 430 6,737 319 267 5,869 Troll Chinook 397 371 5,249 491 455 5,845 485 448 4,551 311 267 2,261 171 151 1,088 Troll coho 40 4 56 235 70 597 50 18 113 0 0 0 27 5 69 Net Chinook 167 158 4,917 178 169 5,368 170 154 4,584 177 157 4,002 123 110 4,184 Net coho 144 98 1,852 162 134 3,109 144 82 1,574 132 86 1,336 110 76 1,549Dungeness crab 342 323 6,626 348 321 6,351 336 319 6,065 341 319 6,019 362 345 6,535Pink shrimp 60 60 1,017 60 60 1,033 78 78 1,285 75 75 1,051 63 62 754Albacore tuna 380 360 1,365 379 361 1,290 348 322 1,294 367 348 1,440 301 288 1,098Groundfish (other than 339 228 6,204 340 200 5,661 363 246 5,795 329 220 5,120 312 227 6,010 sablefish and whiting) Trawl gear LE 60 60 1,497 60 59 1,410 56 56 1,134 55 55 1,192 56 55 1,687 Fixed gear LE 48 35 575 34 21 316 42 32 463 38 31 459 40 34 496 Fixed gear OA 183 132 3,827 168 119 3,553 213 150 3,891 194 132 3,295 198 137 3,702Sablefish 143 119 1,268 130 110 1,010 140 126 1,512 157 143 1,555 169 156 1,732 Trawl gear LE 57 41 672 57 42 579 56 45 788 53 44 701 55 45 910 Fixed gear LE 45 45 424 42 42 303 43 43 480 40 40 487 40 40 415 Fixed gear OA 42 34 170 33 28 128 47 44 244 67 62 367 76 73 407Pacific whiting 45 24 1,065 40 24 1,010 47 23 755 57 21 882 57 22 1,308Pacific sardine 25 14 458 32 17 198 13 6 49 17 0 70 12 0 62Pacific halibut 119 53 267 195 93 468 173 85 382 163 99 411 121 68 275Other 242 120 6,570 128 49 5,173 112 42 5,304 119 46 7,333 171 65 4,696
All fisheries 1,139 1,094 32,322 1,199 1,152 30,703 1,129 1,068 27,058 1,051 991 27,365 894 859 23,060
Notes: 1. Vessel counts include vessels that landed at Oregon ports and had a valid vessel identification number. Vessels or non-vessels (such as from a dock) with identification of "NONE" or "ZZ..." are excluded. These are typically vessels delivering in tribal fisheries. Total deliveries include those with no valid vessel identification number.
2. The columns titled ">$500" show the number of vessels that landed over $500 of ex-vessel revenue from the shown fishery in Oregon, and is an arbitrary threshold to filter for vessels that are actively participating in the shown fishery. The fisheries are counted separately, so the $500 filter is applied to each. For the "all fisheries" row, the $500 threshold may be landed at any combination of fisheries.
3. Vessel counts and deliveries across fisheries will not sum to the "all fisheries" row because vessels can participate in more than one fishery, deliveries can include more than one fishery, and/or there are other important fisheries not itemized. For example, the Columbia River fisheries include tribal fisheries.
4. Dungeness crab is shown seasonally by December to November for each year, for example 2016 Dungeness crab includes December 2015 to November 2016.
5. "Other" includes (parentheses list 2017 vessels, active vessels, and deliveries): white sturgeon (82, 44, 388), hagfish (10, 8, 188), shad (28, 4, 675), ghost shrimp (1, 0, 1,140), red sea urchin (0, 0, 270), Pacific (chub) mackerel (22, 0, 226), northern anchovy (2, 0, 4), market squid (3, 0, 3), and others
Source: PacFIN fish ticket data, April 2013, January 2014, March 2014, April 2015, November 2016, March 2017, and June 2018 extractions.
II-8
Table II.4
Commercial Fishing Industry Economic Contribution Trends in 2012 to 2017
2012-20162012 2013 2014 2015 2016 Average 2017
OregonEx-vessel value 136.4 188.1 162.5 117.7 151.4 151.2 144.2Landed pounds 306.7 349.4 300.4 203.9 226.9 277.5 302.4Onshore economic contributions 302.0 383.0 306.0 209.5 288.2 297.7 279.6Distant water economic contributions 297.3 313.1 320.9 257.9 290.4 295.9 290.4Total economic contributions 599.3 696.1 626.9 467.4 578.7 593.7 570.0Equivalent jobs (not millions) 11,398 13,306 11,889 8,202 10,265 11,012.0 9,913
Notes: 1. Amounts are in millions, except for equivalent jobs. Values are in 2017 dollars. 2. Economic contribution is income accruing to households. 3. Prior to 2016, the economic contributions are calculated with the Fisheries Economic
Assessment Model (FEAM). For 2016 and 2017 onshore, the input-output model for Pacific Coast fisheries (IO-PAC) is used.
4. Equivalent jobs at the statewide level include jobs within all coastal communities plus jobs in the rest of the state.
5. Distant water 2017 model year estimates are not available, so Year 2016 estimate is assumed the same.
4. Amounts are based on landings during calendar year, including Dungeness crab. Sources: 1. Landing data is from PacFIN annual vessel summary data, April 2013, March 2014, April
2015, November 2016, March 2017, and June 2018 extractions. 2. Average earnings per job data is from BEA through 2017.
II-9
Table II.5 Representation of the Commercial Fishing Industry by Port Groups in Area Economies in 2017
Statewide Coastwide Astoria Tillamook Newport Coos Bay Brookings
Amount Percent Amount Percent Amount Percent Amount Percent Amount Percent Amount Percent Amount Percent
All income 199,422.2 0.3% 8,418.3 4.3% 1,676.0 6.6% 1,112.4 1.0% 2,027.6 8.5% 2,670.7 2.1% 931.7 1.3% Earned income 121,153.6 0.5% 4,066.5 8.9% 904.3 12.2% 536.4 2.1% 986.7 17.4% 1,269.0 4.3% 370.2 3.3% Fishing income 570.0 360.6 110.4 11.4 171.6 55.1 12.1 Onshore 279.6 210.2 80.6 5.8 63.9 49.3 10.5 Distant water 290.4 150.4 29.8 5.6 107.6 5.8 1.6 Equivalent jobs 9,913 8,182 2,401 253 3,924 1,179 311
Notes: 1. Income is in millions. Earned income is the sum of wages and salaries, and proprietors' income. All income includes
earnings, transfer payments (such as Social Security payments, etc.), and investment income (such as privatepensions, etc.).
2. Earned income and all income estimates are adjusted for place of residence. Fishing income is for place of work.Fishing income comparison may overstate the calculated share since some of the income may accrue to places outside of the comparison location. Earned and all income is from households within Clatsop County for Astoria port group, Tillamook County for Tillamook port group, Lincoln County for Newport port group, Coos County for Coos Bay port group, and Curry County for Brookings port group.
3. Earnings per job are county annual average computed by dividing all industry earnings estimates by total full-time and part-time jobs estimates. Average earnings per job within industries involving more part-time work is lower than industries involving more full-time work, although there could be little difference in the underlying wage of full-time workers. Average earnings per job would not account for variations in the distribution of earnings among high-pay vs. low-pay jobs.
4. Distant water fisheries income can be centered at coastal communities where businesses sell goods and services to participants and the business labor has residency in those communities. Some income for distant water fisheries is directly returned to Oregon via crewmember and permit/vessel owner participant earnings. Participants may live on the Oregon Coast or elsewhere in Oregon.
5. Onshore fishing income is based on landings during calendar year, including Dungeness crab.Source: Income and earnings data is from U.S. Department of Commerce, Bureau of Economic Analysis.
III-1
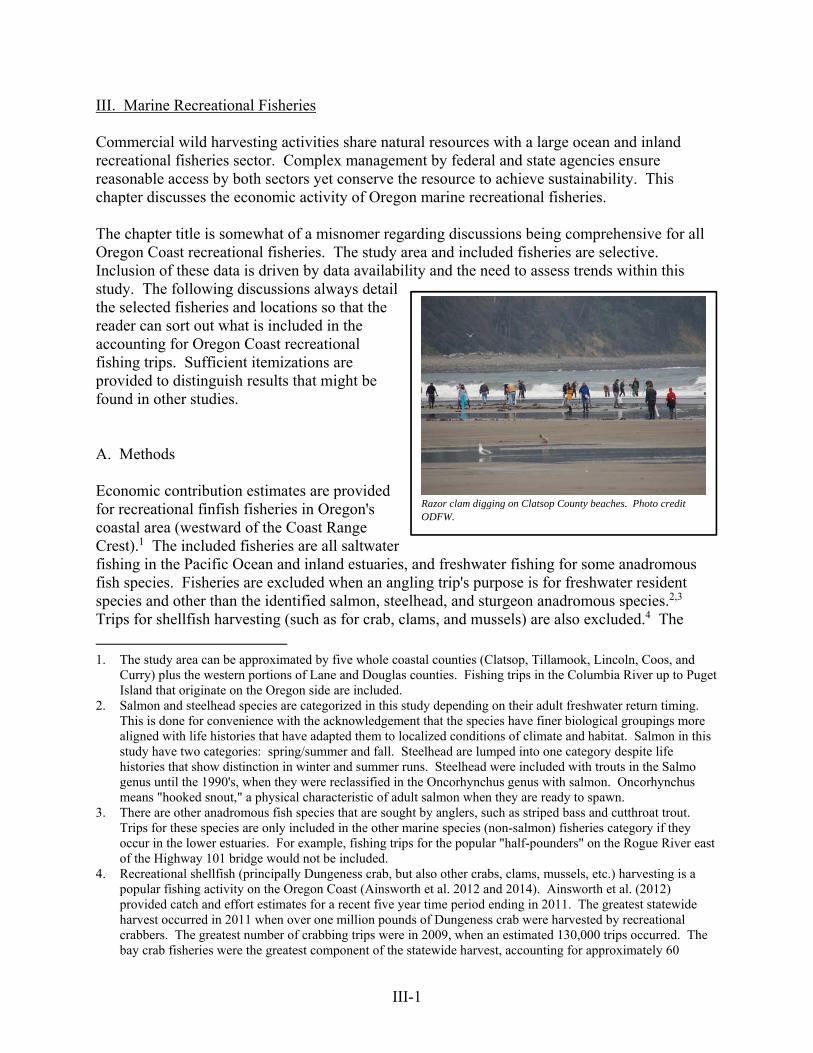
III. Marine Recreational Fisheries Commercial wild harvesting activities share natural resources with a large ocean and inland recreational fisheries sector. Complex management by federal and state agencies ensure reasonable access by both sectors yet conserve the resource to achieve sustainability. This chapter discusses the economic activity of Oregon marine recreational fisheries. The chapter title is somewhat of a misnomer regarding discussions being comprehensive for all Oregon Coast recreational fisheries. The study area and included fisheries are selective. Inclusion of these data is driven by data availability and the need to assess trends within this study. The following discussions always detail the selected fisheries and locations so that the reader can sort out what is included in the accounting for Oregon Coast recreational fishing trips. Sufficient itemizations are provided to distinguish results that might be found in other studies. A. Methods Economic contribution estimates are provided for recreational finfish fisheries in Oregon's coastal area (westward of the Coast Range Crest).1 The included fisheries are all saltwater fishing in the Pacific Ocean and inland estuaries, and freshwater fishing for some anadromous fish species. Fisheries are excluded when an angling trip's purpose is for freshwater resident species and other than the identified salmon, steelhead, and sturgeon anadromous species.2,3 Trips for shellfish harvesting (such as for crab, clams, and mussels) are also excluded.4 The
1. The study area can be approximated by five whole coastal counties (Clatsop, Tillamook, Lincoln, Coos, and
Curry) plus the western portions of Lane and Douglas counties. Fishing trips in the Columbia River up to Puget Island that originate on the Oregon side are included.
2. Salmon and steelhead species are categorized in this study depending on their adult freshwater return timing. This is done for convenience with the acknowledgement that the species have finer biological groupings more aligned with life histories that have adapted them to localized conditions of climate and habitat. Salmon in this study have two categories: spring/summer and fall. Steelhead are lumped into one category despite life histories that show distinction in winter and summer runs. Steelhead were included with trouts in the Salmo genus until the 1990's, when they were reclassified in the Oncorhynchus genus with salmon. Oncorhynchus means "hooked snout," a physical characteristic of adult salmon when they are ready to spawn.
3. There are other anadromous fish species that are sought by anglers, such as striped bass and cutthroat trout. Trips for these species are only included in the other marine species (non-salmon) fisheries category if they occur in the lower estuaries. For example, fishing trips for the popular "half-pounders" on the Rogue River east of the Highway 101 bridge would not be included.
4. Recreational shellfish (principally Dungeness crab, but also other crabs, clams, mussels, etc.) harvesting is a popular fishing activity on the Oregon Coast (Ainsworth et al. 2012 and 2014). Ainsworth et al. (2012) provided catch and effort estimates for a recent five year time period ending in 2011. The greatest statewide harvest occurred in 2011 when over one million pounds of Dungeness crab were harvested by recreational crabbers. The greatest number of crabbing trips were in 2009, when an estimated 130,000 trips occurred. The bay crab fisheries were the greatest component of the statewide harvest, accounting for approximately 60
Razor clam digging on Clatsop County beaches. Photo credit ODFW.
III-2
presented economic information includes findings from other researchers, as well as economic modeling results developed for this project. The selected recreational finfish fisheries in the study area have two major segments: when salmon is the targeted species; and, when all other non-salmon species are the primary purpose for making the fishing trip.1 These two recreational fishery segments are further defined by where fishing occurs (ocean or inland), mode (boat or bank), and whether guide services were used. Trip expenses and consequently the local economic contributions generated are quite different for these sub-segments. Ocean boat salmon fishing has much higher spending per trip, but there are more trips for the inland location. The primary ocean non-salmon fishery is often times referred to as the bottomfish fishery. Species targeted in this fishery are mostly bottom dwelling rockfish. There are also many charter and private boat trips for halibut and albacore tuna. Each of these non-salmon targeted species is itemized in the trip accounting for this study. A trip made for recreation purposes may be for multiple reasons, such as fishing and visiting a museum. It could be the spending and consequently the economic contribution estimates in this study overlap with other studies of non-fishing recreational activities. The appendix Table A.2 shows trip expenditures per day for the various fisheries and fishing mode. No differentiation is made between anglers that are resident and nonresidents. This is important to point out because non-resident spending in regional economies generates new income through their trip expenditures. Local resident fishing trip spending may or may not have been spent anyway in the regional economy, so the economic contribution estimates cannot be considered calculations of basic industry economic contribution. The economic contribution estimates do include the multiplier effect from respending in the local economy. The multiplier effect estimates are calculated using relationships from an economic input-output model. The calculations start with estimates of angler spending for a fishing trip's variable cost. This means the economic contributions do not include effects from capital purchase items like boats. There are other studies that do include fishing capital costs which might be of interest to readers of this report: Gentner and Steinback (2008) and USFWS (2017).2
percent of the annual total recreational harvest. The study did not sort out when crabbing trips are combined with finfish angling. The crabbing trip estimates were conservative because only five of nine major bays were sampled, only boat-based crabbing effort was counted, and the time period when sampling occurred was restricted to summer and fall months. The largest clam fisheries are for razor clams and for a group of clams collectively known as bay clams found, as the name implies, within the state's many bays and estuaries (Ainsworth et al. 2014). Bay clams (including cockles, butter clams, gaper clams, and native littleneck clams) are targeted for recreational and commercial harvest in Oregon. Popular bays for clamming in 2012 were the Tillamook (11,018 digging trips), Netarts (13,653 trips), Yaquina (7,052 trips), and Coos Bay (9,729 trips).
1. There is cross over between these two fisheries' segments. When non-salmon species are caught when salmon is the primary target species, the trip is counted as a salmon trip.
2. There are modeling issues associated with determining the economic effects from capital purchases in a regional economic study such as the Oregon Coast. One issue is where the spending for capital items has occurred. Was the spending in the angler's resident economy, en route to the fishing location, or at the fishing location? Another is how much of the capital item is actually associated with fishing. A pickup truck used to pull a boat may be used for other transportation purposes too. Estimates of the economic effects from equipment and other capital items vary widely in studies. For example, Gentner and Steinback (2008) found that in 2006 63.6 percent of total economic contributions were from durable goods used for saltwater fishing in
III-3
Oregon Coast recreational fishing trips have had increasing and decreasing trends over the last 20 years especially when salmon is the targeted species (Table III.1 and Figure III.1). There is not always a direct one-to-one relationship between abundance and response of angler's trip making. It would be expected that trips would decline (increase) with decreasing (increasing) abundance, but the rate of change would not be the same, i.e. the relationship is inelastic (Andrews and Wilen 1988; Allen et al. 2013; Larson and Lew 2013). The reason has to do with the intricacies of angler motivations, such as perceived success rate, fishing trip costs, and other factors that influence angler behavior. Schramm and Gerard (2004) discuss these factors on a nationwide basis. Some anglers choose to make a fishing trip just to have an outdoor experience and others are more motivated by catch aspects (numbers and size of fish). If recreational fishers elect not to fish, they may instead spend the same trip expenditures in non-fishing activities in the local economy. There were many data sources and economic modeling considerations used in making the economic contribution estimates.1 The reader is encouraged to review TRG (2015b) for discussions about the data limitations. B. Description The total economic contributions measured by income for the analyzed recreational fisheries in 2016 are estimated to be $61.8 million and in 2017 are estimated to be $54.7 million. There were an estimated 42.3 thousand ocean salmon fishing angler days generating $2.6 million economic contribution in 2017 (Table III.2 and Figure ES.4). Ocean non-salmon angler days were estimated to be 128.6 thousand which generated $10.7 million in economic contributions. Of this amount, $8.4 million was generated when bottomfish was the target species or trips were for diving. Halibut as a target species generated $1.8 million and tuna as a target species generated $0.5 million. The inland recreational fisheries can be defined first by those fisheries in all non- Columbia River inland locations, and second by the lower Columbia River estuary and its tributaries. The total non-Columbia River coastal inland estuary and freshwater fisheries estimated angler days were 0.8 million and the economic contribution is estimated to be $35.3 million for the 2017 season. (Year 2017 non-Columbia River catch and effort estimates are preliminary.) Of this, salmon fisheries generated $23.0 million in coastal economies. This includes all spring, summer,
Oregon. The U.S. Fish and Wildlife Service (USFWS) National Survey in data year 2016 found total fishing nationwide spending was 53 percent for non-trip related items such as equipment, boats, and other non-durable items (USFWS 2017).
1. For descriptions about stock conditions and management approaches, the reader is directed to salmon, groundfish, halibut, and highly migratory species fishery management plans developed by the Pacific Fishery Management Council (PFMC) as a start in better understanding fishery conditions. Freshwater anadromous fish returning to the Columbia River have overwhelming libraries of past and ongoing study publications. Current in-river management regimes are described in Columbia River Compact joint state staff reports and action notices. A wealth of information about anadromous fish returning to Oregon Coast streams can be found at the Oregon Department of Fish and Wildlife (ODFW) conservation and recovery plan website. Whiteside et al. (2017) discuses the efficacy of using RecFIN data for estimating effort in the bay marine fishery.
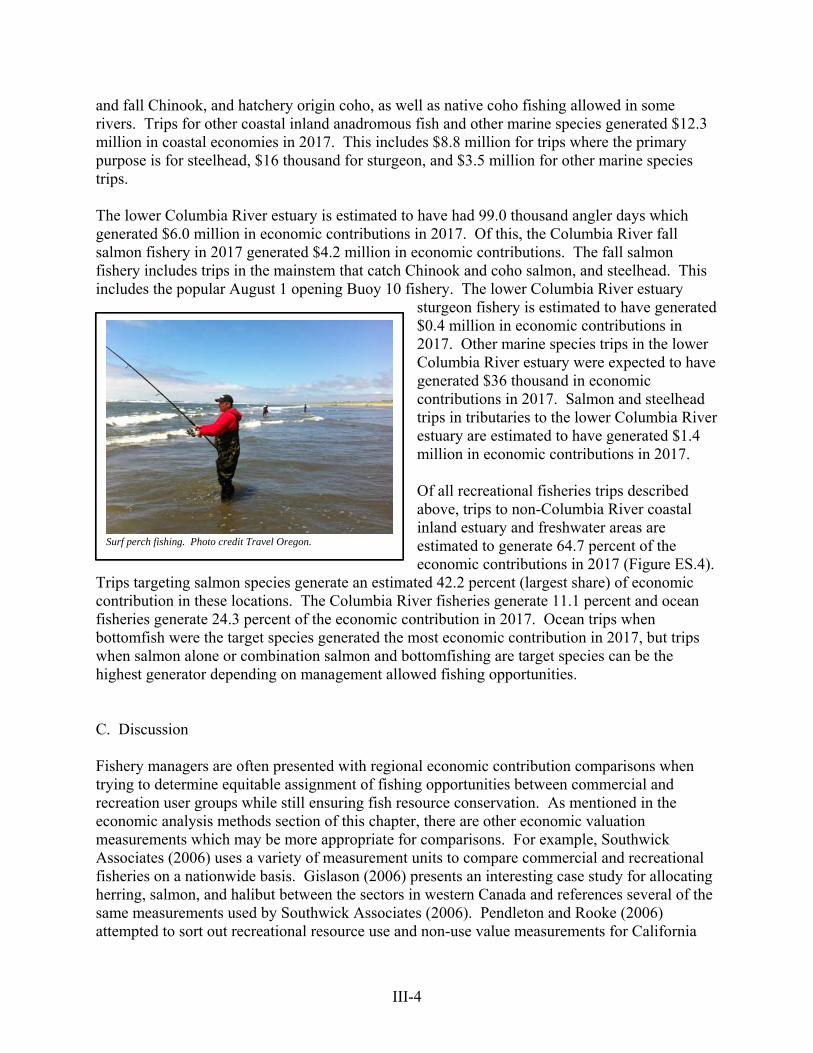
III-4
and fall Chinook, and hatchery origin coho, as well as native coho fishing allowed in some rivers. Trips for other coastal inland anadromous fish and other marine species generated $12.3 million in coastal economies in 2017. This includes $8.8 million for trips where the primary purpose is for steelhead, $16 thousand for sturgeon, and $3.5 million for other marine species trips. The lower Columbia River estuary is estimated to have had 99.0 thousand angler days which generated $6.0 million in economic contributions in 2017. Of this, the Columbia River fall salmon fishery in 2017 generated $4.2 million in economic contributions. The fall salmon fishery includes trips in the mainstem that catch Chinook and coho salmon, and steelhead. This includes the popular August 1 opening Buoy 10 fishery. The lower Columbia River estuary
sturgeon fishery is estimated to have generated $0.4 million in economic contributions in 2017. Other marine species trips in the lower Columbia River estuary were expected to have generated $36 thousand in economic contributions in 2017. Salmon and steelhead trips in tributaries to the lower Columbia River estuary are estimated to have generated $1.4 million in economic contributions in 2017. Of all recreational fisheries trips described above, trips to non-Columbia River coastal inland estuary and freshwater areas are estimated to generate 64.7 percent of the economic contributions in 2017 (Figure ES.4).
Trips targeting salmon species generate an estimated 42.2 percent (largest share) of economic contribution in these locations. The Columbia River fisheries generate 11.1 percent and ocean fisheries generate 24.3 percent of the economic contribution in 2017. Ocean trips when bottomfish were the target species generated the most economic contribution in 2017, but trips when salmon alone or combination salmon and bottomfishing are target species can be the highest generator depending on management allowed fishing opportunities. C. Discussion Fishery managers are often presented with regional economic contribution comparisons when trying to determine equitable assignment of fishing opportunities between commercial and recreation user groups while still ensuring fish resource conservation. As mentioned in the economic analysis methods section of this chapter, there are other economic valuation measurements which may be more appropriate for comparisons. For example, Southwick Associates (2006) uses a variety of measurement units to compare commercial and recreational fisheries on a nationwide basis. Gislason (2006) presents an interesting case study for allocating herring, salmon, and halibut between the sectors in western Canada and references several of the same measurements used by Southwick Associates (2006). Pendleton and Rooke (2006) attempted to sort out recreational resource use and non-use value measurements for California
Surf perch fishing. Photo credit Travel Oregon.
III-5
recreational fisheries and discussed allocation policy implications. Additional cautions on the use of regional economic impact assessments are in Propst and Gavrilis (1987). Hanna et al. (2006) discusses the application of economics to fishery allocation issues and they caution against misinterpretation and misuse of economic analysis. Plummer et al. (2012) cited many economic studies that discuss economic efficiency and fairness/equity concepts related to making user group allocation decisions. The report is noteworthy in the compilation of many user group allocation practices used by U.S. ocean fishery management councils. Reducing economic measurements to a per fish value whether using regional economic contribution estimates or other economic valuation can be a misuse of economic analysis. Commercial fisheries economic contributions are a result of the total operations that transcend different fish resources found off the Oregon Coast and even include distant water fisheries in Alaska. Profit from harvest and processing revenue and operation expenditure variables change significantly from year to year. Recreational fisheries are equally complicated. Spending comes from a commitment to make the trip and not from the number of fish caught. Also, angling is one form of outdoor recreation that is tied to the more general tourism industry. The attraction of just the opportunity to fish have been one motivation to make a trip amongst other planned general tourism activities (OPRD 2013). Moreover, vibrant and year around fisheries access is an indicator of healthy natural resources and can be considered an economic development asset. Living in such an environment is attractive to entrepreneurs and employees. The attraction is an important decision variable with more straightforward business location considerations such as market and suppliers logistics, and labor costs. Fish resource management and policy alternatives have to be weighed for their potential complex outcomes on conservation and society. Well-intended decisions can lead to unexpected effects when outcome evaluations are not provided or are specious. Economic information along with other social and environmental impact interpretations can assist the decision making process in a tractable manner. For example, policy makers might be interested when the sum of two or more user groups' net economic value is optimal when determining fisheries access allocations. If such information is to be included in decision making, a research plan that determines data collection needs and desired analyses should first be designed. Otherwise, incompatible measurements may be promulgated by interest groups to favor allocation or conservation in their direction. The intent herein is to provide sufficiently qualified descriptions in this report such that improper use of presented statistics will not occur.
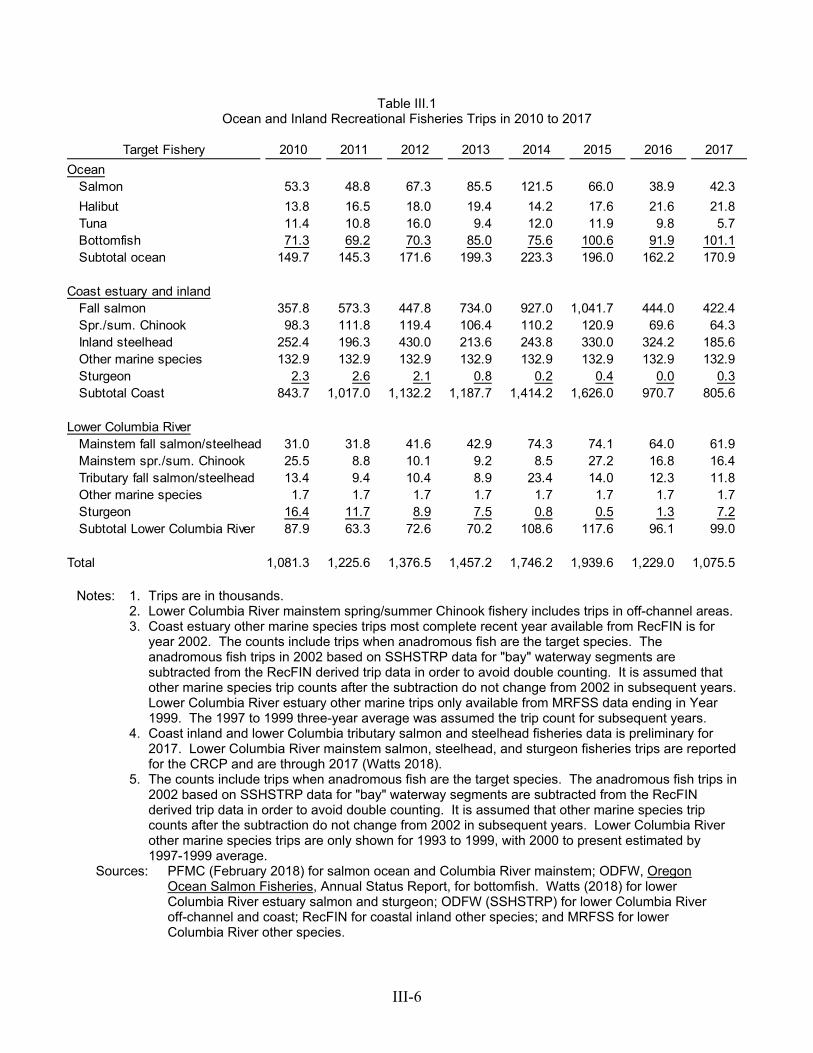
III-6
Table III.1 Ocean and Inland Recreational Fisheries Trips in 2010 to 2017
Target Fishery 2010 2011 2012 2013 2014 2015 2016 2017
OceanSalmon 53.3 48.8 67.3 85.5 121.5 66.0 38.9 42.3
Halibut 13.8 16.5 18.0 19.4 14.2 17.6 21.6 21.8Tuna 11.4 10.8 16.0 9.4 12.0 11.9 9.8 5.7Bottomfish 71.3 69.2 70.3 85.0 75.6 100.6 91.9 101.1Subtotal ocean 149.7 145.3 171.6 199.3 223.3 196.0 162.2 170.9
Coast estuary and inlandFall salmon 357.8 573.3 447.8 734.0 927.0 1,041.7 444.0 422.4Spr./sum. Chinook 98.3 111.8 119.4 106.4 110.2 120.9 69.6 64.3Inland steelhead 252.4 196.3 430.0 213.6 243.8 330.0 324.2 185.6Other marine species 132.9 132.9 132.9 132.9 132.9 132.9 132.9 132.9Sturgeon 2.3 2.6 2.1 0.8 0.2 0.4 0.0 0.3Subtotal Coast 843.7 1,017.0 1,132.2 1,187.7 1,414.2 1,626.0 970.7 805.6
Lower Columbia RiverMainstem fall salmon/steelhead 31.0 31.8 41.6 42.9 74.3 74.1 64.0 61.9Mainstem spr./sum. Chinook 25.5 8.8 10.1 9.2 8.5 27.2 16.8 16.4Tributary fall salmon/steelhead 13.4 9.4 10.4 8.9 23.4 14.0 12.3 11.8Other marine species 1.7 1.7 1.7 1.7 1.7 1.7 1.7 1.7Sturgeon 16.4 11.7 8.9 7.5 0.8 0.5 1.3 7.2Subtotal Lower Columbia River 87.9 63.3 72.6 70.2 108.6 117.6 96.1 99.0
Total 1,081.3 1,225.6 1,376.5 1,457.2 1,746.2 1,939.6 1,229.0 1,075.5
Notes: 1. Trips are in thousands. 2. Lower Columbia River mainstem spring/summer Chinook fishery includes trips in off-channel areas. 3. Coast estuary other marine species trips most complete recent year available from RecFIN is for
year 2002. The counts include trips when anadromous fish are the target species. The anadromous fish trips in 2002 based on SSHSTRP data for "bay" waterway segments are subtracted from the RecFIN derived trip data in order to avoid double counting. It is assumed that other marine species trip counts after the subtraction do not change from 2002 in subsequent years. Lower Columbia River estuary other marine trips only available from MRFSS data ending in Year 1999. The 1997 to 1999 three-year average was assumed the trip count for subsequent years.
4. Coast inland and lower Columbia tributary salmon and steelhead fisheries data is preliminary for 2017. Lower Columbia River mainstem salmon, steelhead, and sturgeon fisheries trips are reported for the CRCP and are through 2017 (Watts 2018).
5. The counts include trips when anadromous fish are the target species. The anadromous fish trips in 2002 based on SSHSTRP data for "bay" waterway segments are subtracted from the RecFIN derived trip data in order to avoid double counting. It is assumed that other marine species trip counts after the subtraction do not change from 2002 in subsequent years. Lower Columbia River other marine species trips are only shown for 1993 to 1999, with 2000 to present estimated by 1997-1999 average.
Sources: PFMC (February 2018) for salmon ocean and Columbia River mainstem; ODFW, Oregon Ocean Salmon Fisheries, Annual Status Report, for bottomfish. Watts (2018) for lower Columbia River estuary salmon and sturgeon; ODFW (SSHSTRP) for lower Columbia River off-channel and coast; RecFIN for coastal inland other species; and MRFSS for lower Columbia River other species.
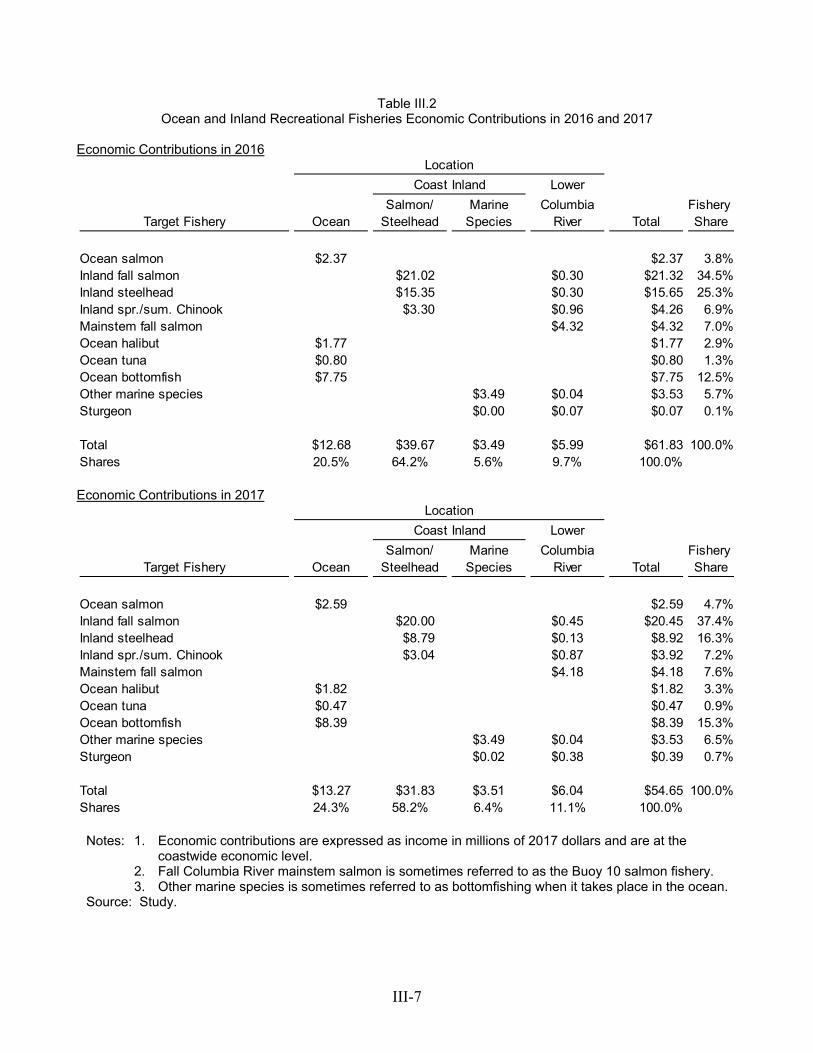
III-7
Table III.2 Ocean and Inland Recreational Fisheries Economic Contributions in 2016 and 2017
Economic Contributions in 2016
Location
Coast Inland Lower
Salmon/ Marine Columbia FisheryTarget Fishery Ocean Steelhead Species River Total Share
Ocean salmon $2.37 $2.37 3.8%Inland fall salmon $21.02 $0.30 $21.32 34.5%Inland steelhead $15.35 $0.30 $15.65 25.3%Inland spr./sum. Chinook $3.30 $0.96 $4.26 6.9%Mainstem fall salmon $4.32 $4.32 7.0%Ocean halibut $1.77 $1.77 2.9%Ocean tuna $0.80 $0.80 1.3%Ocean bottomfish $7.75 $7.75 12.5%Other marine species $3.49 $0.04 $3.53 5.7%Sturgeon $0.00 $0.07 $0.07 0.1%
Total $12.68 $39.67 $3.49 $5.99 $61.83 100.0%Shares 20.5% 64.2% 5.6% 9.7% 100.0%
Economic Contributions in 2017
Location
Coast Inland Lower
Salmon/ Marine Columbia FisheryTarget Fishery Ocean Steelhead Species River Total Share
Ocean salmon $2.59 $2.59 4.7%Inland fall salmon $20.00 $0.45 $20.45 37.4%Inland steelhead $8.79 $0.13 $8.92 16.3%Inland spr./sum. Chinook $3.04 $0.87 $3.92 7.2%Mainstem fall salmon $4.18 $4.18 7.6%Ocean halibut $1.82 $1.82 3.3%Ocean tuna $0.47 $0.47 0.9%Ocean bottomfish $8.39 $8.39 15.3%Other marine species $3.49 $0.04 $3.53 6.5%Sturgeon $0.02 $0.38 $0.39 0.7%
Total $13.27 $31.83 $3.51 $6.04 $54.65 100.0%Shares 24.3% 58.2% 6.4% 11.1% 100.0%
Notes: 1. Economic contributions are expressed as income in millions of 2017 dollars and are at the
coastwide economic level. 2. Fall Columbia River mainstem salmon is sometimes referred to as the Buoy 10 salmon fishery. 3. Other marine species is sometimes referred to as bottomfishing when it takes place in the ocean. Source: Study.
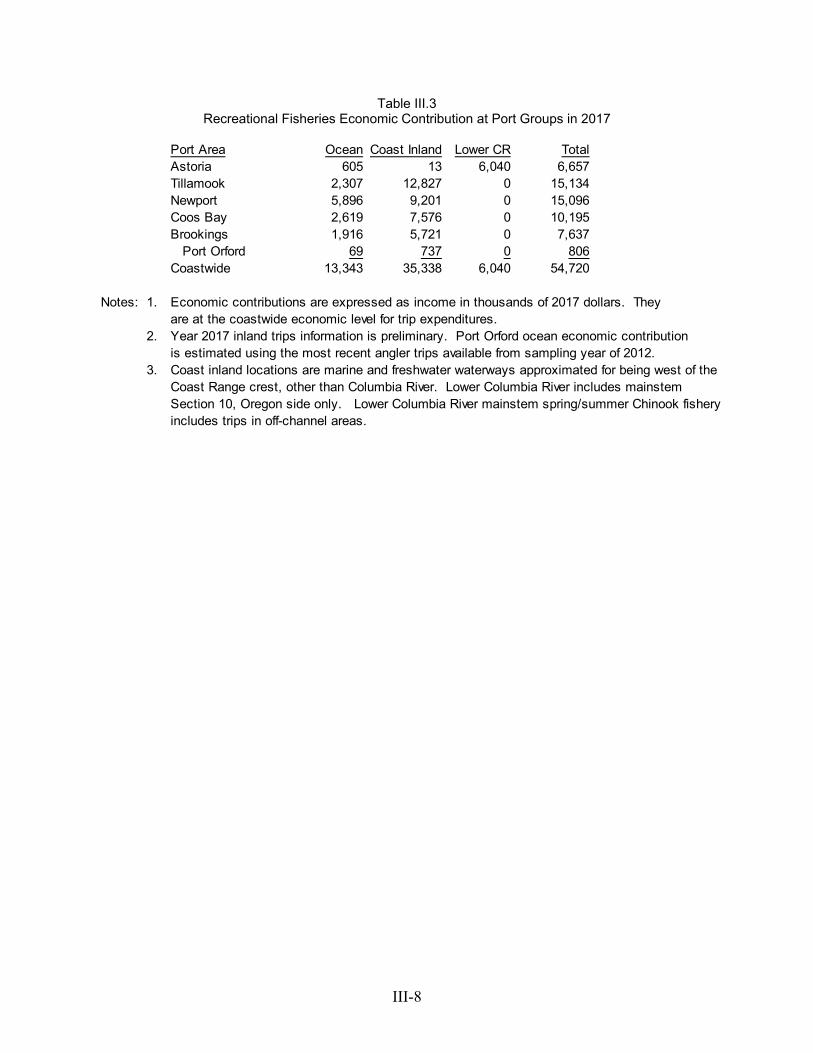
III-8
Table III.3 Recreational Fisheries Economic Contribution at Port Groups in 2017
Port Area Ocean Coast Inland Lower CR TotalAstoria 605 13 6,040 6,657Tillamook 2,307 12,827 0 15,134Newport 5,896 9,201 0 15,096Coos Bay 2,619 7,576 0 10,195Brookings 1,916 5,721 0 7,637 Port Orford 69 737 0 806Coastwide 13,343 35,338 6,040 54,720
Notes: 1. Economic contributions are expressed as income in thousands of 2017 dollars. They are at the coastwide economic level for trip expenditures.
2. Year 2017 inland trips information is preliminary. Port Orford ocean economic contribution is estimated using the most recent angler trips available from sampling year of 2012.
3. Coast inland locations are marine and freshwater waterways approximated for being west of the Coast Range crest, other than Columbia River. Lower Columbia River includes mainstem Section 10, Oregon side only. Lower Columbia River mainstem spring/summer Chinook fishery includes trips in off-channel areas.
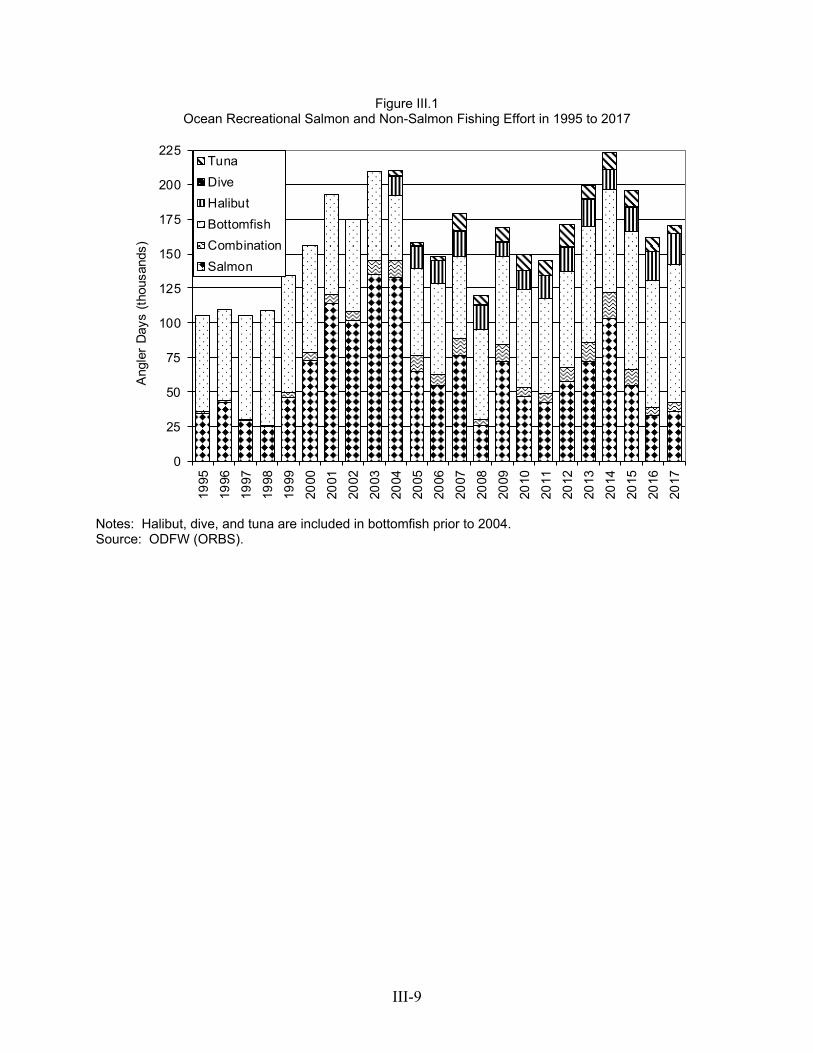
III-9
Figure III.1 Ocean Recreational Salmon and Non-Salmon Fishing Effort in 1995 to 2017
0
25
50
75
100
125
150
175
200
225
1995
1996
1997
1998
1999
2000
2001
2002
2003
2004
2005
2006
2007
2008
2009
2010
2011
2012
2013
2014
2015
2016
2017
Ang
ler
Day
s (t
hous
ands
)
Tuna
Dive
Halibut
Bottomfish
Combination
Salmon
Notes: Halibut, dive, and tuna are included in bottomfish prior to 2004. Source: ODFW (ORBS).
IV-1
IV. Nearshore Fisheries A. Overview An economic activity description is provided for nearshore fisheries, i.e. commercial and recreational fisheries that take place within the TS and adjacent bays. The description is provided to assist in characterizing the potential economic impact from marine reserve management. Nearshore fisheries are usually defined by place of harvest. ODFW (2016) specifies the nearshore area to be the Oregon Territorial Sea (TS) and includes bays in the definition. Bays are the portions of estuaries where species depend on saltwater. The ODFW definition is expanded for this report by assuming bay recreational fisheries include anadromous fish harvests in coastal rivers and streams freshwater segments. Subareas for the place definition used in this report are port groupings where nearshore fisheries landings are made. The glossary lists the major ports, census data areas, and river/streams associated with port groups. In order to show commercial and recreational fishing activity that occurs in nearshore waters, a vexing problem is that harvest data has poor or non-existent information about harvest location. Some, but not all, fisheries have logbook information that does have harvest location. TRG (February 2018) used surficial geologic habitat (SGH) data and species habitat association information combined with landing data to pinpoint nearshore harvest location. Certain groundfish species will generally occupy shallow water or structure only found within the TS. Other species will occupy and be harvested both within the TS and beyond, such as Dungeness crab and salmon. The following nearshore fisheries descriptions rely on the species identifications made in TRG (February 2018) to compile the commercial and recreational fishing activity.1 Nearshore commercial and recreational fisheries activity is substantial (Figure ES.5). Total commercial fishing onshore landed value was $151.4 million in 2016. There were 162.2 thousand ocean recreational trips in 2016 of which 34 percent are estimated to be via charter boat services. The nearshore fisheries proportion of commercial and recreational community economic contribution in 2016 was $120 million. This represents 19 percent of Oregon total commercial and recreational fishing industry (includes distant water fisheries) economic contribution which was $640 million in 2016 (Figure ES.5).2 The most important (highest harvest revenue generating) nearshore fisheries are Dungeness crab, salmon troll, and nearshore groundfish. While the three fisheries fishing grounds may be within the nearshore area for some fishers for some of the season, fishing activity for the fisheries will include ocean areas westward of the TS.3 Table IV.1 shows landed value for the nearshore 1. A summary explanation of which species are included in nearshore groundfish is contained in the glossary. 2. Recreational ocean and bay crabbing is not included in the compilation which generated an estimated $6 million
income in 2017. (Trips are from Ainsworth et al. (2012) and economic contributions based on per trip spending from Dean Runyan Associates (2009) and Gentner et al. (2001).)
3. The nearshore fisheries proportion of the commercial salmon troll fishery was estimated in the TRG (February 2018) project to be 35 percent from CROOS project results (personal communication Pete Lawson, NMFS April 2015) and the nearshore proportion of the Dungeness crab fishery was estimated to be 54 percent from six
IV-2
fisheries and other major fishery categories at port groups in 2016.1 The coastwide total for the nearshore fisheries was $61.5 million in 2016 and the coastwide total of all fisheries was $148.5 million. Not all vessels with permits in any of the three nearshore fisheries will participate in any given year. Some of the many reasons are (Holland et al. 2004; Pelletier and Mahévas 2005; Saul and Die 2016):
Fish resource levels that will affect assumed CPUE, Changed distance to fishing grounds caused by modified management specifications, Other altered cost factors affecting perceived net revenue, Vessel physical problems, Crew labor complications, Unresolved processor purchasing issues, or simply Personal investment choice made by the permit owner unrelated to fishing.
The average annual year-over-year rate of permittee new or re-entrance in the three nearshore fisheries is 14.8 percent for Dungeness crab, 33.3 percent for salmon troll, and 25.0 percent for nearshore groundfish during 2006 to 2016 period. The churn of vessels leaving and entering all fisheries at port groups is shown on Table IV.2. (Appendix B shows itemization by year for the exit and entry vessel counts.) The table itemizes the 2007-2016 average annual intra-state status (make landings at another port group or do not show any in-state activity) for those that exit and those that enter. A little less than half that do exit/enter come-from or go-to another Oregon port. The rest do not participate in Oregon fisheries. The Newport port group had the highest average churn (combined exit and entry rate during the 2006 to 2016 period) and the Port Orford port group was the lowest at about half of Newport's rate. B. Fleet Characteristics This section dwells on nearshore fisheries participant characteristics to emphasize that vessels and processors/buyers are not a homogenous group. The descriptors are for all vessels that have harvested and processors/buyers that have purchased nearshore groundfish species. This includes vessels that target nearshore groundfish species as well as those with catch that is incidental to other directed fisheries. Descriptions are for processors/buyers that specialize in the nearshore groundfish fishery and others that have included the fishery in a suite of other fisheries. The descriptors are for a single year 2016. The descriptors are participant counts and landing value, which is sometimes synonymously referred to as vessel revenue and processor purchases. Fishery participant diversity can be cast in many different dimensions, albeit the more the better to understand richness. For this report, just three dimensions are used to demonstrate fleet
year average ending in the 2013-2014 season logbook information (ODFW personal communication May 2015).
1. The table's Dungeness crab and salmon troll fisheries are not apportioned to harvesting taking place within the TS.
IV-3
heterogeneity: permit types that allow for harvesting nearshore groundfish, average nearshore fisheries revenue, and the location where nearshore groundfish landings occur. Monitoring diversity temporally should include other dimensions, such as revenue inequality, to better illustrate how changed environmental conditions and fishery management have affected the fishery participants. Table IV.3 presents nearshore fishery vessel counts and revenue distribution in 2016. There were 253 vessels that delivered nearshore groundfish species. Concerning permit types, 79 percent of all vessels are open access with the balance either LE trawl (19 percent) or LE fixed gear (two percent). The 79 percent open access vessels are 38 percent with an Oregon Nearshore Fisheries Permit and 41 percent without. The top 88 nearshore groundfish revenue producing vessels (35 percent) delivered 90 percent of the $1.5 million nearshore groundfish landings. The top 75 vessels (30 percent) delivered 90 percent of the $51.0 million "all fisheries" landings. The top 10 vessels delivering nearshore groundfish have average landings $41,823 for the fishery, and their total is 28.1 percent of all vessels nearshore groundfish landings. The top 10 vessels delivering nearshore groundfish average landings in all fisheries is $1.4 million, and their total is 28.3 percent of all nearshore groundfish vessels' Oregon onshore revenue. Typical and representative average revenue profiles can be used to further explain fleet diversity. (This report's glossary explains the two average types.) Using groundfish permit criteria for four categories provides some illumination of fleet diversity; more research on finding common factors for subcategories would be needed to provide a more complete portrayal of fleet diversity. A more detailed categorization scheme would ferret out vessels with similar business strategies and who are the principal nearshore groundfish harvesters. Appendix Table D.1 shows how some participants are much more dependent on the nearshore groundfish fishery than others. Vessels with LE trawl and LE fixed gear permit types have high nearshore groundfish representative average landings ($6,636 and $6,225 respectively), but are least dependent on the fishery (one percent and two percent respectively). Most of these permitted vessels landings are flatfish species and lingcod. Open access vessels with a permit representative average is $10,442, which is 32 percent dependency, and open access vessels without a permit representative average is $1,272, which is two percent dependency. Open access vessels land rockfish species and lingcod caught with hook and line gear. Typical and representative revenue averages by major fishery category for vessels participating in the nearshore groundfish fishery at port groups and coastwide in 2016 are shown on Appendix Table D.2. The table shows that vessels have a portfolio of fisheries to rely upon for operations.
Cape Perpetua Marine Reserve. Photo credit ODFW.
IV-4
The port group with the highest share of vessels making landings using an open access permit type is Tillamook (100 percent) closely followed by Port Orford (92 percent). Newport has the most diversified permit type shares with open access being 69 percent. Descriptions of the processing/buyer sector that purchases nearshore groundfish can be informative about other coastal businesses that are dependent on the fishery. The additional sector descriptions are helpful to show the wider picture of community sensitivity to the nearshore groundfish fishery's status. Appendix Table D.3 shows a comparison of processors/buyers that purchase more than $10 thousand of nearshore groundfish, processors/buyers that specialize in the nearshore groundfish fishery, and for comparison purposes, processors/buyers with more than $10 thousand in any fishery. Purchases are itemized by major fisheries categories. Processors/buyers that do make the large purchases of nearshore groundfish have representative average purchases five times higher than all processors making purchases over $10,000 in any fisheries ($63,958 versus $12,266). There were seven processors/buyers that specialize in the nearshore groundfish fishery (nearshore groundfish fishery purchases greater than 50 percent). There are processor/buyer businesses whose only purchases are live nearshore groundfish landings whose markets are Asian country exports or domestic restaurants with Asian oriented menus (TRG 2017). Selling live fish and shellfish is popular among ethnic markets, traditionally centered in urban areas catering to persons of East Asian (Chinese, Korean, and Japanese) descent. The East Asian customers perceive value in consuming fish and seafood as fresh as possible, which requires products are purchased live (Meyers et al. 2007; Thapa et al. 2015). C. Fisheries Engagement A brief set of fishery engagement indicators is described in this section for the purpose of rounding out an Oregon nearshore fisheries description. The indicators discussion is supplemented with social/economic descriptors that show coastal area vulnerability to changes in fisheries. Fisheries engagement indicators along with social/economic descriptors can be used in trend analysis to monitor and assess social vulnerability status and risk positions. They provide a basis for retrospective and prospective investigations to determine impacts arising from changing ocean conditions, new ocean uses, and natural resource management.1 When supplemental ocean use choices data are available, primary factors for adaptive responses can be identified and predictive models developed.2 New management and mitigation program alternatives can be evaluated for implementation impacts and tradeoffs. Discussions can have benefits for providing conservation awareness and making natural resource planning more responsive to those most affected (Jacob et al. 2012; Poe et al. 2014).3
1. Example new ocean uses are renewable energy development. Example changed ocean conditions could be
related to climate changes such as ocean acidification and hypoxia events, storm severity, etc. Example ocean resource management modifications could be the establishment of marine reserves that require implementation of no-take areas.
2. Reimer et al. (2017) caution that accurate assessment of the impacts of fishery management intervention requires sufficient fisheries structural descriptions so as to avoid misleading predictions for even the most short-run of management changes.
3. The authors acknowledge a more in-depth ecological and fisheries engagement indicator compilation could be used (Samhouri et al. 2013).
IV-5
There are other related research efforts to derive U.S. West Coast indicators. The Social Well-being Indicators for Marine Management (SWIMM) project was undertaken to improve human dimensions understandings for ecosystem-based management (Breslow et al. 2017). The multi-agency team developed a suite of human well-being indicators for use in NOAA's Integrated Ecosystem Assessment of the California Current. Norman et al. (2007) used social and cultural descriptors along with fishery data for communities along the U.S. West Coast and Alaska. Jepson and Colburn (2013) expanded on the descriptors for assessing engagement in the U.S. Southeast and Northeast Regions. NOAA Fisheries explains and maintains a current suite of indicators for coastal areas and the Great Lakes region.1 There have been several recent climate change effect studies that have included compilations of human dimension descriptors. Two studies using the Oregon Coast situation and employing resident surveys are Hoelting and Burkardt (2017) and Fischer (2018). Lynn et al. (2011) has an exhaustive literature search up to the date of the publication on climate change effects to Oregon Coast type environments. Dalton et al. (2013) relates climate change effects on the physical environment in the Pacific Northwest to communities. Commercial/recreational fisheries engagement (measured by economic contribution) at port groups in 2016 are shown on Figure IV.1. The commercial fisheries are itemized for an aggregate of the nearshore fisheries and the residual for all other onshore fisheries. Commercial fisheries generated $201.1 million income coastwide in 2016. (Distant water fisheries effects are not included.) Recreational fisheries generated $60.7 million income in 2016. Fisheries engagement can be decomposed into regional economy reliance, fisheries dependency, and social vulnerability.2 Figure IV.2 shows port group rankings for these dimensions in 2016. While the Astoria port group had the highest reliance on commercial onshore fisheries in 2016, as previously mentioned the Tillamook port group was the most dependent on commercial nearshore fisheries. (If distant water fisheries were included in Figure IV.2, then the Newport port group would have had the highest reliance on commercial fisheries.) Brookings and Port Orford port groups are of higher social vulnerability with greater commercial fisheries reliance and dependence on nearshore fisheries. Demographic and well-being indicators at port groups in 2016 is provided in Appendix E. The indicators show the social fabric backdrop of communities where fishing families live and work. The indicators are related to population (age, ethnicity), households (numbers, size), housing (costs, vacancy, second-home, tenure), labor force (employment in occupations and industries, unemployment), wealth (income sources, poverty), and education. The Oregon Coast levels and contrasts with the State are:
Newport port group has the largest population (60,917) and Port Orford the smallest (3,158).
1. The NOAA Fisheries website accessed July 2018 is:
https://www.fisheries.noaa.gov/topic/socioeconomics#socio-cultural-dimensions. 2. Social vulnerability to fisheries downturns is based on Shannon index of occupational diversity.
IV-6
The Coos Bay port group is the most racially diverse at 11.2 percent.
All port groups (coastwide median age 49.5) are older than the State (median age 39.1) and household size is smaller (State 2.52 and coastwide 2.30).
The ACS tourism industry category (arts, entertainment, recreation, accommodation, and food service) is higher coastwide (15.6 percent of all civilian employment age 16 and over) than the State (10.0 percent). The Newport port group has the highest employment in this category at 21.1 percent.
Costs (rent or mortgage payments) are about 16 percent less than the State.
The percentage of housing units that are second homes is five times higher on the Coast than in the State. The Tillamook port group is the highest at 33.8 percent.
There is a dramatic difference in household mean income at the Coast ($55,544) compared to the State ($72,013). Port Orford has the lowest income ($47,245) and the highest number of households receiving social security payments (57.5 percent).
The share of self-employed individuals such as crew and skipper jobs on fishing boats is higher on the Coast (10.4 percent) than in the State (7.6 percent).
Port Orford is distinguished by having the highest share of residing individuals living under the poverty level (29.5 percent). The State individuals poverty level is 15.7 percent.
The demographic and well-being indicators are important for giving a higher-level picture of the social environment. Indicators help communicate and identify goals and objectives for natural resource management and enable decision makers to measure and monitor changes and outcomes towards meeting management goals (Poe et al. 2015). Social indicators can show disparity in impacts from marine conditions changes that are specific to communities and tribal interests (Tuler et al. 2008; Singleton 2009). However, there are two issues that will confound using the indicators to assess disparity. First, areawide indicators and indexes may not show how individual commercial fisheries participants and families are affected. For example, fisheries reliance does not have to be high in regions where there is substantial engagement in commercial fisheries. A region can have a mature economy with other industries present so that the proportion participating in fisheries is low. Yet for those that do participate, there is a family financial dependency and social identity that is important. Usually the business participation is in a plurality of fisheries and even other businesses such as selling directly to the public. (Section IV.B discusses the heterogeneity in nearshore fisheries participant portfolios.) While diversification can provide a long term and sustainable lifestyle where short term revenue downturns in one staple fishery can be replaced with another revenue source, there can be cumulative impacts when one revenue opportunity is restricted long term. It takes away the viability of the business operation and eventually there will be permanent exiting from the fishing industry. In general, the replacement business for small operations will be larger operations. Communities with a strong commercial fishing industry comprised of small operators will be left with a diluted industry presence as the larger operations are usually centralized at regional fisheries centers. In such cases, communities will have an eroded cultural identity.
IV-7
The second issue in assessing disparity is that indicators and indexes do not necessarily provide an understanding of the quality of life experienced by living on the Oregon Coast. People are drawn to the region because they cherish the natural environment living conditions (Swedeen et al. 2008). In effect, the conditions provide a "second paycheck" which complements the "first paycheck" derived from their employment and pension programs (ECO Northwest 1999). Fishing families in particular are independent minded and appreciate the importance of healthy natural environment in pursuit of livelihood opportunities. These families may be resistant to giving up their second paycheck, and therefore, would be vulnerable to abundance downturns and species range fluctuations such as being caused by climate changes (Griffis and Howard 2013; Chavez et al. 2017). Planned effort shift investigations should prove helpful in better understanding the perceptions and attitudes towards changing fishing conditions and assist in developing social models to illuminate impacts and allow for development of education and mitigation programs (Swearingen 2018). Study results will help determine effects from fishing abandonment, from changing locations for same fisheries, and from switching to other fisheries. D. Marine Reserve Fisheries Commercial and recreational fisheries at sites that were within the Oregon system of marine reserves were investigated for the TRG and GMC (2012) project. The project purpose was to develop a model that could be used to estimate the economic contributions from fisheries within alternative marine reserve boundary designs. The model was used to inform decision making in the geographic shaping and fisheries management plan development process that ultimately led to the existing system of marine reserves. The TRG (February 2018) follow-on project generalized the model to apply to a new base period and any nearshore areas. Based on average 2013 to 2015 conditions, the TRG (February 2018) project estimated that the maximum potential economic impact (i.e. no replacement from fishing elsewhere) from marine reserve management is 3.6 percent of all nearshore commercial and recreational fishing economic contribution that takes place in the TS (Table ES.1). Since the marine reserve system is less than 10 percent of the TS, it would seem likely that the 90 percent commercial harvesting and recreation angling area opportunities would provide satisfactory substitute fishing grounds for most species. However, some individual fishermen may have experience with the bottom features and water conditions at these sites and decide not to fish elsewhere given management closures.1 If fishing does occur at new sites, fishing costs may rise from increased transit distances and changed catch per effort. If recreational fishers do not fish in new areas, they may instead spend the same trip expenditures in non-fishing activities in the local economy. Not included in the displaced fisheries estimates are potential biological spillover effects resulting
1. Fishers in aggregate tend to continue fishing despite conditions that may affect landing success. This may
reflect participant ambivalence towards entering and exiting the fishery based solely on lost revenue opportunities. This would be consistent with habit being a meaningful social/psychological factor in fishery choice models (Van Putten et al. 2012). This observation could be extended to mean fishers reaction to management restrictions on fishing grounds in one area are simply compensated at same effort levels when there are opportunities elsewhere. Compensation from other fisheries may also occur if the fisher has the capacity and permits to pursue other fishery opportunities.
IV-8
from possible increased stock abundances that might raise catch per effort in the new fishing area. There are other MR Program human dimension investigative projects underway and planned that address the extent of effort shift and leaving fisheries.1 The projects in combination with analyzing existing information series (such as logbook and fish ticket data) will help determine and relate any perturbations in fishing activity to the establishment of marine reserves. The analysis will be necessary to discern any statistical discontinuity in effort (such as measured by harvest value and vessel counts) due to marine reserves implementation. For example, the landing value variability between 2008 and 2017 has a range of 72 percent for Dungeness crab, 223 percent for salmon troll, and 30 percent for nearshore groundfish (TRG November 2018). In regards to fishing tenure, Figure IV.3 shows nearshore groundfish vessel annual exit and entry before and after marine reserve management plan implementation.2 The exit/entry rate is around one-third in any given year in the nearshore groundfish fishery. There were net increases at some port groups near marine reserves during the year that marine reserve management restrictions were implemented. Port Orford vessel participation increased by four vessels the implementation year for Redfish Rocks. The problem will be to find the degree and outcome of any influence from marine reserve implementation within harvest and participation variability given that fishers are also responding to such factors as fish resource conditions, other regulations, market conditions, personal investment choices, and even weather.
1. A more thorough description of human dimensions research and monitoring plans can be found at the Oregon
Marine Reserves portal. 2. Marine reserves management restrictions started on January 1, 2012 for Redfish Rocks (RR) and Otter Rocks
(OR); started on January 1, 2014 for Cascade Head (CH) and Cape Perpetua (CP); and started on January 1, 2016 for Cape Falcon (CF).

IV-9
Table IV.1 Landed Value for Nearshore and Other Fisheries by Port Groups in 2016
Port Group
Fishery Astoria Tillamook Newport Coos Bay Port Orford Brookings Coastwide
Nearshore FisheriesOcean salmon 192,065 142,976 2,828,968 887,985 149,879 52,032 4,253,905D. crab 15,161,951 2,411,481 15,600,124 11,788,031 2,872,524 7,900,763 55,734,874Nearshore groundfish 281,554 195,605 97,387 97,152 533,037 289,503 1,494,238Subtotal 15,635,570 2,750,062 18,526,479 12,773,168 3,555,440 8,242,298 61,483,017
Other FisheriesCol. R. salmon 4,053,970 0 0 0 0 0 4,053,970Other groundfish 13,965,928 13,365 9,713,738 3,780,887 718,336 2,301,401 30,493,655P. shrimp 3,756,197 0 8,620,048 8,520,680 0 4,196,328 25,093,253Tuna 3,704,528 161,212 4,752,673 3,715,771 7,859 160,049 12,502,092Whiting 3,938,583 0 4,755,090 0 7 2 8,693,682Sardine 89 0 168 60 0 0 317Other 1,867,366 487,933 2,035,195 1,507,268 273,630 44,280 6,215,672
Total 46,922,231 3,412,572 48,403,391 30,297,834 4,555,272 14,944,358 148,535,658
Notes: 1. Columbia River salmon fishery includes both non-Indian and tribal fisheries.2. The nearshore fisheries portion of the commercial salmon troll fishery is assumed 35 percent
and the nearshore portion of the Dungeness crab fishery is assumed to be 54 percent of the total amounts shown (TRG February 2018).
3. See glossary for explanation of individual ports included in port groups and species included in the nearshore groundfish category.
Source: PacFIN fish ticket data, March 2017 extraction.
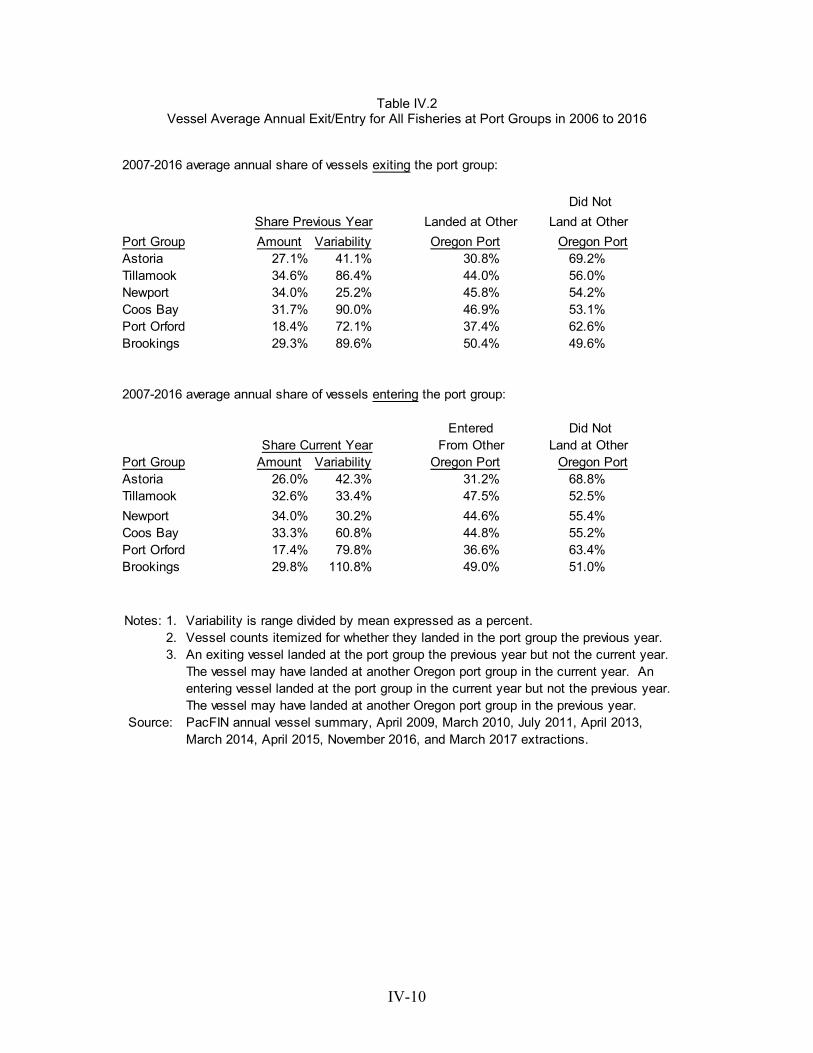
IV-10
Table IV.2 Vessel Average Annual Exit/Entry for All Fisheries at Port Groups in 2006 to 2016
2007-2016 average annual share of vessels exiting the port group:
Did Not
Share Previous Year Landed at Other Land at Other
Port Group Amount Variability Oregon Port Oregon PortAstoria 27.1% 41.1% 30.8% 69.2%Tillamook 34.6% 86.4% 44.0% 56.0%Newport 34.0% 25.2% 45.8% 54.2%Coos Bay 31.7% 90.0% 46.9% 53.1%Port Orford 18.4% 72.1% 37.4% 62.6%Brookings 29.3% 89.6% 50.4% 49.6%
2007-2016 average annual share of vessels entering the port group:
Entered Did NotShare Current Year From Other Land at Other
Port Group Amount Variability Oregon Port Oregon PortAstoria 26.0% 42.3% 31.2% 68.8%Tillamook 32.6% 33.4% 47.5% 52.5%
Newport 34.0% 30.2% 44.6% 55.4%Coos Bay 33.3% 60.8% 44.8% 55.2%Port Orford 17.4% 79.8% 36.6% 63.4%Brookings 29.8% 110.8% 49.0% 51.0%
Notes: 1. Variability is range divided by mean expressed as a percent.2. Vessel counts itemized for whether they landed in the port group the previous year.3. An exiting vessel landed at the port group the previous year but not the current year.
The vessel may have landed at another Oregon port group in the current year. An entering vessel landed at the port group in the current year but not the previous year. The vessel may have landed at another Oregon port group in the previous year.
Source: PacFIN annual vessel summary, April 2009, March 2010, July 2011, April 2013, March 2014, April 2015, November 2016, and March 2017 extractions.
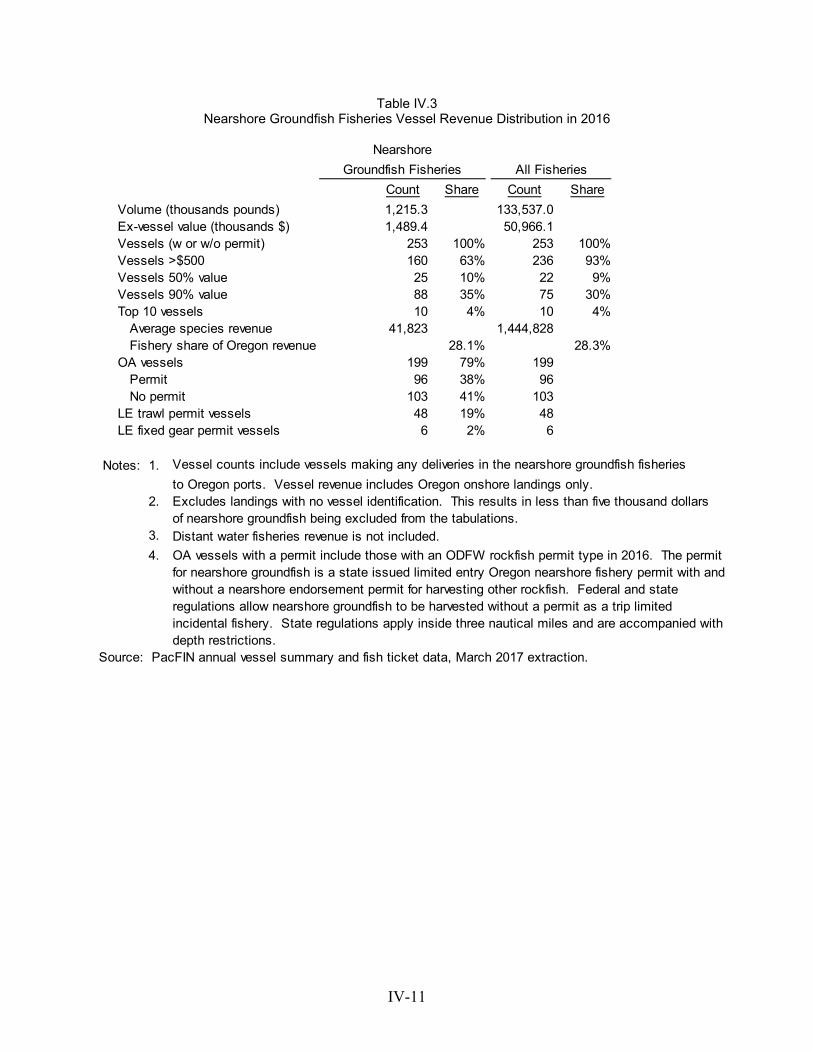
IV-11
Table IV.3 Nearshore Groundfish Fisheries Vessel Revenue Distribution in 2016
Nearshore
Groundfish Fisheries All Fisheries
Count Share Count Share
Volume (thousands pounds) 1,215.3 133,537.0 Ex-vessel value (thousands $) 1,489.4 50,966.1 Vessels (w or w/o permit) 253 100% 253 100%Vessels >$500 160 63% 236 93%Vessels 50% value 25 10% 22 9%Vessels 90% value 88 35% 75 30%Top 10 vessels 10 4% 10 4% Average species revenue 41,823 1,444,828 Fishery share of Oregon revenue 28.1% 28.3%OA vessels 199 79% 199 Permit 96 38% 96 No permit 103 41% 103 LE trawl permit vessels 48 19% 48 LE fixed gear permit vessels 6 2% 6
Notes: 1. Vessel counts include vessels making any deliveries in the nearshore groundfish fisheries
to Oregon ports. Vessel revenue includes Oregon onshore landings only.2. Excludes landings with no vessel identification. This results in less than five thousand dollars
of nearshore groundfish being excluded from the tabulations.3. Distant water fisheries revenue is not included.
4. OA vessels with a permit include those with an ODFW rockfish permit type in 2016. The permit for nearshore groundfish is a state issued limited entry Oregon nearshore fishery permit with and without a nearshore endorsement permit for harvesting other rockfish. Federal and state regulations allow nearshore groundfish to be harvested without a permit as a trip limited incidental fishery. State regulations apply inside three nautical miles and are accompanied with depth restrictions.
Source: PacFIN annual vessel summary and fish ticket data, March 2017 extraction.
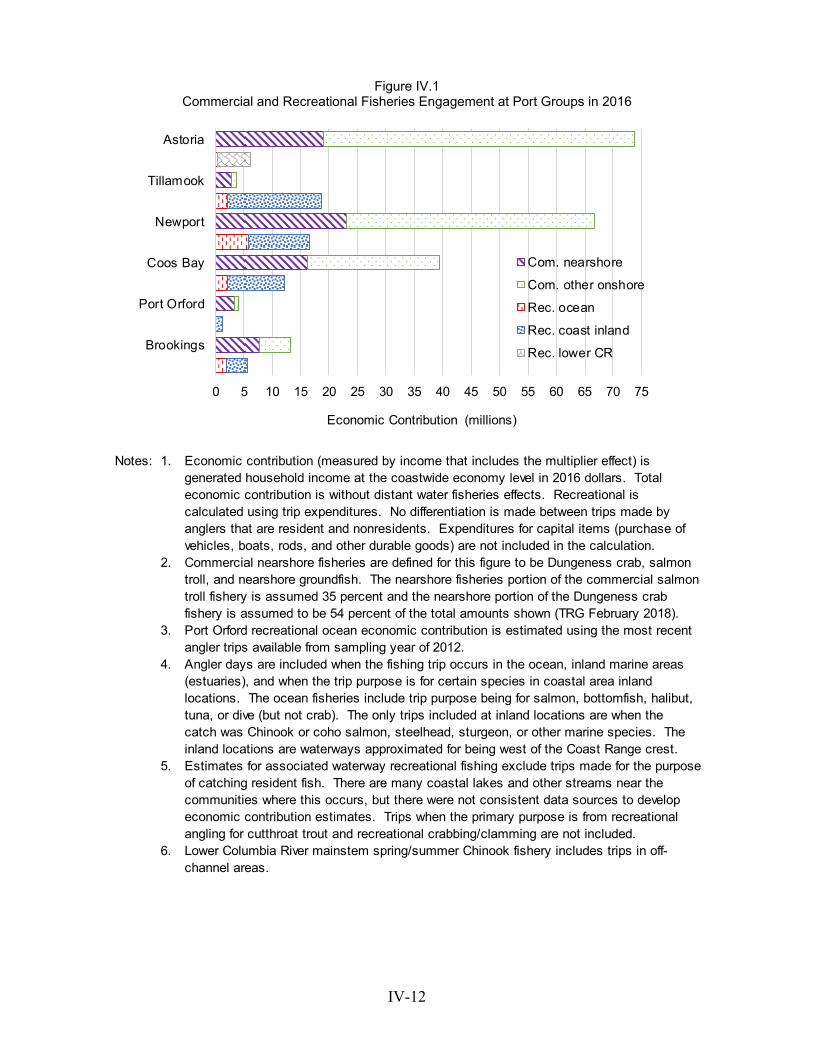
IV-12
Figure IV.1 Commercial and Recreational Fisheries Engagement at Port Groups in 2016
0 5 10 15 20 25 30 35 40 45 50 55 60 65 70 75
Astoria
Tillamook
Newport
Coos Bay
Port Orford
Brookings
Economic Contribution (millions)
Com. nearshore
Com. other onshore
Rec. ocean
Rec. coast inland
Rec. lower CR
Notes: 1. Economic contribution (measured by income that includes the multiplier effect) is generated household income at the coastwide economy level in 2016 dollars. Total economic contribution is without distant water fisheries effects. Recreational is calculated using trip expenditures. No differentiation is made between trips made by anglers that are resident and nonresidents. Expenditures for capital items (purchase of vehicles, boats, rods, and other durable goods) are not included in the calculation.
2. Commercial nearshore fisheries are defined for this figure to be Dungeness crab, salmon troll, and nearshore groundfish. The nearshore fisheries portion of the commercial salmon troll fishery is assumed 35 percent and the nearshore portion of the Dungeness crab fishery is assumed to be 54 percent of the total amounts shown (TRG February 2018).
3. Port Orford recreational ocean economic contribution is estimated using the most recent angler trips available from sampling year of 2012.
4. Angler days are included when the fishing trip occurs in the ocean, inland marine areas (estuaries), and when the trip purpose is for certain species in coastal area inland locations. The ocean fisheries include trip purpose being for salmon, bottomfish, halibut, tuna, or dive (but not crab). The only trips included at inland locations are when the catch was Chinook or coho salmon, steelhead, sturgeon, or other marine species. The inland locations are waterways approximated for being west of the Coast Range crest.
5. Estimates for associated waterway recreational fishing exclude trips made for the purpose of catching resident fish. There are many coastal lakes and other streams near the communities where this occurs, but there were not consistent data sources to develop economic contribution estimates. Trips when the primary purpose is from recreational angling for cutthroat trout and recreational crabbing/clamming are not included.
6. Lower Columbia River mainstem spring/summer Chinook fishery includes trips in off-channel areas.
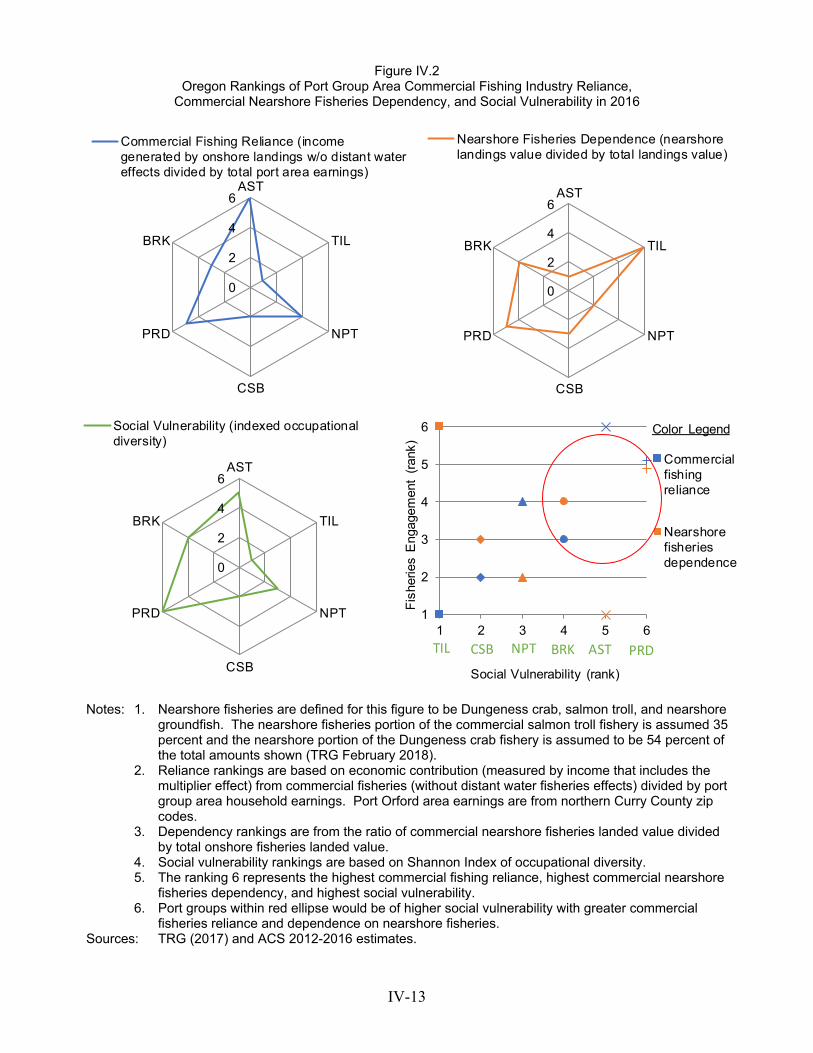
IV-13
Figure IV.2
Oregon Rankings of Port Group Area Commercial Fishing Industry Reliance, Commercial Nearshore Fisheries Dependency, and Social Vulnerability in 2016
0
2
4
6AST
TIL
NPT
CSB
PRD
BRK
Commercial Fishing Reliance (incomegenerated by onshore landings w/o distant watereffects divided by total port area earnings)
0
2
4
6AST
TIL
NPT
CSB
PRD
BRK
Nearshore Fisheries Dependence (nearshorelandings value divided by total landings value)
0
2
4
6AST
TIL
NPT
CSB
PRD
BRK
Social Vulnerability (indexed occupationaldiversity)
1
2
3
4
5
6
1 2 3 4 5 6
Fis
herie
s E
ngag
emen
t (r
ank)
Social Vulnerability (rank)
Commercialfishingreliance
Nearshorefisheriesdependence
TIL ASTNPTCSB PRDBRK
Color Legend
Notes: 1. Nearshore fisheries are defined for this figure to be Dungeness crab, salmon troll, and nearshore groundfish. The nearshore fisheries portion of the commercial salmon troll fishery is assumed 35 percent and the nearshore portion of the Dungeness crab fishery is assumed to be 54 percent of the total amounts shown (TRG February 2018).
2. Reliance rankings are based on economic contribution (measured by income that includes the multiplier effect) from commercial fisheries (without distant water fisheries effects) divided by port group area household earnings. Port Orford area earnings are from northern Curry County zip codes.
3. Dependency rankings are from the ratio of commercial nearshore fisheries landed value divided by total onshore fisheries landed value.
4. Social vulnerability rankings are based on Shannon Index of occupational diversity. 5. The ranking 6 represents the highest commercial fishing reliance, highest commercial nearshore
fisheries dependency, and highest social vulnerability. 6. Port groups within red ellipse would be of higher social vulnerability with greater commercial
fisheries reliance and dependence on nearshore fisheries. Sources: TRG (2017) and ACS 2012-2016 estimates.
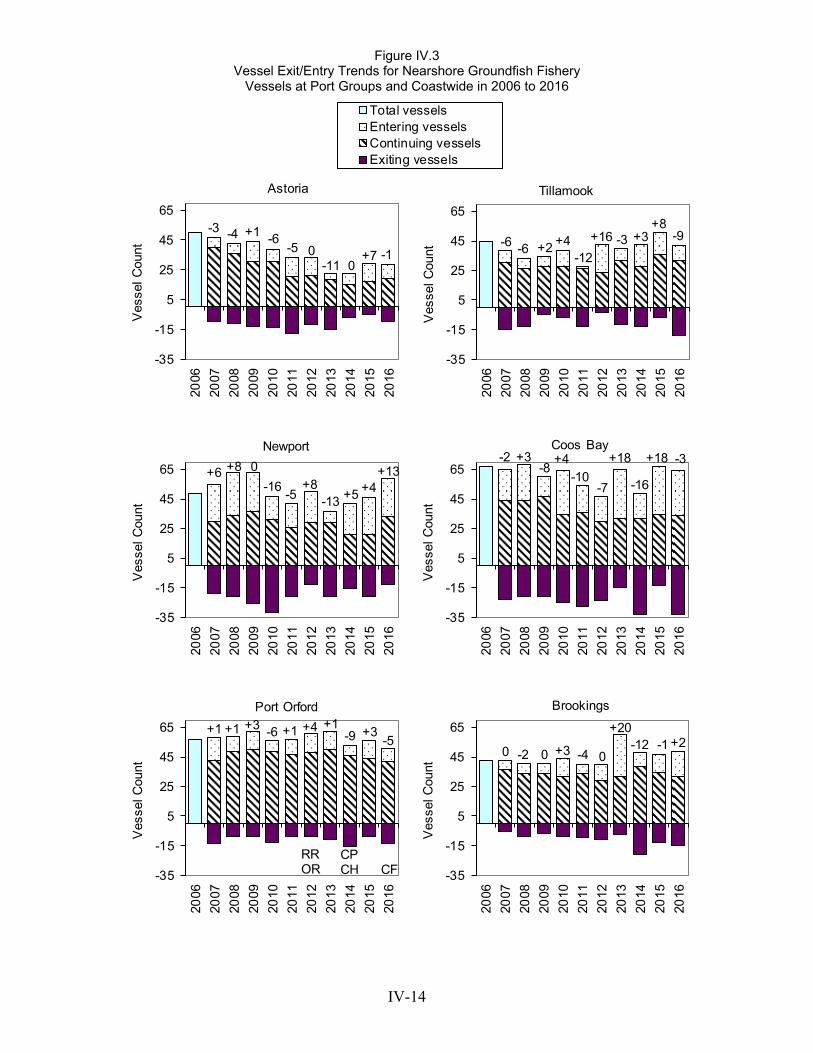
IV-14
Figure IV.3 Vessel Exit/Entry Trends for Nearshore Groundfish Fishery
Vessels at Port Groups and Coastwide in 2006 to 2016
Total vesselsEntering vesselsContinuing vesselsExiting vessels
-35
-15
5
25
45
6520
06
2007
2008
2009
2010
2011
2012
2013
2014
2015
2016
Ves
sel C
ount
Astoria
-4-3 +1 -6-5
-110
0+7 -1
-35
-15
5
25
45
65
2006
2007
2008
2009
2010
2011
2012
2013
2014
2015
2016
Ves
sel C
ount
Tillamook
-6-6 +2 +4-12
-3+16 +3+8
-9
-35
-15
5
25
45
65
2006
2007
2008
2009
2010
2011
2012
2013
2014
2015
2016
Ves
sel C
ount
Newport
+8+6+8-16
-5 -13
0
+5 +4+13
-35
-15
5
25
45
6520
06
2007
2008
2009
2010
2011
2012
2013
2014
2015
2016
Ves
sel C
ount
Coos Bay
-16-7
+18 -3+18
-10+4
-8+3-2
-35
-15
5
25
45
65
2006
2007
2008
2009
2010
2011
2012
2013
2014
2015
2016
Ves
sel C
ount
Port Orford
RROR
CPCH CF
+1 +1 +1 +1+3 -6 +4-9 +3
-5
-35
-15
5
25
45
65
2006
2007
2008
2009
2010
2011
2012
2013
2014
2015
2016
Ves
sel C
ount
Brookings
+20 0 0-2 +3 -4
+20-12 -1
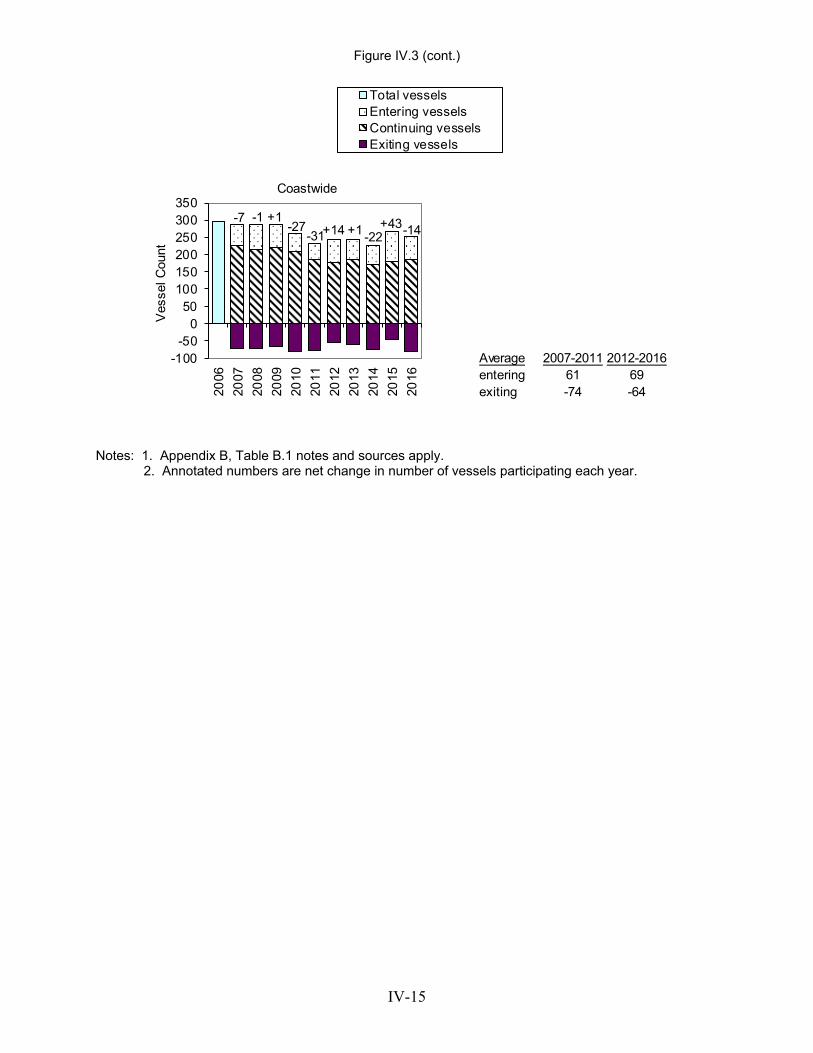
IV-15
Figure IV.3 (cont.)
Total vesselsEntering vesselsContinuing vesselsExiting vessels
-100-50
050
100150200250300350
2006
2007
2008
2009
2010
2011
2012
2013
2014
2015
2016
Ves
sel C
ount
Coastwide
-7 -1 +1-27
-31+14 +1-22+43-14
Average 2007-2011 2012-2016entering 61 69exiting -74 -64
Notes: 1. Appendix B, Table B.1 notes and sources apply. 2. Annotated numbers are net change in number of vessels participating each year.
V-1
V. Bibliography Ainsworth, J. C., M. Vance, M. Hunter, and E. Schindler. The Oregon Recreational Dungeness Crab Fishery, 2007-2011. Oregon Department of Fish and Wildlife. July 2012. Ainsworth, Justin C., Anthony F. D'Andrea, Mitch Vance, Scott D. Groth, Elizabeth A. Perotti. Status of Oregon Bay Clam Fisheries, Stock Assessment, and Research. Oregon Department of Fish and Wildlife Information Reports Number 2014-09. December 2014. Allen, M.S., R.N.M. Ahrens, M.J. Hansen, R. Arlinghaus. "Dynamic Angling Effort Influences the Value of Minimum-Length Limits to Prevent Recruitment Overfishing." Fisheries Management and Ecology, 20: 247–257. 2013. Andrews, E.J. and J.E. Wilen. "Angler Response to Success in the California Salmon Sport Fishery: Evidence and Management Implications." Marine Resource Economics. 5(1988): 125-138. 1988. Breslow, Sara Jo, M. Allen, D. Holstein, B. Sojka, R. Barnea, X. Basurto, C. Carothers, S. Charnley, S. Coulthard, N. Dolšak, J. Donatuto, C. García-Quijano, C. Hicks, A. Levine, M. Mascia, K. Norman, M. Poe, T. Satterfield, K. St. Martin, and P. Levin. "Evaluating Indicators of Human Well-being for Ecosystem-based Management." Ecosystem Health and Sustainability, 3:12. 2017. Chavez, F.P., Costello, C., Aseltine-Neilson, D., Doremus, H., Field, J. C., Gaines, S. D., Hall-Arber, M., Mantua, N. J., McCovey, B., Pomeroy, C., Sievanen, L., Sydeman, W., and Wheeler, S. A. (California Ocean Protection Council Science Advisory Team Working Group). Readying California Fisheries for Climate Change. California Ocean Science Trust, Oakland, California, USA. 2017. Dalton, M.M., P.W. Mote, and A.K. Snover. Climate Change in the Northwest: Implications for Our Landscapes, Waters, and Communities. Island Press. 230 p. 2013. Dean Runyan Associates. Fishing, Hunting, Wildlife Viewing, and Shellfishing in Oregon, 2008. Oregon Department of Fish and Wildlife and Travel Oregon. May 2009. Devore, James, Brad James, and Ray Beamesderfer. Lower Columbia River White Sturgeon Current Stock Status and Management Implications (Draft). WDFW and ODFW. April 1999. ECO Northwest. The Sky Did Not Fall: The Pacific Northwest's Response to Logging Reductions. Prepared for Earthlife Canada Foundation and Sierra Club of British Columbia. April 1999. Fischer, Alexandra Paige. "Pathways of Adaptation to External Stressors in Coastal Natural-Resource-Dependent Communities: Implications for Climate Change" in World Development Volume 108, Pages 235-248. August 2018.
V-2
Gentner, Brad and Scott Steinback. The Economic Contribution of Marine Angler Expenditures in the United States, 2006. U.S. Dept. of Commerce, NOAA Technical Memorandum NMFS-F/SPO-94. Via Internet: http://www.st.nmfs.noaa.gov/st5/publication/ AnglerExpenditureReport/AnglerExpendituresReport_ALL.pdf. December 2008. Gentner, Brad, Michael Price, and Scott Steinback. Marine Angler Expenditures in the Pacific Coast Region, 2000. National Marine Fisheries Service, NOAA Technical Memorandum NMFS-F/SPO-49. October 2001. Gislason, Gordon, GSGislason & Associates Ltd. "Commercial vs. Recreational Fisheries Allocation in Canada: Pacific Herring, Salmon and Halibut." Paper Presented to Sharing the Fish 06 Conference, Fremantle, Western Australia. February 26 - March 2 2006. Griffis, R. and J. Howard (Eds). Oceans and Marine Resources in a Changing Climate: A Technical Input to the 2013 National Climate Assessment. Washington, D.C.: Island Press. 2013. Hanna, Susan; Gilbert Sylvia, Michael Harte, Gail Achterman. Review of Economic Literature and Recommendations for Improving Economic Data and Analysis for Managing Columbia River Spring Chinook. A Report to Oregon Department of Fish and Wildlife in fulfillment of ODFW Agreement No. 005-4132S-Wild. Institute for Natural Resources, Oregon State University. April 2006. Hoelting, K. and N. Burkardt. Human Dimensions of Climate Change in Coastal Oregon. Prepared for US Dept. of the Interior, Bureau of Ocean Energy Management (OCS Study BOEM 2017-052). 2017. Holland, D.S., J.N. Sanchirico, R.E. Curtis, and R.L. Hicks. "An Introduction to Spatial Modeling in Fisheries Economics." Marine Resource Economics, 19(1): 1-6. 2004. Holland, Daniel S., Cameron Speir, Juan Agar, Scott Crosson, Geret DePiper, Stephen Kasperski, Andrew W. Kitts, and Larry Perruso. "Impact of Catch Shares on Diversification of Fishers' Income and Risk." PNAS, vol. 114, no. 35. Via Internet: http://www.pnas.org/ content/pnas/114/35/9302.full.pdf. August 29, 2017. Jacob, S., P. Weeks, B.G. Blount, and M. Jepson. "Development and Evaluation of Social Indicators of Vulnerability and Resiliency for Fishing Communities in the Gulf of Mexico." Marine Policy 26:16-22. 2012. Jepson, Michael and Lisa L. Colburn. "Development of Social Indicators of Fishing Community Vulnerability and Resilience in the U.S. Southeast and Northeast Regions." U.S. Dept. of Commerce. NOAA Technical Memorandum NMFS-F/SPO-129, 64 p. 2013. Joint Technical Committee of the Pacific Hake/Whiting Agreement Between the Governments of the United States and Canada. Status of the Pacific Hake (Whiting) Stock in U.S. and Canadian Waters in 2018. March 2018.
V-3
Larson, D.M. and D.K. Lew. How Do Harvest Rates Affect Angler Trip Patterns? Marine Resource Economics, 28(2):155-173. January 2013. Lawson, Pete, NMFS. Personal communication. April 2015. Leonard, J. and P. Watson. Description of the Input-Output Model for Pacific Coast Fisheries. U.S. Dept. Commerce, NOAA Tech. Memo. NMFS-NWFSC-111. 2011. Lian, Carl, Rajesh Singh, and Quinn Weninger. "Fleet Restructuring, Rent Generation, and the Design of Individual Fishing Quota Programs: Empirical Evidence From the Pacific Coast Groundfish Fishery." Marine Resource Economics 24(4):329-359. Via Internet: http://www.bioone.org/doi/abs/10.5950/0738-1360-24.4.329. December 2009. Lynn, Kathy, Katharine MacKendrick, and Ellen Donoghue. Social Vulnerability and Climate Change: Synthesis of Literature. General Technical Report, PNW-GTR-838. Portland, OR: U.S. Department of Agriculture, Forest Service, Pacific Northwest Research Station. 70 p. 2011. Myers, Joseph, Ramu Govindasamy, John W. Ewart, Bin Liu, Yumin You, Venkata S. Puduri, and Linda J. O'Dierno. Consumer Analysis of and Business Network Development for Ethnic Live Seafood Markets of in the Northeast Region. 2007. Norman, K., J. Sepez, H. Lazrus, N. Milne, C. Package, S. Russell, K. Grant, R. Peterson, J. Primo, M. Styles, B. Tilt, and I. Vaccaro. Community Profiles for West Coastal and North Pacific Fisheries – Washington, Oregon and California, and Other U.S. States. NMFS-NWFSC-85. 2007. NOAA Fisheries. West Coast Groundfish Trawl Catch Share Program, Five-year Review - Draft. Via Internet: http://www.pcouncil.org/wp-content/uploads/2017/10/F2_Att3__E-Only_5Year_Review_August_Draft_for_public_review_NOV2017BB.pdf. August 2017. Oregon Department of Fish and Wildlife (ODFW). The Oregon Commercial Nearshore Fishery Data Update: 2017. Marine Resources Program. 2018. Oregon Department of Fish and Wildlife, Marine Resources Program. 29th Annual Pink Shrimp Review. February 2018. Oregon Department of Fish and Wildlife, Marine Resources Program. 9th Annual Dungeness Crab Fishery Newsletter. November 2017. Oregon Department of Fish and Wildlife (ODFW). The Oregon Commercial Nearshore Fishery Summary: 2016. Marine Resources Program. September 2017. Oregon Department of Fish and Wildlife (ODFW). "Oregon Nearshore Strategy" in Oregon Conservation Strategy. 2016.
V-4
Oregon Department of Fish and Wildlife (ODFW). Personal communication. May 2015. Oregon Department of Fish and Wildlife (ODFW). Coastal Multi-Species Conservation and Management Plan. Stakeholder Review Draft. Via Internet: http://www.dfw.state.or.us/fish/ CRP/coastal_multispecies.asp. June 5, 2013 Oregon Department of Fish and Wildlife (ODFW). Federal Aid Completion Reports, Fisheries, 1977, AFS 65 Nehalem River Winter Steelhead Study. Final Report. Via Internet: http://ir.library.oregonstate.edu/xmlui/handle/1957/38092?show=full. 1977. Oregon Parks and Recreation Department (OPRD). 2013-2017 Statewide Comprehensive Outdoor Recreation Plan (SCORP), Ensuring Oregon's Outdoor Legacy. 2013. Oregon State University (OSU), Survey Research Center. Oregon Department of Fish and Wildlife 2013 Surveys: Angling in Oregon: A Survey Designed to Understand Anglers' Opinions About Fishing in Oregon; and Wild Fish Conservation and Management Survey: A Survey Designed for Oregon Residents. Prepared for Oregon Department of Fish and Wildlife. Via Internet: http://www.dfw.state.or.us/fish/CRP/docs/coastal_multispecies/CMP_Draft_6-17-13_Appendix_VI_Opinion_Survey.pdf. April 2013. Pacific Fishery Management Council (PFMC). Status of the Pacific Coast Groundfish Fishery. September 2018. Pacific Fishery Management Council (PFMC). Preseason Report I: Stock Abundance Analysis and Environmental Assessment Part 1 for 2018 Ocean Salmon Fishery Regulations. March 2018. Pacific Fishery Management Council (PFMC). Review of 2017 Ocean Salmon Fisheries. February 2018. Pacific Fishery Management Council (PFMC). Status of the Pacific Coast Coastal Pelagic Species Fishery and Recommended Acceptable Biological Catches (information through June 2017). December 2017. Pelletier, Dominique, and Stéphanie Mahévas. "Spatially Explicit Fisheries Simulation Models for Policy Evaluation." Fish and Fisheries 6 (4): 307–49. 2005. Pendleton, Linwood H. and Jaime Rooke. Understanding the Potential Economic Impact of Marine Recreational Fishing: California. Environmental Science and Engineering Program, University of California, Los Angeles. March 1, 2006. Pfeiffer, Lisa and Trevor Gratz. "The Effect of Rights-based Fisheries Management on Risk Taking and Fishing Safety." PNAS, 113 (10) 2615-2620. Via Internet: http://www.pnas.org/content/113/10/2615/tab-article-info. March 8, 2016.
V-5
Plummer, M., W. Morrison, and E. Steiner. Allocation of Fishery Harvests Under the Magnuson-Stevens Fishery Conservation and Management Act: Principles and Practice. U.S. Dept. of Commerce, NOAA Tech. Memo., NMFS-NWFSC-115, 84 p. 2012. Poe, M.R., K.C. Norman, and P.S. Levin. "Cultural Dimensions of Socioecological Systems: Key Connections and Guiding Principles for Conservation in Coastal Environments." Conservation Letters 7:166-175. 2014. Poe, Melissa R., Melissa Watkinson, Bridget Trosin, and Kevin Decker. Social Indicators for Washington Coast Integrated Ecosystem Assessment. Report to Washington Department of Natural Resources in fulfillment of Interagency Agreement No. IAA 14‐204. Washington Sea Grant WSG‐TR 15‐07. 159pp. 2015. Propst, Dennis B. and Dimitris G. Gavrilis. "Role of Economic Impact Assessment Procedures in Recreational Fisheries Management." Transactions of the American Fisheries Society, 116: 450-460. May 1987. Reimer, Matthew, Joshua Abbott, and James Wilen. "Fisheries Production: Management Institutions, Spatial Choice, and the Quest for Policy Invariance." Marine Resource Economics 32(2): 143-168. April 2017. The Research Group, LLC (TRG). Oregon Nearshore Fisheries Effort Shift Survey Commercial Fisheries Representativeness Report. Prepared for Marine Resources Program, Oregon Department of Fish and Wildlife. November 2018. The Research Group, LLC (TRG). Interactive Model User Guide for the Broadscale Spatial Analysis of Oregon Nearshore Fisheries. Prepared for Marine Resources Program, Oregon Department of Fish and Wildlife. February 2018. The Research Group, LLC (TRG). Oregon Commercial Fishing Industry Year 2016 Economic Activity Summary. Prepared for Oregon Department of Fish and Wildlife. April 2017. The Research Group, LLC (TRG). Oregon's Commercial Fishing Industry, Year 2013 and 2014 Review. Prepared for Oregon Department of Fish and Wildlife, and Oregon Coastal Zone Management Association. September 2015a. The Research Group, LLC (TRG). Oregon Marine Recreational Fisheries Economic Contributions in 2013 and 2014. Prepared for Oregon Department of Fish and Wildlife and Oregon Coastal Zone Management Association. September 2015b. The Research Group (TRG). A Demographic and Economic Description of the Oregon Coast: 2006 Update. Prepared for Oregon Coastal Zone Management Association. March 2006. The Research Group (TRG). Economic Impacts From Ocean and Lower Estuary Salmon Commercial and Recreational Fisheries in 2000. Oregon Coastal Zone Management Association. June 2000.
V-6
The Research Group (TRG). Oregon Angler Survey and Economic Study. Prepared for Oregon Department of Fish and Wildlife. June 1991. The Research Group, LLC and Golden Marine Consulting (TRG and GMC). Using Spatial Analysis of Fisheries and Habitat Data to Evaluate Economic Effects of Oregon Marine Reserve Sites. Prepared for Marine Resources Program, Oregon Department of Fish and Wildlife. June 2012. Robertson, D.R. and Gerald R. Allen. Shorefishes of the Tropical Eastern Pacific: Online Information System. Version 2.0 Smithsonian Tropical Research Institute, Balboa, Panamá. 2015. Samhouri, J.F., A. Haupt, P. Levin, J. Link, and R. Shuford. "Lessons Learned From Developing Integrated Ecosystem Assessments to Inform Marine Ecosystem Based Management in the USA." ICES Journal of Marine Science 71(5): 1205–1215. 2013. Saul, Steven and David Die. "Modeling the Decision-Making Behavior of Fishers in the Reef Fish Fishery on the West Coast of Florida." Human Dimensions of Wildlife, 21:6, 567-586. 2016. Schramm, H.L. Jr., P.D. Gerard. "Temporal changes in fishing motivation among fishing club anglers in the United States." Fisheries Management and Ecology 11 (5), 313-321. doi:10.1111/j.1365-2400.2004.00384.x. 2004. Scientific and Statistical Committee (SSC). Comments to the Pacific Fishery Management Council. Minutes from the PFMC SSC Meeting. November 2009. Scott, M. "A Fishery's Guide to Understanding Secondary Economic Impacts of Northwest Salmon and Steelhead." Paper presented at Making Economic Information More Useful for Salmon and Steelhead Decision, a workshop sponsored by National Marine Fisheries Service, July 24-26, Seattle, Washington. NOAA Technical Memorandum NMFS F/NWR-8, National Marine Fisheries Service. Portland, Oregon. 1984. Seung, Chang K. and Edward C. Waters. A Review of Regional Economic Models for Fisheries Management in the U.S. Marine Resource Economics. Volume 21, pp. 101–124. 2006. Shannon, C.E. "A Mathematical Theory of Communication." The Bell System Technical Journal, 27, pgs. 379–423 and 623–656. 1948. Singleton, S. "Native People and Planning for Marine Protected Areas: How "Stakeholder" Processes Fail to Address Conflicts in Complex, Real‐World Environments." Coastal Management 37(5): 421‐440. 2009.
V-7
Southwick Associates. The Relative Economic Contributions of U.S. Recreational and Commercial Fisheries. Prepared for the Theodore Roosevelt Conservation Partnership. April 2006. Swearingen, Tommy, ODFW. Personal communication. November 2018. Swedeen, P., D. Batker, H. Radtke, R. Boumans, C. Willer. An Ecological Economics Approach to Understanding Oregon's Coastal Economy and Environment. Audubon Society of Portland. Portland, OR. 2008. Thapa, Ganesh, Madan Dey, and Carole Engle. "Consumer Preferences for Live Seafood in the Northeastern Region of USA: Results From Asian Ethnic Fish Market Survey." Aquaculture Economics & Management, 19:2, 210-225. 2015. Tuler, S., J. Agyeman, P.P. da Silva, K.R. LoRusso, and R. Kay. "Assessing Vulnerabilities: Integrating Information About Driving Forces That Affect Risks and Resilience in Fishing Communities." Human Ecology Review 15(2): 171‐184. U.S. Census. 2008. U.S. Fish and Wildlife Service (USFWS). 2016 National Survey of Fishing, Hunting, and Wildlife-Associated Recreation National Overview. August 2017. Van Putten, Ingrid, Soile Kulmala, Olivier Thébaud, Natalie Dowling, Katell Hamon, Trevor Hutton, and Sean Pascoe. "Theories and Behavioural Drivers Underlying Fleet Dynamics Models." Fish and Fisheries Volume 13, Issue 2. June 2012. Watts, James W. Lower Columbia River recreational catch and effort estimates. Personal communication. November 2018. Watts, James W. The 2008 Lower Columbia River and Buoy 10 Recreational Fisheries. Oregon Department of Fish and Wildlife. December 2009. Whiteside, Cassandra, Justin Ainsworth, and Jason Edwards. Shore and Estuary Boat Recreational Fishing Effort Surveys, Comparing the Effectiveness of Phone and Mail Surveys. ODFW. June 2017.
Appendix A
Recreational Fisheries Trips by Target Species

Table A.1 Historical and Assigned Success Rates for Inland and Ocean Recreational Fisheries
Inland Success Rates
Chinook Winter/
Spring/ Summer
Waterway Source Dates Fall Summer Coho Steelhead Sturgeon
ESTUARY AND INLAND
Lower Columbia RiverSturgeon fishery
Devore et al. (1999) 1996-1998 average -- -- -- -- 7.32Columbia River fall mainstem salmon fishery
Watts (CRCP) 2002 3.91 -- 13.51 -- --2003 6.13 -- 1.64 -- --2004 3.73 -- 4.49 -- --2005 4.95 -- 7.00 -- --2006 19.01 -- 9.17 -- --2007 8.32 -- 4.21 -- --2008 3.40 -- 4.22 -- --2009 11.58 -- 1.49 -- --2010 6.80 -- 5.95 -- --2011 4.43 -- 5.95 -- --2012 3.20 -- 8.23 -- --2013 2.75 -- 8.86 -- --2014 3.89 -- 1.75 -- --2015 2.90 -- 2.90 -- --2016 4.58 -- 10.40 -- --2017 2.87 -- 5.17 -- --2002-2016 average 4.27 -- 3.48 -- --
Columbia River mainstem Section 10Watts (CRCP) 2002 -- 7.65 -- 17.54 2.26
2003 -- 6.66 -- 16.43 2.532004 -- 4.32 -- 19.92 2.772005 -- 7.95 -- 28.92 3.442006 -- 6.76 -- 17.41 2.852007 -- 7.99 -- 13.29 2.602008 -- 10.57 -- 12.92 3.562009 -- 6.29 -- 12.20 3.902010 -- 5.93 -- 21.96 5.822011 -- 10.69 -- 8.00 4.312012 -- 6.34 -- 10.03 4.452013 -- 7.84 -- 17.81 3.792014 -- 7.82 -- 10.81 --2015 -- 3.69 -- 53.47 --2016 -- 6.65 -- 24.31 --2017 -- 4.72 -- 423.51 --2002-2016 average -- 6.35 -- 16.43 3.17
CoastNehalem River
ODFW AFS 65 1963-64 season -- -- -- 5.33 --1964-65 season -- -- -- 8.43 --1968-69 season -- -- -- 2.18 --
Creel Surveys 2010 10.03 -- -- -- --2012 44.95 -- -- -- --
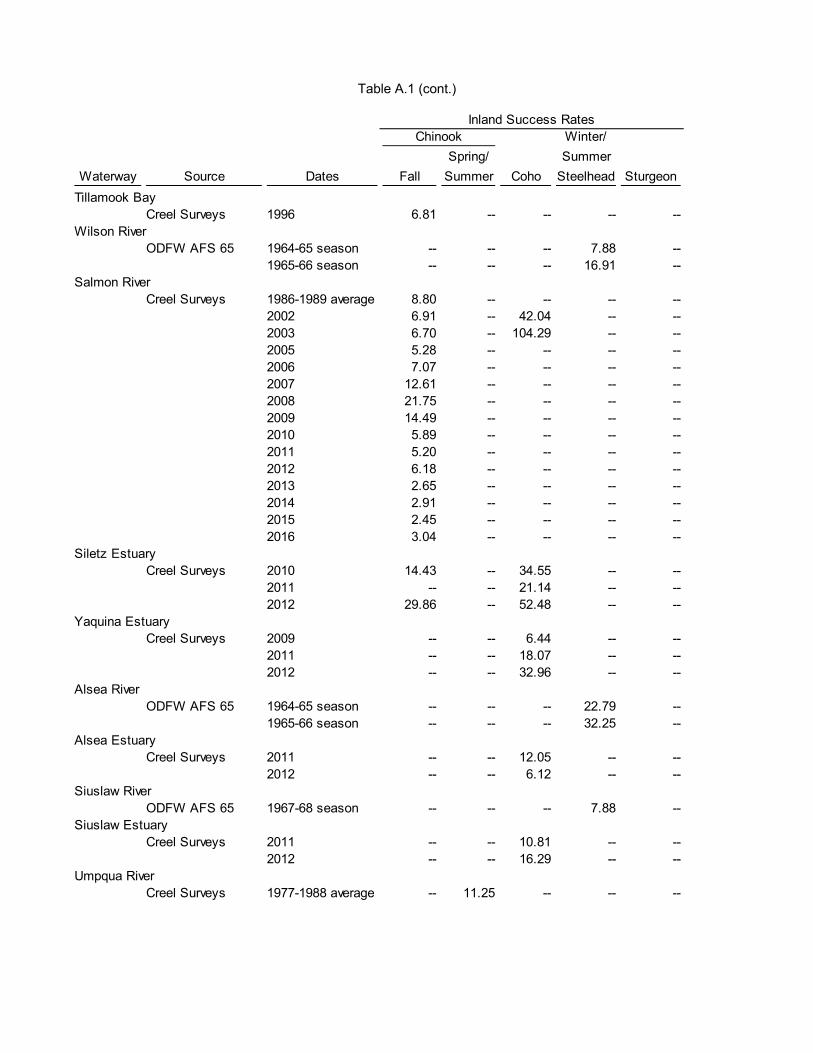
Table A.1 (cont.)
Inland Success Rates
Chinook Winter/
Spring/ Summer
Waterway Source Dates Fall Summer Coho Steelhead Sturgeon
Tillamook BayCreel Surveys 1996 6.81 -- -- -- --
Wilson RiverODFW AFS 65 1964-65 season -- -- -- 7.88 --
1965-66 season -- -- -- 16.91 --Salmon River
Creel Surveys 1986-1989 average 8.80 -- -- -- --2002 6.91 -- 42.04 -- --2003 6.70 -- 104.29 -- --2005 5.28 -- -- -- --2006 7.07 -- -- -- --2007 12.61 -- -- -- --2008 21.75 -- -- -- --2009 14.49 -- -- -- --2010 5.89 -- -- -- --2011 5.20 -- -- -- --2012 6.18 -- -- -- --2013 2.65 -- -- -- --2014 2.91 -- -- -- --2015 2.45 -- -- -- --2016 3.04 -- -- -- --
Siletz EstuaryCreel Surveys 2010 14.43 -- 34.55 -- --
2011 -- -- 21.14 -- --2012 29.86 -- 52.48 -- --
Yaquina EstuaryCreel Surveys 2009 -- -- 6.44 -- --
2011 -- -- 18.07 -- --2012 -- -- 32.96 -- --
Alsea RiverODFW AFS 65 1964-65 season -- -- -- 22.79 --
1965-66 season -- -- -- 32.25 --Alsea Estuary
Creel Surveys 2011 -- -- 12.05 -- --2012 -- -- 6.12 -- --
Siuslaw RiverODFW AFS 65 1967-68 season -- -- -- 7.88 --
Siuslaw EstuaryCreel Surveys 2011 -- -- 10.81 -- --
2012 -- -- 16.29 -- --Umpqua River
Creel Surveys 1977-1988 average -- 11.25 -- -- --
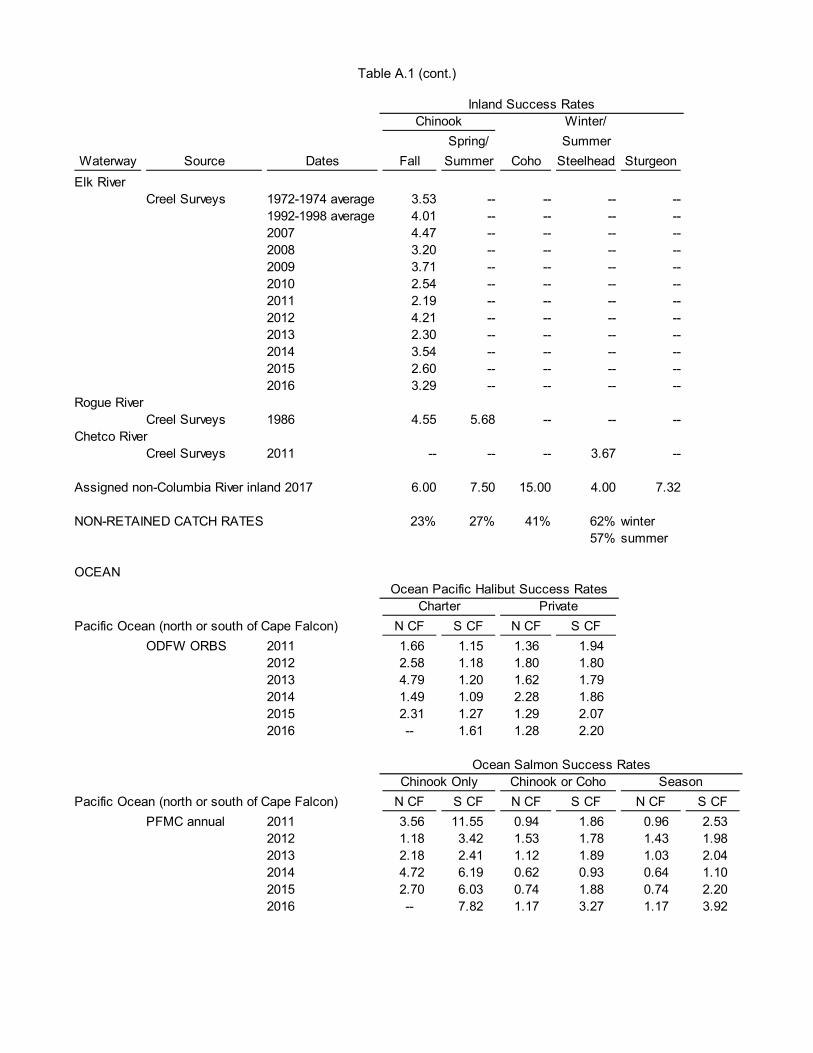
Table A.1 (cont.)
Inland Success RatesChinook Winter/
Spring/ Summer
Waterway Source Dates Fall Summer Coho Steelhead Sturgeon
Elk RiverCreel Surveys 1972-1974 average 3.53 -- -- -- --
1992-1998 average 4.01 -- -- -- --2007 4.47 -- -- -- --2008 3.20 -- -- -- --2009 3.71 -- -- -- --2010 2.54 -- -- -- --2011 2.19 -- -- -- --2012 4.21 -- -- -- --2013 2.30 -- -- -- --2014 3.54 -- -- -- --2015 2.60 -- -- -- --2016 3.29 -- -- -- --
Rogue RiverCreel Surveys 1986 4.55 5.68 -- -- --
Chetco RiverCreel Surveys 2011 -- -- -- 3.67 --
Assigned non-Columbia River inland 2017 6.00 7.50 15.00 4.00 7.32
NON-RETAINED CATCH RATES 23% 27% 41% 62% winter57% summer
OCEANOcean Pacific Halibut Success Rates
Charter Private
Pacific Ocean (north or south of Cape Falcon) N CF S CF N CF S CF
ODFW ORBS 2011 1.66 1.15 1.36 1.942012 2.58 1.18 1.80 1.802013 4.79 1.20 1.62 1.792014 1.49 1.09 2.28 1.862015 2.31 1.27 1.29 2.072016 -- 1.61 1.28 2.20
Ocean Salmon Success RatesChinook Only Chinook or Coho Season
Pacific Ocean (north or south of Cape Falcon) N CF S CF N CF S CF N CF S CF
PFMC annual 2011 3.56 11.55 0.94 1.86 0.96 2.532012 1.18 3.42 1.53 1.78 1.43 1.982013 2.18 2.41 1.12 1.89 1.03 2.042014 4.72 6.19 0.62 0.93 0.64 1.102015 2.70 6.03 0.74 1.88 0.74 2.202016 -- 7.82 1.17 3.27 1.17 3.92
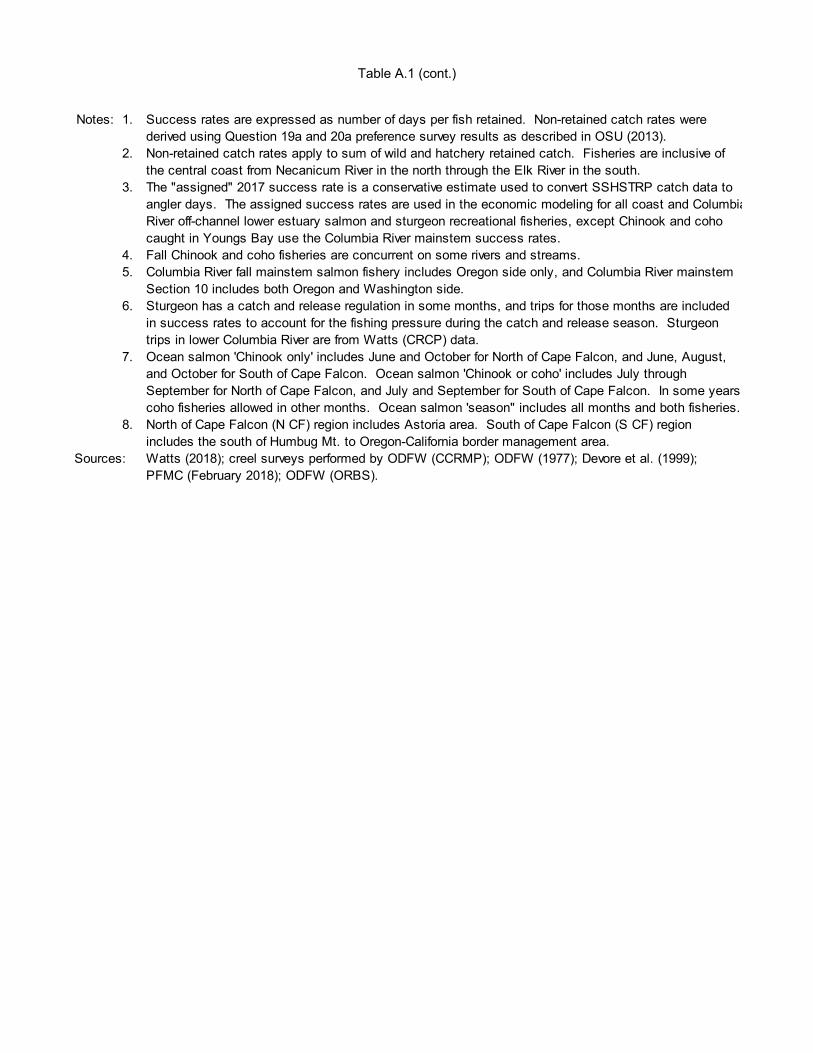
Table A.1 (cont.)
Notes: 1. Success rates are expressed as number of days per fish retained. Non-retained catch rates were derived using Question 19a and 20a preference survey results as described in OSU (2013).
2. Non-retained catch rates apply to sum of wild and hatchery retained catch. Fisheries are inclusive of the central coast from Necanicum River in the north through the Elk River in the south.
3. The "assigned" 2017 success rate is a conservative estimate used to convert SSHSTRP catch data to angler days. The assigned success rates are used in the economic modeling for all coast and ColumbiaRiver off-channel lower estuary salmon and sturgeon recreational fisheries, except Chinook and coho caught in Youngs Bay use the Columbia River mainstem success rates.
4. Fall Chinook and coho fisheries are concurrent on some rivers and streams.5. Columbia River fall mainstem salmon fishery includes Oregon side only, and Columbia River mainstem
Section 10 includes both Oregon and Washington side.6. Sturgeon has a catch and release regulation in some months, and trips for those months are included
in success rates to account for the fishing pressure during the catch and release season. Sturgeon trips in lower Columbia River are from Watts (CRCP) data.
7. Ocean salmon 'Chinook only' includes June and October for North of Cape Falcon, and June, August, and October for South of Cape Falcon. Ocean salmon 'Chinook or coho' includes July through September for North of Cape Falcon, and July and September for South of Cape Falcon. In some years coho fisheries allowed in other months. Ocean salmon 'season" includes all months and both fisheries.
8. North of Cape Falcon (N CF) region includes Astoria area. South of Cape Falcon (S CF) region includes the south of Humbug Mt. to Oregon-California border management area.
Sources: Watts (2018); creel surveys performed by ODFW (CCRMP); ODFW (1977); Devore et al. (1999); PFMC (February 2018); ODFW (ORBS).
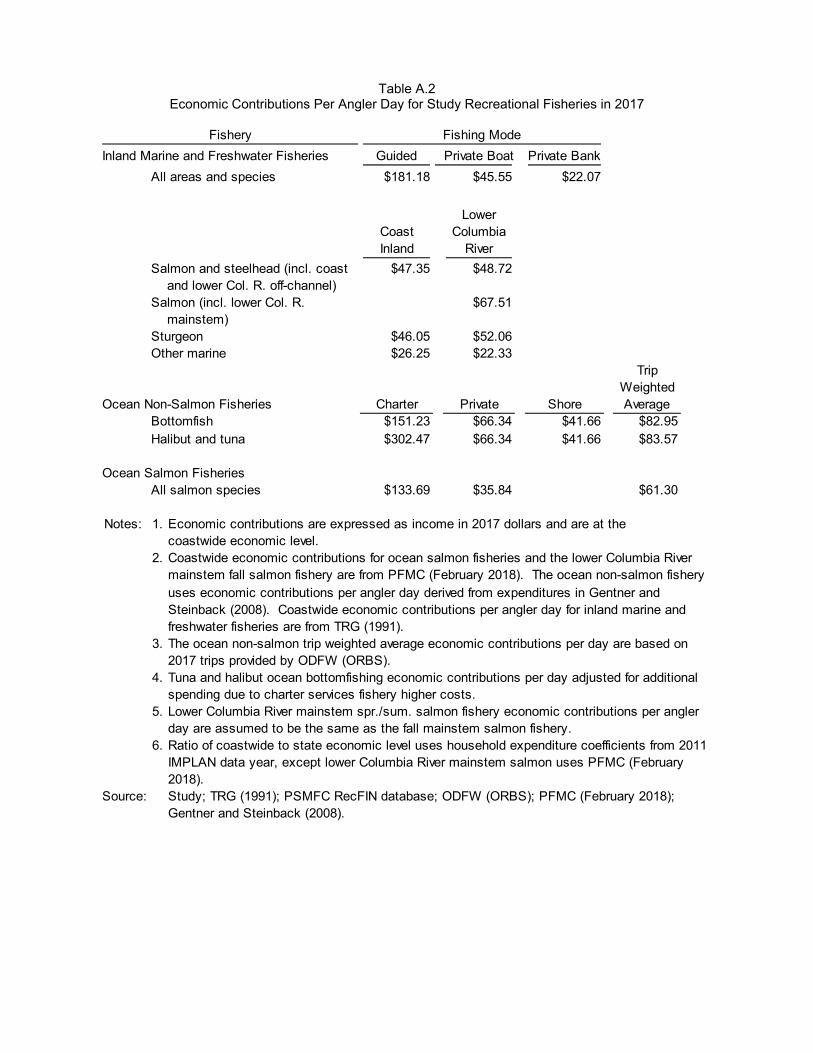
Table A.2
Economic Contributions Per Angler Day for Study Recreational Fisheries in 2017
Fishery Fishing Mode
Inland Marine and Freshwater Fisheries Guided Private Boat Private Bank
All areas and species $181.18 $45.55 $22.07
LowerCoast ColumbiaInland River
Salmon and steelhead (incl. coast $47.35 $48.72 and lower Col. R. off-channel)Salmon (incl. lower Col. R. $67.51 mainstem)Sturgeon $46.05 $52.06Other marine $26.25 $22.33
TripWeighted
Ocean Non-Salmon Fisheries Charter Private Shore AverageBottomfish $151.23 $66.34 $41.66 $82.95Halibut and tuna $302.47 $66.34 $41.66 $83.57
Ocean Salmon FisheriesAll salmon species $133.69 $35.84 $61.30
Notes: 1. Economic contributions are expressed as income in 2017 dollars and are at the coastwide economic level.
2. Coastwide economic contributions for ocean salmon fisheries and the lower Columbia River mainstem fall salmon fishery are from PFMC (February 2018). The ocean non-salmon fishery uses economic contributions per angler day derived from expenditures in Gentner and Steinback (2008). Coastwide economic contributions per angler day for inland marine and freshwater fisheries are from TRG (1991).
3. The ocean non-salmon trip weighted average economic contributions per day are based on 2017 trips provided by ODFW (ORBS).
4. Tuna and halibut ocean bottomfishing economic contributions per day adjusted for additional spending due to charter services fishery higher costs.
5. Lower Columbia River mainstem spr./sum. salmon fishery economic contributions per angler day are assumed to be the same as the fall mainstem salmon fishery.
6. Ratio of coastwide to state economic level uses household expenditure coefficients from 2011 IMPLAN data year, except lower Columbia River mainstem salmon uses PFMC (February 2018).
Source: Study; TRG (1991); PSMFC RecFIN database; ODFW (ORBS); PFMC (February 2018); Gentner and Steinback (2008).
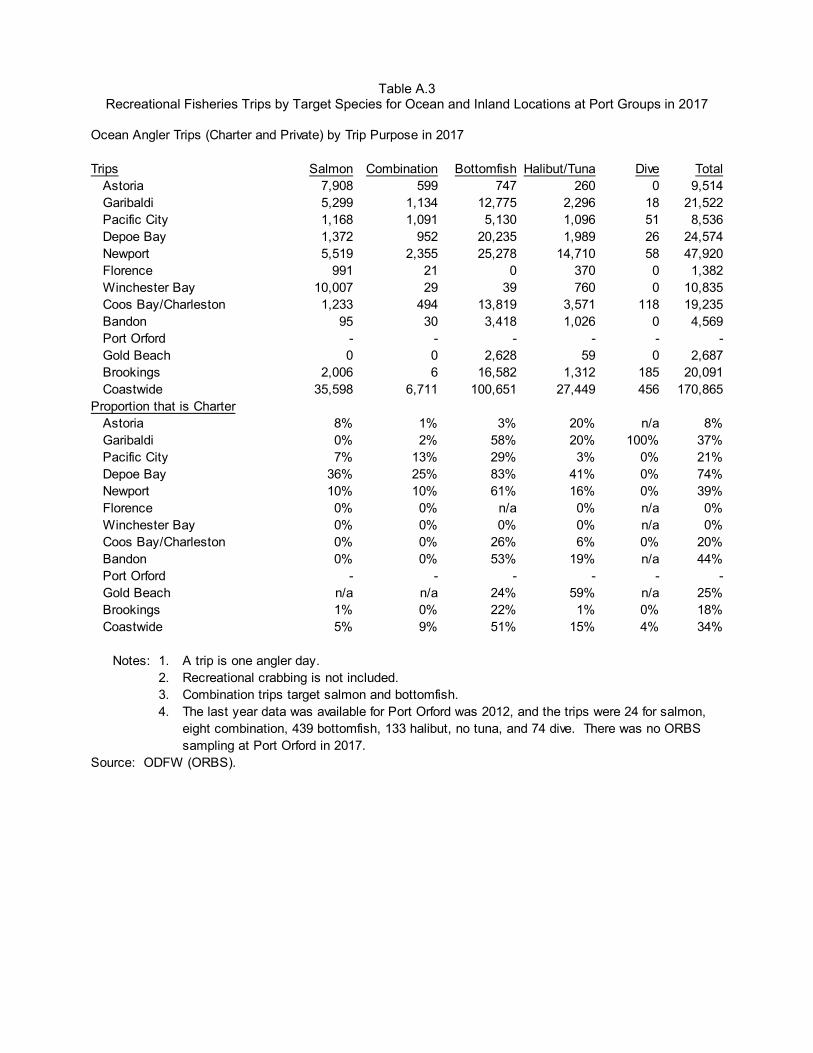
Table A.3
Recreational Fisheries Trips by Target Species for Ocean and Inland Locations at Port Groups in 2017
Ocean Angler Trips (Charter and Private) by Trip Purpose in 2017
Trips Salmon Combination Bottomfish Halibut/Tuna Dive TotalAstoria 7,908 599 747 260 0 9,514Garibaldi 5,299 1,134 12,775 2,296 18 21,522Pacific City 1,168 1,091 5,130 1,096 51 8,536Depoe Bay 1,372 952 20,235 1,989 26 24,574Newport 5,519 2,355 25,278 14,710 58 47,920Florence 991 21 0 370 0 1,382Winchester Bay 10,007 29 39 760 0 10,835Coos Bay/Charleston 1,233 494 13,819 3,571 118 19,235Bandon 95 30 3,418 1,026 0 4,569Port Orford - - - - - -Gold Beach 0 0 2,628 59 0 2,687Brookings 2,006 6 16,582 1,312 185 20,091Coastwide 35,598 6,711 100,651 27,449 456 170,865
Proportion that is CharterAstoria 8% 1% 3% 20% n/a 8%Garibaldi 0% 2% 58% 20% 100% 37%Pacific City 7% 13% 29% 3% 0% 21%Depoe Bay 36% 25% 83% 41% 0% 74%Newport 10% 10% 61% 16% 0% 39%Florence 0% 0% n/a 0% n/a 0%Winchester Bay 0% 0% 0% 0% n/a 0%Coos Bay/Charleston 0% 0% 26% 6% 0% 20%Bandon 0% 0% 53% 19% n/a 44%Port Orford - - - - - -Gold Beach n/a n/a 24% 59% n/a 25%Brookings 1% 0% 22% 1% 0% 18%Coastwide 5% 9% 51% 15% 4% 34%
Notes: 1. A trip is one angler day.2. Recreational crabbing is not included.3. Combination trips target salmon and bottomfish.4. The last year data was available for Port Orford was 2012, and the trips were 24 for salmon,
eight combination, 439 bottomfish, 133 halibut, no tuna, and 74 dive. There was no ORBS sampling at Port Orford in 2017.
Source: ODFW (ORBS).
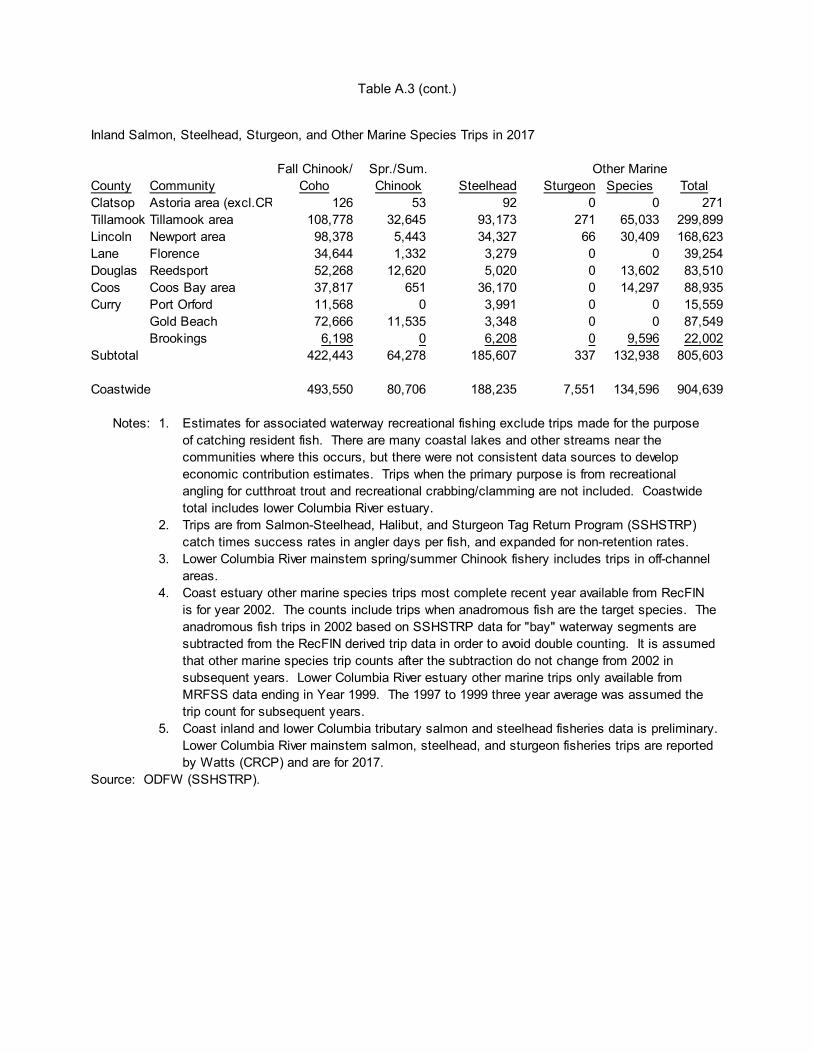
Table A.3 (cont.)
Inland Salmon, Steelhead, Sturgeon, and Other Marine Species Trips in 2017
Fall Chinook/ Spr./Sum. Other MarineCounty Community Coho Chinook Steelhead Sturgeon Species TotalClatsop Astoria area (excl.CR 126 53 92 0 0 271Tillamook Tillamook area 108,778 32,645 93,173 271 65,033 299,899Lincoln Newport area 98,378 5,443 34,327 66 30,409 168,623Lane Florence 34,644 1,332 3,279 0 0 39,254Douglas Reedsport 52,268 12,620 5,020 0 13,602 83,510Coos Coos Bay area 37,817 651 36,170 0 14,297 88,935Curry Port Orford 11,568 0 3,991 0 0 15,559
Gold Beach 72,666 11,535 3,348 0 0 87,549Brookings 6,198 0 6,208 0 9,596 22,002
Subtotal 422,443 64,278 185,607 337 132,938 805,603
Coastwide 493,550 80,706 188,235 7,551 134,596 904,639
Notes: 1. Estimates for associated waterway recreational fishing exclude trips made for the purpose of catching resident fish. There are many coastal lakes and other streams near the communities where this occurs, but there were not consistent data sources to develop economic contribution estimates. Trips when the primary purpose is from recreational angling for cutthroat trout and recreational crabbing/clamming are not included. Coastwide total includes lower Columbia River estuary.
2. Trips are from Salmon-Steelhead, Halibut, and Sturgeon Tag Return Program (SSHSTRP) catch times success rates in angler days per fish, and expanded for non-retention rates.
3. Lower Columbia River mainstem spring/summer Chinook fishery includes trips in off-channel areas.
4. Coast estuary other marine species trips most complete recent year available from RecFIN is for year 2002. The counts include trips when anadromous fish are the target species. The anadromous fish trips in 2002 based on SSHSTRP data for "bay" waterway segments are subtracted from the RecFIN derived trip data in order to avoid double counting. It is assumed that other marine species trip counts after the subtraction do not change from 2002 in subsequent years. Lower Columbia River estuary other marine trips only available from MRFSS data ending in Year 1999. The 1997 to 1999 three year average was assumed the trip count for subsequent years.
5. Coast inland and lower Columbia tributary salmon and steelhead fisheries data is preliminary. Lower Columbia River mainstem salmon, steelhead, and sturgeon fisheries trips are reported by Watts (CRCP) and are for 2017.
Source: ODFW (SSHSTRP).
Appendix B
Vessel Exit/Entry Trends at Port Groups and Coastwide
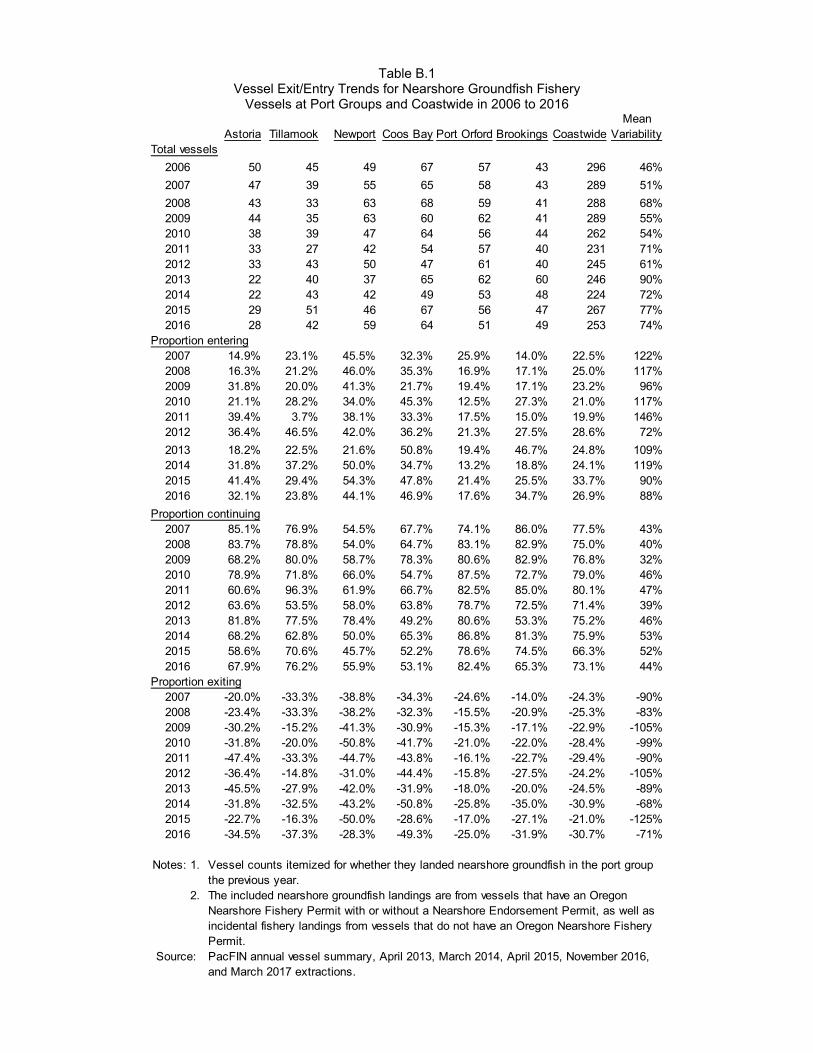
Table B.1 Vessel Exit/Entry Trends for Nearshore Groundfish Fishery
Vessels at Port Groups and Coastwide in 2006 to 2016 Mean
Astoria Tillamook Newport Coos Bay Port Orford Brookings Coastwide VariabilityTotal vessels
2006 50 45 49 67 57 43 296 46%
2007 47 39 55 65 58 43 289 51%
2008 43 33 63 68 59 41 288 68%2009 44 35 63 60 62 41 289 55%2010 38 39 47 64 56 44 262 54%2011 33 27 42 54 57 40 231 71%2012 33 43 50 47 61 40 245 61%2013 22 40 37 65 62 60 246 90%2014 22 43 42 49 53 48 224 72%2015 29 51 46 67 56 47 267 77%2016 28 42 59 64 51 49 253 74%
Proportion entering2007 14.9% 23.1% 45.5% 32.3% 25.9% 14.0% 22.5% 122%2008 16.3% 21.2% 46.0% 35.3% 16.9% 17.1% 25.0% 117%2009 31.8% 20.0% 41.3% 21.7% 19.4% 17.1% 23.2% 96%2010 21.1% 28.2% 34.0% 45.3% 12.5% 27.3% 21.0% 117%2011 39.4% 3.7% 38.1% 33.3% 17.5% 15.0% 19.9% 146%2012 36.4% 46.5% 42.0% 36.2% 21.3% 27.5% 28.6% 72%
2013 18.2% 22.5% 21.6% 50.8% 19.4% 46.7% 24.8% 109%2014 31.8% 37.2% 50.0% 34.7% 13.2% 18.8% 24.1% 119%2015 41.4% 29.4% 54.3% 47.8% 21.4% 25.5% 33.7% 90%2016 32.1% 23.8% 44.1% 46.9% 17.6% 34.7% 26.9% 88%
Proportion continuing2007 85.1% 76.9% 54.5% 67.7% 74.1% 86.0% 77.5% 43%2008 83.7% 78.8% 54.0% 64.7% 83.1% 82.9% 75.0% 40%2009 68.2% 80.0% 58.7% 78.3% 80.6% 82.9% 76.8% 32%2010 78.9% 71.8% 66.0% 54.7% 87.5% 72.7% 79.0% 46%2011 60.6% 96.3% 61.9% 66.7% 82.5% 85.0% 80.1% 47%2012 63.6% 53.5% 58.0% 63.8% 78.7% 72.5% 71.4% 39%2013 81.8% 77.5% 78.4% 49.2% 80.6% 53.3% 75.2% 46%2014 68.2% 62.8% 50.0% 65.3% 86.8% 81.3% 75.9% 53%2015 58.6% 70.6% 45.7% 52.2% 78.6% 74.5% 66.3% 52%2016 67.9% 76.2% 55.9% 53.1% 82.4% 65.3% 73.1% 44%
Proportion exiting2007 -20.0% -33.3% -38.8% -34.3% -24.6% -14.0% -24.3% -90%2008 -23.4% -33.3% -38.2% -32.3% -15.5% -20.9% -25.3% -83%2009 -30.2% -15.2% -41.3% -30.9% -15.3% -17.1% -22.9% -105%2010 -31.8% -20.0% -50.8% -41.7% -21.0% -22.0% -28.4% -99%2011 -47.4% -33.3% -44.7% -43.8% -16.1% -22.7% -29.4% -90%2012 -36.4% -14.8% -31.0% -44.4% -15.8% -27.5% -24.2% -105%2013 -45.5% -27.9% -42.0% -31.9% -18.0% -20.0% -24.5% -89%2014 -31.8% -32.5% -43.2% -50.8% -25.8% -35.0% -30.9% -68%2015 -22.7% -16.3% -50.0% -28.6% -17.0% -27.1% -21.0% -125%2016 -34.5% -37.3% -28.3% -49.3% -25.0% -31.9% -30.7% -71%
Notes: 1. Vessel counts itemized for whether they landed nearshore groundfish in the port group the previous year.
2. The included nearshore groundfish landings are from vessels that have an Oregon Nearshore Fishery Permit with or without a Nearshore Endorsement Permit, as well as incidental fishery landings from vessels that do not have an Oregon Nearshore Fishery Permit.
Source: PacFIN annual vessel summary, April 2013, March 2014, April 2015, November 2016, and March 2017 extractions.
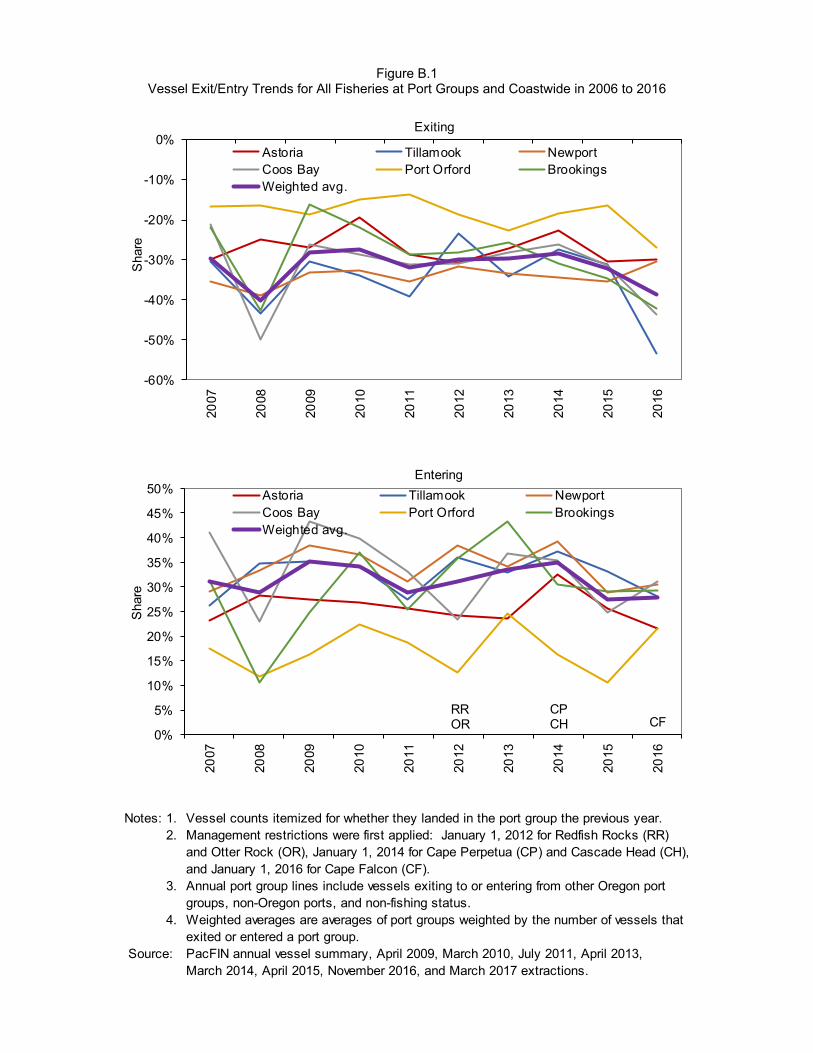
Figure B.1 Vessel Exit/Entry Trends for All Fisheries at Port Groups and Coastwide in 2006 to 2016
-60%
-50%
-40%
-30%
-20%
-10%
0%
2007
2008
2009
2010
2011
2012
2013
2014
2015
2016
Sha
reExiting
Astoria Tillamook NewportCoos Bay Port Orford BrookingsWeighted avg.
0%
5%
10%
15%
20%
25%
30%
35%
40%
45%
50%
2007
2008
2009
2010
2011
2012
2013
2014
2015
2016
Sha
re
Entering
Astoria Tillamook NewportCoos Bay Port Orford BrookingsWeighted avg.
RROR
CPCH CF
Notes: 1. Vessel counts itemized for whether they landed in the port group the previous year.2. Management restrictions were first applied: January 1, 2012 for Redfish Rocks (RR)
and Otter Rock (OR), January 1, 2014 for Cape Perpetua (CP) and Cascade Head (CH), and January 1, 2016 for Cape Falcon (CF).
3. Annual port group lines include vessels exiting to or entering from other Oregon port groups, non-Oregon ports, and non-fishing status.
4. Weighted averages are averages of port groups weighted by the number of vessels that exited or entered a port group.
Source: PacFIN annual vessel summary, April 2009, March 2010, July 2011, April 2013, March 2014, April 2015, November 2016, and March 2017 extractions.

Appendix C
Commercial Vessel and Landings Trend Information
Appendix C
Commercial Vessel and Landings Trend Information
Contents
Table C.1: Onshore Landed Volume by Major Fishery in 1981 to 2017 Table C.2: Onshore Landed Value by Major Fishery in 1981 to 2017 Table C.3: Fisheries Annual Ex-Vessel Prices by Selected Species and Species Groups in
1971 to 2017 Table C.4: Vessel Counts and Revenue Shares by Revenue Categories in 1981 to 2016 Table C.5: Port Group Share of Onshore Landings and Home-Port Vessels in 2012 to 2016 Table C.6: Landings and Participant Counts by Port in 2017
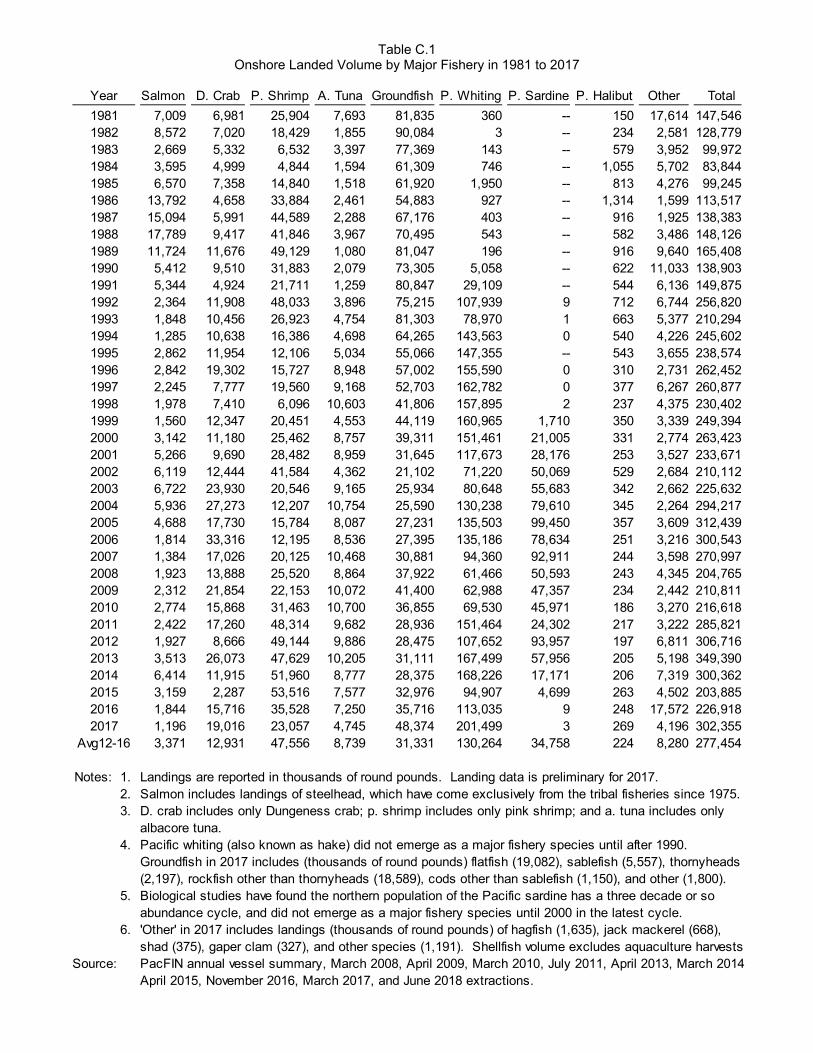
Table C.1 Onshore Landed Volume by Major Fishery in 1981 to 2017
Year Salmon D. Crab P. Shrimp A. Tuna Groundfish P. Whiting P. Sardine P. Halibut Other Total
1981 7,009 6,981 25,904 7,693 81,835 360 -- 150 17,614 147,5461982 8,572 7,020 18,429 1,855 90,084 3 -- 234 2,581 128,7791983 2,669 5,332 6,532 3,397 77,369 143 -- 579 3,952 99,9721984 3,595 4,999 4,844 1,594 61,309 746 -- 1,055 5,702 83,8441985 6,570 7,358 14,840 1,518 61,920 1,950 -- 813 4,276 99,2451986 13,792 4,658 33,884 2,461 54,883 927 -- 1,314 1,599 113,5171987 15,094 5,991 44,589 2,288 67,176 403 -- 916 1,925 138,3831988 17,789 9,417 41,846 3,967 70,495 543 -- 582 3,486 148,1261989 11,724 11,676 49,129 1,080 81,047 196 -- 916 9,640 165,4081990 5,412 9,510 31,883 2,079 73,305 5,058 -- 622 11,033 138,9031991 5,344 4,924 21,711 1,259 80,847 29,109 -- 544 6,136 149,8751992 2,364 11,908 48,033 3,896 75,215 107,939 9 712 6,744 256,8201993 1,848 10,456 26,923 4,754 81,303 78,970 1 663 5,377 210,2941994 1,285 10,638 16,386 4,698 64,265 143,563 0 540 4,226 245,6021995 2,862 11,954 12,106 5,034 55,066 147,355 -- 543 3,655 238,5741996 2,842 19,302 15,727 8,948 57,002 155,590 0 310 2,731 262,4521997 2,245 7,777 19,560 9,168 52,703 162,782 0 377 6,267 260,8771998 1,978 7,410 6,096 10,603 41,806 157,895 2 237 4,375 230,4021999 1,560 12,347 20,451 4,553 44,119 160,965 1,710 350 3,339 249,3942000 3,142 11,180 25,462 8,757 39,311 151,461 21,005 331 2,774 263,4232001 5,266 9,690 28,482 8,959 31,645 117,673 28,176 253 3,527 233,6712002 6,119 12,444 41,584 4,362 21,102 71,220 50,069 529 2,684 210,1122003 6,722 23,930 20,546 9,165 25,934 80,648 55,683 342 2,662 225,6322004 5,936 27,273 12,207 10,754 25,590 130,238 79,610 345 2,264 294,2172005 4,688 17,730 15,784 8,087 27,231 135,503 99,450 357 3,609 312,4392006 1,814 33,316 12,195 8,536 27,395 135,186 78,634 251 3,216 300,5432007 1,384 17,026 20,125 10,468 30,881 94,360 92,911 244 3,598 270,9972008 1,923 13,888 25,520 8,864 37,922 61,466 50,593 243 4,345 204,7652009 2,312 21,854 22,153 10,072 41,400 62,988 47,357 234 2,442 210,8112010 2,774 15,868 31,463 10,700 36,855 69,530 45,971 186 3,270 216,6182011 2,422 17,260 48,314 9,682 28,936 151,464 24,302 217 3,222 285,8212012 1,927 8,666 49,144 9,886 28,475 107,652 93,957 197 6,811 306,7162013 3,513 26,073 47,629 10,205 31,111 167,499 57,956 205 5,198 349,3902014 6,414 11,915 51,960 8,777 28,375 168,226 17,171 206 7,319 300,3622015 3,159 2,287 53,516 7,577 32,976 94,907 4,699 263 4,502 203,8852016 1,844 15,716 35,528 7,250 35,716 113,035 9 248 17,572 226,9182017 1,196 19,016 23,057 4,745 48,374 201,499 3 269 4,196 302,355
Avg12-16 3,371 12,931 47,556 8,739 31,331 130,264 34,758 224 8,280 277,454
Notes: 1. Landings are reported in thousands of round pounds. Landing data is preliminary for 2017.2. Salmon includes landings of steelhead, which have come exclusively from the tribal fisheries since 1975.3. D. crab includes only Dungeness crab; p. shrimp includes only pink shrimp; and a. tuna includes only
albacore tuna.4. Pacific whiting (also known as hake) did not emerge as a major fishery species until after 1990.
Groundfish in 2017 includes (thousands of round pounds) flatfish (19,082), sablefish (5,557), thornyheads (2,197), rockfish other than thornyheads (18,589), cods other than sablefish (1,150), and other (1,800).
5. Biological studies have found the northern population of the Pacific sardine has a three decade or so abundance cycle, and did not emerge as a major fishery species until 2000 in the latest cycle.
6. 'Other' in 2017 includes landings (thousands of round pounds) of hagfish (1,635), jack mackerel (668), shad (375), gaper clam (327), and other species (1,191). Shellfish volume excludes aquaculture harvests
Source: PacFIN annual vessel summary, March 2008, April 2009, March 2010, July 2011, April 2013, March 2014April 2015, November 2016, March 2017, and June 2018 extractions.

Table C.2 Onshore Landed Value by Major Fishery in 1981 to 2017
Price Salmon Dungeness Crab Pink Shrimp Albacore Tuna Groundfish Pacific Whiting Pacific Sardine Pacific Halibut Other Total
Year Index Real Nominal Real Nominal Real Nominal Real Nominal Real Nominal Real Nominal Real Nominal Real Nominal Real Nominal Real Nominal
1981 42.9 25,770 11,047 15,651 6,709 30,406 13,034 15,528 6,657 33,814 14,496 59 25 -- -- 373 160 12,165 5,215 133,766 57,3441982 45.5 27,144 12,356 16,549 7,533 20,363 9,269 2,703 1,230 44,078 20,064 0 0 -- -- 585 266 2,159 983 113,581 51,7021983 47.3 6,428 3,040 16,723 7,910 9,848 4,658 3,983 1,884 38,794 18,349 50 24 -- -- 1,333 631 3,227 1,526 80,387 38,0231984 49.0 10,444 5,118 15,806 7,746 4,393 2,153 1,811 888 30,570 14,981 120 59 -- -- 1,658 813 4,640 2,274 69,442 34,0311985 50.6 17,913 9,056 21,072 10,654 10,357 5,236 1,621 819 33,480 16,927 343 173 -- -- 1,579 798 3,804 1,923 90,168 45,5871986 51.6 29,432 15,181 12,770 6,587 35,150 18,131 2,569 1,325 33,642 17,353 117 60 -- -- 3,643 1,879 2,626 1,355 119,948 61,8711987 52.8 51,078 26,994 15,802 8,351 57,282 30,273 3,178 1,680 46,081 24,353 65 34 -- -- 2,693 1,423 3,003 1,587 179,182 94,6961988 54.7 71,315 39,020 20,617 11,280 31,344 17,150 6,083 3,328 43,924 24,033 75 41 -- -- 1,603 877 3,442 1,883 178,402 97,6121989 56.9 25,024 14,228 23,854 13,564 31,490 17,905 1,559 887 44,356 25,221 26 15 -- -- 2,289 1,301 7,151 4,066 135,750 77,1871990 59.0 16,227 9,573 24,669 14,554 26,492 15,629 2,989 1,764 39,235 23,147 372 220 -- -- 1,888 1,114 9,677 5,709 121,550 71,7101991 61.0 9,557 5,828 12,236 7,462 19,803 12,076 1,606 979 47,251 28,814 2,247 1,370 -- -- 1,675 1,022 7,431 4,531 101,805 62,0831992 62.4 5,911 3,687 21,463 13,388 27,555 17,187 6,363 3,969 42,879 26,745 8,142 5,078 -- -- 1,327 828 5,170 3,225 118,810 74,1061993 63.9 3,798 2,425 18,633 11,898 13,956 8,912 6,081 3,883 43,285 27,638 3,585 2,289 -- -- 1,350 862 4,623 2,952 95,312 60,8591994 65.2 2,238 1,459 22,177 14,462 14,761 9,626 5,750 3,750 44,116 28,769 6,591 4,298 -- -- 1,556 1,015 3,500 2,282 100,688 65,6621995 66.6 5,367 3,574 30,104 20,044 12,915 8,599 6,083 4,050 46,519 30,974 10,514 7,000 -- -- 1,413 941 3,432 2,285 116,347 77,4671996 67.8 4,850 3,288 38,613 26,180 13,808 9,362 10,958 7,430 44,653 30,275 6,116 4,147 -- -- 1,038 704 1,827 1,239 121,862 82,6231997 69.0 4,019 2,772 21,219 14,636 11,469 7,910 10,644 7,342 40,576 27,987 9,892 6,823 -- -- 1,008 695 2,040 1,407 100,866 69,5731998 69.7 3,714 2,590 17,952 12,519 4,573 3,189 9,379 6,540 27,950 19,491 5,387 3,756 1 1 464 323 2,287 1,595 71,707 50,0051999 70.7 2,887 2,042 32,667 23,107 13,530 9,571 5,349 3,784 31,373 22,192 8,366 5,917 121 86 979 692 1,484 1,050 96,756 68,4412000 72.3 5,570 4,029 32,779 23,709 14,091 10,192 10,353 7,489 33,696 24,373 8,407 6,081 1,588 1,149 965 698 2,781 2,012 110,231 79,7322001 74.0 7,906 5,847 26,092 19,296 10,223 7,560 10,220 7,559 27,591 20,405 5,587 4,132 2,189 1,619 652 482 2,996 2,216 93,456 69,1162002 75.1 9,234 6,933 27,650 20,761 15,120 11,353 3,931 2,952 18,925 14,210 4,288 3,219 3,755 2,819 1,350 1,013 2,516 1,889 86,769 65,1492003 76.5 11,593 8,869 48,520 37,117 6,603 5,051 8,064 6,169 23,102 17,673 4,761 3,642 3,845 2,941 1,125 860 1,521 1,163 109,134 83,4872004 78.5 16,545 12,995 54,686 42,954 6,035 4,740 11,642 9,145 20,805 16,342 5,908 4,641 6,200 4,870 1,114 875 1,487 1,168 124,422 97,7302005 81.0 12,889 10,438 32,842 26,597 8,522 6,901 10,886 8,816 22,814 18,475 8,776 7,107 7,654 6,199 1,106 896 1,899 1,538 107,386 86,9652006 83.5 5,920 4,940 64,474 53,807 5,385 4,494 9,667 8,067 23,885 19,933 9,555 7,974 4,485 3,743 918 766 1,445 1,206 125,734 104,9312007 85.7 5,439 4,662 44,576 38,202 10,927 9,365 11,048 9,468 23,918 20,497 7,585 6,501 5,310 4,551 991 849 1,603 1,374 111,397 95,4682008 87.3 4,855 4,240 33,392 29,164 15,960 13,939 12,195 10,651 30,850 26,943 7,820 6,830 6,487 5,665 1,036 905 2,304 2,012 114,899 100,3492009 88.0 4,026 3,544 48,177 42,404 7,741 6,813 11,565 10,179 31,965 28,135 4,226 3,720 6,011 5,291 762 670 1,845 1,624 116,318 102,3802010 89.0 8,645 7,698 36,775 32,746 12,333 10,982 13,951 12,422 28,782 25,629 6,080 5,414 5,898 5,252 832 740 2,370 2,111 115,666 102,9962011 90.9 7,412 6,737 49,163 44,690 27,070 24,607 20,644 18,766 31,286 28,439 18,171 16,518 3,511 3,192 1,255 1,141 2,635 2,395 161,147 146,4852012 92.7 7,474 6,925 31,423 29,114 26,643 24,685 16,273 15,077 25,725 23,834 15,769 14,611 9,689 8,977 1,041 965 2,356 2,183 136,394 126,3702013 94.3 13,169 12,418 75,518 71,209 25,614 24,153 17,052 16,079 23,673 22,322 21,639 20,405 6,681 6,299 1,042 982 3,742 3,529 188,131 177,3962014 96.1 20,948 20,124 49,953 47,988 30,526 29,326 11,475 11,023 22,703 21,810 19,022 18,274 3,666 3,522 1,196 1,149 3,030 2,911 162,519 156,1272015 97.1 12,224 11,864 12,273 11,912 41,638 40,413 9,491 9,212 29,661 28,788 7,363 7,146 837 813 1,461 1,418 2,791 2,709 117,738 114,2742016 98.1 8,467 8,308 56,805 55,735 25,575 25,093 12,742 12,502 32,602 31,988 8,861 8,694 0 0 1,419 1,392 4,916 4,823 151,387 148,5362017 100.0 5,556 5,556 58,728 58,728 12,688 12,688 10,803 10,803 35,673 35,673 16,385 16,385 0 0 1,413 1,413 2,947 2,947 144,193 144,193
Avg12-16 12,456 45,194 29,999 13,407 26,873 14,531 4,175 1,232 3,367 151,234
Notes: 1. Nominal value is the revenue received by fishermen/harvesters in the landing year. Real value is in thousands of 2017 dollars adjusted using the GDP implicit price deflator developed by U.S. Bureau of Economic Analysis.
2. Groundfish in 2017 includes landings (real ex-vessel value in thousands) of sablefish ($15,519), flatfish ($10,446), thornyheads ($1,121), rockfish other than thornyheads ($6,339), cods other than sablefish ($1,662), and other ($585). 'Other' in 2017 includes (real ex-vessel value in thousands) hagfish ($1,573), red sea urchin ($362), gaper clam ($297), basket cockle ($261), ghost shrimp ($113), white sturgeon ($83), butter clam ($79), and other species ($178). Shellfish value excludes private lands harvest.
3. Notes and sources from volume table concerning species composition also apply to this table.
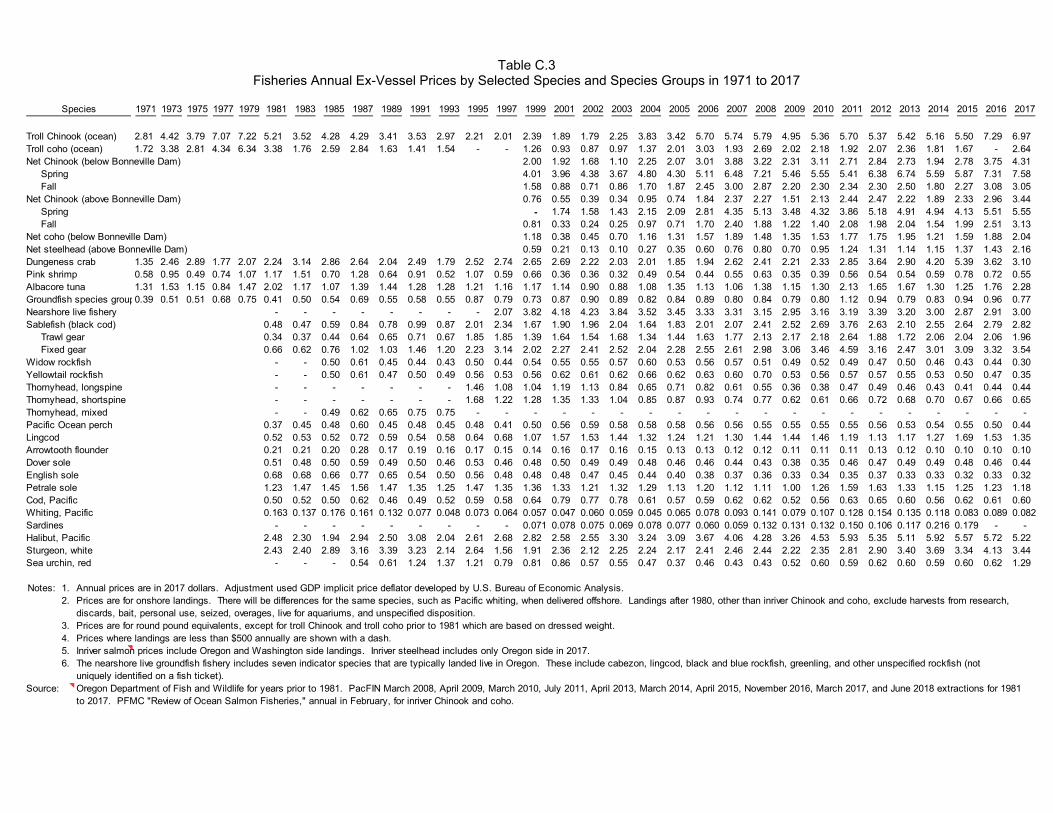
Table C.3
Fisheries Annual Ex-Vessel Prices by Selected Species and Species Groups in 1971 to 2017
Species 1971 1973 1975 1977 1979 1981 1983 1985 1987 1989 1991 1993 1995 1997 1999 2001 2002 2003 2004 2005 2006 2007 2008 2009 2010 2011 2012 2013 2014 2015 2016 2017
Troll Chinook (ocean) 2.81 4.42 3.79 7.07 7.22 5.21 3.52 4.28 4.29 3.41 3.53 2.97 2.21 2.01 2.39 1.89 1.79 2.25 3.83 3.42 5.70 5.74 5.79 4.95 5.36 5.70 5.37 5.42 5.16 5.50 7.29 6.97Troll coho (ocean) 1.72 3.38 2.81 4.34 6.34 3.38 1.76 2.59 2.84 1.63 1.41 1.54 - - 1.26 0.93 0.87 0.97 1.37 2.01 3.03 1.93 2.69 2.02 2.18 1.92 2.07 2.36 1.81 1.67 - 2.64Net Chinook (below Bonneville Dam) 2.00 1.92 1.68 1.10 2.25 2.07 3.01 3.88 3.22 2.31 3.11 2.71 2.84 2.73 1.94 2.78 3.75 4.31 Spring 4.01 3.96 4.38 3.67 4.80 4.30 5.11 6.48 7.21 5.46 5.55 5.41 6.38 6.74 5.59 5.87 7.31 7.58 Fall 1.58 0.88 0.71 0.86 1.70 1.87 2.45 3.00 2.87 2.20 2.30 2.34 2.30 2.50 1.80 2.27 3.08 3.05Net Chinook (above Bonneville Dam) 0.76 0.55 0.39 0.34 0.95 0.74 1.84 2.37 2.27 1.51 2.13 2.44 2.47 2.22 1.89 2.33 2.96 3.44 Spring - 1.74 1.58 1.43 2.15 2.09 2.81 4.35 5.13 3.48 4.32 3.86 5.18 4.91 4.94 4.13 5.51 5.55 Fall 0.81 0.33 0.24 0.25 0.97 0.71 1.70 2.40 1.88 1.22 1.40 2.08 1.98 2.04 1.54 1.99 2.51 3.13Net coho (below Bonneville Dam) 1.18 0.38 0.45 0.70 1.16 1.31 1.57 1.89 1.48 1.35 1.53 1.77 1.75 1.95 1.21 1.59 1.88 2.04Net steelhead (above Bonneville Dam) 0.59 0.21 0.13 0.10 0.27 0.35 0.60 0.76 0.80 0.70 0.95 1.24 1.31 1.14 1.15 1.37 1.43 2.16Dungeness crab 1.35 2.46 2.89 1.77 2.07 2.24 3.14 2.86 2.64 2.04 2.49 1.79 2.52 2.74 2.65 2.69 2.22 2.03 2.01 1.85 1.94 2.62 2.41 2.21 2.33 2.85 3.64 2.90 4.20 5.39 3.62 3.10Pink shrimp 0.58 0.95 0.49 0.74 1.07 1.17 1.51 0.70 1.28 0.64 0.91 0.52 1.07 0.59 0.66 0.36 0.36 0.32 0.49 0.54 0.44 0.55 0.63 0.35 0.39 0.56 0.54 0.54 0.59 0.78 0.72 0.55Albacore tuna 1.31 1.53 1.15 0.84 1.47 2.02 1.17 1.07 1.39 1.44 1.28 1.28 1.21 1.16 1.17 1.14 0.90 0.88 1.08 1.35 1.13 1.06 1.38 1.15 1.30 2.13 1.65 1.67 1.30 1.25 1.76 2.28Groundfish species group0.39 0.51 0.51 0.68 0.75 0.41 0.50 0.54 0.69 0.55 0.58 0.55 0.87 0.79 0.73 0.87 0.90 0.89 0.82 0.84 0.89 0.80 0.84 0.79 0.80 1.12 0.94 0.79 0.83 0.94 0.96 0.77Nearshore live fishery - - - - - - - - 2.07 3.82 4.18 4.23 3.84 3.52 3.45 3.33 3.31 3.15 2.95 3.16 3.19 3.39 3.20 3.00 2.87 2.91 3.00Sablefish (black cod) 0.48 0.47 0.59 0.84 0.78 0.99 0.87 2.01 2.34 1.67 1.90 1.96 2.04 1.64 1.83 2.01 2.07 2.41 2.52 2.69 3.76 2.63 2.10 2.55 2.64 2.79 2.82 Trawl gear 0.34 0.37 0.44 0.64 0.65 0.71 0.67 1.85 1.85 1.39 1.64 1.54 1.68 1.34 1.44 1.63 1.77 2.13 2.17 2.18 2.64 1.88 1.72 2.06 2.04 2.06 1.96 Fixed gear 0.66 0.62 0.76 1.02 1.03 1.46 1.20 2.23 3.14 2.02 2.27 2.41 2.52 2.04 2.28 2.55 2.61 2.98 3.06 3.46 4.59 3.16 2.47 3.01 3.09 3.32 3.54Widow rockfish - - 0.50 0.61 0.45 0.44 0.43 0.50 0.44 0.54 0.55 0.55 0.57 0.60 0.53 0.56 0.57 0.51 0.49 0.52 0.49 0.47 0.50 0.46 0.43 0.44 0.30Yellowtail rockfish - - 0.50 0.61 0.47 0.50 0.49 0.56 0.53 0.56 0.62 0.61 0.62 0.66 0.62 0.63 0.60 0.70 0.53 0.56 0.57 0.57 0.55 0.53 0.50 0.47 0.35Thornyhead, longspine - - - - - - - 1.46 1.08 1.04 1.19 1.13 0.84 0.65 0.71 0.82 0.61 0.55 0.36 0.38 0.47 0.49 0.46 0.43 0.41 0.44 0.44Thornyhead, shortspine - - - - - - - 1.68 1.22 1.28 1.35 1.33 1.04 0.85 0.87 0.93 0.74 0.77 0.62 0.61 0.66 0.72 0.68 0.70 0.67 0.66 0.65Thornyhead, mixed - - 0.49 0.62 0.65 0.75 0.75 - - - - - - - - - - - - - - - - - - - -Pacific Ocean perch 0.37 0.45 0.48 0.60 0.45 0.48 0.45 0.48 0.41 0.50 0.56 0.59 0.58 0.58 0.58 0.56 0.56 0.55 0.55 0.55 0.55 0.56 0.53 0.54 0.55 0.50 0.44Lingcod 0.52 0.53 0.52 0.72 0.59 0.54 0.58 0.64 0.68 1.07 1.57 1.53 1.44 1.32 1.24 1.21 1.30 1.44 1.44 1.46 1.19 1.13 1.17 1.27 1.69 1.53 1.35Arrowtooth flounder 0.21 0.21 0.20 0.28 0.17 0.19 0.16 0.17 0.15 0.14 0.16 0.17 0.16 0.15 0.13 0.13 0.12 0.12 0.11 0.11 0.11 0.13 0.12 0.10 0.10 0.10 0.10Dover sole 0.51 0.48 0.50 0.59 0.49 0.50 0.46 0.53 0.46 0.48 0.50 0.49 0.49 0.48 0.46 0.46 0.44 0.43 0.38 0.35 0.46 0.47 0.49 0.49 0.48 0.46 0.44English sole 0.68 0.68 0.66 0.77 0.65 0.54 0.50 0.56 0.48 0.48 0.48 0.47 0.45 0.44 0.40 0.38 0.37 0.36 0.33 0.34 0.35 0.37 0.33 0.33 0.32 0.33 0.32Petrale sole 1.23 1.47 1.45 1.56 1.47 1.35 1.25 1.47 1.35 1.36 1.33 1.21 1.32 1.29 1.13 1.20 1.12 1.11 1.00 1.26 1.59 1.63 1.33 1.15 1.25 1.23 1.18Cod, Pacific 0.50 0.52 0.50 0.62 0.46 0.49 0.52 0.59 0.58 0.64 0.79 0.77 0.78 0.61 0.57 0.59 0.62 0.62 0.52 0.56 0.63 0.65 0.60 0.56 0.62 0.61 0.60Whiting, Pacific 0.163 0.137 0.176 0.161 0.132 0.077 0.048 0.073 0.064 0.057 0.047 0.060 0.059 0.045 0.065 0.078 0.093 0.141 0.079 0.107 0.128 0.154 0.135 0.118 0.083 0.089 0.082Sardines - - - - - - - - - 0.071 0.078 0.075 0.069 0.078 0.077 0.060 0.059 0.132 0.131 0.132 0.150 0.106 0.117 0.216 0.179 - -Halibut, Pacific 2.48 2.30 1.94 2.94 2.50 3.08 2.04 2.61 2.68 2.82 2.58 2.55 3.30 3.24 3.09 3.67 4.06 4.28 3.26 4.53 5.93 5.35 5.11 5.92 5.57 5.72 5.22Sturgeon, white 2.43 2.40 2.89 3.16 3.39 3.23 2.14 2.64 1.56 1.91 2.36 2.12 2.25 2.24 2.17 2.41 2.46 2.44 2.22 2.35 2.81 2.90 3.40 3.69 3.34 4.13 3.44Sea urchin, red - - - 0.54 0.61 1.24 1.37 1.21 0.79 0.81 0.86 0.57 0.55 0.47 0.37 0.46 0.43 0.43 0.52 0.60 0.59 0.62 0.60 0.59 0.60 0.62 1.29
Notes: 1. Annual prices are in 2017 dollars. Adjustment used GDP implicit price deflator developed by U.S. Bureau of Economic Analysis.2. Prices are for onshore landings. There will be differences for the same species, such as Pacific whiting, when delivered offshore. Landings after 1980, other than inriver Chinook and coho, exclude harvests from research,
discards, bait, personal use, seized, overages, live for aquariums, and unspecified disposition.3. Prices are for round pound equivalents, except for troll Chinook and troll coho prior to 1981 which are based on dressed weight.4. Prices where landings are less than $500 annually are shown with a dash.5. Inriver salmon prices include Oregon and Washington side landings. Inriver steelhead includes only Oregon side in 2017.6. The nearshore live groundfish fishery includes seven indicator species that are typically landed live in Oregon. These include cabezon, lingcod, black and blue rockfish, greenling, and other unspecified rockfish (not
uniquely identified on a fish ticket).Source: Oregon Department of Fish and Wildlife for years prior to 1981. PacFIN March 2008, April 2009, March 2010, July 2011, April 2013, March 2014, April 2015, November 2016, March 2017, and June 2018 extractions for 1981
to 2017. PFMC "Review of Ocean Salmon Fisheries," annual in February, for inriver Chinook and coho.
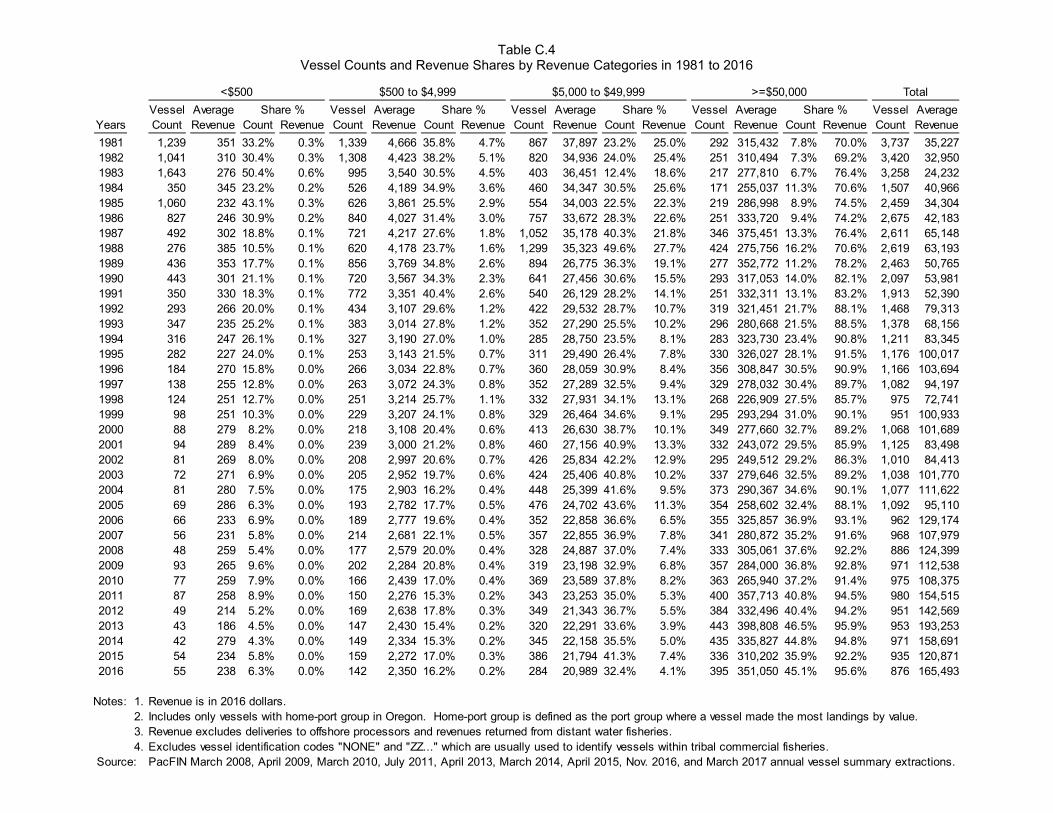
Table C.4 Vessel Counts and Revenue Shares by Revenue Categories in 1981 to 2016
<$500 $500 to $4,999 $5,000 to $49,999 >=$50,000 Total
Vessel Average Share % Vessel Average Share % Vessel Average Share % Vessel Average Share % Vessel AverageYears Count Revenue Count Revenue Count Revenue Count Revenue Count Revenue Count Revenue Count Revenue Count Revenue Count Revenue
1981 1,239 351 33.2% 0.3% 1,339 4,666 35.8% 4.7% 867 37,897 23.2% 25.0% 292 315,432 7.8% 70.0% 3,737 35,2271982 1,041 310 30.4% 0.3% 1,308 4,423 38.2% 5.1% 820 34,936 24.0% 25.4% 251 310,494 7.3% 69.2% 3,420 32,9501983 1,643 276 50.4% 0.6% 995 3,540 30.5% 4.5% 403 36,451 12.4% 18.6% 217 277,810 6.7% 76.4% 3,258 24,2321984 350 345 23.2% 0.2% 526 4,189 34.9% 3.6% 460 34,347 30.5% 25.6% 171 255,037 11.3% 70.6% 1,507 40,9661985 1,060 232 43.1% 0.3% 626 3,861 25.5% 2.9% 554 34,003 22.5% 22.3% 219 286,998 8.9% 74.5% 2,459 34,3041986 827 246 30.9% 0.2% 840 4,027 31.4% 3.0% 757 33,672 28.3% 22.6% 251 333,720 9.4% 74.2% 2,675 42,1831987 492 302 18.8% 0.1% 721 4,217 27.6% 1.8% 1,052 35,178 40.3% 21.8% 346 375,451 13.3% 76.4% 2,611 65,1481988 276 385 10.5% 0.1% 620 4,178 23.7% 1.6% 1,299 35,323 49.6% 27.7% 424 275,756 16.2% 70.6% 2,619 63,1931989 436 353 17.7% 0.1% 856 3,769 34.8% 2.6% 894 26,775 36.3% 19.1% 277 352,772 11.2% 78.2% 2,463 50,7651990 443 301 21.1% 0.1% 720 3,567 34.3% 2.3% 641 27,456 30.6% 15.5% 293 317,053 14.0% 82.1% 2,097 53,9811991 350 330 18.3% 0.1% 772 3,351 40.4% 2.6% 540 26,129 28.2% 14.1% 251 332,311 13.1% 83.2% 1,913 52,3901992 293 266 20.0% 0.1% 434 3,107 29.6% 1.2% 422 29,532 28.7% 10.7% 319 321,451 21.7% 88.1% 1,468 79,3131993 347 235 25.2% 0.1% 383 3,014 27.8% 1.2% 352 27,290 25.5% 10.2% 296 280,668 21.5% 88.5% 1,378 68,1561994 316 247 26.1% 0.1% 327 3,190 27.0% 1.0% 285 28,750 23.5% 8.1% 283 323,730 23.4% 90.8% 1,211 83,3451995 282 227 24.0% 0.1% 253 3,143 21.5% 0.7% 311 29,490 26.4% 7.8% 330 326,027 28.1% 91.5% 1,176 100,0171996 184 270 15.8% 0.0% 266 3,034 22.8% 0.7% 360 28,059 30.9% 8.4% 356 308,847 30.5% 90.9% 1,166 103,6941997 138 255 12.8% 0.0% 263 3,072 24.3% 0.8% 352 27,289 32.5% 9.4% 329 278,032 30.4% 89.7% 1,082 94,1971998 124 251 12.7% 0.0% 251 3,214 25.7% 1.1% 332 27,931 34.1% 13.1% 268 226,909 27.5% 85.7% 975 72,7411999 98 251 10.3% 0.0% 229 3,207 24.1% 0.8% 329 26,464 34.6% 9.1% 295 293,294 31.0% 90.1% 951 100,9332000 88 279 8.2% 0.0% 218 3,108 20.4% 0.6% 413 26,630 38.7% 10.1% 349 277,660 32.7% 89.2% 1,068 101,6892001 94 289 8.4% 0.0% 239 3,000 21.2% 0.8% 460 27,156 40.9% 13.3% 332 243,072 29.5% 85.9% 1,125 83,4982002 81 269 8.0% 0.0% 208 2,997 20.6% 0.7% 426 25,834 42.2% 12.9% 295 249,512 29.2% 86.3% 1,010 84,4132003 72 271 6.9% 0.0% 205 2,952 19.7% 0.6% 424 25,406 40.8% 10.2% 337 279,646 32.5% 89.2% 1,038 101,7702004 81 280 7.5% 0.0% 175 2,903 16.2% 0.4% 448 25,399 41.6% 9.5% 373 290,367 34.6% 90.1% 1,077 111,6222005 69 286 6.3% 0.0% 193 2,782 17.7% 0.5% 476 24,702 43.6% 11.3% 354 258,602 32.4% 88.1% 1,092 95,1102006 66 233 6.9% 0.0% 189 2,777 19.6% 0.4% 352 22,858 36.6% 6.5% 355 325,857 36.9% 93.1% 962 129,1742007 56 231 5.8% 0.0% 214 2,681 22.1% 0.5% 357 22,855 36.9% 7.8% 341 280,872 35.2% 91.6% 968 107,9792008 48 259 5.4% 0.0% 177 2,579 20.0% 0.4% 328 24,887 37.0% 7.4% 333 305,061 37.6% 92.2% 886 124,3992009 93 265 9.6% 0.0% 202 2,284 20.8% 0.4% 319 23,198 32.9% 6.8% 357 284,000 36.8% 92.8% 971 112,5382010 77 259 7.9% 0.0% 166 2,439 17.0% 0.4% 369 23,589 37.8% 8.2% 363 265,940 37.2% 91.4% 975 108,3752011 87 258 8.9% 0.0% 150 2,276 15.3% 0.2% 343 23,253 35.0% 5.3% 400 357,713 40.8% 94.5% 980 154,5152012 49 214 5.2% 0.0% 169 2,638 17.8% 0.3% 349 21,343 36.7% 5.5% 384 332,496 40.4% 94.2% 951 142,5692013 43 186 4.5% 0.0% 147 2,430 15.4% 0.2% 320 22,291 33.6% 3.9% 443 398,808 46.5% 95.9% 953 193,2532014 42 279 4.3% 0.0% 149 2,334 15.3% 0.2% 345 22,158 35.5% 5.0% 435 335,827 44.8% 94.8% 971 158,6912015 54 234 5.8% 0.0% 159 2,272 17.0% 0.3% 386 21,794 41.3% 7.4% 336 310,202 35.9% 92.2% 935 120,8712016 55 238 6.3% 0.0% 142 2,350 16.2% 0.2% 284 20,989 32.4% 4.1% 395 351,050 45.1% 95.6% 876 165,493
Notes: 1. Revenue is in 2016 dollars.2. Includes only vessels with home-port group in Oregon. Home-port group is defined as the port group where a vessel made the most landings by value.3. Revenue excludes deliveries to offshore processors and revenues returned from distant water fisheries.4. Excludes vessel identification codes "NONE" and "ZZ..." which are usually used to identify vessels within tribal commercial fisheries.
Source: PacFIN March 2008, April 2009, March 2010, July 2011, April 2013, March 2014, April 2015, Nov. 2016, and March 2017 annual vessel summary extractions.
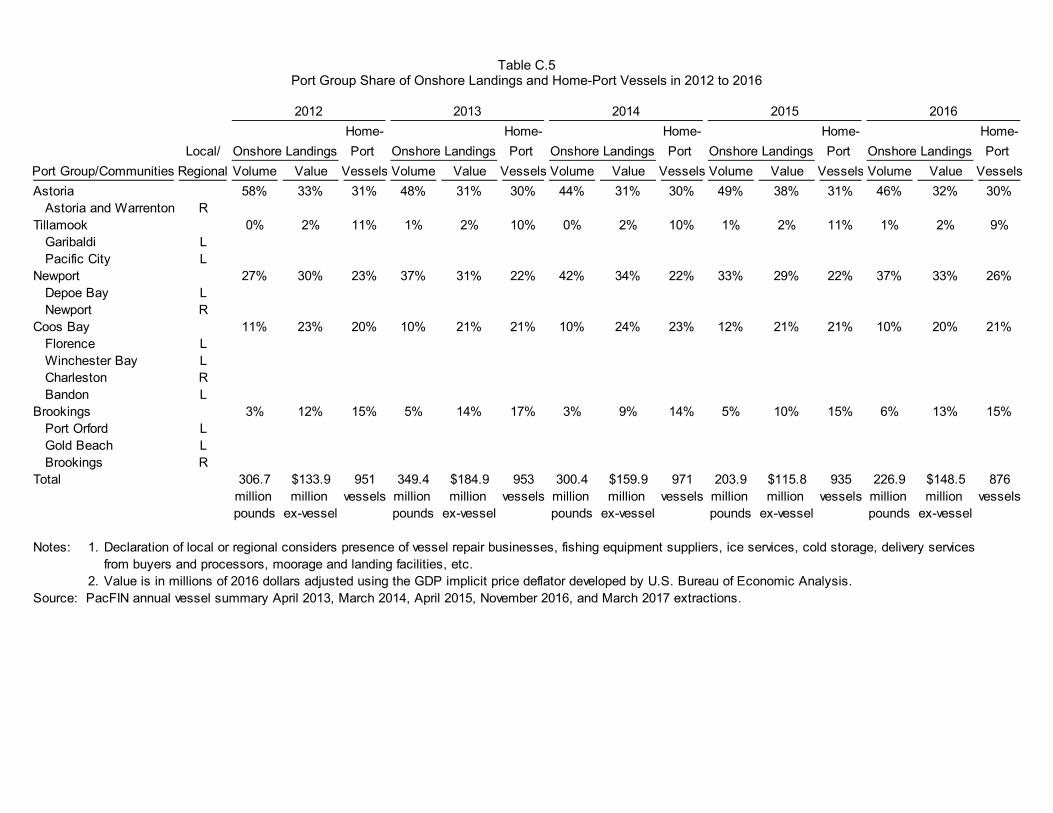
Table C.5
Port Group Share of Onshore Landings and Home-Port Vessels in 2012 to 2016
2012 2013 2014 2015 2016
Home- Home- Home- Home- Home-
Local/ Onshore Landings Port Onshore Landings Port Onshore Landings Port Onshore Landings Port Onshore Landings Port
Port Group/Communities Regional Volume Value Vessels Volume Value Vessels Volume Value Vessels Volume Value Vessels Volume Value Vessels
Astoria 58% 33% 31% 48% 31% 30% 44% 31% 30% 49% 38% 31% 46% 32% 30% Astoria and Warrenton RTillamook 0% 2% 11% 1% 2% 10% 0% 2% 10% 1% 2% 11% 1% 2% 9% Garibaldi L Pacific City LNewport 27% 30% 23% 37% 31% 22% 42% 34% 22% 33% 29% 22% 37% 33% 26% Depoe Bay L Newport RCoos Bay 11% 23% 20% 10% 21% 21% 10% 24% 23% 12% 21% 21% 10% 20% 21% Florence L Winchester Bay L Charleston R Bandon LBrookings 3% 12% 15% 5% 14% 17% 3% 9% 14% 5% 10% 15% 6% 13% 15% Port Orford L Gold Beach L Brookings RTotal 306.7 $133.9 951 349.4 $184.9 953 300.4 $159.9 971 203.9 $115.8 935 226.9 $148.5 876
million million vessels million million vessels million million vessels million million vessels million million vesselspounds ex-vessel pounds ex-vessel pounds ex-vessel pounds ex-vessel pounds ex-vessel
Notes: 1. Declaration of local or regional considers presence of vessel repair businesses, fishing equipment suppliers, ice services, cold storage, delivery services from buyers and processors, moorage and landing facilities, etc.
2. Value is in millions of 2016 dollars adjusted using the GDP implicit price deflator developed by U.S. Bureau of Economic Analysis.Source: PacFIN annual vessel summary April 2013, March 2014, April 2015, November 2016, and March 2017 extractions.
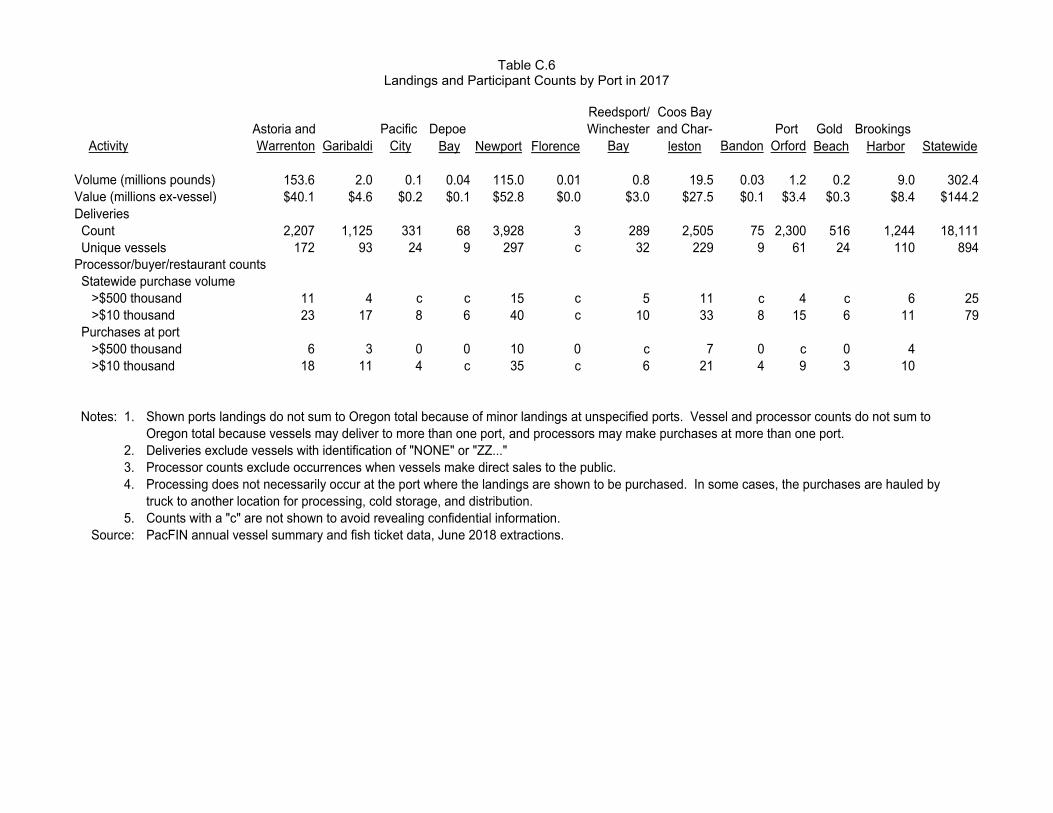
Table C.6
Landings and Participant Counts by Port in 2017
Reedsport/ Coos BayAstoria and Pacific Depoe Winchester and Char- Port Gold Brookings
Activity Warrenton Garibaldi City Bay Newport Florence Bay leston Bandon Orford Beach Harbor Statewide
Volume (millions pounds) 153.6 2.0 0.1 0.04 115.0 0.01 0.8 19.5 0.03 1.2 0.2 9.0 302.4Value (millions ex-vessel) $40.1 $4.6 $0.2 $0.1 $52.8 $0.0 $3.0 $27.5 $0.1 $3.4 $0.3 $8.4 $144.2Deliveries Count 2,207 1,125 331 68 3,928 3 289 2,505 75 2,300 516 1,244 18,111 Unique vessels 172 93 24 9 297 c 32 229 9 61 24 110 894Processor/buyer/restaurant counts Statewide purchase volume >$500 thousand 11 4 c c 15 c 5 11 c 4 c 6 25 >$10 thousand 23 17 8 6 40 c 10 33 8 15 6 11 79 Purchases at port >$500 thousand 6 3 0 0 10 0 c 7 0 c 0 4 >$10 thousand 18 11 4 c 35 c 6 21 4 9 3 10
Notes: 1. Shown ports landings do not sum to Oregon total because of minor landings at unspecified ports. Vessel and processor counts do not sum to Oregon total because vessels may deliver to more than one port, and processors may make purchases at more than one port.
2. Deliveries exclude vessels with identification of "NONE" or "ZZ..."3. Processor counts exclude occurrences when vessels make direct sales to the public.4. Processing does not necessarily occur at the port where the landings are shown to be purchased. In some cases, the purchases are hauled by
truck to another location for processing, cold storage, and distribution.5. Counts with a "c" are not shown to avoid revealing confidential information.
Source: PacFIN annual vessel summary and fish ticket data, June 2018 extractions.
Appendix D
Revenue Portfolios for Vessels Participating in the Nearshore
Groundfish Fishery
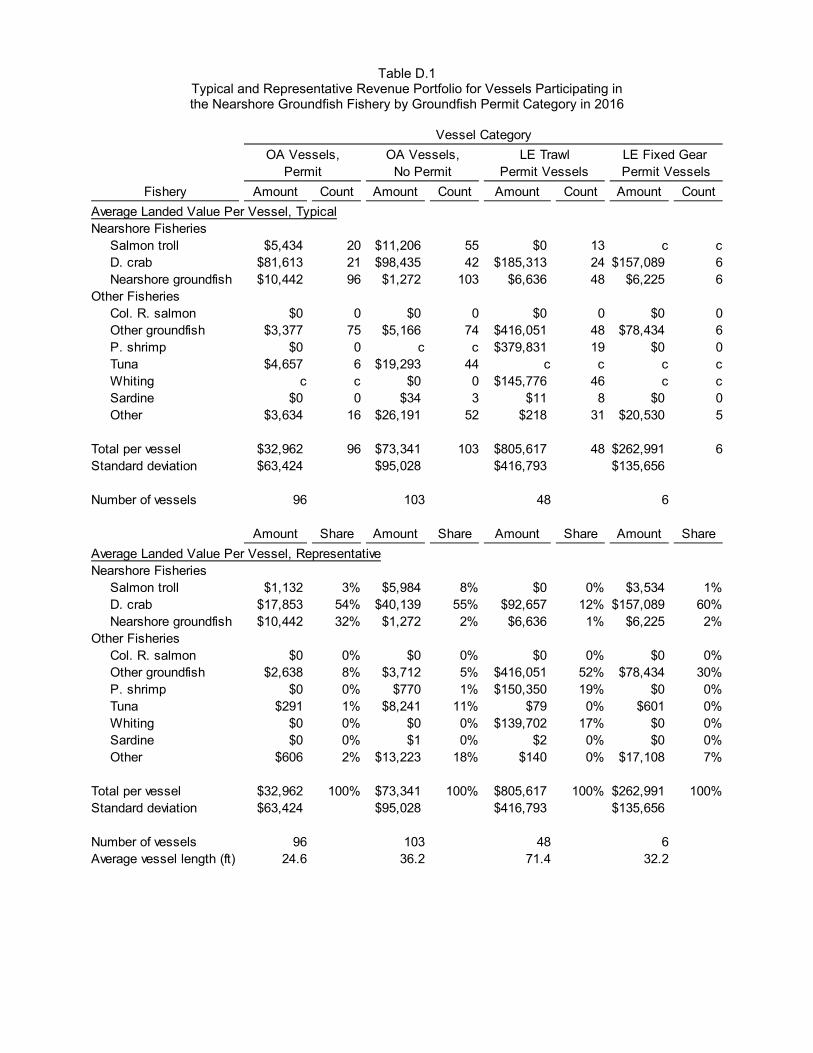
Table D.1 Typical and Representative Revenue Portfolio for Vessels Participating in the Nearshore Groundfish Fishery by Groundfish Permit Category in 2016
Vessel Category
OA Vessels, OA Vessels, LE Trawl LE Fixed Gear Permit No Permit Permit Vessels Permit Vessels
Fishery Amount Count Amount Count Amount Count Amount Count
Average Landed Value Per Vessel, TypicalNearshore Fisheries
Salmon troll $5,434 20 $11,206 55 $0 13 c cD. crab $81,613 21 $98,435 42 $185,313 24 $157,089 6Nearshore groundfish $10,442 96 $1,272 103 $6,636 48 $6,225 6
Other FisheriesCol. R. salmon $0 0 $0 0 $0 0 $0 0Other groundfish $3,377 75 $5,166 74 $416,051 48 $78,434 6P. shrimp $0 0 c c $379,831 19 $0 0Tuna $4,657 6 $19,293 44 c c c cWhiting c c $0 0 $145,776 46 c cSardine $0 0 $34 3 $11 8 $0 0Other $3,634 16 $26,191 52 $218 31 $20,530 5
Total per vessel $32,962 96 $73,341 103 $805,617 48 $262,991 6Standard deviation $63,424 $95,028 $416,793 $135,656
Number of vessels 96 103 48 6
Amount Share Amount Share Amount Share Amount Share
Average Landed Value Per Vessel, RepresentativeNearshore Fisheries
Salmon troll $1,132 3% $5,984 8% $0 0% $3,534 1%D. crab $17,853 54% $40,139 55% $92,657 12% $157,089 60%Nearshore groundfish $10,442 32% $1,272 2% $6,636 1% $6,225 2%
Other FisheriesCol. R. salmon $0 0% $0 0% $0 0% $0 0%Other groundfish $2,638 8% $3,712 5% $416,051 52% $78,434 30%P. shrimp $0 0% $770 1% $150,350 19% $0 0%Tuna $291 1% $8,241 11% $79 0% $601 0%Whiting $0 0% $0 0% $139,702 17% $0 0%Sardine $0 0% $1 0% $2 0% $0 0%Other $606 2% $13,223 18% $140 0% $17,108 7%
Total per vessel $32,962 100% $73,341 100% $805,617 100% $262,991 100%Standard deviation $63,424 $95,028 $416,793 $135,656
Number of vessels 96 103 48 6Average vessel length (ft) 24.6 36.2 71.4 32.2
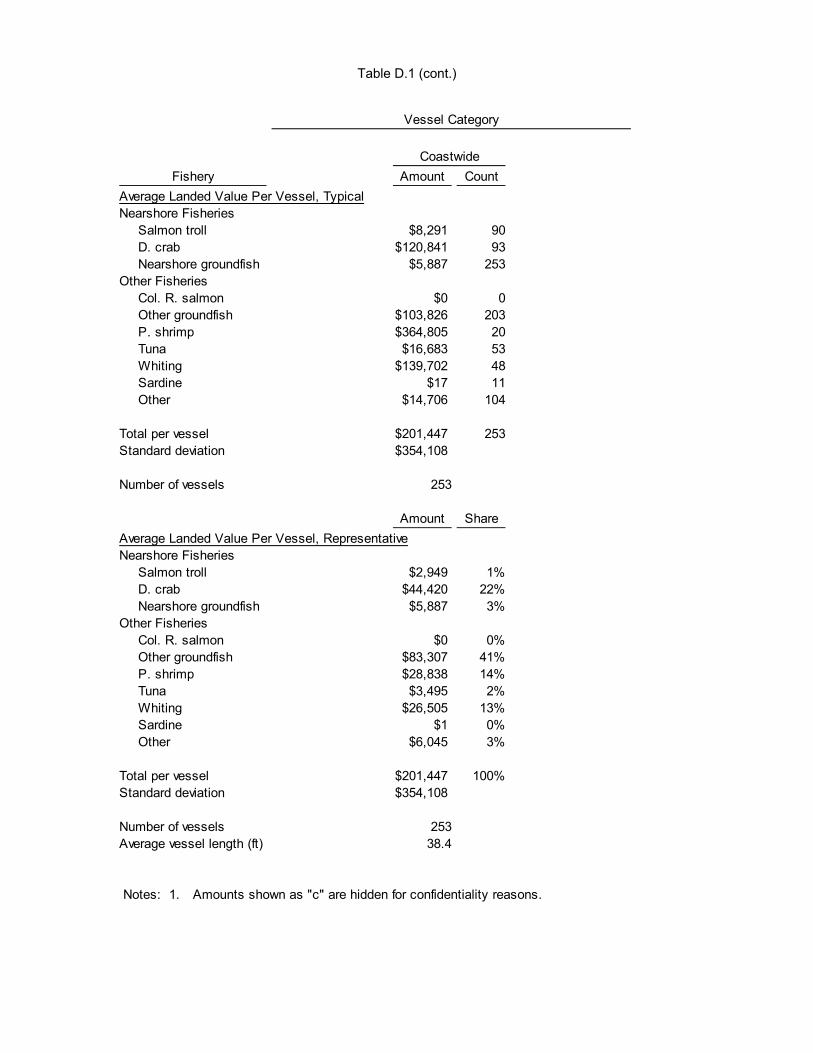
Table D.1 (cont.) Vessel Category
Coastwide
Fishery Amount Count
Average Landed Value Per Vessel, TypicalNearshore Fisheries
Salmon troll $8,291 90D. crab $120,841 93Nearshore groundfish $5,887 253
Other FisheriesCol. R. salmon $0 0Other groundfish $103,826 203P. shrimp $364,805 20Tuna $16,683 53Whiting $139,702 48Sardine $17 11Other $14,706 104
Total per vessel $201,447 253Standard deviation $354,108
Number of vessels 253
Amount Share
Average Landed Value Per Vessel, RepresentativeNearshore Fisheries
Salmon troll $2,949 1%D. crab $44,420 22%Nearshore groundfish $5,887 3%
Other FisheriesCol. R. salmon $0 0%Other groundfish $83,307 41%P. shrimp $28,838 14%Tuna $3,495 2%Whiting $26,505 13%Sardine $1 0%Other $6,045 3%
Total per vessel $201,447 100%Standard deviation $354,108
Number of vessels 253Average vessel length (ft) 38.4
Notes: 1. Amounts shown as "c" are hidden for confidentiality reasons.
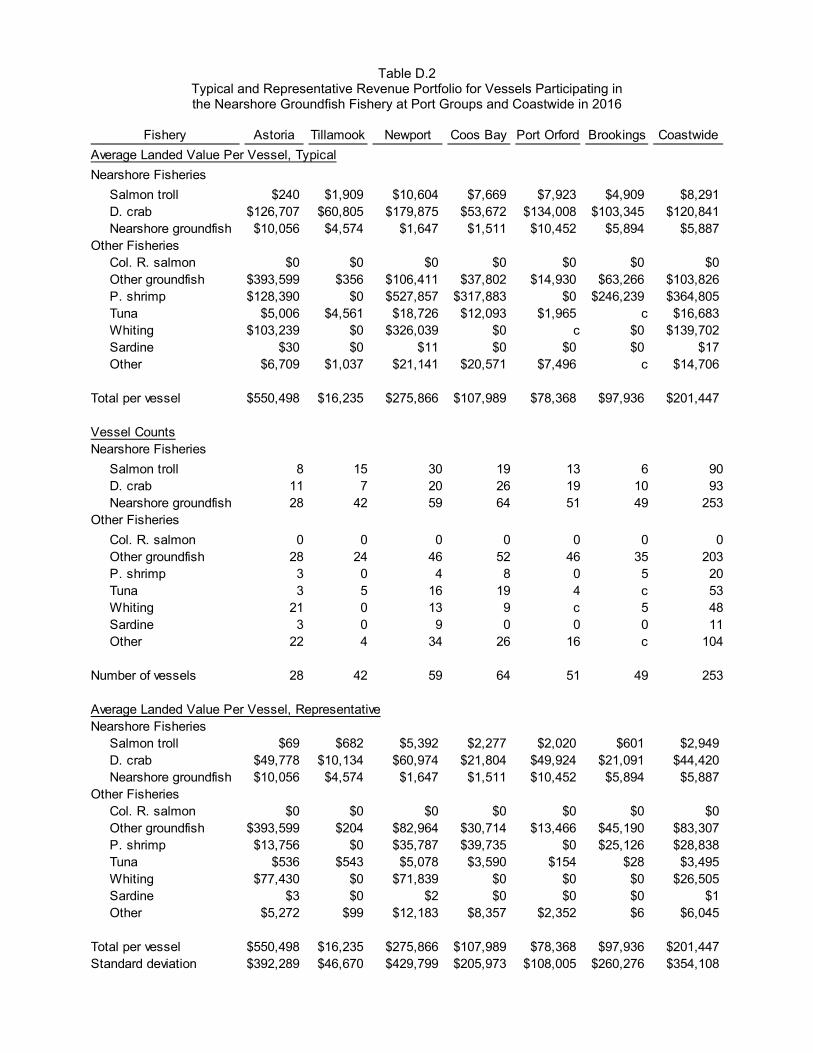
Table D.2 Typical and Representative Revenue Portfolio for Vessels Participating in the Nearshore Groundfish Fishery at Port Groups and Coastwide in 2016
Fishery Astoria Tillamook Newport Coos Bay Port Orford Brookings Coastwide
Average Landed Value Per Vessel, Typical
Nearshore Fisheries
Salmon troll $240 $1,909 $10,604 $7,669 $7,923 $4,909 $8,291D. crab $126,707 $60,805 $179,875 $53,672 $134,008 $103,345 $120,841Nearshore groundfish $10,056 $4,574 $1,647 $1,511 $10,452 $5,894 $5,887
Other FisheriesCol. R. salmon $0 $0 $0 $0 $0 $0 $0Other groundfish $393,599 $356 $106,411 $37,802 $14,930 $63,266 $103,826P. shrimp $128,390 $0 $527,857 $317,883 $0 $246,239 $364,805Tuna $5,006 $4,561 $18,726 $12,093 $1,965 c $16,683Whiting $103,239 $0 $326,039 $0 c $0 $139,702Sardine $30 $0 $11 $0 $0 $0 $17Other $6,709 $1,037 $21,141 $20,571 $7,496 c $14,706
Total per vessel $550,498 $16,235 $275,866 $107,989 $78,368 $97,936 $201,447
Vessel CountsNearshore Fisheries
Salmon troll 8 15 30 19 13 6 90D. crab 11 7 20 26 19 10 93Nearshore groundfish 28 42 59 64 51 49 253
Other Fisheries
Col. R. salmon 0 0 0 0 0 0 0Other groundfish 28 24 46 52 46 35 203P. shrimp 3 0 4 8 0 5 20Tuna 3 5 16 19 4 c 53Whiting 21 0 13 9 c 5 48Sardine 3 0 9 0 0 0 11Other 22 4 34 26 16 c 104
Number of vessels 28 42 59 64 51 49 253
Average Landed Value Per Vessel, RepresentativeNearshore Fisheries
Salmon troll $69 $682 $5,392 $2,277 $2,020 $601 $2,949D. crab $49,778 $10,134 $60,974 $21,804 $49,924 $21,091 $44,420Nearshore groundfish $10,056 $4,574 $1,647 $1,511 $10,452 $5,894 $5,887
Other FisheriesCol. R. salmon $0 $0 $0 $0 $0 $0 $0Other groundfish $393,599 $204 $82,964 $30,714 $13,466 $45,190 $83,307P. shrimp $13,756 $0 $35,787 $39,735 $0 $25,126 $28,838Tuna $536 $543 $5,078 $3,590 $154 $28 $3,495Whiting $77,430 $0 $71,839 $0 $0 $0 $26,505Sardine $3 $0 $2 $0 $0 $0 $1Other $5,272 $99 $12,183 $8,357 $2,352 $6 $6,045
Total per vessel $550,498 $16,235 $275,866 $107,989 $78,368 $97,936 $201,447Standard deviation $392,289 $46,670 $429,799 $205,973 $108,005 $260,276 $354,108
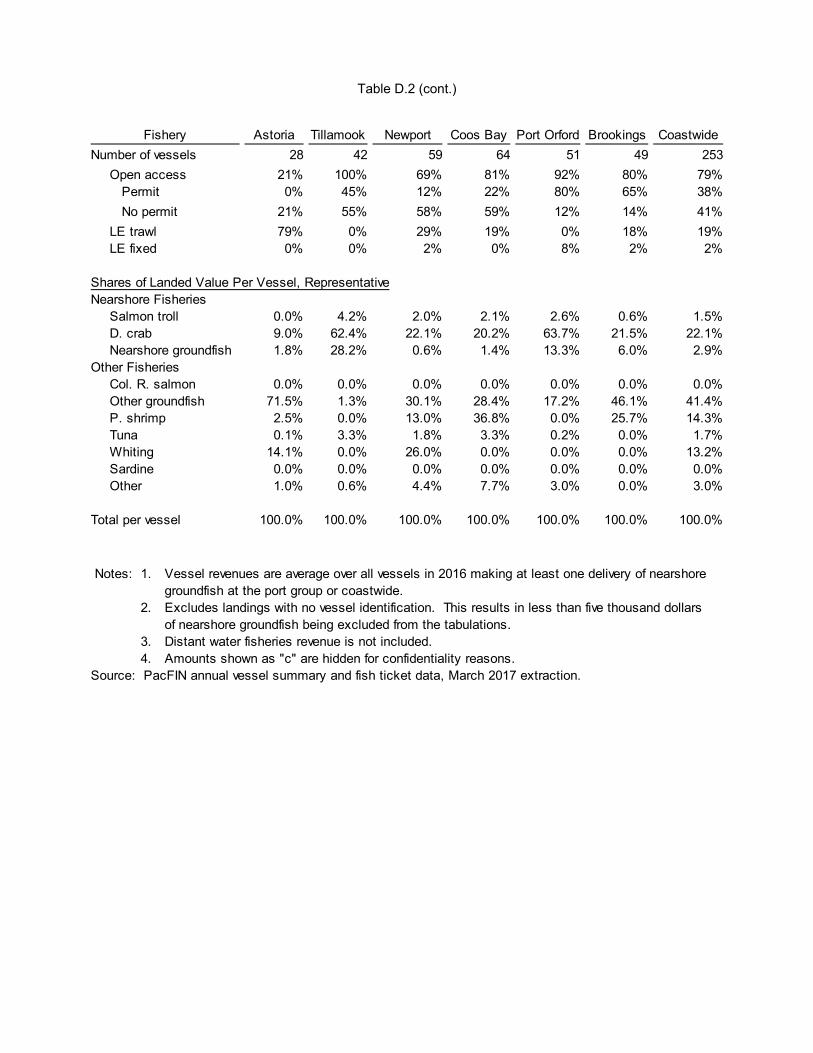
Table D.2 (cont.)
Fishery Astoria Tillamook Newport Coos Bay Port Orford Brookings Coastwide
Number of vessels 28 42 59 64 51 49 253
Open access 21% 100% 69% 81% 92% 80% 79% Permit 0% 45% 12% 22% 80% 65% 38%
No permit 21% 55% 58% 59% 12% 14% 41%
LE trawl 79% 0% 29% 19% 0% 18% 19%LE fixed 0% 0% 2% 0% 8% 2% 2%
Shares of Landed Value Per Vessel, RepresentativeNearshore Fisheries
Salmon troll 0.0% 4.2% 2.0% 2.1% 2.6% 0.6% 1.5%D. crab 9.0% 62.4% 22.1% 20.2% 63.7% 21.5% 22.1%Nearshore groundfish 1.8% 28.2% 0.6% 1.4% 13.3% 6.0% 2.9%
Other FisheriesCol. R. salmon 0.0% 0.0% 0.0% 0.0% 0.0% 0.0% 0.0%Other groundfish 71.5% 1.3% 30.1% 28.4% 17.2% 46.1% 41.4%P. shrimp 2.5% 0.0% 13.0% 36.8% 0.0% 25.7% 14.3%Tuna 0.1% 3.3% 1.8% 3.3% 0.2% 0.0% 1.7%Whiting 14.1% 0.0% 26.0% 0.0% 0.0% 0.0% 13.2%Sardine 0.0% 0.0% 0.0% 0.0% 0.0% 0.0% 0.0%Other 1.0% 0.6% 4.4% 7.7% 3.0% 0.0% 3.0%
Total per vessel 100.0% 100.0% 100.0% 100.0% 100.0% 100.0% 100.0%
Notes: 1. Vessel revenues are average over all vessels in 2016 making at least one delivery of nearshore groundfish at the port group or coastwide.
2. Excludes landings with no vessel identification. This results in less than five thousand dollars of nearshore groundfish being excluded from the tabulations.
3. Distant water fisheries revenue is not included.4. Amounts shown as "c" are hidden for confidentiality reasons.
Source: PacFIN annual vessel summary and fish ticket data, March 2017 extraction.
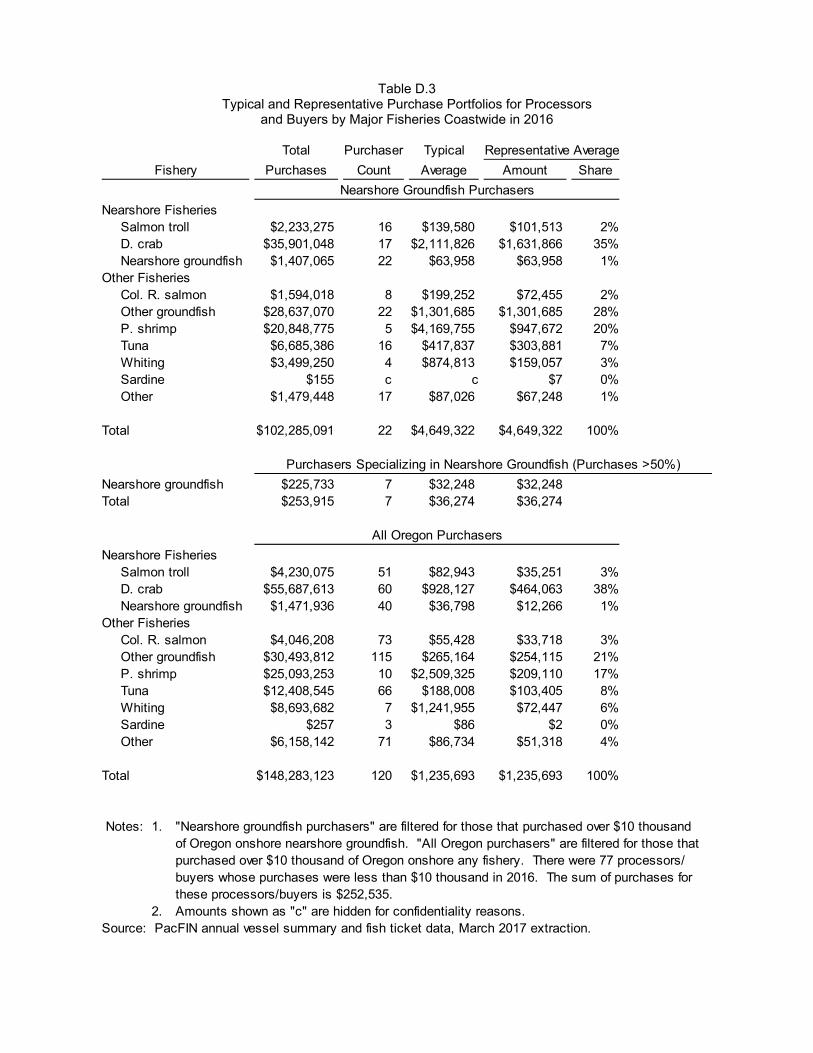
Table D.3
Typical and Representative Purchase Portfolios for Processors and Buyers by Major Fisheries Coastwide in 2016
Total Purchaser Typical Representative Average
Fishery Purchases Count Average Amount Share
Nearshore Groundfish Purchasers
Nearshore FisheriesSalmon troll $2,233,275 16 $139,580 $101,513 2%D. crab $35,901,048 17 $2,111,826 $1,631,866 35%Nearshore groundfish $1,407,065 22 $63,958 $63,958 1%
Other FisheriesCol. R. salmon $1,594,018 8 $199,252 $72,455 2%Other groundfish $28,637,070 22 $1,301,685 $1,301,685 28%P. shrimp $20,848,775 5 $4,169,755 $947,672 20%Tuna $6,685,386 16 $417,837 $303,881 7%Whiting $3,499,250 4 $874,813 $159,057 3%Sardine $155 c c $7 0%Other $1,479,448 17 $87,026 $67,248 1%
Total $102,285,091 22 $4,649,322 $4,649,322 100%
Purchasers Specializing in Nearshore Groundfish (Purchases >50%)
Nearshore groundfish $225,733 7 $32,248 $32,248Total $253,915 7 $36,274 $36,274
All Oregon Purchasers
Nearshore FisheriesSalmon troll $4,230,075 51 $82,943 $35,251 3%D. crab $55,687,613 60 $928,127 $464,063 38%Nearshore groundfish $1,471,936 40 $36,798 $12,266 1%
Other FisheriesCol. R. salmon $4,046,208 73 $55,428 $33,718 3%Other groundfish $30,493,812 115 $265,164 $254,115 21%P. shrimp $25,093,253 10 $2,509,325 $209,110 17%Tuna $12,408,545 66 $188,008 $103,405 8%Whiting $8,693,682 7 $1,241,955 $72,447 6%Sardine $257 3 $86 $2 0%Other $6,158,142 71 $86,734 $51,318 4%
Total $148,283,123 120 $1,235,693 $1,235,693 100%
Notes: 1. "Nearshore groundfish purchasers" are filtered for those that purchased over $10 thousand of Oregon onshore nearshore groundfish. "All Oregon purchasers" are filtered for those that purchased over $10 thousand of Oregon onshore any fishery. There were 77 processors/buyers whose purchases were less than $10 thousand in 2016. The sum of purchases for these processors/buyers is $252,535.
2. Amounts shown as "c" are hidden for confidentiality reasons.Source: PacFIN annual vessel summary and fish ticket data, March 2017 extraction.
Appendix E
Demographic and Well-Being Indicators at Port Groups
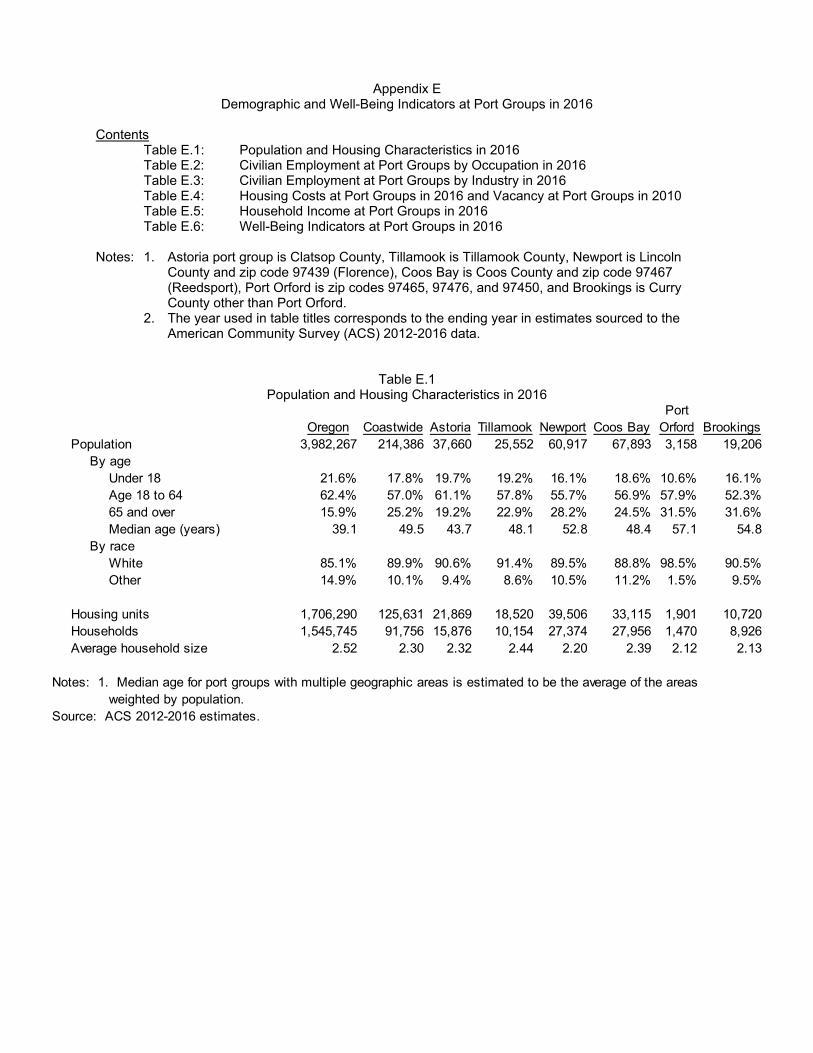
Appendix E
Demographic and Well-Being Indicators at Port Groups in 2016
Contents Table E.1: Population and Housing Characteristics in 2016 Table E.2: Civilian Employment at Port Groups by Occupation in 2016 Table E.3: Civilian Employment at Port Groups by Industry in 2016 Table E.4: Housing Costs at Port Groups in 2016 and Vacancy at Port Groups in 2010 Table E.5: Household Income at Port Groups in 2016 Table E.6: Well-Being Indicators at Port Groups in 2016
Notes: 1. Astoria port group is Clatsop County, Tillamook is Tillamook County, Newport is Lincoln
County and zip code 97439 (Florence), Coos Bay is Coos County and zip code 97467 (Reedsport), Port Orford is zip codes 97465, 97476, and 97450, and Brookings is Curry County other than Port Orford.
2. The year used in table titles corresponds to the ending year in estimates sourced to the American Community Survey (ACS) 2012-2016 data.
Table E.1 Population and Housing Characteristics in 2016
PortOregon Coastwide Astoria Tillamook Newport Coos Bay Orford Brookings
Population 3,982,267 214,386 37,660 25,552 60,917 67,893 3,158 19,206By age
Under 18 21.6% 17.8% 19.7% 19.2% 16.1% 18.6% 10.6% 16.1%Age 18 to 64 62.4% 57.0% 61.1% 57.8% 55.7% 56.9% 57.9% 52.3%65 and over 15.9% 25.2% 19.2% 22.9% 28.2% 24.5% 31.5% 31.6%Median age (years) 39.1 49.5 43.7 48.1 52.8 48.4 57.1 54.8
By raceWhite 85.1% 89.9% 90.6% 91.4% 89.5% 88.8% 98.5% 90.5%Other 14.9% 10.1% 9.4% 8.6% 10.5% 11.2% 1.5% 9.5%
Housing units 1,706,290 125,631 21,869 18,520 39,506 33,115 1,901 10,720Households 1,545,745 91,756 15,876 10,154 27,374 27,956 1,470 8,926Average household size 2.52 2.30 2.32 2.44 2.20 2.39 2.12 2.13
Notes: 1. Median age for port groups with multiple geographic areas is estimated to be the average of the areas weighted by population.
Source: ACS 2012-2016 estimates.
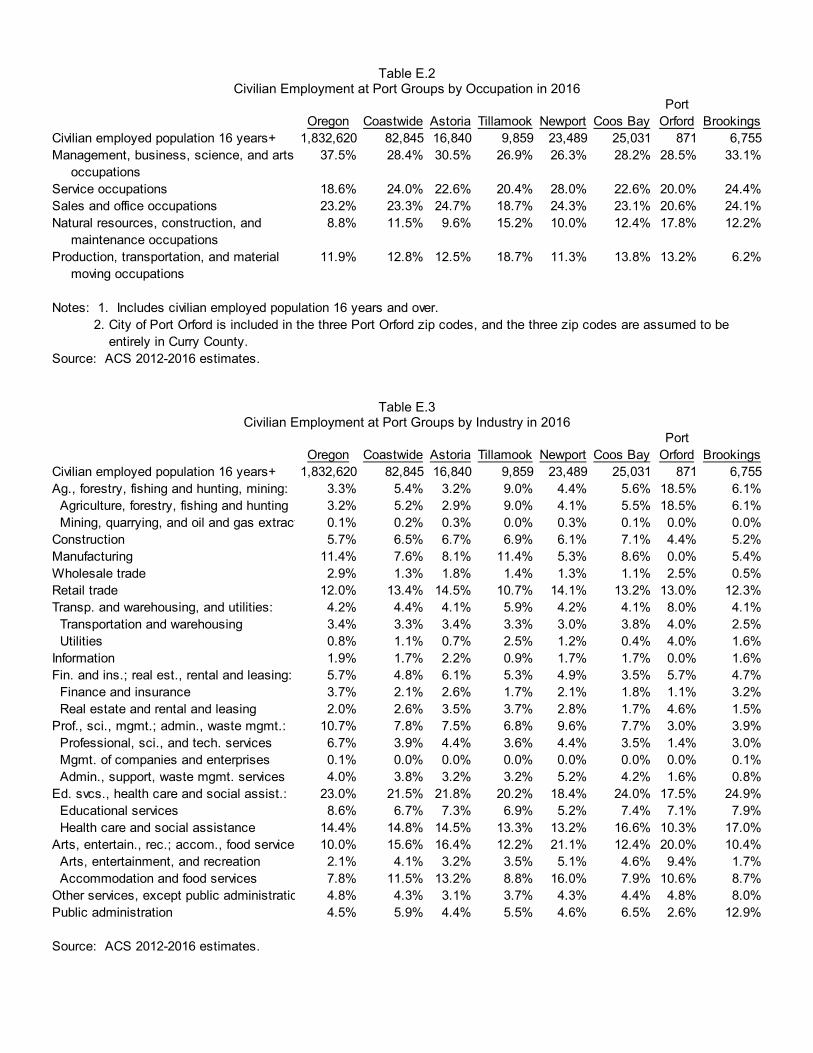
Table E.2 Civilian Employment at Port Groups by Occupation in 2016
PortOregon Coastwide Astoria Tillamook Newport Coos Bay Orford Brookings
Civilian employed population 16 years+ 1,832,620 82,845 16,840 9,859 23,489 25,031 871 6,755Management, business, science, and arts 37.5% 28.4% 30.5% 26.9% 26.3% 28.2% 28.5% 33.1%
occupationsService occupations 18.6% 24.0% 22.6% 20.4% 28.0% 22.6% 20.0% 24.4%Sales and office occupations 23.2% 23.3% 24.7% 18.7% 24.3% 23.1% 20.6% 24.1%Natural resources, construction, and 8.8% 11.5% 9.6% 15.2% 10.0% 12.4% 17.8% 12.2%
maintenance occupationsProduction, transportation, and material 11.9% 12.8% 12.5% 18.7% 11.3% 13.8% 13.2% 6.2%
moving occupations
Notes: 1. Includes civilian employed population 16 years and over. 2. City of Port Orford is included in the three Port Orford zip codes, and the three zip codes are assumed to be
entirely in Curry County.Source: ACS 2012-2016 estimates.
Table E.3 Civilian Employment at Port Groups by Industry in 2016
PortOregon Coastwide Astoria Tillamook Newport Coos Bay Orford Brookings
Civilian employed population 16 years+ 1,832,620 82,845 16,840 9,859 23,489 25,031 871 6,755Ag., forestry, fishing and hunting, mining: 3.3% 5.4% 3.2% 9.0% 4.4% 5.6% 18.5% 6.1% Agriculture, forestry, fishing and hunting 3.2% 5.2% 2.9% 9.0% 4.1% 5.5% 18.5% 6.1% Mining, quarrying, and oil and gas extract 0.1% 0.2% 0.3% 0.0% 0.3% 0.1% 0.0% 0.0%Construction 5.7% 6.5% 6.7% 6.9% 6.1% 7.1% 4.4% 5.2%Manufacturing 11.4% 7.6% 8.1% 11.4% 5.3% 8.6% 0.0% 5.4%Wholesale trade 2.9% 1.3% 1.8% 1.4% 1.3% 1.1% 2.5% 0.5%Retail trade 12.0% 13.4% 14.5% 10.7% 14.1% 13.2% 13.0% 12.3%Transp. and warehousing, and utilities: 4.2% 4.4% 4.1% 5.9% 4.2% 4.1% 8.0% 4.1% Transportation and warehousing 3.4% 3.3% 3.4% 3.3% 3.0% 3.8% 4.0% 2.5% Utilities 0.8% 1.1% 0.7% 2.5% 1.2% 0.4% 4.0% 1.6%Information 1.9% 1.7% 2.2% 0.9% 1.7% 1.7% 0.0% 1.6%Fin. and ins.; real est., rental and leasing: 5.7% 4.8% 6.1% 5.3% 4.9% 3.5% 5.7% 4.7% Finance and insurance 3.7% 2.1% 2.6% 1.7% 2.1% 1.8% 1.1% 3.2% Real estate and rental and leasing 2.0% 2.6% 3.5% 3.7% 2.8% 1.7% 4.6% 1.5%Prof., sci., mgmt.; admin., waste mgmt.: 10.7% 7.8% 7.5% 6.8% 9.6% 7.7% 3.0% 3.9% Professional, sci., and tech. services 6.7% 3.9% 4.4% 3.6% 4.4% 3.5% 1.4% 3.0% Mgmt. of companies and enterprises 0.1% 0.0% 0.0% 0.0% 0.0% 0.0% 0.0% 0.1% Admin., support, waste mgmt. services 4.0% 3.8% 3.2% 3.2% 5.2% 4.2% 1.6% 0.8%Ed. svcs., health care and social assist.: 23.0% 21.5% 21.8% 20.2% 18.4% 24.0% 17.5% 24.9% Educational services 8.6% 6.7% 7.3% 6.9% 5.2% 7.4% 7.1% 7.9% Health care and social assistance 14.4% 14.8% 14.5% 13.3% 13.2% 16.6% 10.3% 17.0%Arts, entertain., rec.; accom., food services 10.0% 15.6% 16.4% 12.2% 21.1% 12.4% 20.0% 10.4% Arts, entertainment, and recreation 2.1% 4.1% 3.2% 3.5% 5.1% 4.6% 9.4% 1.7% Accommodation and food services 7.8% 11.5% 13.2% 8.8% 16.0% 7.9% 10.6% 8.7%Other services, except public administratio 4.8% 4.3% 3.1% 3.7% 4.3% 4.4% 4.8% 8.0%Public administration 4.5% 5.9% 4.4% 5.5% 4.6% 6.5% 2.6% 12.9%
Source: ACS 2012-2016 estimates.
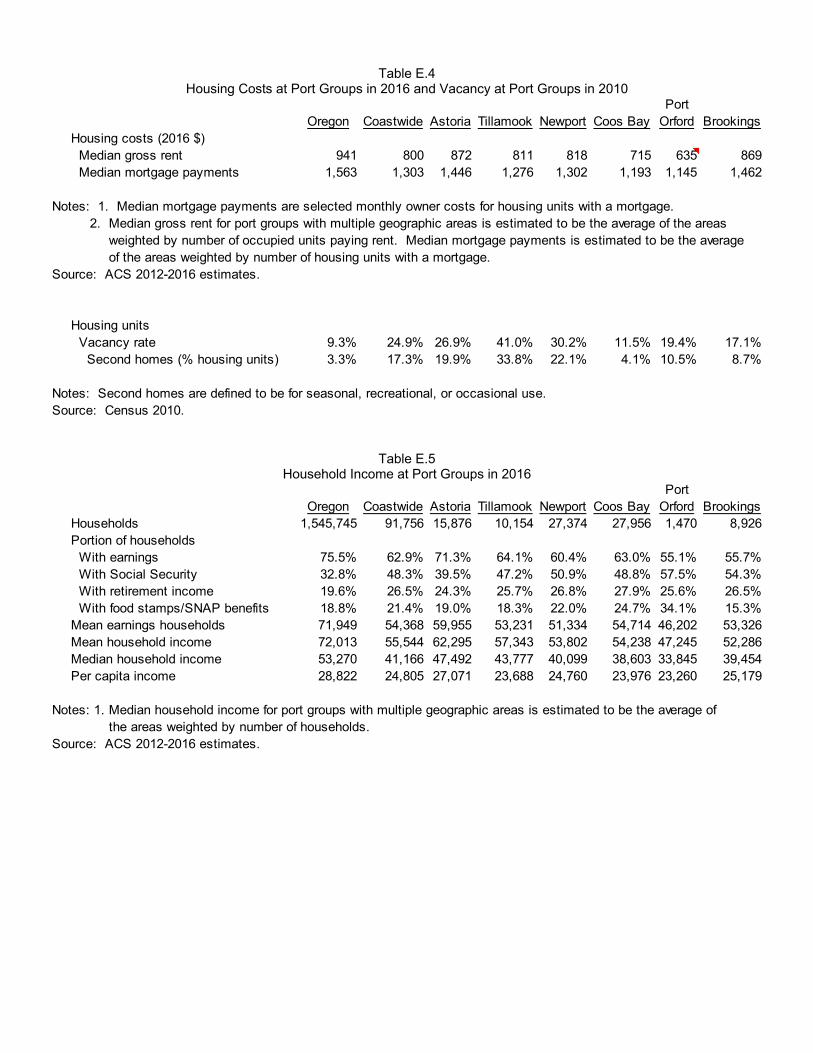
Table E.4 Housing Costs at Port Groups in 2016 and Vacancy at Port Groups in 2010
PortOregon Coastwide Astoria Tillamook Newport Coos Bay Orford Brookings
Housing costs (2016 $) Median gross rent 941 800 872 811 818 715 635 869 Median mortgage payments 1,563 1,303 1,446 1,276 1,302 1,193 1,145 1,462
Notes: 1. Median mortgage payments are selected monthly owner costs for housing units with a mortgage.2. Median gross rent for port groups with multiple geographic areas is estimated to be the average of the areas
weighted by number of occupied units paying rent. Median mortgage payments is estimated to be the average of the areas weighted by number of housing units with a mortgage.
Source: ACS 2012-2016 estimates.
Housing units Vacancy rate 9.3% 24.9% 26.9% 41.0% 30.2% 11.5% 19.4% 17.1% Second homes (% housing units) 3.3% 17.3% 19.9% 33.8% 22.1% 4.1% 10.5% 8.7%
Notes: Second homes are defined to be for seasonal, recreational, or occasional use.Source: Census 2010.
Table E.5 Household Income at Port Groups in 2016
PortOregon Coastwide Astoria Tillamook Newport Coos Bay Orford Brookings
Households 1,545,745 91,756 15,876 10,154 27,374 27,956 1,470 8,926Portion of households With earnings 75.5% 62.9% 71.3% 64.1% 60.4% 63.0% 55.1% 55.7% With Social Security 32.8% 48.3% 39.5% 47.2% 50.9% 48.8% 57.5% 54.3% With retirement income 19.6% 26.5% 24.3% 25.7% 26.8% 27.9% 25.6% 26.5% With food stamps/SNAP benefits 18.8% 21.4% 19.0% 18.3% 22.0% 24.7% 34.1% 15.3%Mean earnings households 71,949 54,368 59,955 53,231 51,334 54,714 46,202 53,326Mean household income 72,013 55,544 62,295 57,343 53,802 54,238 47,245 52,286Median household income 53,270 41,166 47,492 43,777 40,099 38,603 33,845 39,454Per capita income 28,822 24,805 27,071 23,688 24,760 23,976 23,260 25,179
Notes: 1. Median household income for port groups with multiple geographic areas is estimated to be the average of the areas weighted by number of households.
Source: ACS 2012-2016 estimates.
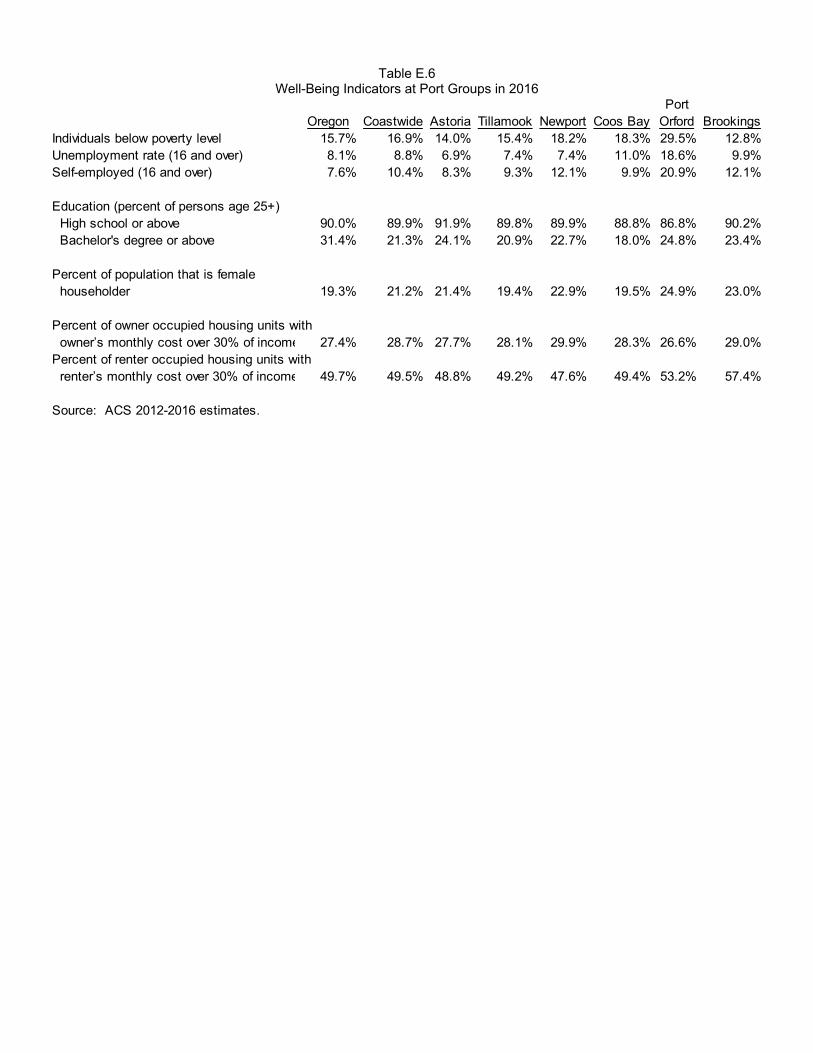
Table E.6 Well-Being Indicators at Port Groups in 2016
PortOregon Coastwide Astoria Tillamook Newport Coos Bay Orford Brookings
Individuals below poverty level 15.7% 16.9% 14.0% 15.4% 18.2% 18.3% 29.5% 12.8%Unemployment rate (16 and over) 8.1% 8.8% 6.9% 7.4% 7.4% 11.0% 18.6% 9.9%Self-employed (16 and over) 7.6% 10.4% 8.3% 9.3% 12.1% 9.9% 20.9% 12.1%
Education (percent of persons age 25+) High school or above 90.0% 89.9% 91.9% 89.8% 89.9% 88.8% 86.8% 90.2% Bachelor's degree or above 31.4% 21.3% 24.1% 20.9% 22.7% 18.0% 24.8% 23.4%
Percent of population that is female householder 19.3% 21.2% 21.4% 19.4% 22.9% 19.5% 24.9% 23.0%
Percent of owner occupied housing units with owner’s monthly cost over 30% of income 27.4% 28.7% 27.7% 28.1% 29.9% 28.3% 26.6% 29.0%Percent of renter occupied housing units with renter’s monthly cost over 30% of income 49.7% 49.5% 48.8% 49.2% 47.6% 49.4% 53.2% 57.4%
Source: ACS 2012-2016 estimates.
Top Related