


Languages
Pages
Legal


OREGON OREGONBICYCLE INDUSTRY
REGIONAL ECONOMIC SIGNIFICANCE
2014 2014 FEBRUARY
Prepared By: Dean Runyan Associates Inc.
Oregon Bicycle Industry Regional Economic Significance
19 February 2014
Prepared for the
Oregon Tourism Commission Salem, Oregon
Dean Runyan Associates, Inc. 833 SW 11th Avenue, Suite 920
Portland, Oregon 97205 (503) 226-2973 FAX 226-2984 www.deanrunyan.com
Cover photo credits: bikeportland.org, sustainablebusinessoregon.com, bikeschool.com, bikefriday.com, westernbikeworks.com
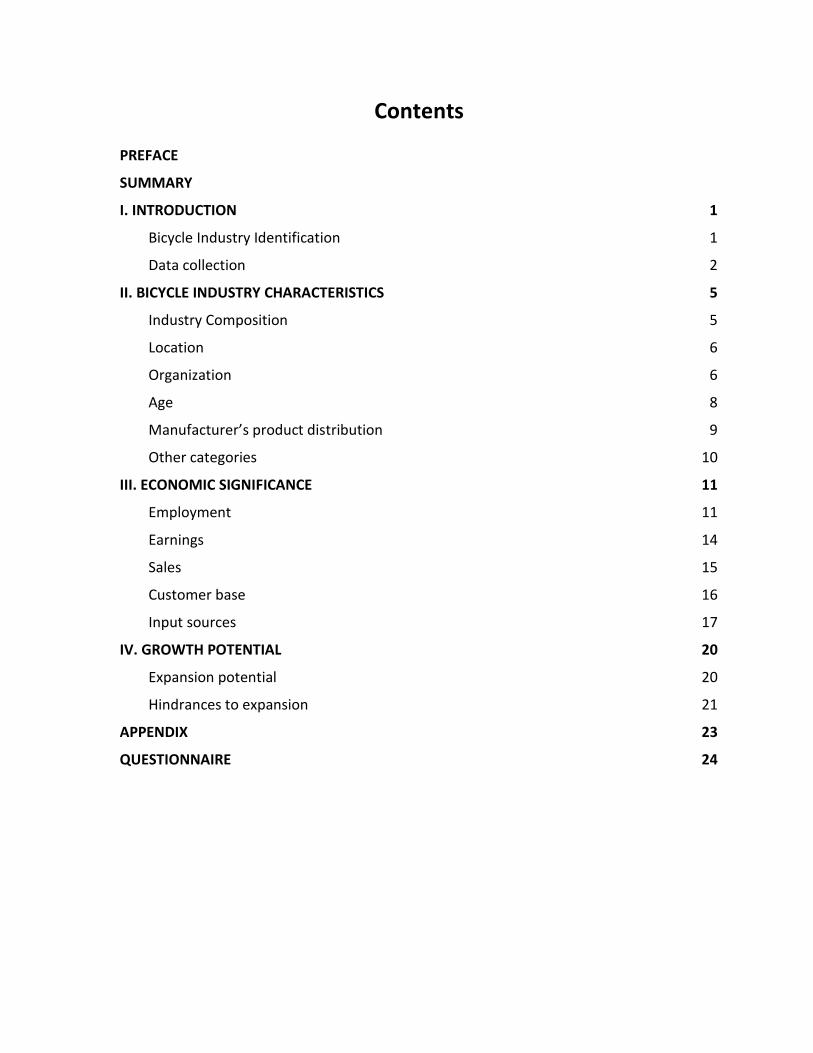
Contents
PREFACE
SUMMARY
I. INTRODUCTION 1
Bicycle Industry Identification 1
Data collection 2
II. BICYCLE INDUSTRY CHARACTERISTICS 5
Industry Composition 5
Location 6
Organization 6
Age 8
Manufacturer’s product distribution 9
Other categories 10
III. ECONOMIC SIGNIFICANCE 11
Employment 11
Earnings 14
Sales 15
Customer base 16
Input sources 17
IV. GROWTH POTENTIAL 20
Expansion potential 20
Hindrances to expansion 21
APPENDIX 23
QUESTIONNAIRE 24
Preface This research would not have been possible without the generous financial support of Bikes Belong and Cycle Oregon. Travel Oregon provided oversight for the project and valuable review and recommendations throughout. In addition, several organizations provided valuable support of the data collection process, including the Bicycle Transportation Alliance, Oregon Bicycle Constructors Association, Oregon Bicycle Racing Association and the Portland Transportation Bureau. Our special thanks also goes out to the many shops, manufacturers and other members of the bicycle industry that provided the data necessary to complete the research.
Summary Bicycling and the bicycle industry are iconic in Oregon, representing a unique aspect of the state’s identity and economy. Because many bicycle industry businesses are small, and government statistics include bicycle manufacturing and other businesses only as part of larger categories, specific industry information is limited. This study provides basic data for the bicycle industry in Oregon, including its size and geographic distribution, the nature of its businesses, and their sales, employment and earnings. For analysis purposes the industry is broken out into the following categories:
Manufacturing Wholesale/Distribution Bicycle retail/service Sporting goods retail
Big box retail Tour operation Event promotion, event services Industry representation
Industry Characteristics
Retail/service businesses amount to over 400 outlets, including over 200 bike shops; Manufacturers total about 90
About half of all bicycle industry businesses and organizations are located in the Portland Metropolitan Area; the Willamette Valley, Southern and Central Oregon are the next most significant
Many bicycle industry businesses and organizations are relatively young – nearly two thirds opened since the year 2000; Manufacturers are the youngest on average, and retail and service business the oldest
Economic Significance
The Oregon bicycle industry provides 2,645 jobs, counting both full and part-time employees as well as business owners that work in their businesses
The majority of bicycle business and organization employment is located in the Portland metro area or the Willamette Valley, followed by Central and Southern Oregon
Manufacturing and distribution employment in particular is located in the Portland metro area, with much of the remainder located in the Willamette Valley
An analysis of bicycle industry employment density shows that Central Oregon is the leader, followed by the Portland metro area and the Gorge/Mt Hood region
Total 2012 bicycle industry earnings estimated by this study amount to $83.3 million; Manufacturing/Distribution and Retail/Service are the largest categories
Total 2012 bicycle industry sales amounted to $440 million, with the largest portions represented by Retail/Service establishments and Manufacturing/Distribution businesses
Bicycle industry manufacturers sell only about 22% of their output in the local area, and export about 53% to other US locations and another 15% outside the US
Growth Potential
Nearly a third of manufacturing/distribution businesses report “Substantial” opportunities for expansion; retail businesses are more moderately optimistic
The three most important hindrances to business expansion are “Overall economic conditions,” “Competition” and “Can’t get adequate funding.” About a quarter report no hindrances to their expansion

1
I. Introduction Bicycling and the bicycle industry are iconic in Oregon, representing a unique aspect of the state’s identity and economy. Bicycling and bicycle enthusiasts are targets for the state’s travel promotions, associated with the state’s desirable quality of life. In addition, the bicycle industry, as part of the outdoor gear and activewear industry segment, is one of the state’s and City of Portland’s economic development priorities. Specific economic information for Oregon’s bicycle industry is limited however. Many bicycle industry businesses are small, and government statistics include bicycle manufacturing and other businesses only as part of larger categories. While some data are available at the national level on bicycle retail and service, specific figures for Oregon are limited due to small sample sizes. This study provides basic data for the bicycle industry in Oregon, including its size and geographic distribution, the natures of its businesses, and their sales, employment and earnings. Because a survey was utilized for data collection, other aspects of the industry could be investigated as well, such as business intentions and hindrances to growth. Bicycle Industry Identification For purposes of this research it is necessary to identify those business and organizations that represent the industrial categories used to define the “bicycle Industry” in Oregon. The focus here is on businesses and organizations that directly involve bicycle manufacturing, sales, service, and use for a bicycle-specific activity. Organizations that represent various segments of these businesses for marketing or public relations purposes are also included. Government units, such as bicycle advocacy offices or transportation pools that include bicycles, are not included. The categories employed are as follows:
Manufacturing
Bicycles, components, tools, painting, clothing, accessories
Wholesale/Distribution
Including importing
Retail/Service
Sales, repair; includes specialized shops as well as retailers that sell bicycles in addition to other items
Tour operation
Paid group rides, travel or tours that include bicycle events
Event promotion, event services
Bicycle races, shows, other short-term activities or events
Industry representation
Bicycle oriented lobbying, public relations, marketing, member services
2
Other Includes certain bicycle-related services and ancillary
products For purposes of some data analysis the Manufacturing and Wholesale/Distribution categories are combined, as well as the Tour Operation and Event Promotion categories. For the former, survey findings indicated that the distinction between manufacturing and distribution is sometime difficult to discern – some companies report that they contract for some or all of their manufacturing out-of-state (including overseas) and function within the state largely as a distributor. Others may manufacture some items (which they also distribute) but in addition include other product lines for which they serve just as distributors. The distinction between tour operation and event promotion was also difficult to make, for example when some respondents report that they promote bicycle tours but classified their activity in the survey as event promotion. In addition the number of businesses in these categories is small, so combining the responses improved the size of the category. Data collection The research makes use of data from a variety of sources, including a bicycle industry inventory database assembled for purposes of characterizing the industry in Oregon, and a survey that gathered data not available from any other source. Bicycle industry database An inventory was assembled of all businesses and organizations in the categories above that have a business location in Oregon, including both for-profit and not-for-profit entities. Government agency or agency components are not included. Similarly, companies or organizations that are active in the state but do not have a business location here, such as certain tour companies, distributors and advocacy organizations, are not included. Data were assembled from a number of sources, including:
Membership and contact lists provided by the Bicycle Transportation Alliance The Oregon Bicycle Constructors Association’s member list The Bicycle Retailer & Industry News 2013 Industry Directory Mountain Zone’s online list of bicycle shops The Portland Transportation Bureau’s online list of bicycle shops The Interbike trade show’s list of attending retailers The bike shop inventory from RideOregonRide.com Company-specific listings for multi-location companies, Big Box and Sporting Goods
outlets in particular
3
Web based research covering all regions of Oregon, including online listings such as Yelp, Manta and Yellowpages
The database includes a street address as well as an email address, if available. The former is used to establish the location of the business or organization with respect to the geographic regions of the state. The resulting database is used to represent the bicycle industry in Oregon as of early 2013. Entries total 542 businesses and organizations, counting each outlet of multiple outlet businesses separately in the region in which it is located. Industry survey A survey was used to gather descriptive data on the industry as well as selected trends, perceptions and attitudes of industry members. The survey sample consisted of all businesses and organizations in the database other than sporting goods stores and big box retailers, which were contacted separately. A self-administered questionnaire was prepared and reviewed in draft with Travel Oregon staff, representatives of the Bicycle Transportation Alliance and the Oregon Bicycle Constructors Association, and several Portland-area business owners, then formatted on Survey Monkey for direct access by the sample. A copy of the questionnaire is included in the Appendix. An introduction letter and request to participate – with the associated link – was prepared and distributed by email to all those in the database for which an email address was available. A letter including a link was sent to the remainder via mail. In both cases the Travel Oregon letterhead was used. In addition the letter and link were provided to several bicycle membership and advocacy organizations for inclusion in their newsletters and other distributions. A sample of sporting goods stores was contacted by telephone and asked a portion of the questions on the questionnaire, focusing primarily on the data necessary for the economic analysis. Locally owned sporting goods stores are reasonably well represented in the data. Attempts to gather data representing stores owned outside Oregon, such as Big 5 and Dicks Sporting Goods, were only partially successful – corporate offices were unwilling to provide data and only a portion of Oregon outlets would provide summary information. Employment and other estimates were made for this research on the basis of the data available. Good data were generously provided by REI. Attempts to gather data from either local outlets or corporate offices of large mass market and discount retailers (“Big Box” outlets) were unsuccessful. For these businesses information provided by GDS, a data services firm familiar with the bicycle industry, was used to prepare estimates.

4
The survey sample for the email and mailed businesses and organizations amounted to 325 businesses and organizations. Respondents total 132, representing an overall response rate of 40.6%. Data gathered by telephone and from industry sources is used to represent sporting goods and big box retailers and is in addition to these amounts. Other data for the research were gathered from US Census and Oregon agency sources.
5
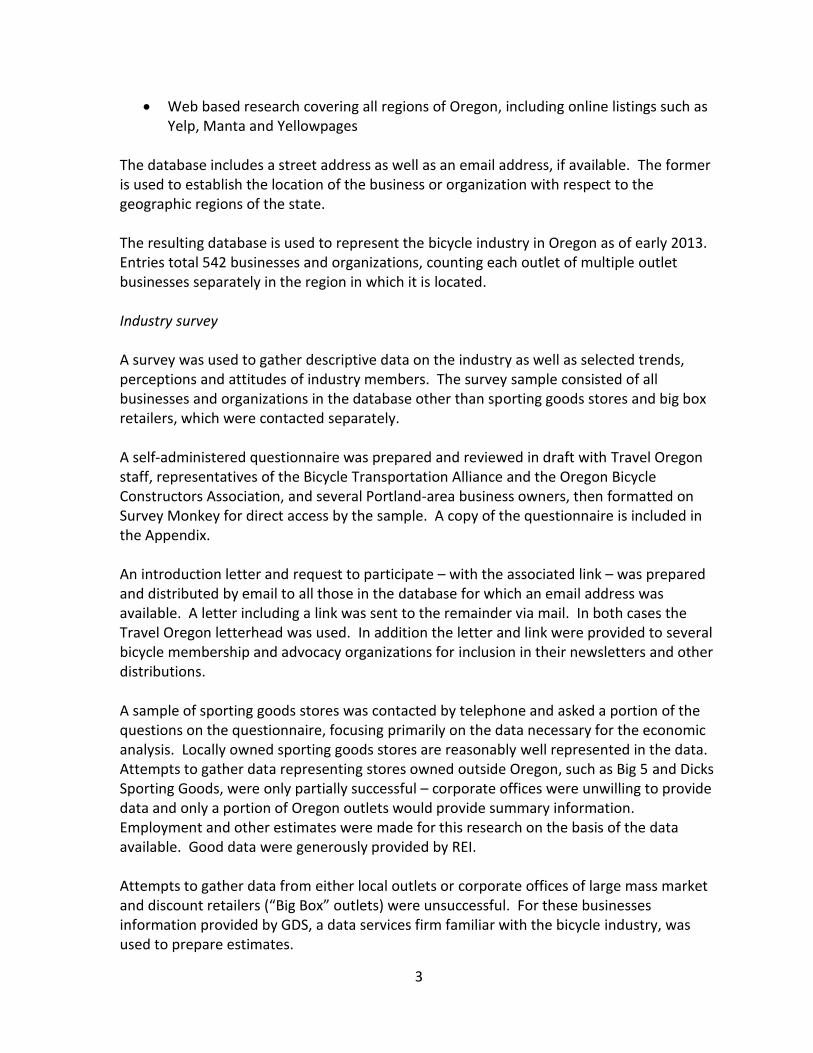
II. Bicycle Industry Characteristics Industry Composition Retail/Service businesses are the largest component of the Oregon bicycle industry, totaling over 400 outlets throughout the state. The list includes over 200 bike shops and similar businesses plus a number of big box and sporting goods establishments. See Figure II-1. Manufacturers total about 90, followed by smaller numbers in the other categories.
Figure II-1 Oregon Bicycle Industry Composition
4
7111214
7189
121213
0 50 100 150 200 250
DistributionEventsOtherTours
OutreachSporting GoodsManufacturing
Big Box RetailRetail/ Service
Number Businesses, Organizations
For this inventory, those outlets that sell primarily bicycles, components, accessories, clothing etc., and which may provide bicycle service are placed in the Retail/Service category. Those businesses that sell or service bicycles as well as other items are placed in the Sporting Goods category, unless they are a major mass retailer that sells bicycles and bicycle-related items, in which case they are considered Big Box retailers. For example, Costco, Fred Meyer, Kmart, Wal-Mart, Target and Toys R Us are in this category. Tour and Event Promotion companies are shown separately here – as classified for purposes of the business and organization inventory – but are combined for subsequent survey data analysis. Mass market retailers are an important consideration in that they tend to sell many of the children’s and low cost bicycles that are available on the market, and also sell accessories. According to recent National Association of Bicycle Dealers data, of all bicycles sold, about 70% have wheels 20 inches or larger, a common definition of a youth or adult bicycle. The remainder is primarily for young children and most often are sold at mass market establishments.
6
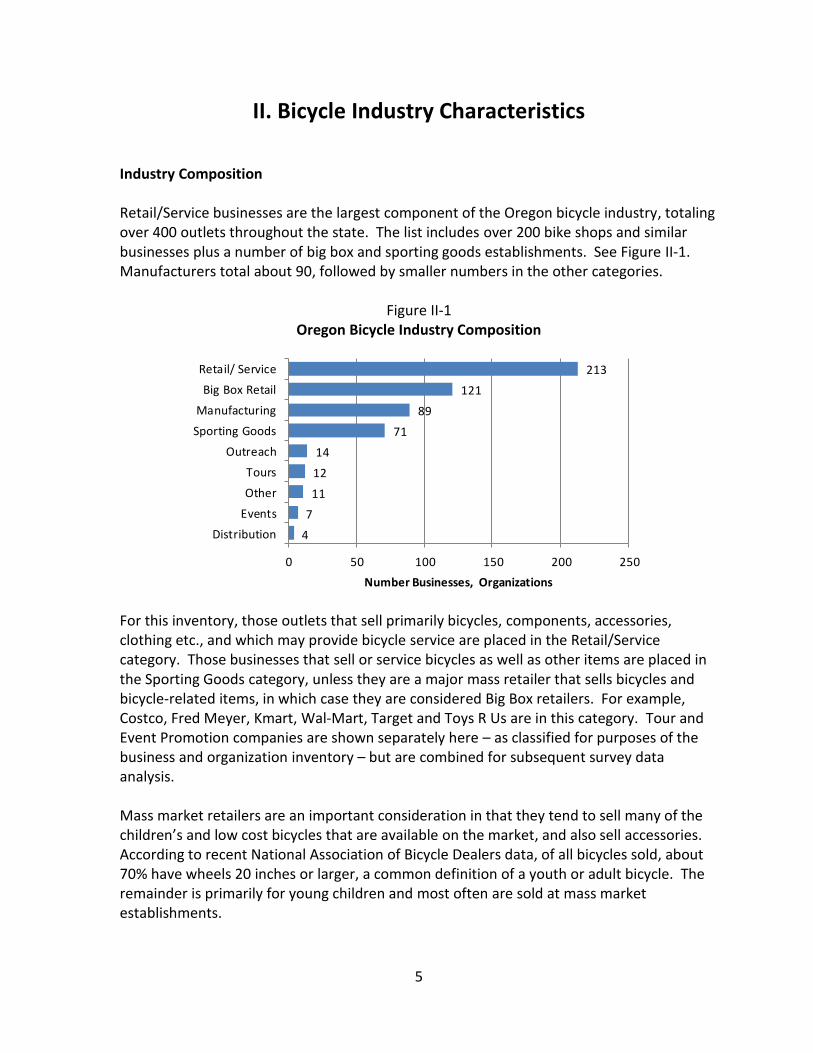
Location A substantial portion of all bicycle industry businesses and organizations are located in the Portland Metropolitan Area, amounting to 262 or about half of all such entities in Oregon. The Willamette Valley, Southern and Central Oregon follow. See Figure II-2.
Figure II-2 Bicycle Industry Business and Organization Location
13
53
19
60
262
115
20
0 50 100 150 200 250 300
Eastern
Central
Gorge/Mt. Hood
Southern
Portland Metro
Willamette Valley
Coast
Number of Businesses or Organizations
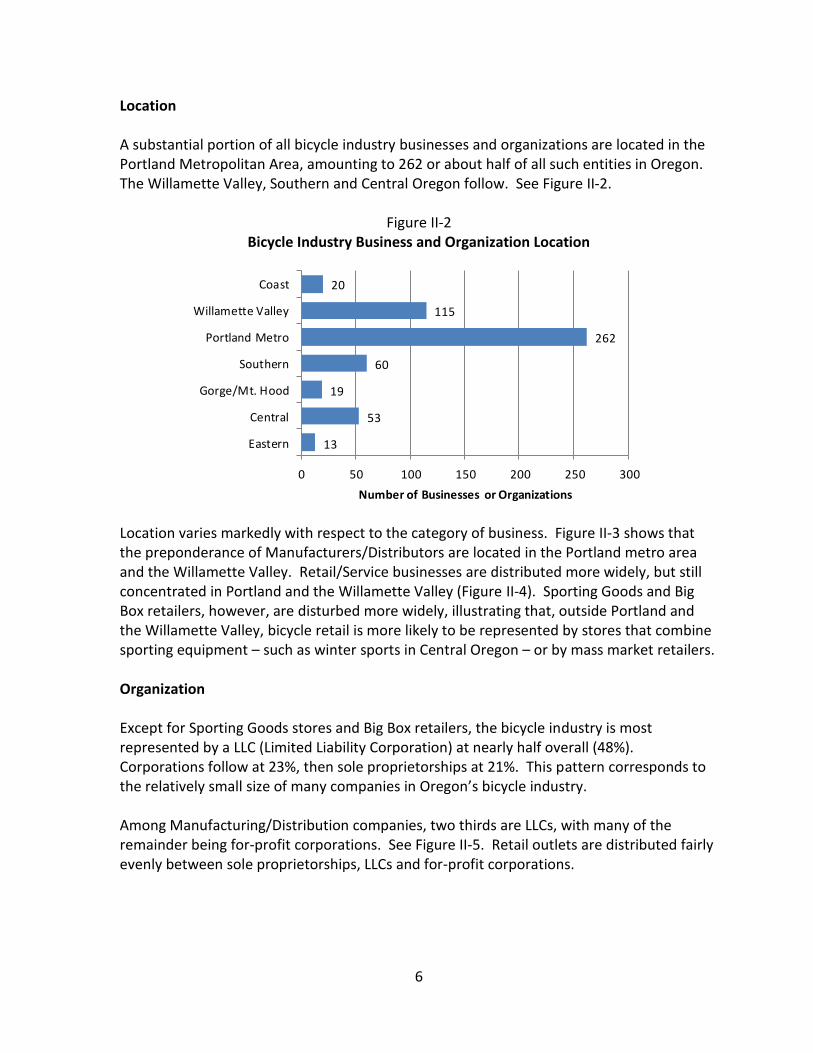
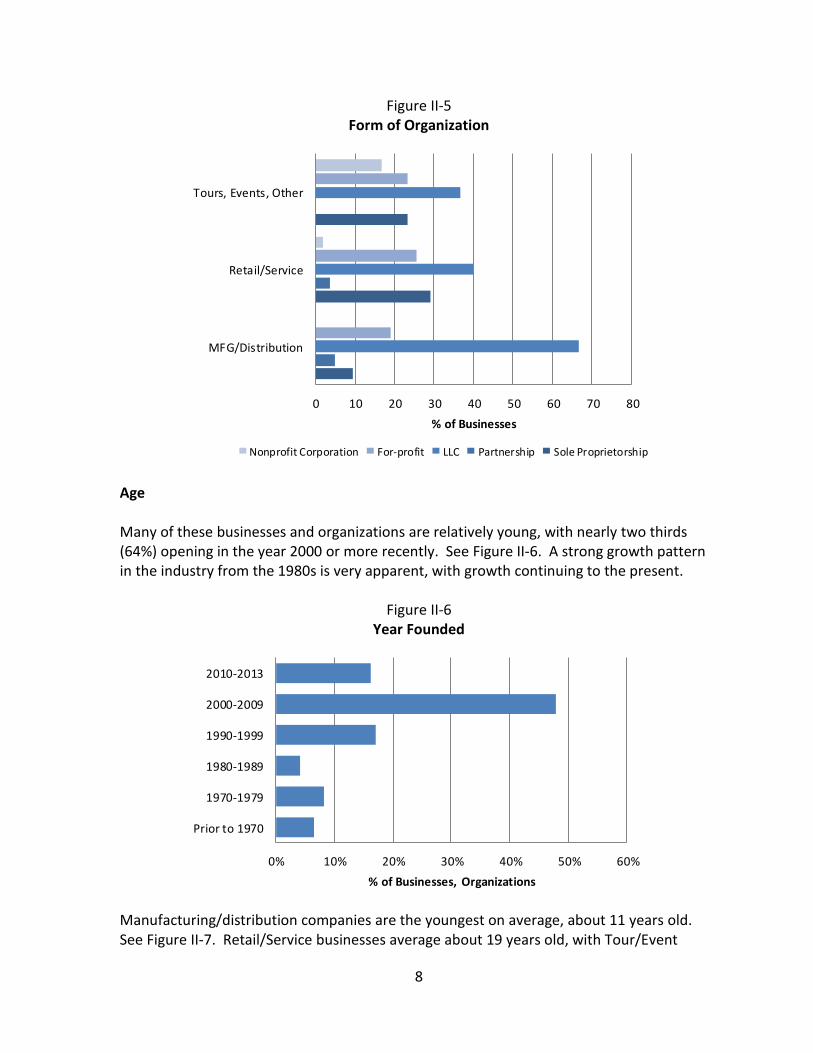
Location varies markedly with respect to the category of business. Figure II-3 shows that the preponderance of Manufacturers/Distributors are located in the Portland metro area and the Willamette Valley. Retail/Service businesses are distributed more widely, but still concentrated in Portland and the Willamette Valley (Figure II-4). Sporting Goods and Big Box retailers, however, are disturbed more widely, illustrating that, outside Portland and the Willamette Valley, bicycle retail is more likely to be represented by stores that combine sporting equipment – such as winter sports in Central Oregon – or by mass market retailers. Organization Except for Sporting Goods stores and Big Box retailers, the bicycle industry is most represented by a LLC (Limited Liability Corporation) at nearly half overall (48%). Corporations follow at 23%, then sole proprietorships at 21%. This pattern corresponds to the relatively small size of many companies in Oregon’s bicycle industry. Among Manufacturing/Distribution companies, two thirds are LLCs, with many of the remainder being for-profit corporations. See Figure II-5. Retail outlets are distributed fairly evenly between sole proprietorships, LLCs and for-profit corporations.
7
Figure II-3
Bicycle Manufacturing/Distribution Business Location
0
5
2
9
61
14
2
0 10 20 30 40 50 60 70
Eastern
Central
Gorge/Mt. Hood
Southern
Portland Metro
Willamette Valley
Coast
Number of Businesses
Figure II-4
Bicycle Industry Retail/Service Business Location
4
22
7
23
100
46
11
0 20 40 60 80 100 120
Eastern
Central
Gorge/Mt. Hood
Southern
Portland Metro
Willamette Valley
Coast
Number of Businesses
Only 10% of respondents report that they represent an out-of-state business or organization. Recall that these figures do not represent the large sporting goods and big box retailers included in the inventory, all of which are branches of out-of-state corporations.
8
Figure II-5 Form of Organization
0 10 20 30 40 50 60 70 80
MFG/Distribution
Retail/Service
Tours, Events, Other
% of Businesses
Nonprofit Corporation For-profit LLC Partnership Sole Proprietorship
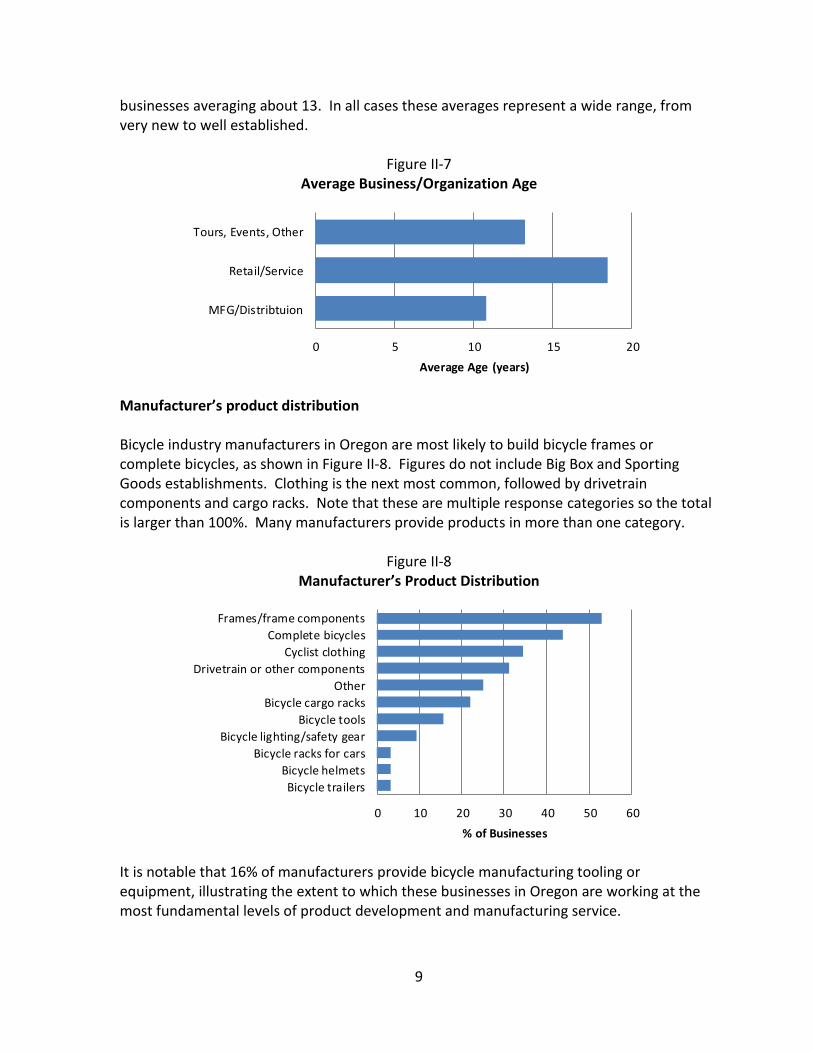
Age Many of these businesses and organizations are relatively young, with nearly two thirds (64%) opening in the year 2000 or more recently. See Figure II-6. A strong growth pattern in the industry from the 1980s is very apparent, with growth continuing to the present.
Figure II-6 Year Founded
0% 10% 20% 30% 40% 50% 60%
Prior to 1970
1970-1979
1980-1989
1990-1999
2000-2009
2010-2013
% of Businesses, Organizations
Manufacturing/distribution companies are the youngest on average, about 11 years old. See Figure II-7. Retail/Service businesses average about 19 years old, with Tour/Event
9
businesses averaging about 13. In all cases these averages represent a wide range, from very new to well established.
Figure II-7 Average Business/Organization Age
0 5 10 15 20
MFG/Distribtuion
Retail/Service
Tours, Events, Other
Average Age (years)
Manufacturer’s product distribution Bicycle industry manufacturers in Oregon are most likely to build bicycle frames or complete bicycles, as shown in Figure II-8. Figures do not include Big Box and Sporting Goods establishments. Clothing is the next most common, followed by drivetrain components and cargo racks. Note that these are multiple response categories so the total is larger than 100%. Many manufacturers provide products in more than one category.
Figure II-8 Manufacturer’s Product Distribution
0 10 20 30 40 50 60
Bicycle trailersBicycle helmets
Bicycle racks for carsBicycle lighting/safety gear
Bicycle toolsBicycle cargo racks
OtherDrivetrain or other components
Cyclist clothingComplete bicycles
Frames/frame components
% of Businesses
It is notable that 16% of manufacturers provide bicycle manufacturing tooling or equipment, illustrating the extent to which these businesses in Oregon are working at the most fundamental levels of product development and manufacturing service.

10
Other categories Distributors who responded to the survey report handling a range of products, including frames, components, accessories and clothing. Event promotion organizations support a range of competitive and non-competitive activities ranging from shows and expos, races and organized rides. Data for these categories are too limited to report in numeric detail.
11
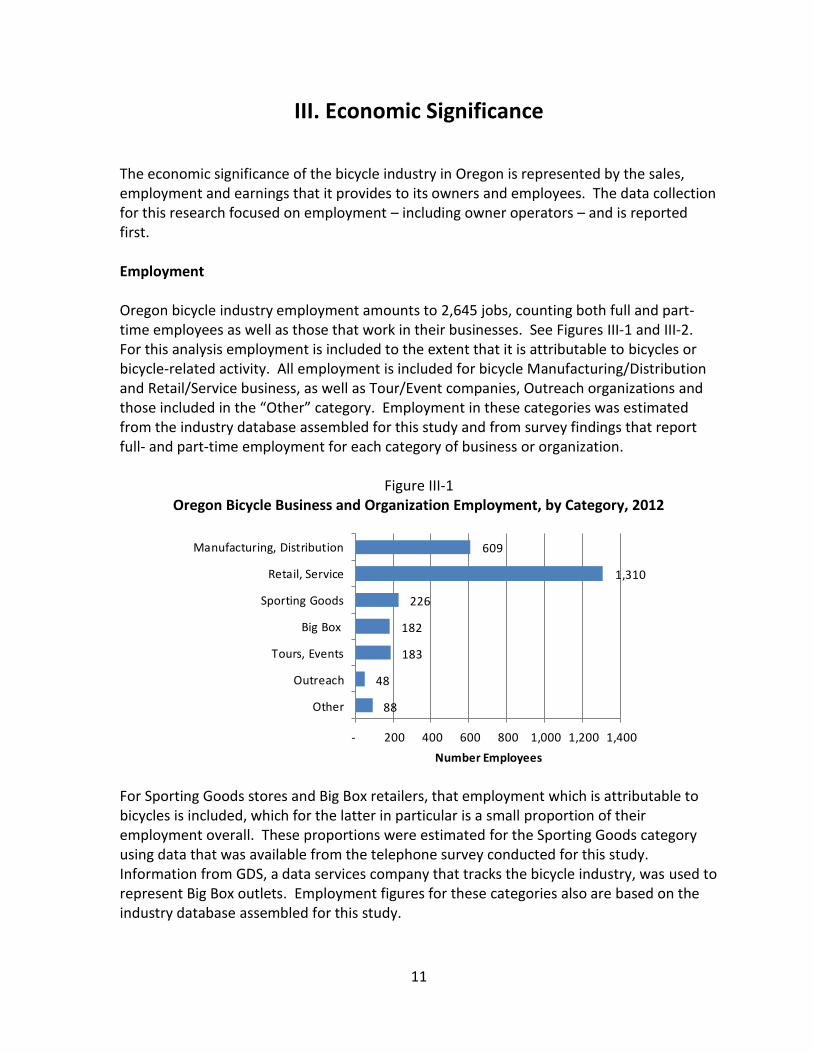
III. Economic Significance The economic significance of the bicycle industry in Oregon is represented by the sales, employment and earnings that it provides to its owners and employees. The data collection for this research focused on employment – including owner operators – and is reported first. Employment Oregon bicycle industry employment amounts to 2,645 jobs, counting both full and part-time employees as well as those that work in their businesses. See Figures III-1 and III-2. For this analysis employment is included to the extent that it is attributable to bicycles or bicycle-related activity. All employment is included for bicycle Manufacturing/Distribution and Retail/Service business, as well as Tour/Event companies, Outreach organizations and those included in the “Other” category. Employment in these categories was estimated from the industry database assembled for this study and from survey findings that report full- and part-time employment for each category of business or organization.
Figure III-1 Oregon Bicycle Business and Organization Employment, by Category, 2012
88
48
183
182
226
1,310
609
- 200 400 600 800 1,000 1,200 1,400
Other
Outreach
Tours, Events
Big Box
Sporting Goods
Retail, Service
Manufacturing, Distribution
Number Employees
For Sporting Goods stores and Big Box retailers, that employment which is attributable to bicycles is included, which for the latter in particular is a small proportion of their employment overall. These proportions were estimated for the Sporting Goods category using data that was available from the telephone survey conducted for this study. Information from GDS, a data services company that tracks the bicycle industry, was used to represent Big Box outlets. Employment figures for these categories also are based on the industry database assembled for this study.

12
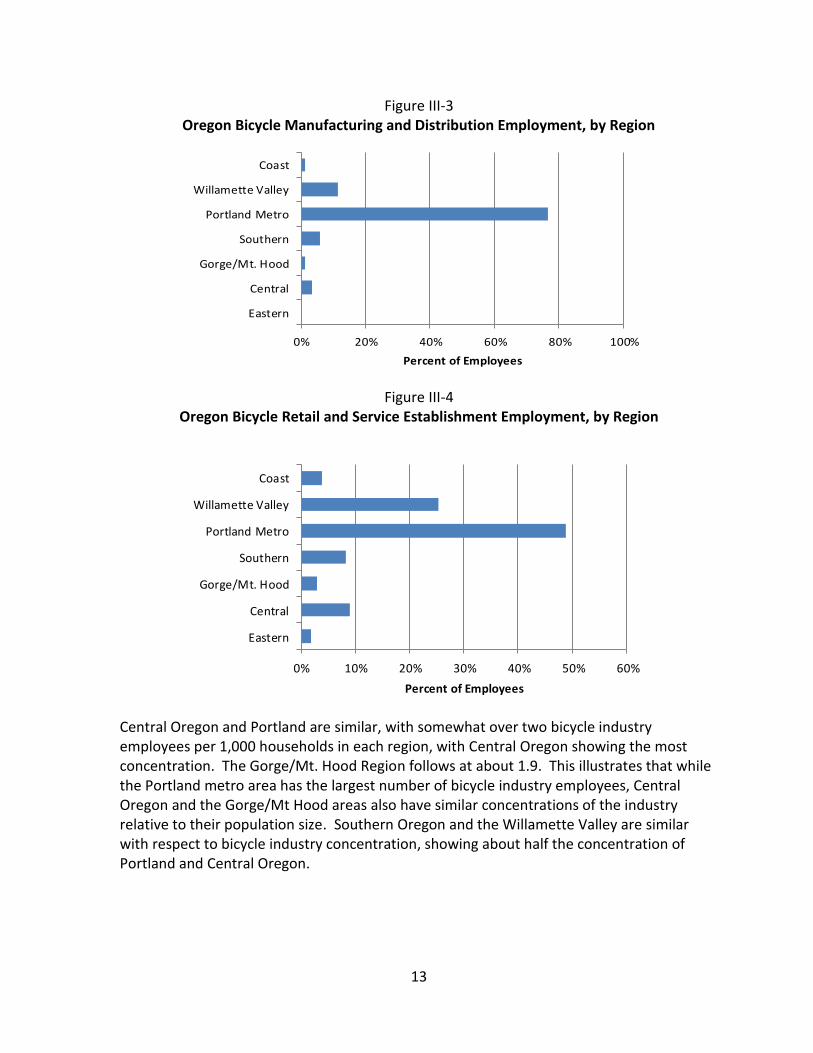
The count of employees includes both full and part time employees, with seasonal employees weighted according to the months they work during the year so as to represent average annual employment of this type. Tables showing further employment detail appear in the Appendix. Employment is predominately in Manufacturing/Distribution companies or in Retail/Service businesses that are oriented primarily to bicycle sales and service. The majority of bicycle business and organization employment is located in the Portland metro area or the Willamette Valley, followed by Central and Southern Oregon. See Figure III-2. This is particularly true for Manufacturing/Distribution businesses, for which over three quarters of employees are located in the Portland area, with many of the remainder located in the Willamette Valley. See Figure III-3.
Figure III-2 Oregon Bicycle Business and Organization Employment, by Region
0% 10% 20% 30% 40% 50% 60% 70%
Eastern
Central
Gorge/Mt. Hood
Southern
Portland Metro
Willamette Valley
Coast
Percent of Employees
Retail and Service establishment employment is also concentrated in the Portland area and the Willamette Valley, but is distributed to a larger degree throughout Oregon than is the case for Manufacturing employment. See Figure III-4. Tour/Event company and Outreach organization employment is also concentrated in Portland and the Willamette Valley. To some degree it is not surprising that the Portland metro area and the Willamette Valley are as dominant as business locations in the bicycle industry in that these are the locations of a large portion of the state’s population. An additional perspective is provided by Figure III-5, which shows the average number of bicycle industry employees per 1,000 households in each region of the state, which is a measure of the concentration or density of the industry in each area.
13
Figure III-3 Oregon Bicycle Manufacturing and Distribution Employment, by Region
0% 20% 40% 60% 80% 100%
Eastern
Central
Gorge/Mt. Hood
Southern
Portland Metro
Willamette Valley
Coast
Percent of Employees
Figure III-4
Oregon Bicycle Retail and Service Establishment Employment, by Region
0% 10% 20% 30% 40% 50% 60%
Eastern
Central
Gorge/Mt. Hood
Southern
Portland Metro
Willamette Valley
Coast
Percent of Employees
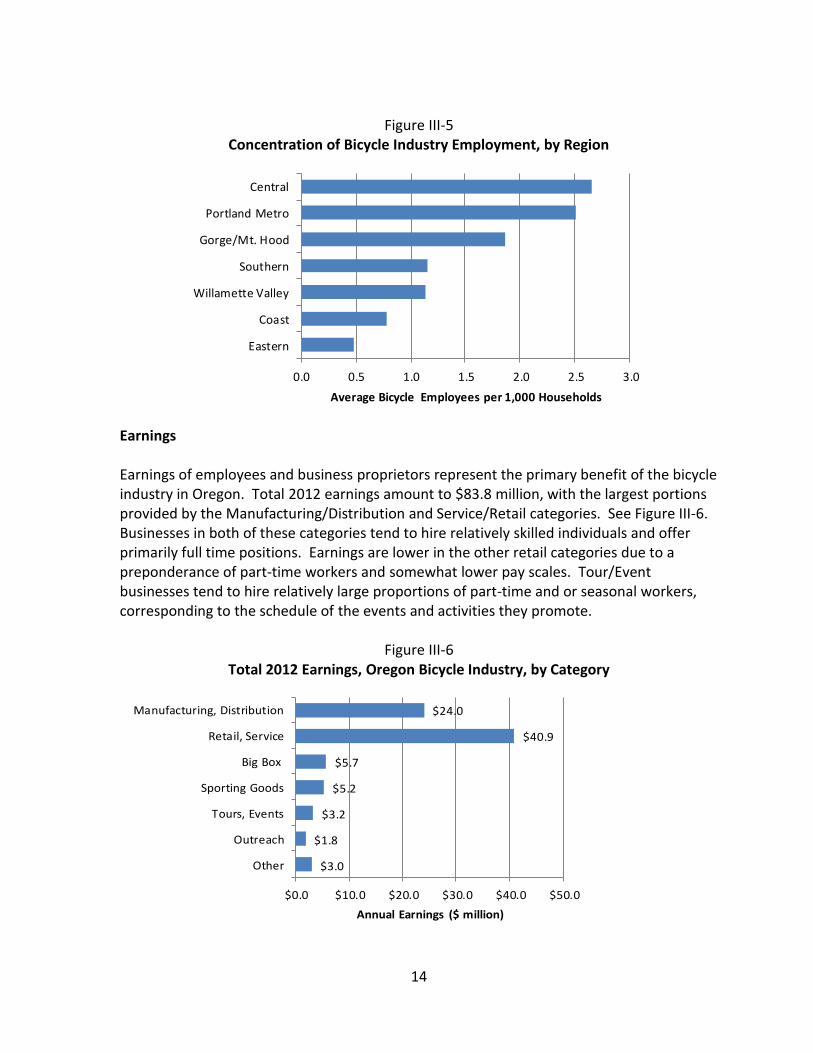
Central Oregon and Portland are similar, with somewhat over two bicycle industry employees per 1,000 households in each region, with Central Oregon showing the most concentration. The Gorge/Mt. Hood Region follows at about 1.9. This illustrates that while the Portland metro area has the largest number of bicycle industry employees, Central Oregon and the Gorge/Mt Hood areas also have similar concentrations of the industry relative to their population size. Southern Oregon and the Willamette Valley are similar with respect to bicycle industry concentration, showing about half the concentration of Portland and Central Oregon.
14
Figure III-5
Concentration of Bicycle Industry Employment, by Region
0.0 0.5 1.0 1.5 2.0 2.5 3.0
Eastern
Coast
Willamette Valley
Southern
Gorge/Mt. Hood
Portland Metro
Central
Average Bicycle Employees per 1,000 Households
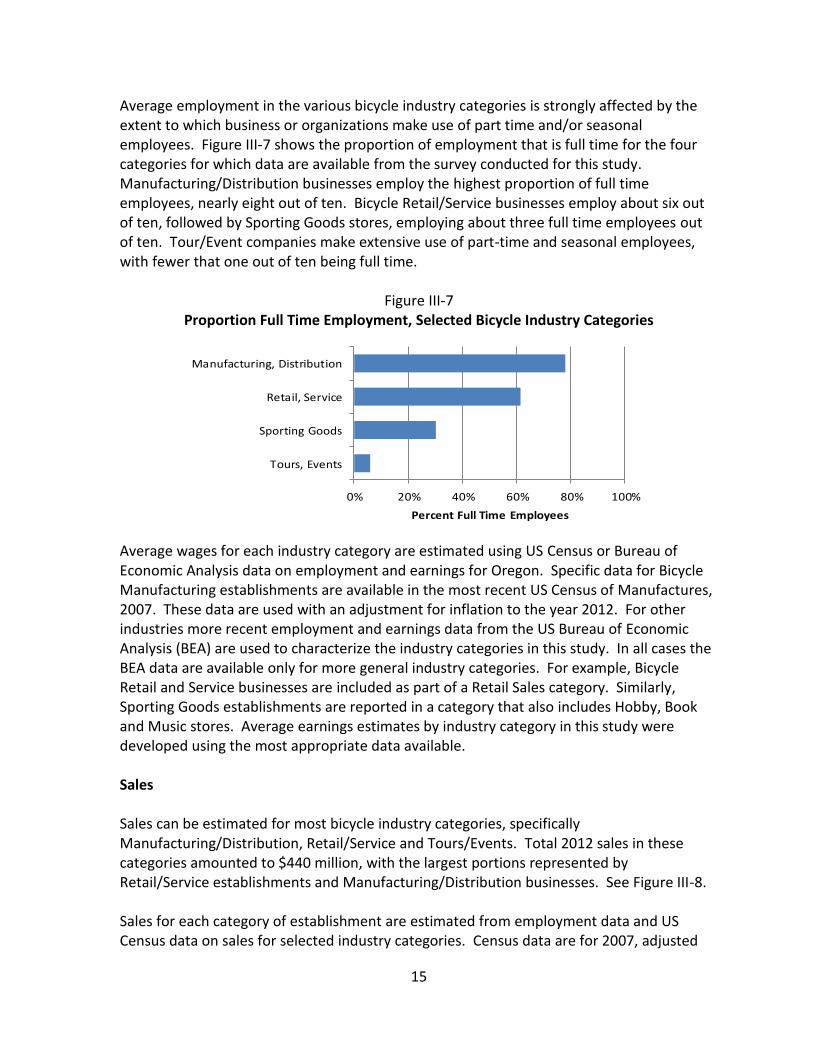
Earnings Earnings of employees and business proprietors represent the primary benefit of the bicycle industry in Oregon. Total 2012 earnings amount to $83.8 million, with the largest portions provided by the Manufacturing/Distribution and Service/Retail categories. See Figure III-6. Businesses in both of these categories tend to hire relatively skilled individuals and offer primarily full time positions. Earnings are lower in the other retail categories due to a preponderance of part-time workers and somewhat lower pay scales. Tour/Event businesses tend to hire relatively large proportions of part-time and or seasonal workers, corresponding to the schedule of the events and activities they promote.
Figure III-6 Total 2012 Earnings, Oregon Bicycle Industry, by Category
$3.0
$1.8
$3.2
$5.2
$5.7
$40.9
$24.0
$0.0 $10.0 $20.0 $30.0 $40.0 $50.0
Other
Outreach
Tours, Events
Sporting Goods
Big Box
Retail, Service
Manufacturing, Distribution
Annual Earnings ($ million)
15
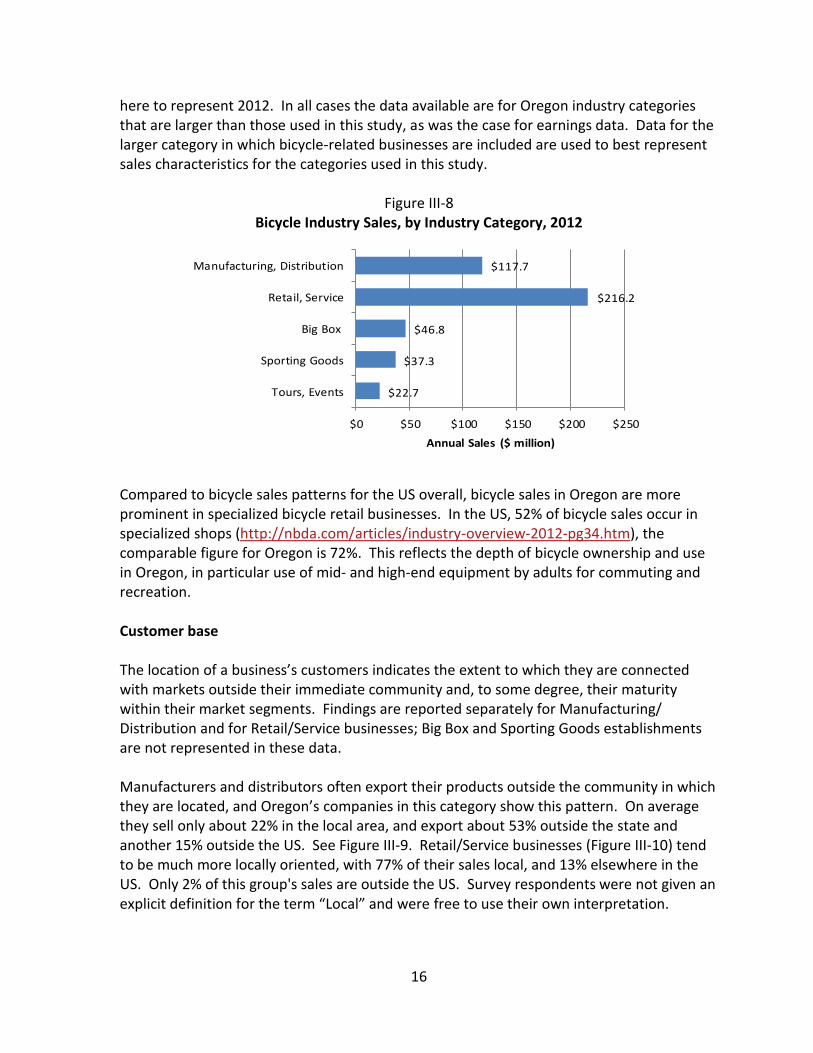
Average employment in the various bicycle industry categories is strongly affected by the extent to which business or organizations make use of part time and/or seasonal employees. Figure III-7 shows the proportion of employment that is full time for the four categories for which data are available from the survey conducted for this study. Manufacturing/Distribution businesses employ the highest proportion of full time employees, nearly eight out of ten. Bicycle Retail/Service businesses employ about six out of ten, followed by Sporting Goods stores, employing about three full time employees out of ten. Tour/Event companies make extensive use of part-time and seasonal employees, with fewer that one out of ten being full time.
Figure III-7 Proportion Full Time Employment, Selected Bicycle Industry Categories
0% 20% 40% 60% 80% 100%
Tours, Events
Sporting Goods
Retail, Service
Manufacturing, Distribution
Percent Full Time Employees
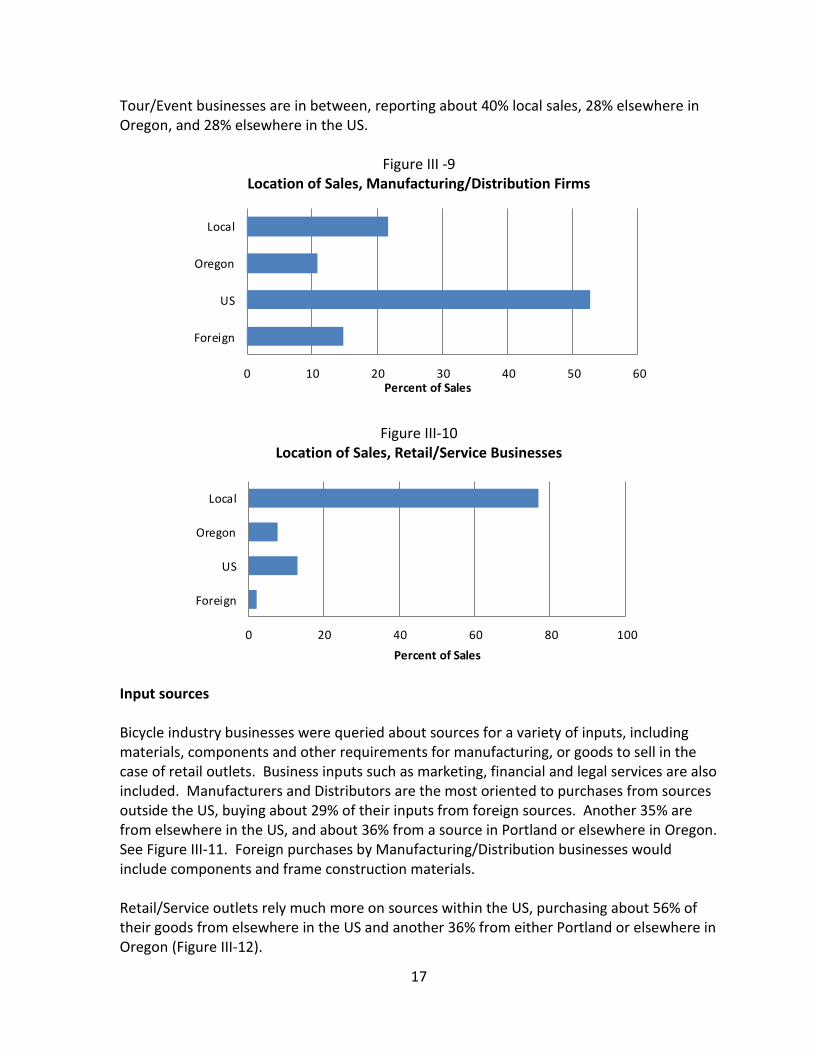
Average wages for each industry category are estimated using US Census or Bureau of Economic Analysis data on employment and earnings for Oregon. Specific data for Bicycle Manufacturing establishments are available in the most recent US Census of Manufactures, 2007. These data are used with an adjustment for inflation to the year 2012. For other industries more recent employment and earnings data from the US Bureau of Economic Analysis (BEA) are used to characterize the industry categories in this study. In all cases the BEA data are available only for more general industry categories. For example, Bicycle Retail and Service businesses are included as part of a Retail Sales category. Similarly, Sporting Goods establishments are reported in a category that also includes Hobby, Book and Music stores. Average earnings estimates by industry category in this study were developed using the most appropriate data available. Sales Sales can be estimated for most bicycle industry categories, specifically Manufacturing/Distribution, Retail/Service and Tours/Events. Total 2012 sales in these categories amounted to $440 million, with the largest portions represented by Retail/Service establishments and Manufacturing/Distribution businesses. See Figure III-8. Sales for each category of establishment are estimated from employment data and US Census data on sales for selected industry categories. Census data are for 2007, adjusted
16
here to represent 2012. In all cases the data available are for Oregon industry categories that are larger than those used in this study, as was the case for earnings data. Data for the larger category in which bicycle-related businesses are included are used to best represent sales characteristics for the categories used in this study.
Figure III-8 Bicycle Industry Sales, by Industry Category, 2012
$22.7
$37.3
$46.8
$216.2
$117.7
$0 $50 $100 $150 $200 $250
Tours, Events
Sporting Goods
Big Box
Retail, Service
Manufacturing, Distribution
Annual Sales ($ million)
Compared to bicycle sales patterns for the US overall, bicycle sales in Oregon are more prominent in specialized bicycle retail businesses. In the US, 52% of bicycle sales occur in specialized shops (http://nbda.com/articles/industry-overview-2012-pg34.htm), the comparable figure for Oregon is 72%. This reflects the depth of bicycle ownership and use in Oregon, in particular use of mid- and high-end equipment by adults for commuting and recreation. Customer base The location of a business’s customers indicates the extent to which they are connected with markets outside their immediate community and, to some degree, their maturity within their market segments. Findings are reported separately for Manufacturing/ Distribution and for Retail/Service businesses; Big Box and Sporting Goods establishments are not represented in these data. Manufacturers and distributors often export their products outside the community in which they are located, and Oregon’s companies in this category show this pattern. On average they sell only about 22% in the local area, and export about 53% outside the state and another 15% outside the US. See Figure III-9. Retail/Service businesses (Figure III-10) tend to be much more locally oriented, with 77% of their sales local, and 13% elsewhere in the US. Only 2% of this group's sales are outside the US. Survey respondents were not given an explicit definition for the term “Local” and were free to use their own interpretation.
17
Tour/Event businesses are in between, reporting about 40% local sales, 28% elsewhere in Oregon, and 28% elsewhere in the US.
Figure III -9 Location of Sales, Manufacturing/Distribution Firms
0 10 20 30 40 50 60
Foreign
US
Oregon
Local
Percent of Sales
Figure III-10
Location of Sales, Retail/Service Businesses
0 20 40 60 80 100
Foreign
US
Oregon
Local
Percent of Sales
Input sources Bicycle industry businesses were queried about sources for a variety of inputs, including materials, components and other requirements for manufacturing, or goods to sell in the case of retail outlets. Business inputs such as marketing, financial and legal services are also included. Manufacturers and Distributors are the most oriented to purchases from sources outside the US, buying about 29% of their inputs from foreign sources. Another 35% are from elsewhere in the US, and about 36% from a source in Portland or elsewhere in Oregon. See Figure III-11. Foreign purchases by Manufacturing/Distribution businesses would include components and frame construction materials. Retail/Service outlets rely much more on sources within the US, purchasing about 56% of their goods from elsewhere in the US and another 36% from either Portland or elsewhere in Oregon (Figure III-12).
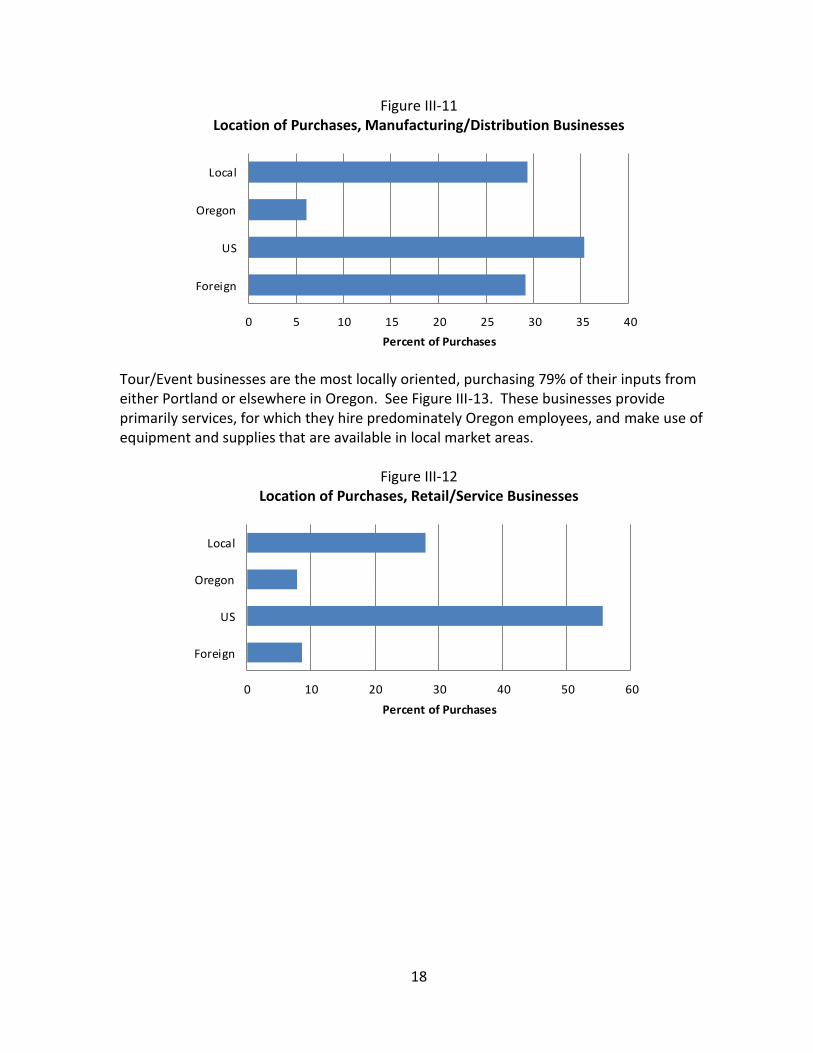
18
Figure III-11 Location of Purchases, Manufacturing/Distribution Businesses
0 5 10 15 20 25 30 35 40
Foreign
US
Oregon
Local
Percent of Purchases
Tour/Event businesses are the most locally oriented, purchasing 79% of their inputs from either Portland or elsewhere in Oregon. See Figure III-13. These businesses provide primarily services, for which they hire predominately Oregon employees, and make use of equipment and supplies that are available in local market areas.
Figure III-12 Location of Purchases, Retail/Service Businesses
0 10 20 30 40 50 60
Foreign
US
Oregon
Local
Percent of Purchases

19
Figure III-13 Location of Purchases, Tour and Event Businesses
0 10 20 30 40 50 60
Foreign
US
Oregon
Local
Percent of Purchases
20
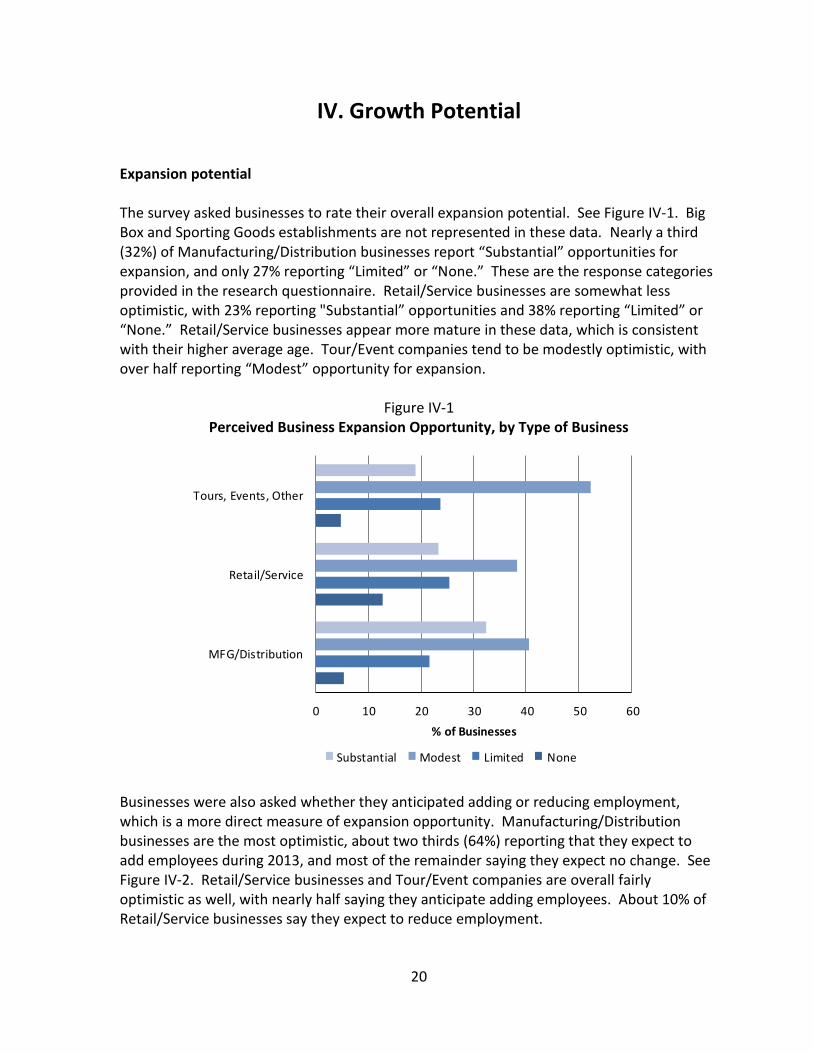
IV. Growth Potential Expansion potential The survey asked businesses to rate their overall expansion potential. See Figure IV-1. Big Box and Sporting Goods establishments are not represented in these data. Nearly a third (32%) of Manufacturing/Distribution businesses report “Substantial” opportunities for expansion, and only 27% reporting “Limited” or “None.” These are the response categories provided in the research questionnaire. Retail/Service businesses are somewhat less optimistic, with 23% reporting "Substantial” opportunities and 38% reporting “Limited” or “None.” Retail/Service businesses appear more mature in these data, which is consistent with their higher average age. Tour/Event companies tend to be modestly optimistic, with over half reporting “Modest” opportunity for expansion.
Figure IV-1 Perceived Business Expansion Opportunity, by Type of Business
0 10 20 30 40 50 60
MFG/Distribution
Retail/Service
Tours, Events, Other
% of Businesses
Substantial Modest Limited None
Businesses were also asked whether they anticipated adding or reducing employment, which is a more direct measure of expansion opportunity. Manufacturing/Distribution businesses are the most optimistic, about two thirds (64%) reporting that they expect to add employees during 2013, and most of the remainder saying they expect no change. See Figure IV-2. Retail/Service businesses and Tour/Event companies are overall fairly optimistic as well, with nearly half saying they anticipate adding employees. About 10% of Retail/Service businesses say they expect to reduce employment.

21
Figure IV-2
Intention to Change Employment, by Type of Business
0 10 20 30 40 50 60 70
MFG/Distribution
Retail/Service
Tours, Events, Other
Percent of BusinessesReduce Employees No Change Add Employees
Hindrances to expansion A final question asked about hindrances to expansion, providing a number of potential responses. This was a multiple response question, so responses add to more than 100%. See Figures IV-3 through IV-5. Overall the three most important hindrances are “Overall Economic Conditions,” “Competition” and “Can’t Get Adequate Funding.” About a quarter of respondents report no hindrances to their expansion.
Figure IV-3 Hindrances to Expansion, Manufacturing/Distribution Businesses
0 5 10 15 20 25 30 35
Demographic ChangesLack of LaborCompetition
Inadequate LocationsDo Not Want to Grow
Cost of Health BenefitsNone
Overall Economic ConditionsInadequate Financing
% of Businesses
22
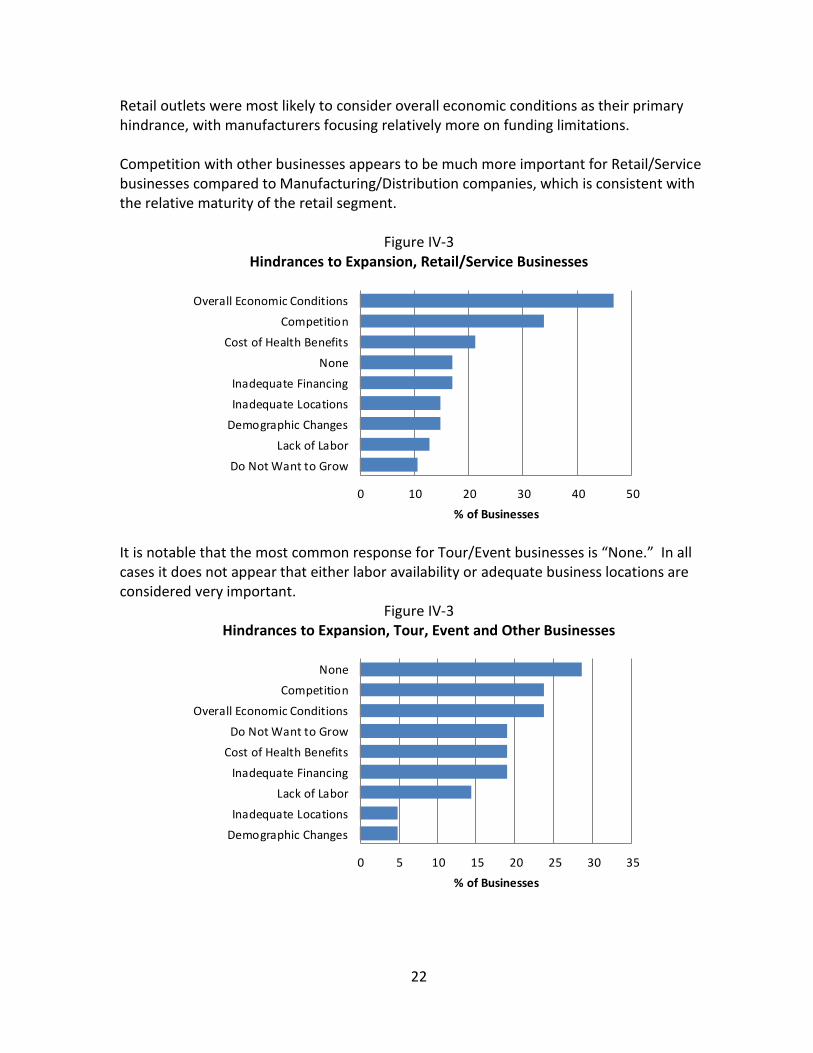
Retail outlets were most likely to consider overall economic conditions as their primary hindrance, with manufacturers focusing relatively more on funding limitations. Competition with other businesses appears to be much more important for Retail/Service businesses compared to Manufacturing/Distribution companies, which is consistent with the relative maturity of the retail segment.
Figure IV-3 Hindrances to Expansion, Retail/Service Businesses
0 10 20 30 40 50
Do Not Want to GrowLack of Labor
Demographic ChangesInadequate LocationsInadequate Financing
NoneCost of Health Benefits
CompetitionOverall Economic Conditions
% of Businesses
It is notable that the most common response for Tour/Event businesses is “None.” In all cases it does not appear that either labor availability or adequate business locations are considered very important.
Figure IV-3 Hindrances to Expansion, Tour, Event and Other Businesses
0 5 10 15 20 25 30 35
Demographic ChangesInadequate Locations
Lack of LaborInadequate Financing
Cost of Health BenefitsDo Not Want to Grow
Overall Economic ConditionsCompetition
None
% of Businesses
23
Appendix
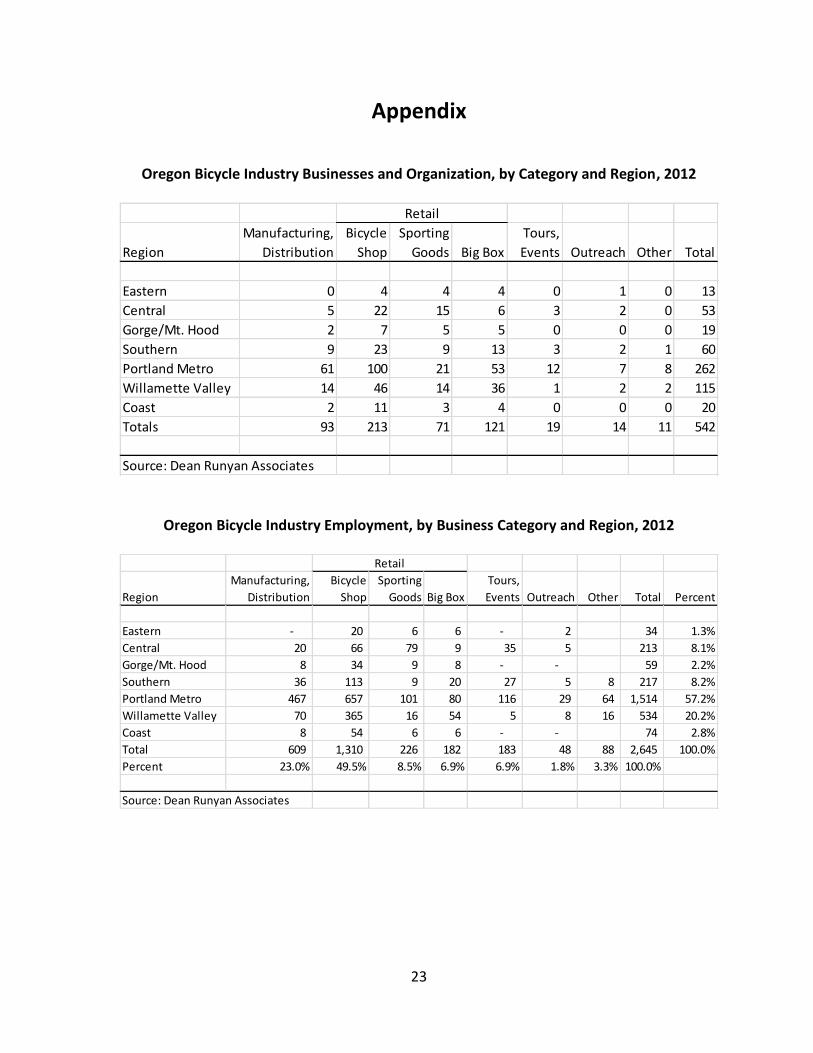
Oregon Bicycle Industry Businesses and Organization, by Category and Region, 2012
Oregon Bicycle Industry Employment, by Business Category and Region, 2012
RegionManufacturing,
DistributionBicycle
ShopSporting
Goods Big Box Tours, Events Outreach Other Total
Eastern 0 4 4 4 0 1 0 13Central 5 22 15 6 3 2 0 53Gorge/Mt. Hood 2 7 5 5 0 0 0 19Southern 9 23 9 13 3 2 1 60Portland Metro 61 100 21 53 12 7 8 262Willamette Valley 14 46 14 36 1 2 2 115Coast 2 11 3 4 0 0 0 20Totals 93 213 71 121 19 14 11 542
Source: Dean Runyan Associates
Retail
RegionManufacturing,
DistributionBicycle
ShopSporting
Goods Big Box Tours, Events Outreach Other Total Percent
Eastern - 20 6 6 - 2 34 1.3%Central 20 66 79 9 35 5 213 8.1%Gorge/Mt. Hood 8 34 9 8 - - 59 2.2%Southern 36 113 9 20 27 5 8 217 8.2%Portland Metro 467 657 101 80 116 29 64 1,514 57.2%Willamette Valley 70 365 16 54 5 8 16 534 20.2%Coast 8 54 6 6 - - 74 2.8%Total 609 1,310 226 182 183 48 88 2,645 100.0%Percent 23.0% 49.5% 8.5% 6.9% 6.9% 1.8% 3.3% 100.0%
Source: Dean Runyan Associates
Retail

24
Questionnaire
Page 1
<STRONG>Bicycle Industry Survey</STRONG><STRONG>Bicycle Industry Survey</STRONG><STRONG>Bicycle Industry Survey</STRONG><STRONG>Bicycle Industry Survey</STRONG>
1. In what year was your company founded? (If the company has been purchased, what year was the original company founded?)
2. Is your company or operation in Oregon part of a larger company that is located outside Oregon?
Please respond to all questions in terms of the business, organization or operation that is located in Oregon.
3. What is the legal form of the company or organization in Oregon?
4. What is the zip code of your primary location in Oregon?
5. What is the primary classification of your company or organization? (select one only)
*
Year:
*
*
*Zip Code:
*
Yes
nmlkj
No
nmlkj
Sole proprietorship
nmlkj
Partnership
nmlkj
Limited Liability Corporation (LLC)
nmlkj
Forprofit corporation
nmlkj
Nonprofit corporation
nmlkj
Manufacturing (bikes, components, tools, painting, clothing, accessories)
nmlkj
Wholesale/Distribution (including importing)
nmlkj
Retail (sales, repair, etc.)
nmlkj
Tour operation (paid group rides, travel or organized tours)
nmlkj
Event promotion, event services, (races, shows, other shortterm activities or events)
nmlkj
Industry representation, member serivces, lobbying, public relations, marketing, web, graphics
nmlkj
Other (please describe briefly)
nmlkj
Enter "Other" response here
Page 2
<STRONG>Bicycle Industry Survey</STRONG><STRONG>Bicycle Industry Survey</STRONG><STRONG>Bicycle Industry Survey</STRONG><STRONG>Bicycle Industry Survey</STRONG>6. What does your company manufacture (check all that apply)
7. What types of goods does your company distribute? (Please check all that apply)
*
*
Bicycle frames, frame components
gfedc
Drivetrain or other components (chain, derailers, geared hubs, wheels, handlebars, stems, saddles)
gfedc
Complete bicycles
gfedc
Bicycle cargo racks
gfedc
Bicycle trailers
gfedc
Bicycle lighting, other safety gear
gfedc
Bicycle helmets
gfedc
Clothing for bicyclists (may also be used for other purposes)
gfedc
Bicycle manufacturing or repair tools, equipment
gfedc
Automobile racks or accessories intended for bicycles
gfedc
Other (please describe briefly)
gfedc
Enter "Other" response here
Bicycle frames or complete bicycles
gfedc
Bicycle components, parts, tools, materials or supplies for manufacturing or service companies
gfedc
Bicycle accessories (lighting, racks, helmets, trailers)
gfedc
Clothing used by bicycle riders (may include clothing also used for other purposes)
gfedc
Other (Please describe briefly)
gfedc
Enter "Other" response here

Page 3
<STRONG>Bicycle Industry Survey</STRONG><STRONG>Bicycle Industry Survey</STRONG><STRONG>Bicycle Industry Survey</STRONG><STRONG>Bicycle Industry Survey</STRONG>8. What types of events do you organize and/or offer? (Please check all that apply)
9. During 2012, on average how many employees worked in the company in Oregon, including owners? (if employment changed during the year, please average as best you can, if none enter "0")
10. Do you expect your employment to change during 2013?
11. How many employees do you expect to add? (if none, enter "0")
12. How many employees do you expect to reduce by? (if none, enter "0")
*
*
Yeararound employees who worked full time (approximately 40 hours or more per week)
Year around employees who worked part time
Seasonal (part year) employees who worked full time while they were there
Average number of months they worked during the year
Seasonal employees who worked part time
Average number of months they worked during the year
*
*Full Time
Part Time
*Full Time
Part Time
Bicycle or related expos/shows
gfedc
Road races
gfedc
Mountain bike, off road trail races
gfedc
Cyclocross races
gfedc
Bicycle riding events that are not racing oriented
gfedc
Equipment swaps
gfedc
Training events, classes
gfedc
Other (please describe briefly)
gfedc
Enter "Other" response here
Add employees
nmlkj
No Change
nmlkj
Reduce employees
nmlkj
Page 4
<STRONG>Bicycle Industry Survey</STRONG><STRONG>Bicycle Industry Survey</STRONG><STRONG>Bicycle Industry Survey</STRONG><STRONG>Bicycle Industry Survey</STRONG>13. Location of Purchaser and percent of purchases.
Thinking about the company's sales related to your operation in Oregon for 2012, how were they distributed by location of the purchaser? (Please enter percent of sales for each location category. If none enter "0", total must add to 100%. If you do not have specific figures please enter your most informed estimates.)
14. Location of Seller and percent of purchases. Considering all the inputs for your company or operation in Oregon (components, materials, supplies, services such as marketing, accounting, legal) where did you purchase them? (Please enter percent of purchases for each category. If none enter "0", total must add to 100%. If you do not have specific figures please enter your most informed estimates) Please include materials or services provided by a parent or subsidiary location outside Oregon.
15. What is the opportunity for expansion of your company in Oregon over the next two or three years?
*
Sales from the local area (city, county, local region)
Sales elsewhere in Oregon
Sales elsewhere in US
Overseas/foreign sales (including Canada and Mexico)
*
Purchased from the local area (city, county, local region)
Purchased elsewhere in Oregon
Purchased elsewhere in US
Overseas/foreign purchase (including Canada and Mexico)
*
None
nmlkj
Limited
nmlkj
Modest
nmlkj
Substantial
nmlkj
Page 5
<STRONG>Bicycle Industry Survey</STRONG><STRONG>Bicycle Industry Survey</STRONG><STRONG>Bicycle Industry Survey</STRONG><STRONG>Bicycle Industry Survey</STRONG>16. What are the primary limitations to expansion of your company or organization in
Oregon? (Please check all that apply)
17. What is the name of your company? (Optional)
Thank you for taking our survey. Your thoughts and opinions are important to us!
*
Overall economic conditions are not good enough
gfedc
Population changes, such as demographics, are limiting demand
gfedc
Competition from similar companies is too strong
gfedc
Can't get adequate financing
gfedc
Unable to find the necessary workers
gfedc
Can't find adequate space, or a proper location for the business
gfedc
Cost of providing employee health benefits
gfedc
Don't really want to grow
gfedc
None/no limitations
gfedc
Top Related