


Languages
Pages
Legal


Optimizing the Student Recruitment Experience
Carol Gersten, VP Consulting Services, Hobsons Emily Meehan, Senior Consultant, Hobsons
Naviance Summer Institute July 2013

2
About Us
! Carol Gersten, Vice President, Consulting Services - Over 20 years of experience in technology across a
variety of industries. - Expertise in strategic consulting, governance and
enterprise implementations. - 5 years with Hobsons
! Emily Meehan, Senior Consultant - Over 12 years of experience in vendor and client-
side technology and marketing agency marketplace. - Expertise in CRM implementation, relationship
marketing measurement. - 3 years with Hobsons

3
• Pre-Implementation Readiness • Identification of Goals & Objectives
• Diagnostic of System Utilization • Best Practices to Maximize ROI
System Optimization
• Marketing and Communication Plan Strategy • Data Analysis & Marketing Plan
Marketing Optimization
CRM Assessment
Consulting Areas of Focus
! Agenda
• Enrollment Management Situational Overview
• Technology Approach for Institutions
• Marketing Approach for Institutions
• Discussion

What’s Happening Out There?
5

! Decline in number of High School Graduates from 2012 -2015.
! Population Shift to Adult, Graduate, and Non-traditional learners - Now represents the majority
of enrolled students - New Challenges!
Source: Ovum White Paper
6
Changing Demographics
“College enrollment in the spring-2013 term is down by 2.3 percent compared to Spring 2012.”
— National Student Clearing House. Spring 2013 Enrollment
* * * * *
“More than half the top 20 online schools are experiencing flat or declining [online] enrollment.”
— EDUVENTURES. Online Higher Ed Market Update

! Consumers responding to financial pressures by choosing less expensive options
! Seeking education close to home
! Financial aid and student loans important
! Postponing or seeking community college option
7
Consumer Changes in Education Planning
Longmire and Company. (2009). Report on the Impact of Economy on College Enrollment [White paper]. Retrieved from http://www.semworks.net/white-papers.php

! Top 12% of all colleges enroll more than half the student population - 88% of schools compete for
46% of students ! For profit schools on the rise ! MOOC Madness ! Expanding overhead increasing
enrollment pressure
8
Competition

! Stretched Budgets/Resources/Staff
! Limited Visibility: Lack of Data, Access to Data, Decentralized Data
! Strained Technical Resources/Support
9
From your perspective….

Show of Hands, Please
• Currently using a CRM?
• Consider the project complete or live?
• Think you are operating at full potential?

- ~35% of institutions have implemented CRM technology
- Concentrated in larger schools and in Undergraduate Admissions
BUT - Many unsuccessful - Void of CRM Services in Non-
Traditional and Graduate Offices
11
Do You Have the Tools and the Approach to Be Competitive?
Gartner predicts that by 2013 institutions without a CRM will be at a severe competitive disadvantage.

! How Do You Know if You Are At Risk?
We have Identified 6 Red Flags…
4

13
Technology First Approach Don’t Just Throw Technology at the Problem
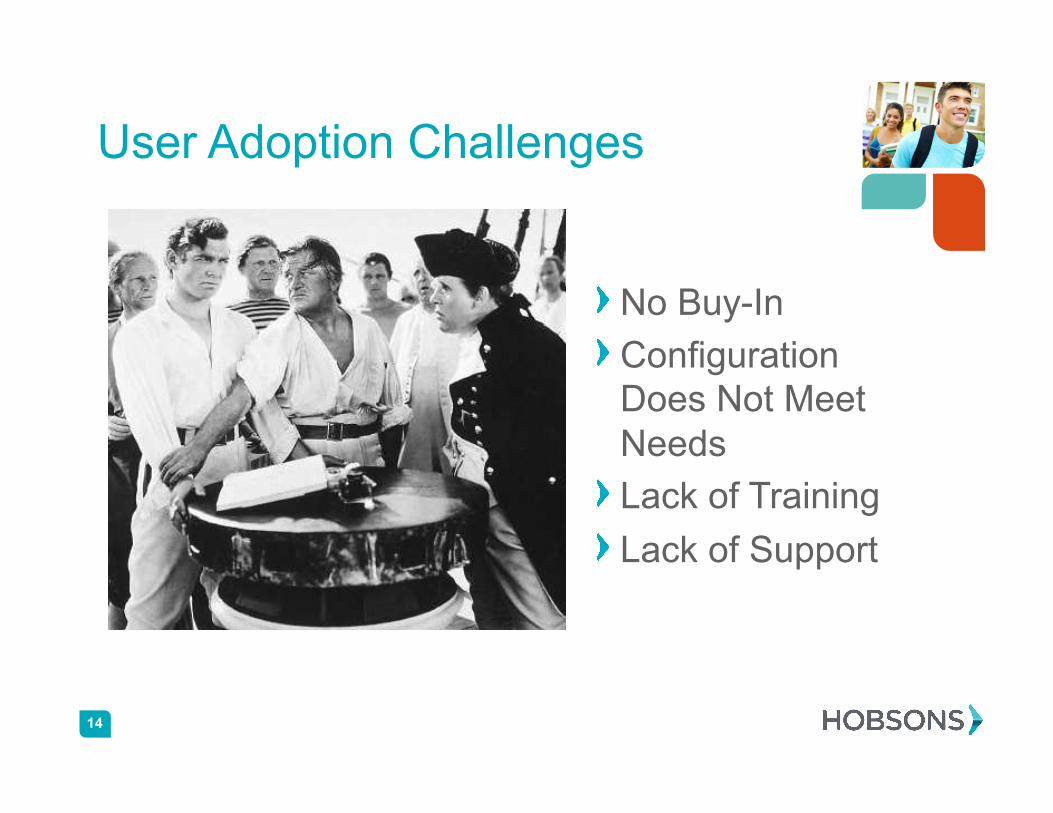
! No Buy-In ! Configuration
Does Not Meet Needs ! Lack of Training ! Lack of Support
14
User Adoption Challenges

15
No Plan for Change Management
Gather Requirements & Set Goals
Configure & Consult
Stakeholders
Test & Get buy-In
Train & Onboard
Evaluate & Optimize

Data and Integration Issues
16

No Defined Objectives…
Discovery
Listening
Engaging
Reinforcing
Growth
Intelligence
Efficiency Quality
17

Leads Projected Incr. Rev. ROMI
Costs
Prospects Total Leads
Overall
GA
Tact
ic DR
Online Adv.
Cha
nnel
/Sou
rce
Referral
Events
Lists
Q310 vs Q4309 Total Trend &
Status Total Trend & Status
14,000 4,000 10,000 tbd
-/+ %
-/+%
-/+%
Application Stats
Actual
Trend & Status
Apps
Goal
Incr. Conv.
300 TBD
%
12%
Engaged Leads
Current +/-
Rep A
Prior
Rep B
Rep C
Lead Distribution
#
Program A
% of Total
Program B
Program C
Program D
Application Data
Program
Total
+/- Prior Mo
Goal
YTD as of 12/10
Avg. Time to Complete App
# Days % Other Metric Other Metric
PROGRAM NAME
15%
Month
…Or Measurement Strategy
18

Where Are You Today?
Where Are You in the Magic Quadrant of Technology Success?
19
Integration Plan
Executive Support
Defined O
bjectives &
Measurem
ent Plan Gov
erna
nce
Str
uctu
re System
Success
System Failure
! Technology: Check!
…So now what?
20

21
What’s on your mind? How is my marketing performing?
Do we have a new program needing message & positioning guidance?
Are we employing best practices and marketing tactics?
How can I approach automated communication?

22

23
You Might Need…
Audit of communication
practices
Quick wins Using
Technology
Example approaches for
reaching the right audience
Marketing ROI
Best practices to take
enrollment efforts to the
next level

! Marketing Approach for Institutions
Who Should I Target?
24

25
Analyze, Segment and Execute
Understand students’ demographic,
psychographic, lifestyle trains, and marketing habits !
Data Segmentation
Marketing Communications
Plan
Data Analysis
Quantitative and Qualitative
completed by team of data analysts on
current or prospective students!
Focus your communication efforts
with well defined tactics and
recommended touch points!

Targeted Analytic Platform
26

This is a strategy grid of segments plotted according to how closely they match our criteria (people who enrolled in Undergraduate or Associates degrees in computer-
related fields) and how large of a sample size they represent. Segments resting in the upper right quadrant are considered to be ideal targets as they index higher than 100
and are part of a large sample size.
% Comp: Amount of targets within each group of segments; Left of line = smaller sample Right of line = larger sample
Index: An indication of likelihood to enroll Above line = good target Below line = bad target
Segments: Groups of population who possess like demographic and behavioral traits
27

28
Bringing To Life Top Tier Prospects
Tier 1 Current Student – Segment 3 “Midlife Success”
Age: 44 HH Income: $122,000 Children: Yes Neighborhood: Greater City Suburbs Cost of Living: Low Marital Status: Single, Never Married Life Stage: Mid-level Management Other: Homeowner
Listens to Hot Adult Contemporary 7 days a week
Very likely to have shopped online more than 3 times in the last week
In the last month has visited LinkedIn, Amazon.com, YouTube, CNN, ESPN.com, Weather.com, and several coupon sites more than 6 times.
In the last 30 days has done online research for education programs and considers his internet info-gathering to be ‘Far Above Average’.
Segment 3: 3.98% of US HH Pop
~4.6M US HH
Psychographic & Behavioral

Ideal Channels
Multiple touch points
Internet; e-mail; print; radio.
Sample Messaging
Must show value to investment.
Must sell them on future career opportunities
Target Audience Profiles
29

! Marketing Approach for Institutions
How Should I Reach My Target Audience?

31
Our Approach
Events/WOM
Display Advertising
Paid Search
Social Media
Marketing
Email Marketing
GRE/ TOEFL
Partner Network

Drive Interest to Conversion
32

! Positioning - No scrolling down
! Links off the page - Don’t let them leave BEFORE the fill out the form!
! Length - What’s the right balance?
! Fields - What’s the minimum amount of information you can
ask without losing them? ! Call To Action
Convert Leads with Landing Page Best Practices

Coordinate Lead Cultivation Efforts
INQUIRY RESPONSE DAY 1 DAY 2 DAY 4 DAY 15 DAY 25 ONGOING
• Email auto response
• Personal email from counselor
• Calls: continue over 8 days until contact
• Print: Viewbook/letter
• Email: Engage with us!
• Email Drip: Events/Engage
• Email Drip: Ongoing every 30 days
34

! Communication Plans ! Fixed Date Communications ! Rolling Date Communications ! Behavior Based Communications ! Automation ! Variety of messages and calls to action
35
Identify the Type of Communication Needed

! Is there campus-wide visibility into all communication? Is there overlap? ! Are there clear calls to action? ! Are your messages personalized? ! Is your message being received? ! Are you responding to your audience - Explicit communications - Implicit behaviors
36
Manage Your Message

! Measuring Performance
37

Leads Projected Incr. Rev. ROMI
Costs
Prospects Total Leads
Overall
GA
Tact
ic DR
Online Adv.
Cha
nnel
/Sou
rce
Referral
Events
Lists
Q310 vs Q4309 Total Trend &
Status Total Trend & Status
14,000 4,000 10,000 tbd
-/+ %
-/+%
-/+%
Application Stats
Actual
Trend & Status
Apps
Goal
Incr. Conv.
300 TBD
%
12%
Engaged Leads
Current +/-
Rep A
Prior
Rep B
Rep C
Lead Distribution
#
Program A
% of Total
Program B
Program C
Program D
Application Data
Program
Total
+/- Prior Mo
Goal
YTD as of 12/10
Avg. Time to Complete App
# Days % Other Metric Other Metric
PROGRAM NAME
15%
Month
Measurement is Key
38

Technology ROI: Two Sides of Measurement
39
Qualitative
• Governance Model
• Process Improvements
• Being accessible and relevant to all stakeholders
Quantitative
• Capturing all interactions
• Reporting • Pervasive
System Adoption • Change
Management

40
Qualitative
• Brand Awareness
• Relevant and responsive
• Accessible to students
Quantitative
• # Qualified Leads
• Feedback from counselors
• CPC/CPO/CPL • Data analytics
Marketing ROI: Two Sides of Measurement

41
Plan for Continuous Management
Gather Requirements & Set Goals
Configure & Consult
Stakeholders
Test & Get buy-In
Train & Onboard
Evaluate & Optimize

1) Do I have the tools to help me accomplish my enrollment goals?
2) Am I implementing and managing the tools with enough people, planning and process to be successful?
3) Do I know who the right prospective students are for my program/institution?
4) Do I know how I can reach my prospective students?
5) Can I observe the results of my efforts and modify accordingly?
42
Key Success Factors for Successful Student Recruitment

Thank You!
43
Top Related