


Languages
Pages
Legal


NPS ARCHIVE1997.09BRIDGES, M.
NAVAL POSTGRADUATE SCHOOLMonterey, California
THESIS
OPTIMALLY FUNDING ARMY INSTALLATION REPAIRAND MAINTENANCE ACTIVITIES
by
Michael R. Bridges
September 1997
ThesisB8067
Thesis Advisor:" leader:
Robert F. Dell
Gordon Bradley
Approved for public release, distribution is unlimited.


REPORT DOCUMENTATION PAGE Form approved
OMB No. 0704-188Public reporting burden for this collection of information is estimated to average 1 hour per response, including the time for reviewing irLs-truction-s.
searching existing data sources, gathering and maintaining the data needed, and completing and reviewing the collection of information Sendcomments regarding this burden estimate or any other aspect of this collection of information including suggestions for reducing this burden, to
Washington Headquarters services, Directorate for Information Operations and Reports, 1215 Jefferson Davis Highway, Suite 1204, Arlington, VA22202-4302, and to the Office of Management and Budget, Paperwork Reduction Project (0704-0188), Washington, DC 20S03
1. AGENCY USE ONLY (Leave Blank) 2. REPORT DATESeptember 1997
3. REPORT TYPE AND DATES COVEREDMaster's Thesis
4. TITLE AND SUBTITLE
OPTIMALLY FUNDING ARMY INSTALLATIONREPAIR AND MAINTENANCE ACTIVITIES
6. AUTHOR(S)Bridges, Michael R.
5. FUNDING NUMBERS
7. PERFORMING ORGANIZATION NAME(S) AND ADDRESS(ES)Naval Postgraduate School
Monterey, CA 93943-5000
PERFORMING ORGANIZATIONREPORT NUMBER
9. SPONSORING/MONITORING AGENCY NAME(S) ANDADDRESS(ES)
10. SPONSORING/MONITORINGAGENCY REPORT NUMBER
11. SUPPLEMENTARY NOTESThe views expressed in this thesis are those of the author and do not reflect the official policy or position of the
Department of Defense or the U.S. Government
12a. DISTRIBUTION/AVAILABILITY STATEMENTApproved for public release; distribution is unlimited
12b. DISTRIBUTION CODE
ABSTRACT (Maximum 200 words ) The Army's Assistant Chief of Staff for Installation Management (ACSIM)
allocated over $4,862 Billion in 1995 to over 200 Army installations for Repair and Maintenance Activities
(RPMA). However, this allocation and those of the recent past have historically covered only 40 to 70 percent of
total requirements. In response, ACSIM developed an efficient and defensible management paradigm called
Infrastructure Decision Architecture (IDA). The IDA contains a model called the Decision Support Tool (DST)
that projects future infrastructure status given a proposed six year budget, the current infrastructure status, a
funding hierarchy, and an infrastructure priority. This thesis develops a linear program incorporating the goals of
the IDA into an optimization based decision support system, completing the DST. This thesis affords ACSIMdecision makers the following abilities: a projection of the optimal inventory status resulting from a given budget;
the six year annual allocation policy to obtain the optimal benefit; the ability to defend budget needs concerning
desired infrastructure status in the procurement cycle; and the ability to conduct "what lfs" on different budget
strategies and infrastructure end states. Successful model runs for eleven different Major Commands using Fiscal
Year 1996 data resulted in installation infrastructure status projections and annual funding consistent with ACSIMpriorities
14. SUBJECT TERMS
Optimization. Capital Budgeting. Infrastructure Status Report, Decision Support Tool
15. NUMBER OFPAGES
58
16. PRICE CODE
17. SECURITYCLASSIFICATION OFREPORT
Unclassified
18. SECURITY CLASSIFI-
CATION OF THIS PAGE
Unclassified
19. SECURITY CLASSIFI-
CATION OF THISABSTRACT
Unclassified
20 LIMITATION OFABSTRACT
UL


Approved for public release; distribution is unlimited
OPTIMALLY FUNDING ARMY INSTALLATION REPAIR ANDMAINTENANCE ACTIVITIES
Michael R. Bridges
Captain, United7
States ArmyB.S., United States Military Academy, 1987
Submitted in partial fulfillment
of the requirements for the degree of
MASTER OF SCIENCE IN OPERATIONS RESEARCH
from the
NAVAL POSTGRADUATE SCHOOLSeptember 1997


DUDLEY KNOX LIBRARYNAVAL POSTGRADUATE SCHOOLMONTEREY, CA 93943-5101
ABSTRACT
The Army's Assistant Chief of Staff for Installation Management (ACSIM)
allocated over $4,862 Billion in 1995 to over 200 Army installations for Repair and
Maintenance Activities (RPMA). However, this allocation and those of the recent past
have historically covered only 40 to 70 percent of total requirements. In response,
ACSIM developed an efficient and defensible management paradigm called Infrastructure
Decision Architecture (IDA). The IDA contains a model called the Decision Support
Tool (DST) that projects future infrastructure status given a proposed six year budget, the
current infrastructure status, a funding hierarchy, and an infrastructure priority. This thesis
develops a linear program incorporating the goals of the IDA into an optimization based
decision support system, completing the DST. This thesis affords ACSIM decision
makers the following abilities: a projection of the optimal inventory status resulting from a
given budget; the six year annual allocation policy to obtain the optimal benefit; the ability
to defend budget needs concerning desired infrastructure status in the procurement cycle;
and the ability to conduct 'What ifs" on different budget strategies and infrastructure end
states. Successful model runs for eleven different Major Commands using Fiscal Year
1996 data resulted in installation infrastructure status projections and annual funding
consistent with ACSIM priorities

1
JOOHC
VI

TABLE OF CONTENTS
I. ARMY INSTALLATION REAL PROPERTY MAINTENANCE 1
A. BACKGROUND 1
B. ACSIM 2
C. INFRASTRUCTURE DECISION ARCHITECTURE (IDA) 4
/. Installation Status Report (ISR) 4
2. The Hierarchy ofInfrastructure Funding Needs 7
3. Priority ofFacility Category Groups 8
D. PROBLEM DEFINITION 9
E. THESIS ORGANIZATION 10
n. LITERATURE REVIEW 1
1
A. CAPITAL BUDGETING 11
B. MODELING THE DECISION SUPPORT TOOL OF IDA 12
1. Facility Degradation Module 12
2. YATIRP 14
3. Goal Oriented Multiple Criteria Decision Making 14
UL MODELING APPROACH 17
A. MODEL ASSUMPTIONS 17
B. THE MODEL FORMULATION 18
1. Model Sets and Indices 18
2. Data 19
3. Model Decision Variables 20
4. Formulation (Separable byM4COM (m)) 21
a. The Objective Function 22
b. Budget Constraint 22
c. Sustainment Variable Constraint 22
d. Mandatory Sustainment Constraint 23
e. Inventory Balance Constraints 23
C. BENEFIT WEIGHTING 23
/. Weighting ofFCGs with respect to Units 25
D. PENALTY WEIGHTS 26
IV. COMPUTATIONAL RESULTS 27
A. STATISTICS FROM MACOM MODEL RUNS 27
B. DATA 29
1. Indices 29
a. Facility Category Group (f) 29
b Installations (i) 29
c Rating (r) 30
d Tune(t) 30
2. Cost to Improve and Sustain FCGs (costj, r , and scostj, rl) 30
3. Minimum Percent ofFCGs Sustained minesenj,, 32
4. Percentage of Unsustamed Inventory Depreciated to Lower Status 32
5. Starting Inventory 32
6. Data Scaling 33
7. Budget 33
Vll

C. RESULTS FROM MACOM MODEL RUNS 34
7. Inventory Results 34
3. Funding Sustainment ofInventory 36
4. FCG Improvement Funding 37
5. Barracks Improvement 38
V. CONCLUSIONS AND RECOMMENDATIONS 41
A. CONCLUSIONS 41
B. RECOMMENDATIONS 41
LIST OF REFERENCES 43
INITIAL DISTRIBUTION LIST 45
vui
EXECUTIVE SUMMARY
The Army's Assistant Chief of Staff for Installation Management (ACSIM)
allocated over $4,862 Billion in 1995 to over 200 Army installations for Repair and
Maintenance Activities (RPMA). However, this allocation and those of the recent past
have historically covered only 40 to 70 percent of total requirements. In response,
ACSIM developed an efficient and defensible management paradigm called Infrastructure
Decision Architecture (IDA). The IDA contains a model called the Decision Support
Tool (DST) that projects future infrastructure status given a proposed six year budget, the
current infrastructure status, a funding hierarchy, and an infrastructure priority. This thesis
develops a linear program incorporating the goals of the IDA into an optimization based
decision support system, completing the DST. The DST created in this thesis affords
ACSIM decision makers the following abilities: a projection of the optimal inventory
status resulting from a given budget; the six year annual allocation policy to obtain the
optimal benefit; the ability to defend budget needs concerning desired infrastructure status
in the procurement cycle; and the ability to conduct "what ifs" on different budget
strategies and infrastructure end states.
The model uses the current infrastructure inventory status and costing factors from
an Army database, a proposed six year RPMA budget and optimizes the weighted rating,
of the inventory while the following constraints restrict this objective total cost must be
within annual budget limits, all inventory must maintain a mandatory level, and total
inventory is neither created nor destroyed.
ix

Model runs for eleven Major Commands resulted in the optimal funding allocation
strategy and the inventory status projector ACSIM needs to efficiently manage and defend
its budget.

ACKNOWLEDGMENT
I am very thankful for the guidance, coaching, and instruction of Dr. Robert Dell,
Professor at Naval Postgraduate School. His caring attitude and untiring support has not
only made this thesis a rewarding educational experience, he has made it fun as well. I
would also like to thank Kevin Keating ofR&K Engineering for always steering me in the
right direction, and providing the data used in this model. Finally I would like to thank
Stan Shelton, Director of Operations in the Office of the Assistant Chief of Staff for
Installation Management, for taking the time away from his busy schedule to sit down
with me and outline this problem in a clear and concise manner.
XI


I. ARMY INSTALLATION REAL PROPERTY MAINTENANCE
For the United States Armed Services, the reality of the post cold war peace
dividend is a 40 percent reduction in appropriations. The Army Chief of Staff for
Installation Management (ACSIM) manages all Army installations, and the diminished
budget is causing a change of ACSEVI's management paradigm. ACSIM must allocate the
$4,862 Billion annual Army installation operating budget in an efficient and defensible
manner This thesis develops a linear program to help ACSEM determine an efficient six
year annual allocation. These six years correspond to a six year process known as the
Program Objectives Memorandum (POM).
A. BACKGROUND
During the past few years a new strategy of power projection in response to
regional conflicts evolved from the strategy of containing the spread of communism. The
power projection platforms are Army installations acting as command centers, industrial
plants, training facilities, ports, research labs, and home to thousands of soldiers and their
families [ACSIM, 1997] In an environment of shrinking budgets, the operation of these
installations, known as Real Property Maintenance Activities (RPMA), becomes an
exercise in efficient fiscal usage At any of the over 200 installations, a diminishing budget
coupled with constant demands on those dollars creates many new challenges In 1995,
RPMA cost the Army $4,862 Billion Of this total expenditure, Operation of Utilities (J
Account) consumed $1,191 Billion, the Maintenance and Repair of Real Property (K
1

Account) consumed $1,868 Billion, Minor Construction (L Account) consumed $243
Million, and Other Engineer Support (M Account) consumed $1,560 Billion [Department
of the Army, 1996]. (Figure 1)
1995 RPMA Budget $4.862 Billion
$1.56 Billion
M Account
S1.191 Billion
J Account
$243 Million
L Account
$1,868 Billion
K Account
Figure 1. The Army's $4,862 Billion operating budget for Repair and Maintenance Activities is
larger than the operating budget for 22 states. [ACSIM, 1997]. This thesis uses a linear program
to maximize the benefit for all moneys spent in the J, K, L & M accounts.
One of ACSEM's major missions is the procurement and management of RPMA
dollars. Investment in the preservation of infrastructure must compete with all the other
dollar demands in the limited Army budget. The Army RPMA procurement is routinely
between 40 to 70 percent of the projected RPMA requirements. This shortfall creates the
dilemma of what infrastructure to invest in and what to let depreciate.
B. ACSIM
Just before the creation of ACSIM in 1993, the Army published a paper called
Installations: A Strategy for the 21st Century. This paper outlined eight "goals and

objectives for achieving a new installation management paradigm" [ACSIM, 1997]. Since
its formation, ACSIM executes its duties according to these eight goals:
• Reshape installations to meet power projection specifications.
• Formulate soldier and civilian employee programs to enhance the
quality of life, and improve the living and working environment for
soldiers, families and civilians.
• Achieve total integration of environmental stewardship into installation
operations.
• Establish and resource an investment plan for our enduring installations
to revitalize or replace installation infrastructure facilities.
•
•
•
Complete installation-level business process and functional redesign to
off-set the impact of down-sizing and continuing resource constraints,
improve service, and reduce costs of running installations; incorporate a
modernized telecommunications network to support voice, data, and
image services.
Achieve community, inter-service, and interagency partnerships for
facilities and services to improve operations, customer service, and
fiscal effectiveness and efficiency.
Attain resource management flexibility for the Garrison Commander
through policy, procedures, and systems changes that will enable
installations to operate as business activities and maximize the
effectiveness and efficiency of resources.
• Transform the Army's Human Resource programs to build a
participative, committed, installation management team capable of
meeting the uncertainties and technological complexities of a constantly
changing environment. [ACSIM, 1997],
The fourth goal specifically illustrates the need for an efficient plan to maintain and
upgrade installation resources. The current plan, still in its infancy, is called the
Infrastructure Decision Architecture (IDA). The IDA links decisions to future projected
conditions of the installation resources.

C. INFRASTRUCTURE DECISION ARCHITECTURE (IDA)
IDA contains the following major ideas: first, a simple method of measuring and
evaluating the status of infrastructure; second, a funding hierarchy; third, a priority of
infrastructure; and last, a decision support tool that incorporates the first three ideas with a
budget resulting in an infrastructure status forecast for the proposed budget [Shelton,
1996]. ACSIM developed an evaluation system called the Installation Status Report
(ISR) to fulfill the first part of the IDA, but has not fully completed the latter three. The
linear programming model developed in this thesis incorporates the ideas of IDA into an
optimization based decision support system, completing the IDA Decision Support Tool.
1. Installation Status Report (ISR)
ISR is a three part information system intended to provide decision makers an
objective assessment of the status of Army installations with respect to infrastructure (ISR
Part I), environment (ISR Part II), and services (ISR Part III) [ACSIM, 1997] Only the
ISR Part I (Infrastructure) is applicable to this thesis, and therefore future references to
ISR refer to this section Installations report the status of facility category groups (FCGs)
each year. There are currently 217 different FCGs rated in the ISR, examples include
record firing ranges, brigade headquarters buildings, and fixed wing runways. The
infrastructure ISR rates FCGs in both quantitative and qualitative categories.
A "C-rating" provides the qualitative measure of each FCG The user of an
individual facility completes a standardized worksheet resulting in an facility quality rating
of green, amber or red. A loose definition of the three color ratings is as follows: green -
the facility meets all operational standards; amber- the facility is operationally functional,
but does not meet all standards; and red - the facility is substandard and not operationally
functional. The ISR computes the qualitative C-rating by the percentage of FCG rated
green, amber or red at each installation. The rating of C-l is the highest and C-4 the
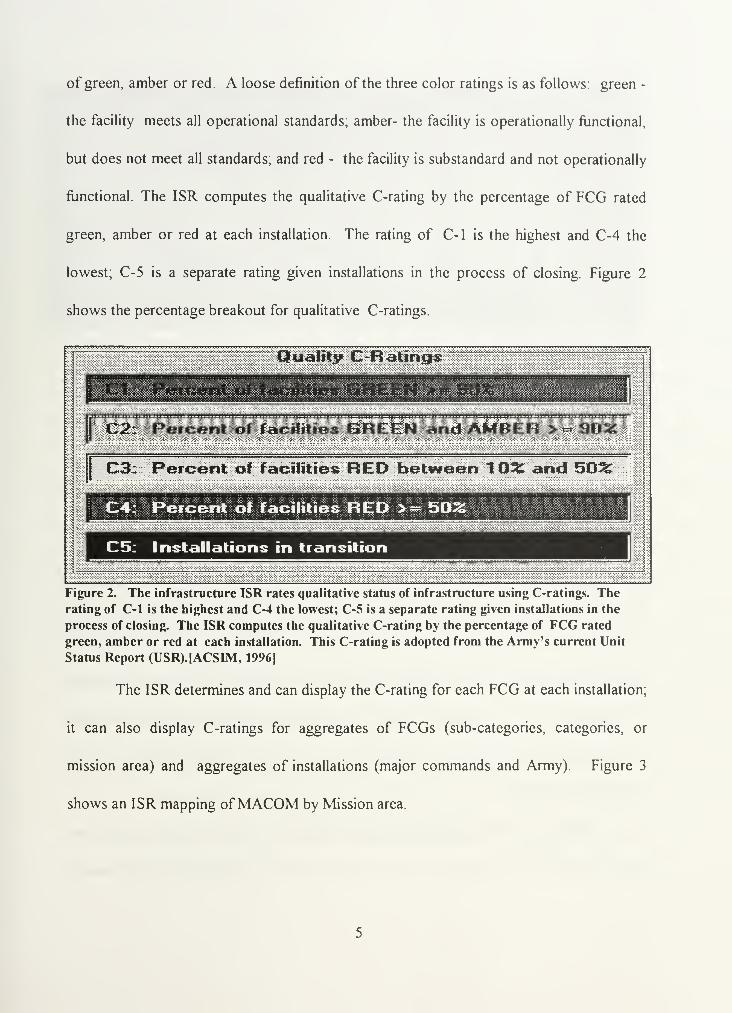
lowest; C-5 is a separate rating given installations in the process of closing. Figure 2
shows the percentage breakout for qualitative C-ratings.
Quality C -R a
t
ing
s
fmM APeteJmtUf * faMjjt&alj .feff*££**U^MM$M,hM i&GbL
C3: Percent of facilities RED between 1 03» and 502£
Percent of facilities RED >« 50%wS™-v!'' :
*': : ::
'
:
'-
: -x ?>?««¥:
C5: Installations in transition
Figure 2. The infrastructure ISR rates qualitative status of infrastructure using C-ratings. The
rating of C-l is the highest and C-4 the lowest; C-5 is a separate rating given installations in the
process of closing. The ISR computes the qualitative C-rating by the percentage of FCG rated
green, amber or red at each installation. This C-rating is adopted from the Army's current Unit
Status Report (USR).(ACSIM, 1996]
The ISR determines and can display the C-rating for each FCG at each installation;
it can also display C-ratings for aggregates of FCGs (sub-categories, categories, or
mission area) and aggregates of installations (major commands and Army) Figure 3
shows an ISR mapping ofMACOM by Mission area

Mnsiort Facilities
~™
—
EUSA
i t i i imn i n i i i i inniiMHi> i»»nH «
M^W4^»*4ta4<
IIMIIIMMM IM Ii
i»««»**4l «»<*««<*) H *» 4i»m *»i>iiJ
44 >**« «MM<*WHU <Mt*H t millll > V II
Routing ComraunitpFaci&tte*
4»*»»W*»»W*W*» *.'*.*,*
.*.*.*.'.*A'
.l,'.)
.
i.
i ".
'. . .
'.
' W < -*;H'W»HU>w i »
Uti&ty Sy$tetns
C3 C3 C3I-C3'ff^B ;•---;: :| .• $§§3§§§§3§g| '
•WWW '••••••••••••'•':J:•
JC3J-C3
FORSCOMC3 \C3 |C3 C3 C3 ' C3
MOWC3 C3 C3 C3 C3
WEOCOMC3 C3 C3
fC3ra
MTMC
»| ffWWWMWwmtw?8 fflmfflmm^^ Kw«wmww?m>ffl« mwwwwwwwaMgaa »&~~~. *»1 1 1 1 1 1 1 1 1 1 1 1 1 II I n I i n i n 1 1 1 1 1 1 1 1 1 1
1
T 1mm 1 1 1 1 1 1 1 1 1 1 1
1
i 1 1 1 1 1 1 h h 1 1 1 1 1 1 n 1 1 1 n I h u H 1
1
H 1 1 1 n h 1 1 1 1 1 1 1 1 1 1 1 1 i 1 1 1 1 i 1 n i i m 1
1
t 1 1 1 1 1 1 1 1 i 1 1 1 ti n t i
'
iV i 1m i n i V i
Figure 3. The ISR rolls up the green, amber, and red FCG ratings showing status as a C-Rating
with a fidelity of installations and the ability to aggregate up to either MACOM or Army level. TheFCGs are aggregated up to sub-category, category and mission area levels. The above rating is a
mapping of mission area by MACOM[ACSIM, 1996].
The ratio of required on-hand permanent and semi-permanent FCG assets
determines the quantitative rating. An example of the quantitative rating is: the Army
Stationing and Installation Plan (ASIP) requires an installation to have X square feet of
barracks space. That installation's Real Property Inventory (RPI) reflects Y square feet
Y ...of barracks available. The ratio of — determines the quantitative C-rating. This thesis
assumes that qualitative issues (improvement and sustainment of inventory) use moneys
from only the J, K, L, and M accounts. It follows then that quantitative issues
(construction and demolition of inventory) satisfied from other accounts are not
considered in this thesis
Included in the ISR database is the cost needed to sustain an FCG at the current
rating, and the cost to raise an FCG to a higher rating. In short, this rating system
provides leaders with the current installation infrastructure status, and a forecast of dollars
needed to maintain and improve the status. The Chief of Staff of the Army approved this
system in July of 1994. The Army conducted a partial ISR in 1995 and a complete Army
survey in 1996.
2. The Hierarchy of Infrastructure Funding Needs
Three cost categories construct the hierarchy of infrastructure funding needs: cost
for minimum essential services and operations, sustainment costs, and improvement costs.
Minimum essential services and operations (MESO) are the
"minimum health, safety, environmental, and repair services to host and
tenant activities in compliance with legal requirements that require funding
in the specific year. If only minimum essential services and operations are
funded, the condition of the infrastructure will eventually deteriorate to the
point where the installation will not be able to meet its mission
requirements" [Wylie and Osgood, 1996].
ACSIM created MESO cost factors for each FCG since realizing that infrastructure
requires a minimum level of funding as long as it is being used, even if it is not sustained at
its current status. A general industry standard for this minimum funding is three percent of
sustainment costs [R&K Engineering, 1996]. Unfortunately, the Army's data on repair and
maintenance does not distinguish between what is needed for the sustainment of
infrastructure and what is essential to the infrastructure. This lack of clarity injects
subjectivity and skepticism into the MESO cost factors, but not the need to have them
The linear programming model developed in this thesis accounts for the minimum funding
required using a MESO factor.

The sustainment and improvement cost factors used in the ISR are the same cost
factors the Army uses in its current requirements generator. The sustainment cost factor
is the amount of money required to keep a unit of an FCG at its current rating. The
improvement cost factor is the money required to raise a unit of an FCG from either red or
amber to green. Note that if a unit ofFCG rated as red is improved, its rating is raised to
green not the next higher rating of amber. These three cost factors create the hierarchy of
funding needs of the IDA.
3. Priority of Facility Category Groups
Since the Army only appropriates about 40 to 70 percent of needed RPMA
funding, it must prioritize infrastructure. ACSEV1 has created a priority listing for all
FCGs for each of the fifteen installation mission types. The fifteen installation mission
types are: administrative support, ammunition production, ammunition storage, base
realignment and closure, commodity commands, depots, industrial bases, major training
areas, maneuver installations, medical centers, ports, professional schools, proving
grounds, reserve component support, reserve component training, and training schools.
ACSIM identifies each installation as performing one mission type and prioritizes each
FCG as either 1, 2, or 3 for every installation mission type. Priority 1 is the most
important and 3 the least important

D. PROBLEM DEFINITION
Installations use a capital budgeting methodology of parceling out sustainment and
improvement funding to infrastructure. This allocation scheme typically under funds the
minimum essential services violating the hierarchy of infrastructure. Strictly enforcing the
hierarchy exhausts the RPMA funds on MESO and sustainment costs, but little or no
improvement is realized. This scheme rarely allows the desired improvement in
infrastructure, and is obviously flawed. A future "balanced approach" allows for all
MESO costs, while allowing sustainment of some FCGs and an improvement for some
percentage of the FCGs. Figure 4 graphically illustrates the three different funding
methods.
C u r r e n t
Strictly Usingthe Hierarchy
B a la n c e d
A pproach
FOCUSINVESTM E N T
• I I Unfunded
Funded
Figure 4. The methodologies for Real Property Maintenance Activities (RPMA) funding allocation.
Currently, installations parcel out funding for infrastructure to each of the three categories.
Funding allocation covers minimum essential and sustainment costs, but little or no improvement is
paid for if the hierarchy is strictly used. A future "balanced approach" allows for all MESO costs,
but some of the FCGs are sustained and some improved. [Shelton, 1996)
The purpose of the IDA is to provide information and decision support for
determining which FCGs to sustain, which to let depreciate, and which to improve The

linear programming model developed in this thesis fulfills the IDA's purpose and affords
ACSEVI:
• a "best case" of future status resulting from a proposed six year annual budget;
• the ability to formulate an allocation policy for RPMA to obtain the maximum
benefit;
• the ability to defend budget requirements concerning desired infrastructure
status in the procurement cycle; and
• the ability to conduct "what ifs" on different budget strategies and infrastructure
end states.
E. THESIS ORGANIZATION
This thesis provides a linear programming model that maximizes benefit for each
dollar spent in repair and maintenance (J, K, L and M Accounts) while adhering to budget,
MESO, and inventory constraints.
Chapter II reviews work related to this model. Chapter III provides the model
formulation and defines the weights used in the objective function. Chapter IV reports the
execution of the model using the 1996 ISR data. Chapter IV also analyses the output of
that model run for several MACOMs. Chapter V provides conclusions and recommends
future work.
10

II. LITERATURE REVIEW
A. CAPITAL BUDGETING
Many Capital Budgeting problems such as the one described in Chapter I have
been documented in the operations research literature. Past models normally maximize the
net present value of assets subject to a funding stream or budgetary constraint. Bradley
[1986] illustrates the benefits of mathematical programming within a decision support
system designed to manage the capital investments of GTE. Bradley's integer linear
program enables decision makers to quickly evaluate the investment alternatives in a given
time horizon by maximizing the net present value of the portfolio. Rosenblatt and
Sinuany-Stern [1989] develop an integer program defining the efficient frontier for a
capital budgeting problem using two objective functions. One objective function
maximizes the net present value of a set of "projects", the second minimizes the risk
associated with each project. Carr [1996] develops a mixed integer linear programming
model to select an optimal procurement strategy for missile defense systems. Carr allows
the budget constraints to be violated by paying a per unit penalty related to the net present
value of money. Goodhart [1997] develops a multi-objective, infinite horizon linear
program to determine multi-year maintenance and repair funding levels consistent with
Naval readiness objectives. Goodhart allows violation of the budget constraint through a
parameter correlated to the decision maker's willingness to borrow money for the
reduction of long term net costs.
11

The model developed in this thesis uses a budget constraint similar to Carr and
Goodhart, and a weighting to combine the multiple net present values of the different
facility category groups into one objective function, similar to Rosenblatt and Stern. The
resulting model allows decision makers at ACSBVI the ability to evaluate different
allocation strategies in a timely manner. The remainder of this Chapter reviews several
models created to fulfill the requirements of the Army's EDA support tool.
B. MODELING THE DECISION SUPPORT TOOL OF IDA
R&K Engineering [1996], under contract from ACSEM, developed the Facility
Degradation Module to "predict the effect of funding increases and decreases on the
condition of FCGs at the installation, MACOM, and Army-wide organizational levels".
The US Army Concepts Analysis Agency [1996] developed the Yearly Analysis of
Technology for Installation Readiness (YATIRP) as an analytic methodology to prioritize
and evaluate investments in infrastructure. Lastly, Lind [1995] developed a model for
goal oriented multiple criteria decision making that maximizes a decision maker's goals for
repair and maintenance projects .
1. Facility Degradation Module
The Facility Degradation Module (FDM) computes the rate of deterioration or
improvement of individual FCGs The user inputs the ISRs current inventory status of all
FCGs, the sustainment and improvement costs, and a funding allocation for each
individual FCG. The FDM computes the FCG degradation/improvement rates with two
12

different algorithms. The first algorithm calculates the degradation rate as the ratio of
annual recurring maintenance costs to annual sustainment costs. FCGs without annual
recurring maintenance cost factors are assumed to have an industry standard 3%
degradation rate. The second algorithm compares 1996 ISR survey results with 1995
results for facilities that were inspected in both years. Renovation costs, sustainment costs
for 1995, sustainment cost factors, and the actual expenditures for 1995 are inputs for a
degradation rate equation of the form:
R = '96 ^95
c
where Cc* is the renovation costs for that year, S is the total sustainment cost and F is the
actual total expenditures for 1995. The degradation rate (R) is computed for each FCG
for both overseas installations and continental US installations. The average of both
methods provides the overall rate of change, increase/decrease, of infrastructure over
time.[R&K Engineering, 1996]
The FDM does not meet all the needs of the Decision Support Tool for the IDA,
since it requires annual funding allocations for each FCG and has no method to generate
them The FDM is created as an infrastructure condition projector of the IDA, not as the
DST
2. YATIRP
YATIRP is a spreadsheet based optimization model designed to deliver an
allocation methodology that arrives at a fixed end state in the shortest time, while
13

maintaining budgetary constraints. The model user inputs the desired end state C-rating
for each FCG, and the annual amount of funding and/or the funding time frame to achieve
the investment goal. The model maximizes the annual gain in benefit while maintaining
budgetary constraints. The benefit scores in the model are a mapping of C-ratings to
score. A C-l is scored as a six, a C-2 scored as a five, a C-3 scored as a three, and a C-4
is zero. The benefit gain is the difference between the C-l score and the current rating
[US Army Concepts Analysis Agency, 1996],
This model does not incorporate a direct sustainment cost, rather the sustainment
cost is rolled into the improvement cost. The model ignores any depreciation of
unsustained inventory, and inventory may be totally unfunded with no penalty. Since the
objective function is calculated from the change in C- ratings, and the definition of C-l is
90% or more of all FCGs must be green, YATIRP's optimal solution should always leave
10% of the inventory in a status other than green. YATIRP's time horizon is routinely
over seven years because it takes longer to accomplish the decision maker's C-rating
goals. ACSEM's ability to accurately forecast RPMA budgets for these long time lines is
limited. Although a step in the right direction the YATIRP does not meet the
requirements of the Decision Support Tool of the IDA.
3. Goal Oriented Multiple Criteria Decision Making
While not an attempt to model the IDA's decision support tool, Lind's thesis
develops a goal oriented infrastructure management process for the US Army to aid
decision makers in the allocation of infrastructure funding at the installation, MACOM and
14

Department of the Army levels [Lind, 1995]. This model requires surveys identifying the
management goal of commanders from the installation level up to and including ACSIM.
A budget decision is implemented following a complex logic scheme. Some of the
assumptions of this scheme are that project budgeting is only considered for one year,
projects cannot be partially funded, and projects with a higher dollar requirement for
sustainment or renovation are of higher importance. The latter assumption injects weak
logic into the model. A higher sustainment cost producing a higher importance of the FCG
causes FCGs like golf courses to rank above rifle ranges. While this model could be an
excellent tool for the installation level, the complexity and certain logic used causes this
model to fail to meet the requirements of the EDA decision support tool.
15

16

III. MODELING APPROACH
This chapter presents a linear program to determine an optimal allocation, and
projected inventory status for Army Repair and Maintenance Activities (RPMA) The
model uses the infrastructure inventory status, and costing factors generated from the
current ISR, and a proposed budget for each MACOM generated from the POM. The
model optimizes the weighted rating of the inventory while the following constraints
restrict this objective:
• total cost must be within yearly budget limits;
• all FCGs must maintain a mandatory sustainment level; and
• the inventory ofFCGs is maintained (none is created nor destroyed).
A. MODEL ASSUMPTIONS
The model uses the following simplifying assumptions:
• MACOMs allocate RPMA moneys from the pooled total of the J, K, L,
and M accounts. This model treats the total of the J, K, L, and M accounts
as one RPMA appropriation. The model pays for all changes in
infrastructure quality from this total.
• Money allocated for one MACOM's RPMA may not migrate to another
MACOM
• The inventory of infrastructure is continuous A Central Wash Facility's
unit of measure is 'each". Spending 50% of the required sustainment cost
results in half of the central wash facility being sustained, and a percentage
of the unsustained inventory depreciates to the next lower rating The
same logic applies to the improvement of inventory. An allocation of a
17

fraction of the central wash facility improvement cost results in the same
fraction of inventory improved.
B. THE MODEL FORMULATION
This section defines the sets, indices, data, variables and the mathematical
formulation of the model.
1. Model Sets and Indices
• f Facility Category Group (FCG) {e.g., impact areas, indoor firing ranges, bank}.
ACSEVI has defined 217 FCGs with units of measure ranging from acres to square
yards to firing points The model uses a six digit alphanumeric identifier for each
FCG
• i Installations - the names of all the Army installations {e.g., Carson, Benning} The
model uses the five digit alphanumeric Installation Number (INSO).
• m MACOM name of major command {e.g., Military District-Washington, AMC }.
• p Mission type - primary mission of the installation {e.g., training, maneuver}
ACSIM has defined fifteen different installation mission types.
• r Rating - the rating of infrastructure as defined in the ISR {green , amber, red}.
• t Time - year of the budget planning cycle { 1,2,3,4,5,6,7} Years one through six
are the six years of the POM, year seven is the model's end state after six years of
spending
• Im the set of all installations belonging to MACOM (m)
18

• Ip the set of all installations having mission type (p).
2. Data
• wght f, j, r ,, The benefit for a unit of an FCG (f), on installation (i), of category
rating (r), for year (t). units = [benefit/unit of FCG]
• scaledatar The scalar for each FCG used to create parity in the objective function
among the heterogeneous set ofFCGs.
• pen, The penalty for exceeding the annual budget by one dollar in year (t).
units = [-benefit/Then Year$].
• scost f, ;, r ,, The cost to sustain one unit ofFCG (f), on installation (i), at rating (r), in
year (t). Money spent in year (t) maintains a rating (r) in year (t+1).
units = [Then Year$/unit of FCG].
• cost f, ;, r ,, The cost to raise a unit of FCG (f) , on installation (i), from rating (r) to
green, during year (t). The money spent to upgrade in year (t) results in a green
rating in year (t+1); The cost to raise one unit of FCG is in addition to the cost to
sustain the same unit ofFCG in year (t). units =[Then Year$/unit of FCG].
• budget m ,, The budget for repair and maintenance (J, K, L & M accounts) allocated
to MACOM (m) in year (t) units = [Then YearS]
• minesene,Si ,, The funding required for an FCG (0 on installation (i), in year (t)
units = [Then Year$/unit of FCG].
19

• perclossr.i, t The percentage of non-sustained inventory ofFCG (f), at installation (i),
that depreciates from rating (r) to (r+1) in year (t). Inventory not sustained degrades
to rating (r+1) in one year at a rate equal to non-sustained inventory times percloss.
• valuer, pthe priority given an FCG for each mission type p. The priority is either
one, two, or three. This data is used in the calculation of the weighting benefit wght
parameter.
3. Model Decision Variables
• INV r, i, r ,, the amount of inventory of FCG (f) on installation (i), in rating (r), at
beginning of year (t). The level of inventory at the beginning of year one (t=l) is data.
• CINV f, i, r ,, the inventory of FCG (f) on installation (i), increased from rating (r) to
rating green, during year (t); the green rating is realized in beginning of year (t+1).
• SUSf, i, r , t the inventory of FCG (f), on installation (i) sustained with funding in year
(t). The inventory sustained maintains an (r) rating into year (t+1), the inventory not
sustained depreciates at a rate equal to the amount of unsustained inventory multiplied
by perclossf,j, t .
• OB m,, the dollars spent on repair and maintenance over the allocated annual budget
for MACOM (m) in year (t).
20

4. Formulation (Separable by MACOM (m))
objective function
Equation( 1
)
Maximize ^ wghtf,i,r , tIN
V
f> j, r ,, - ^T pen, OB m>t
f.i.r.t>l. m,t>l
budget constraint
f SUS^
Equation(2): ^ scostf,,, r, t
^JlL_ + ^ cost f, i, r , t CINV f, ( , r ,, + OB m ,,_
f, ielm. r V Pel"
C '0SSf, ,, t ^ f, i6lm, r*green
< budget „,, t+ OB m ,,
Vm, t<7
sustainment variable constraint
Equation(3): SUS r, s , r ,, < percloss f, ,,
, INV f, j, r,, V f, i, t < 7
mandatory sustainment
Equation(4): V SUS f, it r , t> minesen ^ i, t
* percloss f, ;, tV f, i, t < 7
r
inventory balance constraints
Equati0n(5): INVf, j,r=green, t= INVf, j^green, t-1 (
1 " perdOSSf. i. t-1 ) + SUSf, i,r=green, t-1
+ X dNVfii)M, V f, i,t>l
rxgreen
Equation(6): INVfj^amber^INVf^^^ber,,.^!- perclosSf,,,,.i)+ SUSr.j.r^ber.t-i +
perclOSSf,,.t.l INVr,i, r=green,t-l - SUSf.j.^green.l-l - CINVr,i,r=„tlber.(-l V f, i, t>l
Equation(7): INVf, i,r=r*d. ,= INV f. ur=reii , M + perclossf. ,. ,.i INV f, i.r=amber.ii - SUSf,i,,«Mber,i-i
-CINVr.i,^,,., Vf, i,t>l
INVrirl ; SUSrirt ; CINV r , r , ; OB, >0
21

a. The Objective Function
The objective function, Equation(l), ensures the limited dollars available
are spent on the most beneficial FCGs for all installation types each year. If more dollars
are spent than budgeted, the objective function is penalized for going over budget. The
units of the objective function are benefit.
b. Budget Constraint
The dollars allocated to sustain inventory at rating (r) plus the amount
allocated to raise inventory from (r) to green must be less than total amount budgeted for
each MACOM every year. The variable OBm ,, allows violation of this constraint by
paying a per unit penalty of pent .
c. Sustainment Variable Constraint
Equation (3) ensures the sustainment variable is less than or equal to the
inventory of the FCG multiplied by the percent of depreciation of unsustained inventory,
perclossf,,,,. The model restricts the sustainment variable to control inventory in the
inventory balance constraints (5, 6, 7). For example, if an FCG's inventory is 100 units,
and the percloss parameter is 3%, then the sustainment variable is constrained to 3 units or
less The amount of inventory sustained is the sustainment variable divided by the percent
loss parameter
22

d. Mandatory Sustainment Constraint
Equation (4) ensures that a minimum amount of all FCGs are sustained.
e. Inventory Balance Constraints
Equations (5, 6, 7) conserve the inventory of FCG (f), at installation (i).
These equations account for the change in inventory status caused by improvement,
sustainment, and depreciation, while ensuring no inventory is created or destroyed at any
installation.
C. BENEFIT WEIGHTING
The weights, wghtf;j,r,t dictate how the linear program prioritizes spending
ACSIM, in conjunction with the MACOMs, ranked each of the 217 FCGs "1", most
important, to '3" least important, based on the mission types. For example the FCG
'Family Housing" has a ranking of "1" for installations with a training mission, a ranking
of '2" for installations with a proving grounds mission, and a ranking of '3" for
installations with a professional schools mission. The valuef,pparameter captures this
ranking A mapping of the value^ parameter (f by p) with the set of installations having
mission type (i by p) creates the value of an FCG to a installation (f by i). The parameter
valuef., helps create weight for FCG (0 at installation (i) in rating status 'green" in year 1
using the formula:
Wghtf-.u-grecn.,-! = ;
valuefl
23

The formula:
calculates weight in the dimension of (r). The ordinal of r is one for green, two for
amber, and three for red. The resulting benefit weights and the respective gain in benefit
for improvement from a lower status to green is illustrated for year 1 in Table 1
.
Weights Gain
Priority Green Amber Red Amber-Green Red - Green
1 1.000 0.640 0.512 0.360 0.488
2 0.500 0.320 0.256 0.180 0.244
3 0.333 0.213 0.171 0.120 0.163
Table 1. The benefit weight for all FCGs in year 1. The gain columns illustrate
the gain in the objective function for each unit of FCG improved from amber to
green and from red to green.
The gain in benefit for improving priority 1 FCGs is larger than the gain from
priority 2 and the gain from improving priority 2 FCGs is larger than priority 3 FCGs.
This logic creates the desired allocation methodology of sustaining and improving priority
1 FCGs before priority 2 FCGs and sustaining and improving priority 2 FCGs before
priority 3.
The weighting parameter is depreciated over the seven year time horizon using the
formula:
wghtf.,.r .,= wghtf,i,r,n
*^Cardinality of (t) - (ordinal of (t) - 1)^
Cardinality of (t)
This depreciation ensures the model increases the most important FCGs in the earliest year
possible
24

1. Weighting of FCGs with respect to Units
The above weighting scheme guarantees parity among FCG of like rating and
priority only if the FCGs are a homogeneous set. However, the set of units is very
heterogeneous, for example 'each', firing points, square yards, miles, millions of British
thermal units are some of the many FCG units. Of the 217 FCGs there are seventeen
different units of measure. The units create a weighting by the difference in magnitude
between them. For example, the FCG surfaced roads has units of square yards. The
model pays $14.74 to improve a square yard from amber to red. The majority of
installations have hundreds of thousands of square yard of surfaced roads. For the purpose
of this example we say installation (i) has 100,000 square yards of inventory. The FCG
multi-purpose range complex (mprc) has a unit of measure of 'each'. The model pays
$1,491,507.73 to improve each complex from amber to red. There is only one mprc on
the example installation (i). Both of these FCGs are ranked priority 1 for an installation
with a maneuver mission. If the model had $1,491,507.73 budgeted and only these two
FCGs to consider, the model would gain a total of 36,000 units of benefit from improving
all 100,000 square yards of surfaced roads and only 0.36 unit from improving the one
mprc from amber to green. The surfaced road's numbers of inventory, and its much
cheaper improvement cost, implicitly increase its weight over an mprc by 100,000 times,
even though both FCGs have the same calculated weight The parameter scaledatar
dampens the extreme differences by dividing into the calculated weight parameter This
calculation manipulates the inventory numbers to be in the hundreds. In the above
25

example the weight for surfaced roads is divided by a scaledata value of 1,000 and the
mprc weight is divided by a scaledata value of 0.01 thereby artificially changing the gained
benefit to 36 units for both FCGs.
D. PENALTY WEIGHTS
The penalty in the objective function allows violation of the budget constraint
which keeps the model feasible during 'What if analysis. For example, fixing the FCG
Family Housing at 100% green by the seventh year, while only paying the mandatory
sustainment on all other FCGs may require more money than budgeted in the POM. The
elastic constraint can determine "How much more money is needed to execute the 100%
green Family Housing scenario".
The penalty weights act as a 'toggle" switch for the model, turning on or off the
over budget variable, OBt . If the weight of the penalty is greater than the gain in benefit
for improving inventory status, the model will only create a positive over budget variable
to maintain feasibility. If the gain in benefit is greater than the penalty incurred, the model
'borrows" money via the over budget variable. The standard model set up for this penalty
is as follows: the standard penalty parameter pen, is fixed at 0.1; and the model requires
repayment of the OB, variable by the end of POM cycle. These two settings ensure no
money is borrowed unless the proposed budget is not large enough to maintain feasibility.
The exploration of 'What ifs", concerning how much more money is required to
accomplish a set task, requires a relaxation of the payment of the OB, variable, and a
decrease in the penalty.
26

IV. COMPUTATIONAL RESULTS
This chapter presents an implementation of the DST formulated in Chapter III for
eleven MACOMs. The linear program uses inventory data from the first ISR conducted in
1996, and budget data from the 98-03 POM. R&K Engineering, Inc. provided the ISR
data on a Microsoft Excel spreadsheet format. The model, coded in General Algebraic
Modeling (GAMS) [Brooke, Kendrick, Meeraus, 1992], uses a manipulated form of this
data as input.
A. STATISTICS FROM MACOM MODEL RUNS
The eleven model runs executed for the MACOMs with complete data are as
follows: Army Material Command (AMC), Forces Command (FORSCOM), Military
District Washington (MDW), Medical Command (MEDCOM), Military Traffic Command
(MTMC), Training and Doctrine Command (TRADOC), US Army Corps of Engineers
(USACE), US Army Reserve Command (USARC), US Army Europe (USAREUR), US
Army Pacific (USARPAC), and the US Military Academy (USMA). The three MACOMs
without complete data are the National Guard, Eighth US Army, and US Southern
Command. The initial look ISR cataloged the inventory status of only 189 installations.
Many National Guard installations did not participate in this ISR Many Eighth US Army
installations double reported FCGs, corrupting its data set. US Southern Command is
transitioning from installations in Central America, and did not participate in the 96 ISR.
27

Model runs come from either an IBM compatible PC with a 486DX4100
processor with 16 Megabytes of Random Access Memory, or an IBM RS/6000 Model
590 workstation. Table 2 lists the computational statistics from running the models using
the OSL solver [Wilson and Rudin, 1992]. The average MACOM size is 11.18
installations.
MACOM Nutiher of Computer lumber of Nnmber rf Generation Exeami Sohelime
ktsbiutKjns Used Constants Variables Tine
(CPUSEQ45.98
Tine (CPU
SEQ57.45
(SEQ
AMC 22 RS/6000 66,283 89,953 4,799.00
FORSCOM 19 RS/6000 71,869 97,534 48.17 59.38 6,398.00
MDW 5 486 14,497 19,672 23.30 29.10 1,060.00
MEDCOM 3 486 10,381 14,086 15.30 19.70 706.00
MTMC 1 486 1,687 2,287 2.36 3.29 14.51
TRADOC 16 RS/6000 63,973 86,818 42.82 52.68 4,954.00
USACE 1 486 805 1,090 1.16 2.13 4.39
USARC 14 RS/6000 22,267 30,217 13.82 19.25 385.72
USAREUR 36 RS/6000 108,619 131,893 70.77 89.46 19,462.00
USARPAC 8 RS/6000 26,005 35,290 15.55 19.78 708.73
USMA 1 486 4,039 5,479 5.55 7.47 75.63
Table 2. The computational statistics of the eleven MACOM runs. Model runs come from
either an IBM compatible PC with a 486DX4100 processor with 16 Megabytes of RAM, or an IBMRS/6000 Model 590 workstation. Solution time ranges from 4.39 seconds to 5 hours 24 minutes.
Upon finding an optimal solution, the model creates three comma delimited files
for the results. The files are the status of inventory of all FCGs for all seven years, the
funding required for improving inventory to green for the six years of the POM, and the
funding for inventory sustained for these six years. The comma delimited files allow use
of spreadsheets to store, analyze, and graph the results.
28

B. DATA
1. Indices
The indices control the dimensionality of the parameters and variables. The FCGs
(f), rating (r), and time (t) are all unchanged for each of the MACOM runs. The
installations (i) vary by MACOM.
a. Facility Category Group (f)
The model uses the six digit alpha-numeric FCG code to catalog the 217
different FCGs. The set of FCGs has 17 different units of measure. Table 3 shows a small
subset of the FCGs.
FCG CodesF17893
FCG NameSquad Defense Ranges
UMFP
F 17894 Infantry Battle Courses FP
F17898 MOUT Assault Courses EA
F17921 Demolition/Flame Ranges EA
F17977 Engineer Qualification Range EA
F17995 MOUT Facilities (Non-Live Fire) SF
Table 3. A small subset of the 217 FCG codes. The model uses the six digit FCG Code to
control the dimension of the parameters and variables. These codes remain unchanged for each
MACOM model run.
b. Installations (i)
The model uses the five digit alpha-numeric installation number (INSO) to
catalog the 189 different installations which participated in the initial 1996 ISR Table 4
29
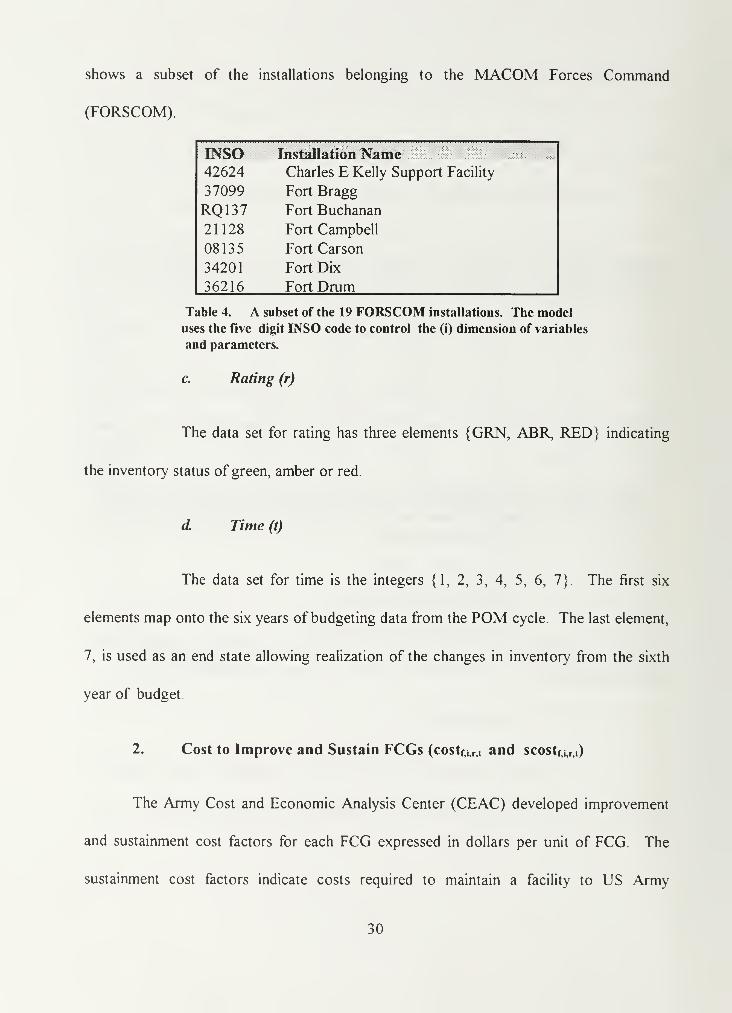
shows a subset of the installations belonging to the MACOM Forces Command
(FORSCOM).
INSO Installation Name42624 Charles E Kelly Support Facility
37099 Fort Bragg
RQ137 Fort Buchanan
21128 Fort Campbell
08135 Fort Carson
34201 Fort Dix
36216 Fort Drum
Table 4. A subset of the 19 FORSCOM installations. The model
uses the five digit INSO code to control the (i) dimension of variables
and parameters.
c. Rating (r)
The data set for rating has three elements {GRN, ABR, RED} indicating
the inventory status of green, amber or red.
d Time (t)
The data set for time is the integers {1, 2, 3, 4, 5, 6, 7}. The first six
elements map onto the six years of budgeting data from the POM cycle. The last element,
7, is used as an end state allowing realization of the changes in inventory from the sixth
year of budget.
2. Cost to Improve and Sustain FCGs (costr,j, r,, and scostf,i, r<t )
The Army Cost and Economic Analysis Center (CEAC) developed improvement
and sustainment cost factors for each FCG expressed in dollars per unit of FCG The
sustainment cost factors indicate costs required to maintain a facility to US Army
30

standards and include cyclic/routine maintenance and major component replacement
[Wylie and Osgood, 1996]. The sustainment cost factor is an aggregate of historical FCG
maintenance expenditures for all installations in the continental United States. The four
dimensional scostf,i, r , tparameter is equated to the one dimensional CEAC sustainment cost
factor. The scostf,i,M is inflated over the time horizon using the equation:
scostf^t+i = scostf,;, r , t* (1 +inflationrate).
For this model the inflation rate for all costs is assumed to 7% annually.
The improvement parameters costf.,,r , tare inflated in the same manner, however,
CEAC derived the improvement cost factors in a different manner. CEAC first developed
new construction cost factors. CEAC's new construction cost factor algorithm uses an
'Unadjusted empirical unit cost for a specific FCG times an inflation factor times the
technological adjustment factor times a cost data reliability factor times a contingency
factor (recognizing that all construction requirements cannot be foreseen) times a
supervision and administrative factor times a support facility factor and where appropriate
times a demolition factor'^Wylie and Osgood, 1996]. The improvement cost factors are
expressed as a percentage of new construction costs required to correct red and amber
facility conditions. In general 75% of the new construction costs are used for
improvement of red inventory, and 25% of the new construction costs are used for
improvement of amber inventory. The model reads the cost data in from two space
delimited text files
31
3. Minimum Percent of FCGs Sustained minesent ,,
The MESO factors described in Chapter I are not used for the minesenf,i >t
parameter, rather the industry standard 3% of the sustainment cost is used for the model.
The MESO factors ACSEM developed are still being verified. Future model runs should
use the finalized MESO factors as the minesenf,;^ parameter.
4. Percentage of Unsustained Inventory Depreciated to Lower Status
The perclosSf,,, t parameter is derived from the industry standard 3% annual
depreciation of infrastructure. The model uses 3% as the base value for the parameters
and adjusts according to specific usage of the FCG. For example the Family Housing
FCG perclosSf,,, t is set at 5% because the high usage. The perclosSf,,, t parameters were
calculated from subjective reasoning and experience of this modeler. The values range
from 2 to 5 percent. The data in this file can easily be changed.
5. Starting Inventory
The data used for the beginning inventory is the status of inventory from the initial
1996 ISR survey. R&K Engineering provided this data in the form of Microsoft Excel
spreadsheets. The data from the ISR is in the dimensions of FCG, installation, and rating.
The four dimensional inventory variable INVf.,.r,,= iis fixed equal to the starting inventory
data
32

6. Data Scaling
The scaling parameter discussed in Chapter III provides parity among FCGs of the
same priority.
7. Budget
The budget is the sum of money form the J, K, L, and M accounts as prescribed by
the 98-03 POM. These sums are in 'then year" dollars. Table 5 lists the POM 98-03
RPMA appropriation requests in thousands of "then year" dollars.
1998 1999 2000 2001 2002 2003
AMC 153,579 131,248 155,724 171,119 156,922 174,041
PORSCOM 517,273 594,385 588,601 597,480 652,610 665,340
MDW 117,375 102,820 100,450 107,500 107,660 130,267
MEDCOM 29,033 25,503 26,322 26,472 26,880 29,971
MIMC 29,705 19,038 4,269 4,491 4,590 4,656
TRADOC 490,612 426,550 521,073 406,457 491,500 564,746
USACE 10,629 5,252 5,417 5,576 5,5% 5,616
USARC 153,579 131,248 155,724 171,119 156,922 174,041
USAREUR 365,724 341,239 359,881 370,597 401,444 469,825
USARPAC 203,744 162,970 168,403 175,128 194,446 203,857
USMA 56,218 61,011 53,647 55,500 65J60 59,130
Table 5. The total of the J, K, L and M Accounts. This model assumes the allocated moneycan be used for any RPMA expenditure. The above sums are in then year thousands of
dollars.
33

C. RESULTS FROM MACOM MODEL RUNS
1. Inventory Results
The obvious question a decision maker asks is 'What do I gain from this model?".
One immediate answer to this question is the ability to project the status of infrastructure
out seven years. This projection allows the decision maker to see the high priority
inventory migrate to green. It also shows the decision maker how much, if any, the lower
priority inventory depreciates. The following illustration shows the migration of square
yards of fixed wing runway for TRADOC installations. Figure 5 shows the increase in
green inventory for Fort Benning- 13077, Fort Bliss-48083, Fort Eustis-51281, Fort Knox-
21478, Fort Leavenworth-20491, Fort Leonard Wood-29977, Fort Monroe-51585, Fort
Rucker-01767, and Fort Sill-40801. Eight of the ten listed installations have training
missions, Fort Leavenworth is a professional school and Fort Monroe is an administrative
installation. The training installations rank Fixed Wing Runways as priority 1, while Fort
Monroe's administrative mission ranks this FCG as priority 2, and Fort Leavenworth's
professional school mission ranks this FCG a priority 3. The X axis labeled status.year
uses a two tupple combining rating and year. GRN. 1 indicates the green inventory' in year
1 Figures 6 and 7 show the migration of inventory out of lower status.
34

F/W RUPway* fprTrariQr 700,000
600,000
500,000>>
400,000 o
300,000 «
200,000
^"IT100,000
Status.YearI
inh- r- oo
®S3sBfc CO°^ CD h-i- 00 'V00 CM i-(N 'fr CM
20491
129977
'
in ^In
Installation
3 *O
z -^ £: 5 «-q: Z o oo in
o
Figure 5. The migration of fixed wing runway inventory to a green status in TRADOCinstallations. This graph gives the decision maker the ability to visualize the gain realized by each
installation in TRADOC with an inventory' of fixed wing runways. The crossed hash marks in each
of the inventory ribbons indicate the year of the modeling horizon. This allows the decision makerto quickly see in which year the improvement is made.
250,000
200,000
g 150,000
I 100,000-1
50,000
Status.Year g
Amber F7W Runways at Tradoc
Installation
Figure 6. The migration of inventory out of the lower amber status. The decision maker
can sec during the first year the model improved fixed wing runways at priority 1
installations, the third year improved the inventory with priority 2 and in the sixth year
the priority 3 ranking is finally improved.
35

Red F/W RunwayatJ
600,000 -,
500,000
400,000
Inventory 300,000
200,000 ^S^~"^ i - aWs£&ii'-i*Z*&** m '-' on
100,000 ^^^^_ '^si&afei'-'' n m nJ&gs^^ ,_ r-. in *-
55
LLI O iJ ^ CO 1-cc lu Q ^ ° S
en £ S cm00 * CMCM ,—
Installation
Status.Year * £ S R "OH "-
Figure 7 The projection of red inventory over the seven year time horizon. The model
improved the priority 1 red inventory during year 5, one year prior to improving the
priority 3 amber inventory.
The above three figures show a common result of most standard model runs. The
model predominantly calculates a better gain by increasing larger amounts of inventory
from amber to green before the gain from increasing smaller amounts of inventory from
red to green. This outcome is the result of the improvement cost factors; the cost to raise
a unit from red to green is 300 percent more than the cost to raise the same unit from
amber to green.
2. Funding Sustainment of Inventory
The logical follow on question to what gain is achieved is 'How much does the
gain cost 9" The DST calculates the money spent on sustainment for every FCG Table 6
is a small subset of the MACOM Military District Washington (MDW) sustainment
funding The funding is specified for each of the six years of the budget for each status
36

rating annotated by the column headings. GRN. 1 indicates the data in this column is for
green inventory during year 1
.
FCGSF85120F85120F85210F85210F85210F85210
Installations51 06224571
mmm$707
lnstal!attons?&£;9&!51062 $_0
24571 _$_051389 $.0
51062 $_0
11564 $_0
24571 £456
Table 6. The amount of money spent on each FCG at each installation for sustainment of
inventory'. The above installations are from the MACOM Military District of Washington.
The above table is a subset of the total data table
Year seven is not cataloged because there is no funding allocated during year seven, rather
the results of funding allocation in year six are realized as changed inventory in year seven.
The data set shows this information for all inventory in all rating statuses
4. FCG Improvement Funding
Like the sustainment funding data, the model stores the money spent to improve
the FCGs to green. This data set has the same two- tupple column headings Table 7
shows a small subset of this data for the MACOM MDW.
37

FCGS Installations ABR.1F85100 24571 $0
ABR.2$0
ABR.3
$0
ABR.4
$0
ABR.5$4,230,011
ABR.6
$18,881,958
F851Q0 51602 $0 $0 $0 $0 $0 $772,972
F85120 5138$ $9,038 $9,670 $10,347 $11,071 $11,846 $12,676
F8S120 51062 ! $372,415 $10,114 $10,821 $15,068 $16,123 $17,251
F8512G 24571 $377,833 $7,838 $8,387 $9,157 $9,798 $10,484
F$52io mim . $0 $0 $0 $0 $0 $0
FCGS tirtstaliatktfus RED.1
F85100 24571 $0
RED.2$6
RED.3
$6
RED.4
$0
REDS$6
RED£$6
F85100 51602 $0 $0 $0 $0 $0 $0
FS5120 51380 $0 $0 $0 $0 $0 $0
F85120 51062 $0 $0 $456,517 $0 $0 $0
F85120 24571 $0 $0 $23,964 $0 $0 $0
F85210 51389 $0 $0 $0|
$0 $0 $0
Table 7. Some of the funding allocated for FCG improvement from amber to green and from red to
green.
This cataloging of optimal allocation affords ACSDV1 the ability to give the MACOMs
guidance on how to spend the RPMA dollars. This guidance has never before been given
in such detail. The MACOMs usually receive guidance in the form of improving one type
of FCG. For example, the Joint Chief of Staff (JCS) states the importance of the soldier's
barracks, and he would like to see all the barracks improved to a high standard. A third
attribute of this model is the ability to analyze the effects of such an improvement.
5. Barracks Improvement
The following example shows the effects of forcing 100 percent of the barracks
inventory at USARPAC's Forts Waignwright, Richardson, Schofield Barracks, and Fort
Shafter to a green status by the beginning of year seven Figure 8 shows the green
inventory of barracks at the four installations after a standard model run without
38

mandating the 100 percent green status, while Figure 9 shows the same inventory after
100 percent of the barracks inventory has been forced to green status by year seven.
PACOM Barracks Green
nt*arcrr\un ...
1030i
930
830
£* 730 ]"^^^^^^^LJjjy'ws^^^
o 1 i^^*c*^2^^^^P^t*^» i
c 630-0)>c 530
430
330 ™ CO
230 HP" to J° Installation^™^*«®ffl888888ras «ra»r r-^ ^
1 i^^ + > (D t^ T-
1 2 ° 4 e: ^ fv. ,_D 6 7in CN
year CD(N
Figure 8. The depreciation of barracks space in a green status. All four installations
prioritize barracks inventory as 1, but the model can not maintain all the priority 1
inventory with the proposed USARPAC RPMA budget.
The model obtains these forced results by one of two means. First, the model
could calculate the amount of over budget money required to execute this additional
increase in inventory. Second, the model could calculate the improvement in barracks
inventory by decreasing the amount of improvement or sustainment of another inventory.
This excursion maintains the penalty and end state of over budget at the standard 1 and
respectively, ensuring the model does not go over budget.
39

oc0)>c
-Green Statue-,
15788
15776
2736 Installation
year
Figure 9. The status of green barracks inventory after the inventory is fixed at 100
percent green at year 7. Not shown is the significant effect this mandate has on other
FCGs. 53 FCGs show a greater than 20% loss in green inventory.
The total cost to improve the current barracks conditions to a green status at these
four installations is $163,050,642 in 1996 dollars. This dollar amount equates to over 14
percent of the total six year RPMA budget for USARPAC, or between 80 to 100.1
percent of the annual USARPAC RPMA allocations. Assuming that Congress will not
allocate the additional moneys for the JCS's desired improvement, ACSIM can illustrate a
significant loss in other FCG statuses caused by improving the status of barracks.
Balancing for the improved barracks inventory, the model must significantly decrease the
amount of inventory previously raised to a green status across hundreds of other FCGs.
This decrease effected all eight USARPAC installations. 53 of these FCGs showed a
greater than 20 percent loss in green inventory at year seven. 23 of the 53 showed a 90
percent decrease in green inventory at year seven, and 16 showed a decrease of 100
percent.
40

V. CONCLUSIONS AND RECOMMENDATIONS
A. CONCLUSIONS
The Decision Support Tool modeled in this thesis creates an optimal funding
allocation and an inventory status projector ACSIM needs to efficiently manage and
defend its budget. The model uses data verified and accepted by ACSIM creating a robust
and powerful model to quantify the complex budgeting problem.
In general, ACSIM can implement this model into its budget planning now. As the
data from the ISR and other sources improves from refinement, the model can produce
very accurate projections of inventory status and the ability to define allocation
methodologies to achieve the projected status.
B. RECOMMENDATIONS
The model's methodology is powerful, understandable and verifiable. However,
some data could be improved The cost factors developed by CEAC are derived from all
the installations in the continental United States, then aggregated into one Army cost
factor If these factor were obtained at the installation or regional level, the model could
easily accommodate the greater detail
The percentage of unsustained inventory which depreciates to the next lower
status, the percloss parameter, can be refined using the FDM This more accurate data
will greatly increase the accuracy of the status projections
41

The minimum percentage of sustained inventory should be refined. The current
standard rate of 3% of the total sustainment cost is clearly too general. ACSEVI has
already done work in this area, and the improved minesenf^t data is necessary for more
realistic results.
42

LIST OF REFERENCES
Assistant Chief of Staff for Installation Management, HQISR Executive Information
System, System User's Manual, Ver 3.0 (U), CACI Inc, July 1996 .
Assistant Chief of Staff for Installation Management Home Page, "Installations Home to
America's Army,"(U) http://www.hqda.army.mil/webs.acsimweb, January 1997
Bradley, G., "Optimization of Capital Portfolios", Proceedings of the National
Communications Forum 86, 1986,pgs 11-17.
Brooke, A., Kendrick, D., Meeraus, A., GAMS, A User's Guide, Release 2.25, The
Scientific Press, San Francisco, CA, 1992.
Carr, D , Optimally Scheduling Theater Missile Defense Procurement, Operations
Research Masters Thesis, Naval Postgraduate School, September 1996.
Department of the Army, Directorates ofPublic Works Annual Summary of Operations
Volume III- Installations Performance Fiscal Year 1995. 1996.
Goodhart, C, Allocation ofNavy Real Property Maintenance Funding, Operations
Research Masters Thesis, Naval Postgraduate School, Monterey, CA, March 1997.
Lind, Elizabeth Anne, Goal Oriented Multiple Criteria Decision Making For Public
Works Capital Investment Problems Involving Infrastructure with a Specific Case Study
of the US Army, Operations Research Masters Thesis, Georgia Institute of Technology,
May 1995.
R&K Engineering, Inc, "Facility Degradation Module Functional Description", Revision
-Draft, Alexandria VA, March 1996.
Rosenblatt, M J. and Sinuany-Stern, Z , Generating the Discrete Efficient Frontier to the
Capital Budgeting Problem, Operations Research, Vol 37, No. 3, May-June 1989, pgs
384-394.
Shelton, Stan, Director of Operations ACSIM, "Infrastructure Decision Architecture,"(U)
Briefing Slides, November 1996
US Army Concepts Analysis Agency, Resource Analysis Division, Yearly Analysis of
Technologyfor Installation Readiness Prioritization (YATIRI3) Draft, US Army Concepts
Analysis Agency, Bethesda MD, December 1996
43

Wilson, D. G., Rudin, B. D., "Introduction to the Optimization Subroutine Library", IBMSystems Journal, vol. 31, no. 1, 1992.
Wylie, M, and Osgood, A., A Data Collection Reportfor the Chief ofStaffof the Army,
ChiefofStaffQuestions on Congressional Study Book Papers, March 1996.
44

INITIAL DISTRIBUTION LIST
Defense Technical Information Center
8725 John J. Kingman Rd., STE 0944
Ft. Belvoir, Virginia 22060-6218
Dudley Knox Library
Naval Postgraduate School
411 DyerRd.
Monterey, California 93943-5101
3. Defense Logistics Studies Information Exchange
Army Logistics Management College
Fort Lee, Virginia 23801-6043
Professor Robert f. Dell, Code OR/DeDepartment of Operations Research
Naval Postgraduate School
Monterey, CA 93943-5002
5
.
Professor Gordon Bradley, Code OR/BzDepartment of Operations Research
Naval Postgraduate School
Monterey, CA 93943-5002
6. Department of the ArmyOffice of the Assistant Chief of Staff for Installation Management
PNT-RM 1D676, ATTN: Stan Shelton
600 Army Pentagon, Washington DC 20310-0600
7. R&K Engineering, Inc
ATTN: Kevin Keating
1700 Diagonal Rd., Suite 530
Alexandria, VA22314
8 US Army War College
Center for Strategic Studies
Operations Research Group, Attn: CPT Michael Bridges
Carlisle, PA 17013
45


DUDLEY KNOX LIBRARY
3 2768 00341312 1
Top Related