


Languages
Pages
Legal


Appl. Sci. 2015, 5, 544-554; doi:10.3390/app5030544
applied sciences ISSN 2076-3417
www.mdpi.com/journal/applsci
Article
Optical Cutting Interruption Sensor for Fiber Lasers
Benedikt Adelmann 1,*, Max Schleier 1, Benedikt Neumeier 2, Eugen Wilmann 2 and Ralf Hellmann 1
1 Applied laser and photonics group, University of Applied Science Aschaffenburg, Wuerzburger
Strasse 45, D-63743 Aschaffenburg, Germany; E-Mails: [email protected] (M.S.);
[email protected] (R.H.) 2 A.L.L. Lasersysteme GmbH, Westendstrasse 123, 80339 Munich, Germany;
E-Mails: [email protected] (B.N.); [email protected] (E.W.)
* Author to whom correspondence should be addressed; E-Mail: [email protected];
Tel.: +49-6021-4206-840; Fax: +49-6021-4206-801.
Academic Editor: Sergei K. Turitsyn
Received: 15 July 2015 / Accepted: 1 September 2015 / Published: 9 September 2015
Abstract: We report on an optical sensor system attached to a 4 kW fiber laser cutting
machine to detect cutting interruptions. The sensor records the thermal radiation from the
process zone with a modified ring mirror and optical filter arrangement, which is placed
between the cutting head and the collimator. The process radiation is sensed by a Si and
InGaAs diode combination with the detected signals being digitalized with 20 kHz.
To demonstrate the function of the sensor, signals arising during fusion cutting of 1 mm
stainless steel and mild steel with and without cutting interruptions are evaluated and
typical signatures derived. In the recorded signals the piercing process, the laser switch on
and switch off point and waiting period are clearly resolved. To identify the cutting
interruption, the signals of both Si and InGaAs diodes are high pass filtered and the signal
fluctuation ranges being subsequently calculated. Introducing a correction factor, we
identify that only in case of a cutting interruption the fluctuation range of the Si diode
exceeds the InGaAs diode. This characteristic signature was successfully used to detect 80
cutting interruptions of 83 incomplete cuts (alpha error 3.6%) and system recorded no
cutting interruption from 110 faultless cuts (beta error of 0). This particularly high
detection rate in combination with the easy integration of the sensor, highlight its potential
for cutting interruption detection in industrial applications.
OPEN ACCESS

Appl. Sci. 2015, 5 545
Keywords: laser cutting; cut break detector; optical sensor
1. Introduction
Laser cutting of metals with high power fiber lasers is an established and often-used manufacturing
method in modern industry. In addition to CO2 laser cutting, the use of fiber- and disc lasers has gained
increasing interest and application share [1–5]. With modern fiber- and disc lasers, it is possible to cut
metals with high thicknesses in the range of several centimeters, e.g., 30 mm carbon steel using a 6 kW
fiber laser [1,4,6,7]. When cutting thick materials, the process parameters have to be adjusted very
precisely in order to achieve high quality results. Important parameters are, among others, laser power,
gas pressure, nozzle-to-workpiece distance, and feed rate. In addition, potential variations of the
material properties (e.g., impurities or sulfur inclusions), as well as the condition and performance of
the laser cutting system (e.g., dirty optics or thermal lens effects), may also negatively influence the
cutting process in an unpredictable way [8]. These disturbances can lead to a cutting interruption,
which in turn may necessitate re-work or even results in an increase of material waste. With respect to
an increasing demand for resource efficient manufacturing processes and a trend towards unmanned
operating cutting machines, both effects are unwanted and quality-sensing systems are highly
desirable. However, whereas sensing and monitoring of laser welding processes is commonly in
use [9–11], sensing solutions for laser-cutting processes are hardly in practice.
To monitor laser cutting processes several technical approaches, based on different physical
detection schemes, such as camera-based sensors, optical sensors, or acoustic based systems, have
been reported. Sichani et al. [12] reported on a NIR camera based system for monitoring laser cutting
of 15-mm thick steel sheets with a 6 kW CO2 laser. The camera was employed to analyze the size and
temperature distribution of the process zone with a sample rate of 40 Hz. The authors show the
possibility to calculate the burr formation, roughness, and striation angle from the camera pictures
using a fuzzy logic. The disadvantage of this system is the low sampling rate, which becomes
important for fast laser cutting processes. Sichani et al. [13] also applied an IR camera to monitor the
kerf width, dross, and striations during fusion cutting of mild steel. A high speed camera in the same
plane with the metal sheet is used by Ermolaev et al. [14] to visualize the melt flow during the cutting
process with a fiber and CO2 laser. With this system, it can be proven that the striation formation is
caused by cyclic melt removal. Alippi et al. [15] demonstrated the possibility to construe the cut
quality by measuring the flying sparks underneath the workpiece. A camera measures the width and
angle of the flying sparks during CO2 laser cutting and the cut quality is evaluated by applying an
artificial neural network to the measured data. The disadvantage of the system is that different cut
directions influence the flying sparks and the dirt of the cutting process pollutes the camera and
hinders an efficient monitoring. Kaierle et al. [16] reported on the advantages of camera-based
2D-sensor systems for laser processing applications, which possibly provide substantially more
information from the process as compared to diode based sensors, yet at higher costs and the necessity
of elaborate data acquisition and analysis. For fast calculation, it is also possible to evaluate only a few
or a single pixel, which, in turn, is again similar to diode-based monitoring.

Appl. Sci. 2015, 5 546
In addition to cameras, which require a high evaluation time and efforts, non-camera-based optical
sensors are also applied. Jurca et al. [17] employed a cutting head with three attached optical fibers to
detect the nozzle to workpiece distance and the radiation from the process zone, the latter being used to
calculate the temperature in the process zone, thereby monitoring the process. However, detailed
experiments to prove the ability to detect cutting interruptions were not performed. Golubev et al. [18]
assembled a fiber-coupled optical sensor at a 30° angle at the cutting head, measuring the thermal
radiation of the process zone. During steel cutting (thickness 3 to 10 mm) with a 1.5 kW CO2 laser, the
thermal radiation is recorded with an InGaAs and a Si photodiode. The results show varying
temperatures at different cutting velocities, which can be used to indicate a cutting interruption.
However, lateral off-set sensors must be retraced to watch the cut kerf, which is very extensive, and in
small contour cuts with high velocities the retrace is not fast enough.
In contrast to other mostly-optical-based sensors, Kek and Grum [19] analyzed the acoustic
emissions generated during the laser cutting process to evaluate the cut quality during laser machining.
Cutting with good quality emits a continuous sound while burr formation emits acoustic bursts, which
are assigned to the fracture of the oxide film during the solidification of the burr. However, in practical
use, these bursts are difficult to detect because the sound is disturbed by the noise of the gas jet, the
sound of the drives, and the exhaustion system.
Most of the presented systems are developed for, and applied to, CO2 laser applications rather than
to fiber or disc lasers. However, increasing share of fiber- and disc laser based cutting applications
poses an urgent demand for monitoring systems for NIR lasers. However, for fiber- and disc lasers,
detection systems recording the optical emissions from the process zone are challenging since the
primary laser radiation coincides spectrally with the spectral region of maximum thermal radiation
and, at the same time, the intense laser radiation is also scattered or reflected and can damage the filter
(e.g., at 4 kW laser power 1% scattered radiation is 40 W on the filter, which can damage absorbing
filters). In this contribution, we present a newly developed optical cutting interruption sensor for fiber
laser cutting applications. The sensor is evaluated with respect to typical application conditions with
the characteristic signatures of the sensor being identified for cutting mild and stainless steel. This, in
turn, facilitates the successful detection of cutting faults with a low alpha error.
2. Experimental Section
2.1. Laser Cutting System
In this study, a continuous wave 4000 W multi-mode fiber laser (YLR Series, IPG Photonics,
Oxford, MA, USA) was used to perform the experiments. The laser system is equipped with 3D linear
stages (Aerotech Inc., Pittsburgh, PA, USA) to move the cutting head (Precitec GmbH, Gaggenau,
Germany) over the workpiece. The assisting gas, nitrogen, with purity greater than 99.999%, flows
coaxial to the laser beam. The gas nozzle has a diameter of 2 mm and its distance from the workpiece
is positioned with a z-linear drive. The emission wavelength of the laser is specified to be 1070 nm in
conjunction with a beam propagation factor of M2 < 8.5 (100 μm fiber, beam parameter product of
2.9 mm × mrad). The raw beam diameter of 11.6 mm is focused by a lens with focal length of 200 mm.
The resulting Rayleigh length is calculated to 3.4 mm and the focus beam diameter to 200 μm.
Appl. Sci. 2015, 5 547 2.2. Cut Design
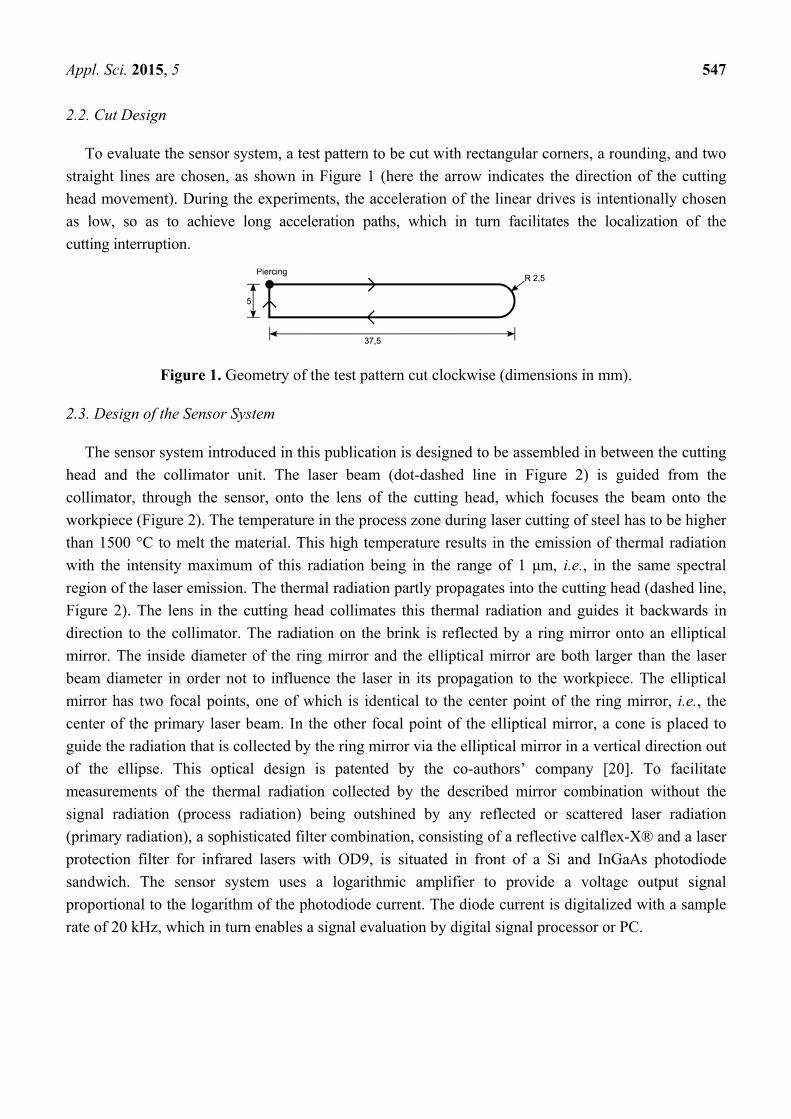
To evaluate the sensor system, a test pattern to be cut with rectangular corners, a rounding, and two
straight lines are chosen, as shown in Figure 1 (here the arrow indicates the direction of the cutting
head movement). During the experiments, the acceleration of the linear drives is intentionally chosen
as low, so as to achieve long acceleration paths, which in turn facilitates the localization of the
cutting interruption.
Figure 1. Geometry of the test pattern cut clockwise (dimensions in mm).
2.3. Design of the Sensor System
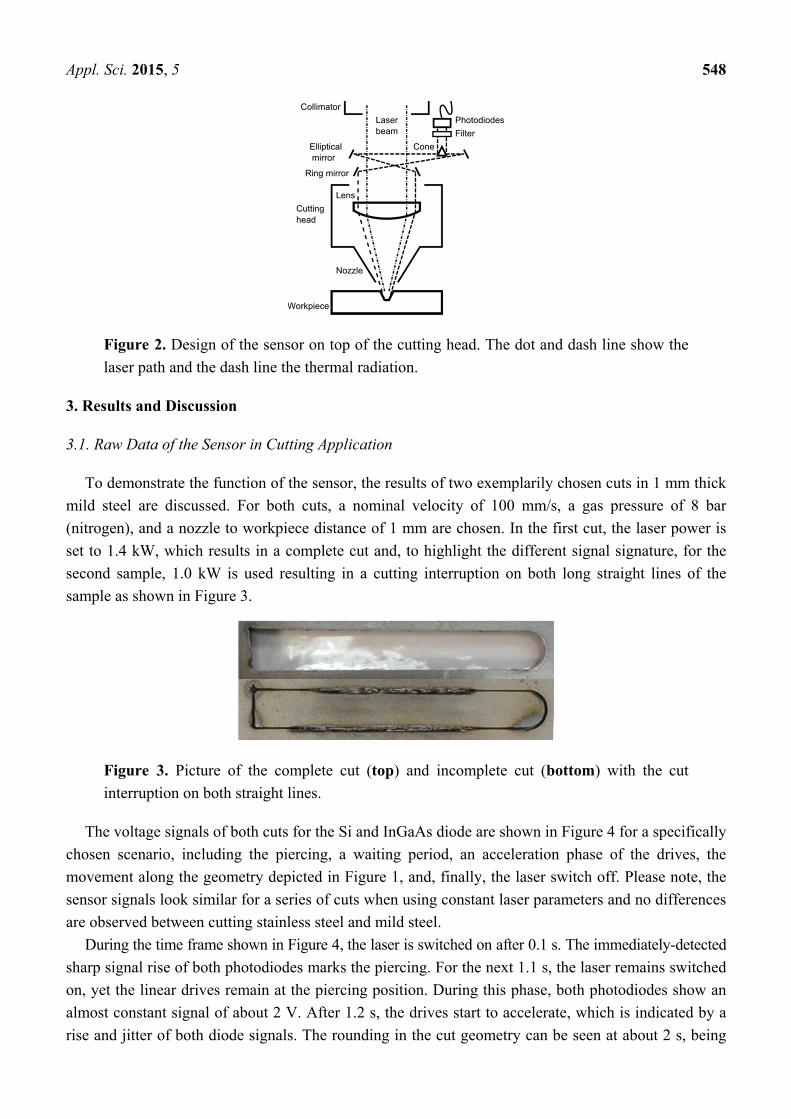
The sensor system introduced in this publication is designed to be assembled in between the cutting
head and the collimator unit. The laser beam (dot-dashed line in Figure 2) is guided from the
collimator, through the sensor, onto the lens of the cutting head, which focuses the beam onto the
workpiece (Figure 2). The temperature in the process zone during laser cutting of steel has to be higher
than 1500 °C to melt the material. This high temperature results in the emission of thermal radiation
with the intensity maximum of this radiation being in the range of 1 μm, i.e., in the same spectral
region of the laser emission. The thermal radiation partly propagates into the cutting head (dashed line,
Figure 2). The lens in the cutting head collimates this thermal radiation and guides it backwards in
direction to the collimator. The radiation on the brink is reflected by a ring mirror onto an elliptical
mirror. The inside diameter of the ring mirror and the elliptical mirror are both larger than the laser
beam diameter in order not to influence the laser in its propagation to the workpiece. The elliptical
mirror has two focal points, one of which is identical to the center point of the ring mirror, i.e., the
center of the primary laser beam. In the other focal point of the elliptical mirror, a cone is placed to
guide the radiation that is collected by the ring mirror via the elliptical mirror in a vertical direction out
of the ellipse. This optical design is patented by the co-authors’ company [20]. To facilitate
measurements of the thermal radiation collected by the described mirror combination without the
signal radiation (process radiation) being outshined by any reflected or scattered laser radiation
(primary radiation), a sophisticated filter combination, consisting of a reflective calflex-X® and a laser
protection filter for infrared lasers with OD9, is situated in front of a Si and InGaAs photodiode
sandwich. The sensor system uses a logarithmic amplifier to provide a voltage output signal
proportional to the logarithm of the photodiode current. The diode current is digitalized with a sample
rate of 20 kHz, which in turn enables a signal evaluation by digital signal processor or PC.
Appl. Sci. 2015, 5 548
Figure 2. Design of the sensor on top of the cutting head. The dot and dash line show the
laser path and the dash line the thermal radiation.
3. Results and Discussion
3.1. Raw Data of the Sensor in Cutting Application
To demonstrate the function of the sensor, the results of two exemplarily chosen cuts in 1 mm thick
mild steel are discussed. For both cuts, a nominal velocity of 100 mm/s, a gas pressure of 8 bar
(nitrogen), and a nozzle to workpiece distance of 1 mm are chosen. In the first cut, the laser power is
set to 1.4 kW, which results in a complete cut and, to highlight the different signal signature, for the
second sample, 1.0 kW is used resulting in a cutting interruption on both long straight lines of the
sample as shown in Figure 3.
Figure 3. Picture of the complete cut (top) and incomplete cut (bottom) with the cut
interruption on both straight lines.
The voltage signals of both cuts for the Si and InGaAs diode are shown in Figure 4 for a specifically
chosen scenario, including the piercing, a waiting period, an acceleration phase of the drives, the
movement along the geometry depicted in Figure 1, and, finally, the laser switch off. Please note, the
sensor signals look similar for a series of cuts when using constant laser parameters and no differences
are observed between cutting stainless steel and mild steel.
During the time frame shown in Figure 4, the laser is switched on after 0.1 s. The immediately-detected
sharp signal rise of both photodiodes marks the piercing. For the next 1.1 s, the laser remains switched
on, yet the linear drives remain at the piercing position. During this phase, both photodiodes show an
almost constant signal of about 2 V. After 1.2 s, the drives start to accelerate, which is indicated by a
rise and jitter of both diode signals. The rounding in the cut geometry can be seen at about 2 s, being

Appl. Sci. 2015, 5 549 expressed by a lower voltage from the InGaAs diode. The sharp 90-degree turn of the laser system at
the end of the cut contour is associated with a negative peak in the sensor signal of the InGaAs diode
shortly before second 3. The laser is switched off after 3 s, which leads to a sharp negative step of the
Si diode signal and a slow decrease of the InGaAs signal. The latter is caused by the cooling process of
the workpiece, with the main contributing intensities of the thermal radiation shifting towards a longer
wavelength (the maximum shift according to Wien’s law). It is worthwhile to stress that the signal
behavior shown in Figure 4 (top), in general, reveals the described trend, independent of the employed
process parameters for a complete cut.
Figure 4. Voltage signal delivered by the Si and InGaAs diodes of a complete (top) and
incomplete (bottom) cut. The time of the cutting interruption is marked by dashed lines.
The temporal evolution of the signals of both photodiodes for an incomplete cut (Figure 4, bottom)
shows, at first glance, a rather similar behavior as the complete cut. However, a detailed comparison
yields remarkable differences for both photodiodes, particularly at the beginning and the end of the
cutting interruption (highlighted by two grey shaded rectangular in Figure 4, bottom). These differences
are observed consistently whenever a cutting interruption is enforced by changing process parameters,
such as a decrease in laser power or an increase of velocity.
3.2. Signal Processing
To obtain a characteristic signature in the photodiode signal that unambiguously identifies a cutting
interruption, as a first step, we apply a digital two-element high pass filter (yk = xk − xk-1) to the
measured signals, as shown in Figure 4. The resulting filtered signals are depicted in Figure 5 for a
complete cut (top) and an incomplete cut (bottom). Distinctive points in the filtered signal are found at,
firstly, 0.1 s (pronounced peak) indicating the piercing; secondly, at 1.2 s the onset of the laser cut is
indicated by a pronounced signal with strong fluctuations; and thirdly, the end of the laser cut is
noticeable by a high negative peak at second 3.0.

Appl. Sci. 2015, 5 550
The comparison of the signals with and without cutting interruption reveals distinctive differences
in the fluctuation range. During cutting (second 1.2 to second 3.0), the fluctuation range of the InGaAs
diode is always higher as compared to the fluctuation range of the Si diode. When a cutting
interruption occurs, as shown in Figure 5 (bottom), the fluctuation range of the InGaAs diode falls
below the fluctuation range of the Si diode. At the end of the cutting interruption, controversially, the
fluctuation range of the InGaAs signal exceeds that of the Si signal, i.e., the degree of the filtered
signal fluctuation can be utilized to discriminate a complete cut from a cutting interruption. We,
therefore, calculate a measure of the degree for the fluctuation by determining the standard error from
50 sequent data points of the high pass filtered signal (Figure 5).
Figure 5. High pass filtered signal of a complete (top) and incomplete cut (bottom). The
time domain in which the cutting interruption occurs is marked by the two grey shaded
rectangular with dashed lines.
The results of this calculation are summarized in Figure 6 for the complete cut (top) and the
incomplete cut (bottom). In this representation of the processed data, the signal of the complete cut is
identified by the derived data from the InGaAs diode being continuously higher than that of the Si
photodiode. Contrary to that, during the cutting interruption (marked by dashed lines in the lower part
of Figure 6), the derived data from the InGaAs diode falls below that of the Si diode. To gain a digital
value indicating whether a cutting interruption occurs or not, i.e., discriminating the two regimes, the
signal of both diodes must be compared. The calculation of this discriminating value is described in
Equation (1), where Ct describes the binary value for a cutting interruption and fr the fluctuation range
of the particular diode signal. The if constraint returns a “1” whether the greater than condition in the
square bracket is true and a “0” in case of a false condition. This digital value expresses a “1” for
cutting interruption and a “0” for complete cutting. Further, cf describes a correction factor for the fine
tuning to achieve a high detection rate and low beta error late. In a series of 20 cuts, a correction factor
of 0.85 results is determined to detect all cutting interruptions without any false reports. With a
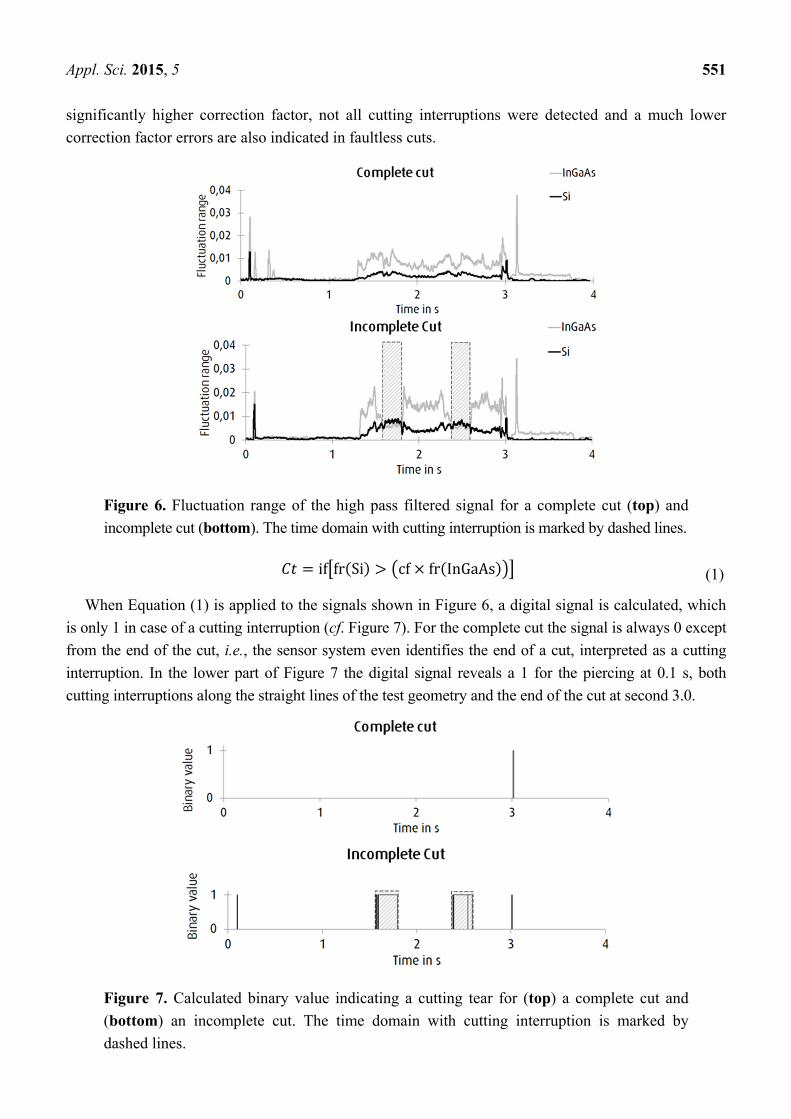
Appl. Sci. 2015, 5 551 significantly higher correction factor, not all cutting interruptions were detected and a much lower
correction factor errors are also indicated in faultless cuts.
Figure 6. Fluctuation range of the high pass filtered signal for a complete cut (top) and
incomplete cut (bottom). The time domain with cutting interruption is marked by dashed lines. if fr Si cf fr InGaAs (1)
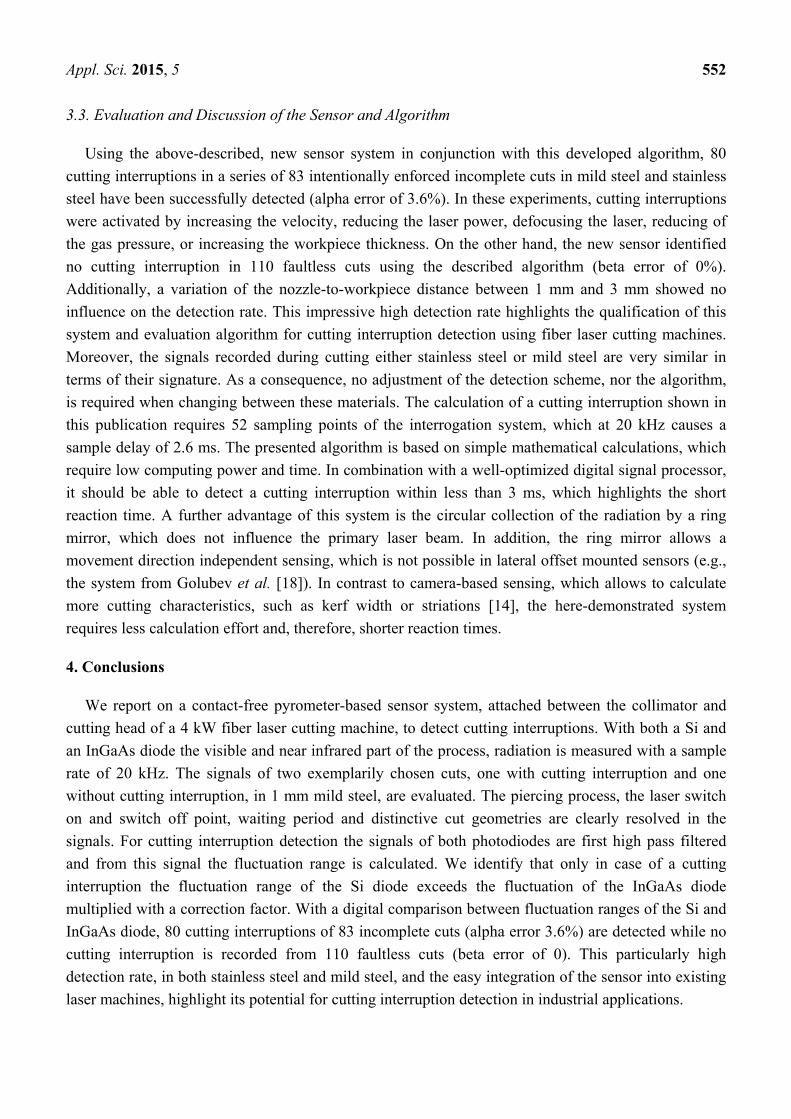
When Equation (1) is applied to the signals shown in Figure 6, a digital signal is calculated, which
is only 1 in case of a cutting interruption (cf. Figure 7). For the complete cut the signal is always 0 except
from the end of the cut, i.e., the sensor system even identifies the end of a cut, interpreted as a cutting
interruption. In the lower part of Figure 7 the digital signal reveals a 1 for the piercing at 0.1 s, both
cutting interruptions along the straight lines of the test geometry and the end of the cut at second 3.0.
Figure 7. Calculated binary value indicating a cutting tear for (top) a complete cut and
(bottom) an incomplete cut. The time domain with cutting interruption is marked by
dashed lines.
Appl. Sci. 2015, 5 552 3.3. Evaluation and Discussion of the Sensor and Algorithm
Using the above-described, new sensor system in conjunction with this developed algorithm, 80
cutting interruptions in a series of 83 intentionally enforced incomplete cuts in mild steel and stainless
steel have been successfully detected (alpha error of 3.6%). In these experiments, cutting interruptions
were activated by increasing the velocity, reducing the laser power, defocusing the laser, reducing of
the gas pressure, or increasing the workpiece thickness. On the other hand, the new sensor identified
no cutting interruption in 110 faultless cuts using the described algorithm (beta error of 0%).
Additionally, a variation of the nozzle-to-workpiece distance between 1 mm and 3 mm showed no
influence on the detection rate. This impressive high detection rate highlights the qualification of this
system and evaluation algorithm for cutting interruption detection using fiber laser cutting machines.
Moreover, the signals recorded during cutting either stainless steel or mild steel are very similar in
terms of their signature. As a consequence, no adjustment of the detection scheme, nor the algorithm,
is required when changing between these materials. The calculation of a cutting interruption shown in
this publication requires 52 sampling points of the interrogation system, which at 20 kHz causes a
sample delay of 2.6 ms. The presented algorithm is based on simple mathematical calculations, which
require low computing power and time. In combination with a well-optimized digital signal processor,
it should be able to detect a cutting interruption within less than 3 ms, which highlights the short
reaction time. A further advantage of this system is the circular collection of the radiation by a ring
mirror, which does not influence the primary laser beam. In addition, the ring mirror allows a
movement direction independent sensing, which is not possible in lateral offset mounted sensors (e.g.,
the system from Golubev et al. [18]). In contrast to camera-based sensing, which allows to calculate
more cutting characteristics, such as kerf width or striations [14], the here-demonstrated system
requires less calculation effort and, therefore, shorter reaction times.
4. Conclusions
We report on a contact-free pyrometer-based sensor system, attached between the collimator and
cutting head of a 4 kW fiber laser cutting machine, to detect cutting interruptions. With both a Si and
an InGaAs diode the visible and near infrared part of the process, radiation is measured with a sample
rate of 20 kHz. The signals of two exemplarily chosen cuts, one with cutting interruption and one
without cutting interruption, in 1 mm mild steel, are evaluated. The piercing process, the laser switch
on and switch off point, waiting period and distinctive cut geometries are clearly resolved in the
signals. For cutting interruption detection the signals of both photodiodes are first high pass filtered
and from this signal the fluctuation range is calculated. We identify that only in case of a cutting
interruption the fluctuation range of the Si diode exceeds the fluctuation of the InGaAs diode
multiplied with a correction factor. With a digital comparison between fluctuation ranges of the Si and
InGaAs diode, 80 cutting interruptions of 83 incomplete cuts (alpha error 3.6%) are detected while no
cutting interruption is recorded from 110 faultless cuts (beta error of 0). This particularly high
detection rate, in both stainless steel and mild steel, and the easy integration of the sensor into existing
laser machines, highlight its potential for cutting interruption detection in industrial applications.

Appl. Sci. 2015, 5 553 Acknowledgments
This work was funded by the German Federal Ministry for Economic Affairs and Energy.
Author Contributions
All authors discussed the contents of the review manuscript. Benedikt Adelmann and Max Schleier
performed the experimental work. Ralf Hellmann is head of the Applied Laser and Photonics Group at
the University of Aschaffenburg. Benedikt Neumeier und Eugen Wilmann developed, described and
provided the used sensor system.
Conflicts of Interest
The authors declare no conflict of interest.
References
1. Wandera, A.; Salminen, A.; Olsen, F.; Kujanpaa, V. Inert gas cutting of thick section stainless
steel and medium section aluminum using a high power fiber laser. J. Laser Appl. 2009, 21,
154–161.
2. Wandera, A.; Olsen, F.; Salminen, A.; Kujanpaa, V. Cutting of stainless steel with fiber and disk
laser. In Proceedings of 25th International Conference on Lasers and Electro Optics, Scottsdale,
AZ, USA, 30 October–2 November 2006; pp. 211–220.
3. Himmer, T.; Pinder, T.; Morgenthal, L.; Beyer, E. High brightness laser in cutting applications.
In Proceedings of 26th International Congress on Applications of Lasers & Electro-Optics,
Orlando, FL, USA, 29 October–1 November 2007; pp. 87–91.
4. Stelzer, S.; Mahrle, A.; Wetzig, A.; Beyer, E. Experimental Investigations on Fusion Cutting
Stainless Steel with Fiber and CO2 Laser Beams. Phys. Procedia 2013, 41, 392–397.
5. Adelmann, B.; Hellmann, R. Process optimization of laser fusion cutting of multilayer stacks of
electrical sheets. Int. J. Adv. Manuf. Technol. 2013, 68, 2693–2701.
6. Lan, H.; Wang, W. Fundamental Studies on High Power Fiber Laser Cutting Performance of
30 mm Thick Carbon Steel Plate. In Proceedings of Strategic Technology (IFOST), 2011 6th
International Forum on, Harbin, China, 22–24 August 2011; pp. 6–11.
7. Orishich, A.; Malikov, A.; Shulyatyev, V.; Golyshev, A. Experimental Comparison of Laser
Cutting of Steel with Fiber and CO2 Lasers on the Basis of Minimal Roughness. Phys. Procedia
2014, 56, 875–884.
8. Kratky, A.; Schuöcker, D.; Liedl, G. Processing with kW fibre lasers-advantages and limits.
Proc. SPIE 2008, doi:10.1117/12.816655.
9. Park, Y.W.; Park, H.; Rhee, S.; Kang, M. Real time estimation of CO2 laser weld quality for
automotive industry. Opt. Laser Technol. 2002, 34, 135–142.
10. Sun, A.; Kannatey-Asibu, E., Jr.; Gartner, M. Sensor systems for real-time monitoring of laser
weld quality. J. Laser Appl. 1999, 11, 153–168.
11. Ancona, A.; Spagnolo, V.; Lugara, P.M.; Ferrara, M. Optical Sensor for real-time Monitoring of
CO2 Laser Welding Process. Appl. Opt. 2001, 40, 6019–6025.

Appl. Sci. 2015, 5 554 12. Sichani, E.; de Keuster, J.; Kruth, J.P.; Duflou, J.R. Monitoring and adaptive controll of CO2 laser
flame cutting. Phys. Procedia 2010, 5, 483–492.
13. Sichani, E.F.; de Keuster, J.; Kruth, J.; Duflou, J. Real-time monitoring, control and optimization
of CO2 laser cutting of mild steel plates. In Proceedings of the 37th International MATADOR
Conference, Manchester, UK, 14 May 2012; pp. 177–181.
14. Ermolaev, G.V.; Yudin, P.V.; Briand, F.; Zaitsev, A.V.; Kovalev, O.B. Fundamental study of
CO2-and fiber laser cutting of steel plates with high speed visualization technique. J. Laser Appl.
2014, 26, 042004.
15. Alippi, C.; Bono, V.; Piuri, V.; Scotti, F. Toward real-time quality analysis measurement of metal
laser cutting. In Proceedings of Virtual and Intelligent Measurement Systems, 2002. VIMS '02.
2002 IEEE International Symposium on, Mt Alyeska Resort, AK, USA, 19–20 May 2002;
pp. 39–44.
16. Kaierle, S.; Abels, P.; Kratzsch, C. Process Monitoring and Control for Laser Materials
Processing—An Overview. In WLT-Conference on Lasers in Manufacturing. In Proceedings of
the Third International WLT-Conference Lasers in Manufacturing, LIM 2005, Munich, Germany,
13–16 June 2005; pp. 101–105.
17. Jurca, M.; Langer, H.J. Temperature field measurement as quality assurance measure in case of
laser material processing. Phys. Procedia 2010, 5, 473–481.
18. Golubev, Y.; Dubrov, A.; Zavalov, Y.N.; Dubrovin, N.G. Diagnostics of laser radiance penetration
into material by multi-channel pyrometer. In Proceedings of Advanced Optoelectronics and Lasers
(CAOL), 2010 International Conference on, Sevastopol, Ukraine, 10–14 September 2010;
pp. 182–184.
19. Kek, T.; Grum, J. Use of AE monitoring in laser cutting and resistance spot welding.
In Proceedings of EWGAE, Vienna, Austria, 8–10 September 2010.
20. Arnold, P. Apparatus for collecting process light during laser machining, comprises lens in
machining head, narrow annular mirror over lens edge and reflective ellipse for directing light to
detector. Patent DE102008015133A1, 24 September 2009.
© 2015 by the authors; licensee MDPI, Basel, Switzerland. This article is an open access article
distributed under the terms and conditions of the Creative Commons Attribution license
(http://creativecommons.org/licenses/by/4.0/).
Top Related