


Languages
Pages
Legal


Int. J. Mech. Eng. Autom.
Volume 2, Number 7, 2015, pp. 312-327
Received: June 29, 2015; Published: July 25, 2015
International Journal of
Mechanical Engineering
and Automation
Online Validation of Comparison Algorithms Using the
TraCIM-System
Frank Härtig1, Jie Tang
1, 2, Daniel Hutzschenreuter
1, Klaus Wendt
1, Karin Kniel
1 and Zhaoyao Shi
2
1. Physikalisch-Technische Bundesanstalt Braunschweig und Berlin, Braunschweig 38116, Germany
2. College of Mech. Eng. and Applied Electronics Tech., Beijing University of Technology, Beijing 100124, China
Corresponding author: Frank Härtig ([email protected])
Abstract: The use of validated algorithms shall guarantee the correct calculation of measurement results which also includes the
evaluation of national and international comparisons. To fulfill this essential requirement, a network of NMIs (national metrology
institutes) and DIs (designated institutes) established an online service which, among other tests, allows participants in
interlaboratory comparison to test their mathematical algorithms used for the comparison. The test comprises four types of
recommended evaluations procedures depending on whether a reference value is provided by a reference laboratory or whether it has
to be calculated by the input values of the participants. For the last mentioned procedure, two outlier filters, the Grubbs’ test and the
largest consistent subset so called En criterion are tested as well. After registration at the TraCIM (traceability for
computationally-intensive metrology) online service a user may order test data for validating his comparison algorithms. Each test
contains eight individual data sets. The users’ evaluation results are compared against reference results provided by the institution
offering the test. For each test the user receives an online report with test results. Test data, test procedure and test evaluation are
subjected to quality rules specified and controlled by TraCIM e.V. which is an international head organization for metrological
algorithm validation.
Keywords: Comparison, TraCIM, weighted mean, expanded measurement uncertainty, En value, largest consistent subset, En
criterion, Grubbs’ test.
Nomenclature
RV Reference value
KCRV Key comparison reference value
n Participants number
xi Participant quantity value
Ui(95%) Expanded measurement uncertainty at 95%
level of confidence for quantity xi
ui Standard measurement uncertainty for
quantity xi
xref RV of the input data
Uref(95%) Uncertainty for the RV at a 95% level of
confidence
En(95%) Ratio of the deviation of the input quantity
value from RV and the uncertainty of this
deviation at a 95% level of confidence
G Two-sided Grubbs’ test statistic
GC(n) Critical values
x Arithmetic sample mean
s Sample standard deviation
1. Introduction
In all metrological areas comparison between
different metrological institutes on national and
international level is one of the most important
applications for tracing reliable evaluation of
mesurands and their associated measurement
uncertainty [1]. Participants of a comparison provide
measurements and measurement uncertainty values
for common physical standards. Statistical evaluation
of these values gives for example a RV (reference
value) for the underlying measurand and shows

Online Validation of Comparison Algorithms Using the TraCIM-System
313
relations between results of participants. On
international level this value is also called KCRV (key
comparison reference value).
Critical influence of software can be observed when
investigating evaluation methods for comparison of
measurement results. Today, unified rules are missing
and the use of algorithms appears to be different even
on comparisons evaluated by NMIs [2]. To overcome
this critical situation, the PTB
(Physikalisch-Technische Bundesanstalt), the German
NMI established a test for validation of comparison
evaluation algorithms such as recommended in Ref.
[3]. The test is referred to as intercomparison test and
offers validation of algorithms for four different
application classes. These comprise statistical
methods for computation of RVs, analysis of DoE
(degree of equivalence) between participants’
measurement values and detection of outliers within
the data.
The test is implemented within the scope of a
software validation online service that was established
in 2014 during a European research project named
TraCIM (traceability for computationally-intensive
metrology) [4]. It offers a web interface including a
web shop [5] and a client-server application for testing
of metrological software. It is available from any
location worldwide with an internet connection. This
service is referred to as TraCIM service. Fig. 1 depicts
the general concept. A NMI, which in this case is
PTB, provides the test service. This is of paramount
importance, since the tests are to be carried out, or at
Fig. 1 TraCIM service for validation of comparison
algorithms.
least monitored, by the supreme metrological
authority of a country. PTB is organized with other
metrology institutes under the umbrella of the TraCIM
association (TraCIM e.V.). Its main task consists in
describing unified quality rules and in defining the
technical infrastructure under which the algorithm
tests are to be run. Each provider is, however, sole
responsible and also held liable for the correctness and
reliability of the tests. The NMIs act autonomously in
defining the test scope, the business workflow, in the
maintenance of their datasets, the running of the
server and in consultation and support for customers.
For this reason, each metrology institute runs its own
TraCIM web shop and server. Each server has to be
addressed individually, which leads to a different
extent of services offered depending on each
metrology institute. The metrology institutes,
however, have the possibility of providing algorithm
tests mutually as subcontractors, which allows a test
provider to enhance the extent of services offered.
The primary users of the TraCIM service are
manufacturers of analysis and evaluation software for
measuring instruments. The service allows them to
have their analysis algorithms validated and officially
approved by a national metrology institute. This
mainly serves to increase confidence in the products
they offer on the market. In principle, they can have
this service unlocked for their customers in order to
have, for example, updates validated directly on the
user’s computer. Software engineers can already test
their algorithms during the development phase to be
on the safe side and, thus, make development faster.
New customers who want to access the service need to
register once and can access individual tests via the
internet afterwards. The service is available 24 hours a
day at each day of the year at each location on the
globe.
The following sections give details on the
implementation of the test of comparison algorithm by
means of the TraCIM service offered by PTB. Starting
from detailed mathematical background on the correct

Online Validation of Comparison Algorithms Using the TraCIM-System
314
evaluation of comparison measurements, the design of
the test will be presented and information on
necessary technical requirements for successfully
performing tests are given. Further sections present
TraCIMs’ IT-architecture and business aspects
associated with testing. Finally, public test data and
results are provided for the comparison methods of
interest in this paper.
2. Mathematical Background
Mathematical methods for evaluation of data of
comparison measurements need to be well defined and
unambiguous [3] in order to avoid incorrect
application and wrong interpretation of the results.
Due to the test conditions two approaches must be
distinguished (Fig. 2). In case the RV is provided by a
competent participant, the evaluation is specified
uncorrelated. In case the RV has to be calculated by
the input values of the participants the evaluation is
specified correlated. In order to prevent a strong
influence on the calculation of the RV, partners whose
input values significantly differ from the input values
of the other participants may be excluded by applying
outlier filters. The most recommended outlier
detection algorithms are the En criterion and the
Grubbs’ test.
The detailed description of algorithms and formulas
for the calculation of RVs are presented in the
following. Their correct implementation in software
requires clear definition of numerical representation of
input variables, correct computation of interim results
and evaluation results as well as correct and precise
comparison evaluation
correlatedRV calculated
uncorrelatedRV provided
En criterion
Grubbs´testno outlier
no outlier
Fig. 2 Schematic overview of the evaluation of comparison
measurements.
representation of data in external tables that are used
for the Grubbs’ test.
2.1 Statistical Methods
The input values are results of measurements of
quantities provided by participants of the
comparison. Values of different participants are
identified by the index . Similar to the
definition in Ref. [6] a measurement result is generally
expressed as a single quantity value being
attributed to a positive measurement uncertainty
. The uncertainty is understood to be the half
width of the confidence interval
which contains the correct value of the
measured quantity at a probability of 95%. In the
following this property is called uncertainty at 95%
level of confidence.
Note: Under assumption of normally distributed
data an expansion factor of approximately ‘2’ yields
the expanded uncertainty at 95% level of confidence
where denotes the standard
measurement uncertainty for a quantity .
The RV of the input data is denoted by . It is
calculated from the measurements of the participants
according to the weighted mean method defined by
Eq. (1).
(1)
Due to the uncertainty of input values it is
necessary to provide an uncertainty for the RV. It is
denoted by and gives the expanded
measurement uncertainty for at 95% level of
confidence. Eq. (2) defines its calculation.
(2)
The DoE (degree of equivalence) of each
measurement is expressed quantitatively by two
terms: the deviation of the input quantity value from
RV and the uncertainty of this deviation at a 95%
level of confidence. The ratio of both these terms is
the so-called En value. To confirm the equivalence of

Online Validation of Comparison Algorithms Using the TraCIM-System
315
the input measurement with the calculated RV
and its associated expanded measurement uncertainty
the En value must be within the interval
.
Depending on the input values, three different
scenarios for the evaluation have to be distinguished:
Equivalence criterion when the RV is calculated;
Equivalence criterion when the reference value is
provided;
Equivalence criterion between two participants.
If the RV is calculated according to Eq. (1) and (2),
it is strongly correlated with the input values, and this
correlation has to be taken into account appropriately.
As a result Eq. (3) has to be used for calculating
correlated values.
(3)
If the RV is provided with the input values the
uncorrelated value is calculated according
to Eq. (4).
(4)
The DoE between two individual participants
and is of interest for bilateral comparison. The
corresponding criterion is calculated
according to Eq. (5).
(5)
2.2 Evaluation Procedures
In order to calculate the correct En values for each
procedure outlined in Fig. 2, Eqs. (1)-(4) must
individually be applied on input values.
2.2.1 Procedures with No Outlier Filter
In case when the RV and its uncertainty is given a
priori, the En values are calculated according to Eq. (4)
for each input value .
In case when the RV and its uncertainty are not
given a priori both values have to be calculated at first
by Eq. (1) and (2) for the correlated evaluation.
Afterwards the En values are computed according to
Eq. (3) for each input value .
2.2.2 Outlier Detection Using En Criterion
The En outlier filter uses the calculated En values to
decide whether a result of a participant can be
identified as an outlier or not. Finally, it is intended to
provide a RV based only on those participants who all
fulfill the condition . To find the
largest consistent subset of participants with consistent
results, the elimination process has to be re-iterated [7].
The procedure for outlier detection is described in
Fig. 3. It starts at calculating the RV (Eqs. (1) and (2))
and the correlated En values of all participants
according to Eq. (3). If the absolute En value of one or
more participants is bigger than 1, the participant with
the absolute largest En value is identified as an outlier.
It will be removed from the input values for RV
calculation. This process will be repeated, until the
absolute En values of all remaining participants are
smaller or equal than 1.
After all outliers are identified, two groups of
participants have to be distinguished with important
consequences for the final En value calculations. The
RV of those participants who fulfill the En criterion is
still in correlation with the corresponding input values.
In that case the En values are calculated according to
Eq. (3). In opposite those En values for the outliers
1max
nENo
Yes
full set of input values
identify one outlier( )
uncorrelatedfor all outliers
reduced set of input valuesRV
nE
correlatednE
maxnE
nE
Fig. 3 Flow chart for the detection of outliers using the En
criterion.
Online Validation of Comparison Algorithms Using the TraCIM-System
316
have no correlation with the RV and hence these are
calculated by Eq. (4).
Note: In case of identifying two or more largest
outliers with identical absolute values during one
iteration only the first in the sequence of input values
will be eliminated. In this case it is certain that the
remaining outliers will be found in the following
iteration processes.
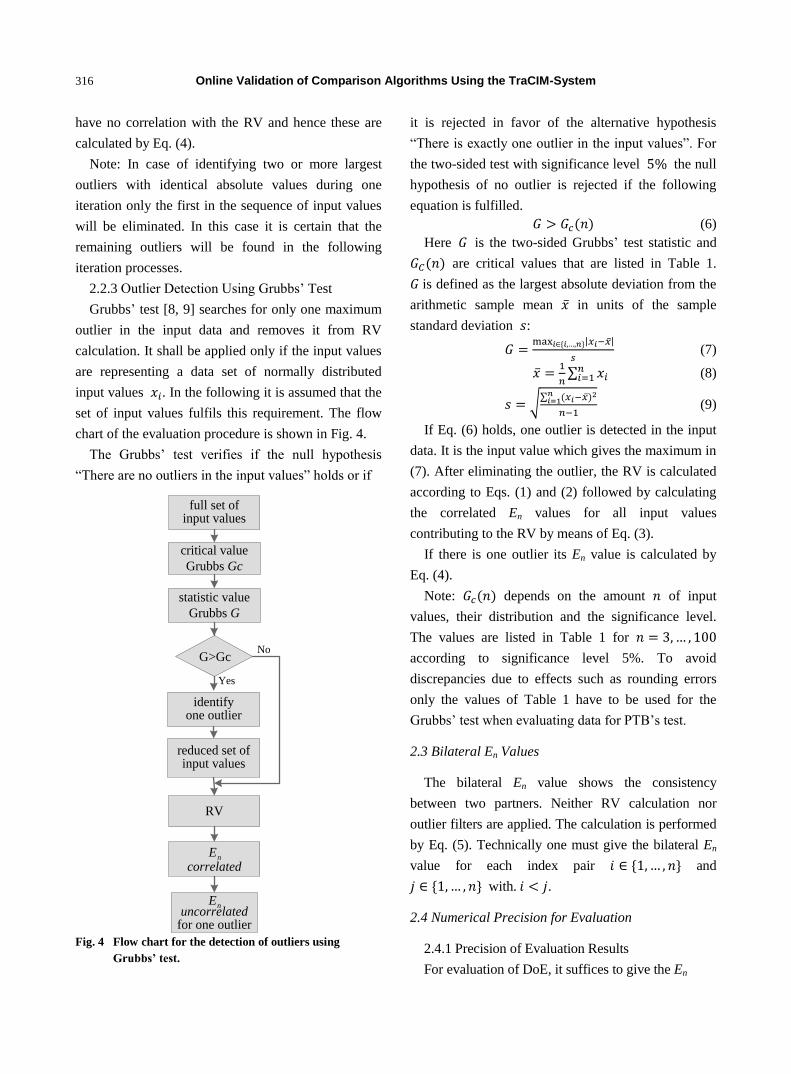
2.2.3 Outlier Detection Using Grubbs’ Test
Grubbs’ test [8, 9] searches for only one maximum
outlier in the input data and removes it from RV
calculation. It shall be applied only if the input values
are representing a data set of normally distributed
input values . In the following it is assumed that the
set of input values fulfils this requirement. The flow
chart of the evaluation procedure is shown in Fig. 4.
The Grubbs’ test verifies if the null hypothesis
“There are no outliers in the input values” holds or if
critical value
Grubbs Gc
statistic value
Grubbs G
G>GcNo
Yes
full set of input values
RV
identify one outlier
reduced set of input values
uncorrelatedfor one outlier
nE
nE
correlatednE
Fig. 4 Flow chart for the detection of outliers using
Grubbs’ test.
it is rejected in favor of the alternative hypothesis
“There is exactly one outlier in the input values”. For
the two-sided test with significance level the null
hypothesis of no outlier is rejected if the following
equation is fulfilled.
(6)
Here is the two-sided Grubbs’ test statistic and
are critical values that are listed in Table 1.
is defined as the largest absolute deviation from the
arithmetic sample mean in units of the sample
standard deviation :
(7)
(8)
(9)
If Eq. (6) holds, one outlier is detected in the input
data. It is the input value which gives the maximum in
(7). After eliminating the outlier, the RV is calculated
according to Eqs. (1) and (2) followed by calculating
the correlated En values for all input values
contributing to the RV by means of Eq. (3).
If there is one outlier its En value is calculated by
Eq. (4).
Note: depends on the amount of input
values, their distribution and the significance level.
The values are listed in Table 1 for
according to significance level 5%. To avoid
discrepancies due to effects such as rounding errors
only the values of Table 1 have to be used for the
Grubbs’ test when evaluating data for PTB’s test.
2.3 Bilateral En Values
The bilateral En value shows the consistency
between two partners. Neither RV calculation nor
outlier filters are applied. The calculation is performed
by Eq. (5). Technically one must give the bilateral En
value for each index pair and
with. .
2.4 Numerical Precision for Evaluation
2.4.1 Precision of Evaluation Results
For evaluation of DoE, it suffices to give the En

Online Validation of Comparison Algorithms Using the TraCIM-System
317
Table 1 Critical value for two-sided Grubbs’ test with 5% significance level.
n n n N n n
3 1.154 20 2.708 37 3.003 54 3.159 71 3.263 88 3.340
4 1.481 21 2.734 38 3.014 55 3.166 72 3.268 89 3.344
5 1.715 22 2.758 39 3.025 56 3.173 73 3.273 90 3.348
6 1.887 23 2.780 40 3.036 57 3.180 74 3.278 91 3.352
7 2.020 24 2.802 41 3.047 58 3.187 75 3.283 92 3.355
8 2.127 25 2.822 42 3.057 59 3.193 76 3.288 93 3.359
9 2.215 26 2.841 43 3.067 60 3.200 77 3.292 94 3.363
10 2.290 27 2.859 44 3.076 61 3.206 78 3.297 95 3.366
11 2.355 28 2.876 45 3.085 62 3.212 79 3.302 96 3.370
12 2.412 29 2.893 46 3.094 63 3.218 80 3.306 97 3.374
13 2.462 30 2.908 47 3.103 64 3.224 81 3.311 98 3.377
14 2.507 31 2.924 48 3.112 65 3.230 82 3.315 99 3.381
15 2.548 32 2.938 49 3.120 66 3.236 83 3.319 100 3.384
16 2.586 33 2.952 50 3.128 67 3.241 84 3.323
17 2.620 34 2.965 51 3.136 68 3.247 85 3.328
18 2.652 35 2.978 52 3.144 69 3.252 86 3.332
19 2.681 36 2.991 53 3.151 70 3.258 87 3.336
values referring to the RV with two decimal places.
The same applies to bilateral En values. It is
recommended to apply bankers’ rounding. This allows
the participants both, to see any tendency especially if
the En value is close to 1 and guaranties for the correct
interpretation of the En value which is often presented
with two decimal places.
By convention bankers’ rounding rounds numbers
ending with ‘0.5’ to the nearest even number. An
algorithm available in Microsoft Visual Basic libraries
is presented in Ref. [10]. The rounded values are
consistent with the more general specification of
proper rounding in ISO 80000-1 Appendix B [11] that
is also recommended by VIM [12]. For convenience
we give an outline of the algorithm ‘Bankers’ rounding
to two decimal places’ in the following. Examples of
rounded numbers are presented in Table 2.
Method: Bankers’ rounding to two decimal places
in three steps S1 to S3
Input value: number to be rounded
S1: Initialize ,
and .
Table 2 Rounding numbers to two decimal places by
bankers’ rounding.
Number Rounded
numbers
Number Rounded
numbers
-1.566000 -1.57 1.566000 1.57
-1.565001 -1.57 1.565001 1.57
-1.565000 -1.56 1.565000 1.56
-1.564999 -1.56 1.564999 1.56
-1.555001 -1.56 1.555001 1.56
-1.555000 -1.56 1.555000 1.56
-1.554999 -1.55 1.554999 1.55
-1.554000 -1.55 1.554000 1.55
S2: If
and if
set
.
S3:
is the rounded number.
The operators used are
(sign of )
(maximum
integer less equal then )
The rounding procedure considers all digits of the

Online Validation of Comparison Algorithms Using the TraCIM-System
318
given full number. In the upper example -0.765001 is
rounded up to -0.77, in comparison -0.765000 is
rounded to the next even number -0.76.
Analyzing the bankers’ rounding method
concerning very small perturbations ( ) of the
full numbers shows, that the rounded numbers with
two decimal places differs by a maximum of .
The following example underlines this property.
Computer hardware has only finite arithmetical
precision and the difference between decimal numbers
and their representation in any software is expressed
by the machine precision value . In case of
double precision floating point format according to
IEEE 754 [13] the arithmetical precision is
. Then comparing rounded numbers with and
without perturbation are as follows
rounds to (number with
no perturbation)
rounds to (number with
perturbation )
rounds to (number with
perturbation )
This is of major importance for treatment of
rounded numbers at comparison test evaluation by
TraCIM system. Even for the smallest possible
perturbation in a full number the precision of the
rounded number could differ by or
respectively .
Note: There are many inconsistent rounding rules
such as, rounding up, rounding down, arithmetic
rounding, random rounding, and alternate rounding
which can lead to different results. Microsoft Visual
Basic libraries support bankers’ rounding, while the
commonly used Excel sheets do not [10].
2.4.2 Precision of Interim Results
Interim results are the RV and its uncertainty, the
En values computed for detecting outliers and the
Grubbs’ statistic value G. All these interim results are
calculated with the maximum available precision
provided by the software.
Note: If interim results are printed or saved in files,
it must be noticed that due to rounding effects this
values do not represent the required data precision.
Therefore, it is not allowed to proceed calculation
based on rounded interim results.
3. Quality Rules of TraCIM e.V.
The correctness of the results, the liability of the
service as well as the unambiguous rules and
descriptions for using of test procedures are essential
demands which guarantee an unproblematic and
user-friendly service. Therefore, the TraCIM e.V.
specified quality rules which have to be followed by
all institutes offering the TraCIM test. Below the most
important are listed:
(1) Each institute providing tests is liable for the
correctness of the reference results;
(2) Input values and its associated uncertainty
values are defined as error free;
(3) Reference parameters and their associated
uncertainty must be provided;
(4) The test data have to be verified successfully by
at least three independent software applications.
(5) Tests shall provide only one unambiguous
result;
(6) Test cases shall reflect common practical
situations;
(7) Clear description of the tests procedure,
parameters to be calculated and validation
criterion have to be provided;
(8) It is recommended to provide public test data
and reference parameter;
(9) All data sets sent and received as well as all test
reports are subject to archiving.
In opposite to an academic view all of the quality
rules are targeting pragmatic handling of software
tests.
4. Architecture of the TraCIM Service
PTB provides the TraCIM service by running a
server with the TraCIM system application for
software testing. It is a worldwide accessible,

Online Validation of Comparison Algorithms Using the TraCIM-System
319
long-term usable and easy to maintain online
application for testing metrological algorithms.
TraCIMs’ IT architecture consists of four central
modules (Fig. 5). The web shop is the user interface
[5]. Similar to online shopping, interested service
users have to get registered via the Internet before
they are able to order individual tests. Internally, the
web shop is directly connected with the server core
application for automated processing of incoming
requests such as orders, requests for test data and
evaluation of calculated test results.
The core application is a management module,
which is operated by a competent metrology institute.
It manages all of the operating data and controls the
data flow to the other modules.
The expert modules are developed by experts and
provide individual tests. Each expert module operates
basically autonomously and deals with all logical
operations in connection with a test. It makes the test
data sets available on request, compares the results
computed by the service user (customer) with its own
reference results and, finally, issues the test report.
Since the individual tests may vary significantly from
one application to the other, only few input parameters
have been defined by TraCIM for the data traffic
between the expert modules and the core application.
This applies, for instance, to the support of a software
interface in JAVA which allows the expert system to
be logged into the server system. Basic processing of
data such as unique keys identifying each test and
each request are transmitted via this interface. The
formatting of the test data may be freely selected, the
expert is, to a large extent, free to generate the test
data according to his needs. Therefore, new tests and
special data structures such as for implementing test
cases for validating comparison software can easily be
integrated into the TraCIM system.
The formal specification of the TraCIM
client-server interface is more restrictive in contrast.
The communication runs via a REST interface that is
a special type of https connection. Hereby, the data are
being embedded into an XML structure. Then again,
within this structure, free formats of test data (such as
binary formats or established test data structures) can
be defined, depending on the application. The expert
module is sole responsible for defining the test data
format, generating the test data and analyzing the
calculated results.
5. Test Design and Processing Data
Fig. 6 shows the detailed flow chart for the test of
comparison algorithms starting from user registration
at the web shop site until issuing the test report.
5.1 Registration
In order to get access to the TraCIM service any
customer must at first register at TraCIM system.
PTB’s TraCIM web shop (http://tracim.ptb.de)
provides a fully automated online registration form. A
service user must provide valid contact information
like company name, address, phone number and e-mail
address. It is essential for PTB to have this information
in order to carry out any business activities associated
with issuing official test reports and to provide
appropriate support. After registration the account data
including a unique customer ID, user name and
password are generated automatically by the TraCIM
system and submitted to the service user by e-mail.
These are necessary for further communication with
the server and for ordering tests. Registration is free of
any charge for all service users.
5.2 Order of PTBs’ Comparison Test
A valid TraCIM account allows the service users to
order individual tests for validating their software.
Login at the TraCIM web shop site gives access to a
test ordering area. Here the service user may select the
test for comparison algorithms. There are two
different offers. One is the test with public data at no
charge. It should be used preferably to verify the
correct implementation of the client-server
communication before ordering test data subject to

Online Validation of Comparison Algorithms Using the TraCIM-System
320
Fig. 5 Modular IT architecture of TraCIM system.
Fig. 6 Flow chart for performing a software test offered by the TraCIM service.

Online Validation of Comparison Algorithms Using the TraCIM-System
321
charge. The service user may order this test at any time.
The test can be repeated an unlimited number of times.
No fees are claimed. The second offer is directed at
customers who want to receive an official test report
signed by PTB. This test must be purchased. Therefore,
TraCIM office sends a payment request to the service
user by e-mail. After payment is received the
validation test will be enabled and an order key is
automatically generated and sent to the service user by
e-mail. The order key allows the service user to
identify all tests he ordered in the customer area of the
web shop.
5.3 Implementation of a Test Client
The technical requirement for performing a TraCIM
test is that a service user provides a client application
for requesting test data from and submitting calculated
results to PTB’s TraCIM server. For communication
with the TraCIM server a client application must use
an https (Hypertext Transfer Protocol Secure =
encrypted https) connection that allows to send and
receive content in the form of character strings, which
in case of comparison tests are messages in XML
format. Each https connection is generated from a
specific URL (uniform resource locator), i.e., for
requests of test data or requests of the test result. After
opening the connection according to URL the
following configurations must be done:
Enable output and input operations for the
connection;
Set the request method “GET” in case of test data
request;
Set the request method “POST” in case of test
result transmission;
Set connection property “content-Type” to
“application/xml”;
Set connection property “accept” to
“application/xml”;
Set connection property “content-length” to the
amount of characters of the content that is send to
the TraCIM system.
Service users are advised to use the free-of-charge
public test data for checking the correct
communication between their client application and
the TraCIM server before performing validation tests
subjected to charge. Software packages for creation
and configuration of https connections are available for
different programming languages such as for example:
Java: java.net API (HttpURLConnection);
C/C++: Microsoft C++ REST SDK
(“Casablanca”) or similar;
C#: System.Net (.NET 4.5: System.Net.Http)
Assembly.
5.4 Requesting Test Data Sets
For test data requests the service user has to contact
the TraCIM server using the client application. The
necessary https connection must be configured for a
“GET” request and is opened with the following
predefined URL that contains the order key.
https://tracim.ptb.de/tracim/api/order/
<ORDER_KEY>/test
After receiving the request the server application
verifies the order key. If the order key is valid the
server returns a message containing the test data in a
special XML format. A detailed description of the data
structure is given in the section on comparison of test
data. Test data sets are not send by the server, if the
test has already been send to the service user, if the
identification is unknown or if the validity of the test
has expired.
For each test data set the TraCIM system generates a
corresponding ‘process key’ in order to clearly identify
the data set. It also allows to assign messages
transmitted via the internet connection to individual
test data and to a particular testing process. The
process key is submitted together with the test data sets
to the service user.
5.5 Send Comparison Results for Evaluation
The service user evaluates the test data sets and

Online Validation of Comparison Algorithms Using the TraCIM-System
322
calculates En values by his comparison software. For
validation the results have to be written in a predefined
XML structured message which is in detail described
in the upcoming section on user results. The service
user should submit the message with his results to
TraCIM server with the client application. The
necessary https connection must be configured for a
‘POST’ request and is opened with the following
predefined URL.
https://www.tracim.ptb.de/tracim/api/test/
<PROCESS_KEY>
The address must contain the process key which the
service user has received together with the test data
sets.
5.6 Receiving the Test Report
After receiving results of the software under test the
TraCIM system verifies the validity of the process key.
If the key is accepted, the correctness of the results is
tested and a report on the outcome is created. It states,
whether the application software of the user has
computed correct results for the underlying test data
sets or not. The report is send back to the service users’
client application within a XML message whose
content is schematically shown below.
<?xml version="1.0" encoding="UTF-8"
standalone="true"?>
<tracim:tracim
xmlns:xsi=http://www.w3.org/2001/
XMLSchema-instance xmlns:
comparison=http://tracim.ptb.de/comparison/test
xmlns:tracim="http://tracim.ptb.de/tracim">
<tracim:validation>
<tracim:reportPDF>JKD5iuDUD098IHh[…]
</tracim:reportPDF>
</tracim:validation>
</tracim:tracim>
The element “tracim:reportPDF” contains the test
report, which is a “base64” encoded character string.
The service user has to decode it into an easy readable
pdf-file.
User results are not accepted by the server if they
were already send, if the process key is unknown or if
the validity of the test has expired.
5.7 Costs
The validation of mathematical software algorithms
is subject to charges. This has several reasons: firstly,
the service user receives an official report on the
evaluation, secondly, the management and
maintenance of the TraCIM system generates costs,
and, last but not least, the development costs for the
system need to be refunded in the long run. Fig. 7
shows the prices for testing of comparison algorithms.
There are different offers. Besides a single test, also
test packages of 10, 20 and 50 tests will be available.
Purchasing test packages makes sense, for example, in
case of a software-developing company willing to have
its updates or upgrades validated regularly. The test
will be provided by PTB in August 2015.
Strictly speaking, a validation is valid only for the
software used in the test. Only the software
manufacturer can appraise when a modification in his
complex analysis software could have impact on the
result of the computation. It is therefore his
responsibility vis-à-vis his customers to assess whether
the validation is still valid or whether the validation
must be repeated.
Fig. 7 PTB’s cost model for testing of comparison
algorithm.

Online Validation of Comparison Algorithms Using the TraCIM-System
323
5.8 Availability of the Service
Order keys for single tests and test packages have
time-limited validity for testing. A single test may
only be performed once. For additional tests a service
user must purchase new order keys. In opposite order
keys for packages are applicable multiple times
according to the amount of tests within the package. If
all tests are consumed the order key is not valid
anymore. The time-limited validity of order keys is
shown in Fig. 8. The TraCIM system regularly
informs a service user on the remaining time for
performing tests by e-mail. An initial message is sent
when a service user gets the order key at day .
Interim messages follow giving information on the
remaining time for testing and in case of test packages
the remaining number of available test runs. If the
service user does not test his software by the
expiration date a final message is send that the order
key will lose its validity at day .
5.9 Test Data
Test data denotes the input values for algorithms to
be tested, which are automatically transmitted by the
TraCIM system to the service user. For PTB’s
comparison test this comprises two data sets with
participant’s input values for each evaluation
procedure described before. The number of input
values per data set varies between 4 and 14. Fig. 9
shows the general XML data structure of the test data.
The root element is the “comparisonTestPackage”
which contains the process key identifying the test and
the test data. The element “testPackage” contains a list
of eight “testElements” comprising the input values for
the evaluation. The selected procedure to be applied
with the input data is given by the element “type”
which has one of the values “Uncorrelated”,
“Correlated”, “GrubbsTest” or “EnCriterion”. Element
“dataSetId” gives a unique id for each “testElement”.
The input values are contained within a list of
“participants” elements. These give the unique
participant index (identifier), the participant quantity
value and the uncertainty of the quantity at 95% level
of confidence. For the test type ‘Uncorrelated’ the
additional element ‘reference’ provides the reference
value and its associated expanded uncertainty at 95%
level of confidence.
The test data provided by PTB are based on
comparison data
Fig. 8 Outline on regular TraCIM System information on remaining days for using TraCIM service before expiration of
order keys.

Online Validation of Comparison Algorithms Using the TraCIM-System
324
recorded by BIPM [14] within the KCDB (key
comparison data base) [15]. From that
database 89 data sets were selected and duplicated by
variation of input values and RVs by a data generator.
The duplicated data sets are stored within a database
that is connected with PTB’s expert module for testing
comparison algorithms. Whenever a service user
requests test data eight sets of test data are randomly
selected from that data base and send to the service
user.
5.10 User Results
For submitting computation results, which have
been obtained by use of the software under test, to the
TraCIM system the data structure in Fig. 10 applies.
ComparisonTestPackage
String: processKey
[1 .. 1]
testPackage
testPackage
[8 .. 8]
testElements
testElement
String: type
String: dataSetId
participant
Integer: index
Decimal: value
Decimal: uncertainty
reference
Decimal: value
Decimal: uncertainty
[2 .. *]
participant
[0 .. 1]
reference
Fig. 9 General XML data structure for test data (UML diagram left, XML example right).
ComparisonResultPackage
String: processKey
String: userName
String: softwareName
String: softwareVersion
String: softwareRevision
[1 .. 1]
resultPackage
resultPackage
[8 .. 8]
resultElements
resultElement
String: type
String: dataSetId
participantEn
Integer: index
Decimal: value
bilateralEn
Integer: indexI
Integer: indexJ
Decimal: value
[2 .. *]
participantEns
[1 .. *]
bilateralEns
Fig. 10 Outline of XML data structure for submitting computation results (UML diagram left, XML example right).

Online Validation of Comparison Algorithms Using the TraCIM-System
325
The root element “comparisonResultPackage” must
provide the process key associated to the test data, the
user name and information on the version of the
software under test. A “resultElement” is appended for
each set of input values that has been evaluated by the
user’s software. Each has an element ‘type’ for
identifying the associated evaluation procedure and an
element “dataSetId” that gives the id of the input
value set for calculation from the test data (Fig. 9).
Further a list of “participantEn” elements and a list of
the “bilateralEn” elements is appended to each
“resultElement”. A “participantEn” element gives the
participant index and the En value. Similar
“bilateralEn” elements give the index values for a pair
of participants and their bilateral En value.
All En values must be formatted as decimal
numbers with two decimal places, e.g., by application
of bankers’ rounding method (see above). For bilateral
En values only those for index pairs satisfying
must be given by the service user.
All values that are entered into the schema must
meet the specifications. The XML schemata for
comparison test is downloadable from the following
URLs:
(1)https://tracim.ptb.de/tracim/api/schema/
PTB_MATH_COMPARISON_v1_test.xsd;
(2)https://tracim.ptb.de/tracim/api/schema/
PTB_MATH_ COMPARISON _v1_result.xsd;
(3)https://tracim.ptb.de/tracim/api/schema/tracim.xsd.
Notes:
(1) Test data schema;
(2) Result data schema;
(3) Report schema.
Service users are advised to utilize these schemata
during client development in order to check a proper
functioning with the client.
5.11 Test Result Evaluation
Accessing the accuracy of software is carried out by
comparison of calculated user En values with PTB
reference results. The comparison algorithm test is
passed if all calculated participant En values and all
bilateral En values satisfy condition (10) for each test
data set and evaluation method.
(10)
Here is the PTB reference result. It is
rounded to two decimal places by Bankers’ rounding.
Further is the service user En value rounded to
two decimal places.
Note: Evaluation of test Eq. (10) is implemented in
decimal number arithmetic. Compared to binary
floating point formats it ensures the calculation without
additional rounding errors from reading the service
user results and various arithmetic operations.
6. Public Data
Public test data are available for checking the
client-server communication. They compromise a full
data set in order to detect and correct software errors
within the client application. For any registered
customer the public data are free of charge. In
comparison to a test with purchased test data the report
issued to the service user is marked as draft.
All registered customers can get an order key for
public data on demand. Please consult the TraCIM
website http://tracim.ptb.de.
The RV provided for the evaluation type
‘Uncorrelated’ and the RVs calculated from the
participant’s input values are shown in Table 4. Table
5 shows the corresponding input values and also the
associated reference output En values for each
participant and for each of the four different evaluation
procedures. Table 6 shows the reference output values
for bilateral En values between all pairs of participants.
The input values in Table 5 include the participant
index , the measurement values of the participant
and the expanded measurement uncertainties
at a 95% level of confidence.
Note: To simplify the example, one data set is used
for all four evaluation procedures, i.e., evaluation type
“Uncorrelated”, “Correlated”, “GrubbsTest” or
“EnCriterion” (see above). The public test data

Online Validation of Comparison Algorithms Using the TraCIM-System
326
Table 4 Reference value and expanded uncertainty (RVs).
Evaluation type Reference value Expanded uncertainty
( )
Uncorrelated_no outlier 5.169934 0.000034
Correlated_no outlier 5.169950664835176 0.00003178578106565873
Correlated_En criterion 5.169937458168053 0.00003244467766087733
Correlated_Grubbs’ test 5.169950664835176 0.00003178578106565873
Table 5 Input values and reference output results En (public data sets).
Uncorrelated Correlated
No outlier No
outlier
En
criterion
Grubbs’
test
1 5.169930 0.000088 -0.04 -0.25 -0.09 -0.03
2 5.169860 0.000086 -0.80 -1.13 -0.97 -0.91
3 5.169886 0.000100 -0.45 -0.68 -0.54 -0.49
4 5.169979 0.000062 0.64 0.53 0.79 0.88
5 5.169950 0.000108 0.14 -0.01 0.12 0.17
6 5.169875 0.000100 -0.56 -0.80 -0.66 -0.61
7 5.169900 0.000400 -0.08 -0.13 -0.09 -0.08
8 5.170060 0.000160 0.77 0.70 0.78 0.81
9 5.170660 0.000200 3.58 3.59 3.57 3.69
10 5.169600 0.000260 -1.27 -1.36 -1.29 -1.27
11 5.170025 0.000120 0.73 0.64 0.76 0.80
12 5.169950 0.000200 0.08 0.00 0.06 0.09
Table 6 Reference output results bilateral En.
Bilateral En
1 2 3 4 5 6 7 8 9 10 11 12
1 - 0.57 0.33 -0.46 -0.14 0.41 0.07 -0.71 -3.34 1.20 -0.64 -0.09
2 - - -0.20 -1.12 -0.65 -0.11 -0.10 -1.10 -3.67 0.95 -1.12 -0.41
3 - - - -0.79 -0.43 0.08 -0.03 -0.92 -3.46 1.03 -0.89 -0.29
4 - - - - 0.23 0.88 0.20 -0.47 -3.25 1.42 -0.34 0.14
5 - - - - - 0.51 0.12 -0.57 -3.12 1.24 -0.46 0.00
6 - - - - - - -0.06 -0.98 -3.51 0.99 -0.96 -0.34
7 - - - - - - - -0.37 -1.70 0.63 -0.30 -0.11
8 - - - - - - - - -2.34 1.51 0.18 0.43
9 - - - - - - - - - -3.23 2.72 2.51
10 - - - - - - - - - - -1.48 -1.07
11 - - - - - - - - - - - 0.32
12 - - - - - - - - - - - -

Online Validation of Comparison Algorithms Using the TraCIM-System
327
contain exactly two outliers. When using the En
criterion repeatedly the participants No. 9 and No. 10
will be detected as outliers, On the contrary, when
using the Grubbs’ test just participant No. 9 will be
eliminated as outlier.
7. Conclusions
The application of unified evaluation procedures is
essential for correct comparison of measurements
provided by different participants such as metrological
institutes. In the long run it will make evaluation more
transparent and easier to understand for both
participants of comparison and end users that depend
on high-quality standards and artefacts for
improvement of their measurement capabilities.
The authors recommend well suited evaluation
methods for four different cases of comparison. These
cover the treatment of correlated and uncorrelated
input data as well as weighted mean method for
reference value calculation in combination with
various outlier filters. For the first time the methods
and the whole scope of calculation requirements such
as rounding rules, treatment of interim results and
necessary tables are presented. This leads to identical
and traceable computation of comparisons. Therefore,
it underlines the reliability of NMIs calibration
capabilities.
By using PTBs TraCIM service for comparison
algorithm tests leaders of interlaboratory comparison
could easily validate their software and hence provide
correct evaluation for all participants. An automated
client-server system allows to perform a whole test
with minimum afford. The test service is of high
quality according to the strict rules which are
postulated by TraCIM association. These comprise the
clear description of evaluation procedures, the
correctness of the reference results as well as the
competence of the responsible and liable NMI.
Acknowledgment
This work has been undertaken as part of the EMRP
Joint Research Project “NEW06-Traceability for
computationally-intensive metrology (TraCIM)”. The
EMRP is jointly funded by the EMRP participating
countries within EURAMET and the European Union.
References
[1] BIPM: Measurement comparison in the context of the
CIPM MRA, CIPM MRA-D-05 Version 1.3,
http://www.bipm.org/en/cipm-mra/ (accessed: Feb.
2015).
[2] F. Härtig, K. Kniel, Critical observations on rules for
comparing measurement results for key comparisons,
Measurement 46 (2013) 3715-3719.
[3] F. Härtig, H. Bosse, M. Krystek, Recommendations for
unified rules for key comparison evaluation, in: 11th
International Symposium of Measurement Technology
and Intelligent Instruments (ISMTII), Jul. 1-5, 2013.
[4] TraCIM (Traceability for Computationally Intensive
Metrology), EMRP JRP NEW06-TraCIM,
http://www.tracim.eu/ (accessed: Apr. 2015).
[5] TraCIM PTB, Homepage of TraCIM Service at PTB,
http://tracim.ptb.de/ (accessed: Jun. 2015).
[6] R. Thalmann, CCL key comparison: Calibration of gauge
blocks by interferometry, Metrologia 39 (2002) 165.
[7] M. Cox, The evaluation of key comparison data:
Determining the largest consistent subsets, Metrologia 44
(2007) 187-200.
[8] F.E. Grubbs, Procedures for detecting outlying
observations in samples, Rechnometrics 11 (1969) 1-21.
[9] F.E. Grubbs, Sample criteria for testing outlying
observations, Ann. Math. Statist. 21 (1950) 27-58.
[10] Microsoft Support, How to Implement Custom Rounding
Procedures, http://support.microsoft.com/kb/196652/en
-us (accessed: Jun. 2015).
[11] DIN EN ISO 80000-1:2013-08, Größen und
Einheiten—Teil 1: Allgemeines (ISO 80000-1:2009 +
Cor 1:2011), Deutsche Fassung En ISO 80000-1:2013.
[12] International vocabulary of metrology—Basic and
general concepts and associated terms (VIM), JCGM
200: 2008, 2008.
[13] IEEE 754: IEEE Standard for Binary Floating-Point
Arithmetic for Microprocessor Systems (ANSI/IEEE Std
754-1985).
[14] BIPM (Bureau International des Poids et Mesures),
http://www.bipm.org/ (accessed: Jun. 2015).
[15] BIPM: The BIPM key comparison database (The
KCDB), http://www.bipm.org/kcdb/ (accessed: Jun.
2015)

Int. J. Mech. Eng. Autom.
Volume 2, Number 7, 2015, pp. 312-327
Received: June 29, 2015; Published: July 25, 2015
International Journal of
Mechanical Engineering
and Automation
Top Related