


Languages
Pages
Legal


中期報告
股份代號 : 1316
INT
ER
IM R
EP
OR
T 2019 中
期報告

隨心操控的領導者

Contents
Corporate Profile 2Corporate Information 3Business Overview 4Financial Highlights 14Management Discussion and Analysis 15Corporate Governance/Other Information 25Report on Review of Interim Financial Information 31Interim Condensed Consolidated Balance Sheet 32Interim Condensed Consolidated Income Statement 34Interim Condensed Consolidated Statement of Comprehensive Income 35Interim Condensed Consolidated Statement of Changes in Equity 36Interim Condensed Consolidated Statement of Cash Flows 37Notes to the Condensed Consolidated Interim Financial Information 38

02 NEXTEER AUTOMOTIVE GROUP LIMITED INTERIM REPORT 2019
Corporate Profile
Nexteer Automotive Group Limited (the Company) together with its subsidiaries are collectively referred to as we, us, our, Nexteer, Nexteer Automotive or the Group. Nexteer Automotive is a global leader in advanced steering and driveline systems, advanced driver assistance systems (ADAS) and automated driving (AD) enabling technologies. In-house development and full integration of hardware, software and electronics give Nexteer a competitive advantage as a full-service supplier.
As a leader in intuitive motion control, our continued focus and drive is to leverage strengths in advanced steering and driveline systems that provide value-added solutions to our customers. We develop solutions that enable a new era of safety and performance for traditional and varying levels of AD. Overall, we are making driving safer, more fuel-efficient and fun for today’s world and an automated future.
Our ability to seamlessly integrate our systems into automotive original equipment manufacturers’ (OEM) vehicles is a testament to our more than 110-year heritage of vehicle integration expertise and product craftsmanship. Our culture inspires employees to achieve personal and corporate growth by focusing on the Company’s core values across all aspects of the Company: People, operational excellence and enterprise growth.
We aim to be the partner of choice for our customers and suppliers by delivering dependable, safety-critical products and building enduring relationships.
Nexteer provides real-world, vehicle-level solutions by being:
• Customer Focused: Respected and trusted for delivering on commitments
• Proactive: We listen carefully to understand customer requirements
• Innovative: A market leader in steering and driveline innovation
• Agile: Able to respond quickly with high-quality, cost-effective solutions
• Global: Committed to exceeding customer and vehicle needs every time, in every customer-targeted market
GLOBAL FOOTPRINT, PRODUCTS & CUSTOMERS
World Headquarters: Auburn Hills, Michigan, United States of America (USA or US)
Manufacturing Plants: 27, including 1 non-consolidated joint venture (JV)
Technical & Software Centres: 4
Customer Service Centres: 14
Products: Electric Power Steering (EPS), Steering Columns and Intermediate Shafts (CIS), Driveline Systems (DL), Hydraulic Power Steering (HPS), ADAS and AD Enabling Technologies
Global Customers: 60+, including BMW Group (BMW), Fiat Chrysler Automobiles N.V. (FCA), Ford Motor Company (Ford), General Motors Company and Subsidiaries (GM), PSA Groupe (PSA), SAIC General Motors Co., Ltd. (Shanghai GM), SAIC-GM-Wuling Automobile Co., Ltd. (SGMW), Toyota Motor Corporation (Toyota), Renault-Nissan-Mitsubishi Alliance (RNM), Changan Automotive (Group) Co., Ltd. (Changan), Maruti Suzuki India Limited (Maruti-Suzuki), Volkswagen Group (VW) and Dongfeng Peugeot Citroën Automobile Co., Ltd. (DPCA), as well as domestic automakers in India, China and South America

03NEXTEER AUTOMOTIVE GROUP LIMITED INTERIM REPORT 2019
Corporate Information
BOARD OF DIRECTORSExecutive DirectorsZHAO, Guibin (趙桂斌) (Chief Executive Officer and Vice Chairman) (became Vice Chairman and no longer served as Chairman with effect from June 3, 2019)RICHARDSON, Michael Paul (President)FAN, Yi (樊毅)
Non-Executive DirectorsWANG, Jian (王堅) (Chairman) (appointed with effect from June 3, 2019)ZHANG, Jianxun (張建勛)LIU, Ping (劉平) (appointed with effect from June 3, 2019)YANG, Shengqun (楊勝群) (retired with effect from June 3, 2019)
Independent Non-Executive DirectorsLIU, Jianjun (劉健君)WEI, Kevin Cheng (蔚成)YICK, Wing Fat Simon (易永發)
COMPANY SECRETARYFAN, Yi (樊毅)
AUTHORISED REPRESENTATIVESZHAO, Guibin (趙桂斌)FAN, Yi (樊毅)
LEGAL ADVISERSAs to Hong Kong LawDLA Piper Hong Kong
As to Cayman Islands LawMaples and Calder
AUDITORPricewaterhouseCoopers
AUDIT AND COMPLIANCE COMMITTEEWEI, Kevin Cheng (蔚成) (Chairman)YICK, Wing Fat Simon (易永發)LIU, Ping (劉平) (appointed with effect from June 3, 2019)YANG, Shengqun (楊勝群) (retired with effect from June 3, 2019)
REMUNERATION AND NOMINATION COMMITTEEYICK, Wing Fat Simon (易永發) (Chairman)LIU, Jianjun (劉健君)ZHANG, Jianxun (張建勛)
HEADQUARTERS1272 Doris RoadAuburn Hills, Michigan 48326, USA
REGISTERED OFFICEP.O. Box 309, Ugland HouseGrand Cayman, KY1-1104Cayman Islands
PRINCIPAL PLACE OF BUSINESS IN HONG KONG31/F, Tower Two Times Square1 Matheson Street Causeway Bay Hong Kong
PRINCIPAL SHARE REGISTRAR AND TRANSFER OFFICEMaples Fund Services (Cayman) LimitedP.O. Box 1093, Boundary Hall Cricket SquareGrand Cayman, KY1-1102 Cayman Islands
HONG KONG BRANCH SHARE REGISTRAR AND TRANSFER OFFICEComputershare Hong Kong Investor Services Limited Shops 1712–171617th Floor Hopewell Centre 183 Queen’s Road East WanchaiHong Kong
PRINCIPAL BANKERSBank of America Merrill Lynch Bank of ChinaBank Pekao SAChina CITIC BankChina Construction Bank Comerica BankJPMorgan Chase & Co.PKO Bank PolskiShanghai Pudong Development BankThe Export-Import Bank of ChinaWells Fargo Capital Finance
STOCK CODESShare ListingOrdinary SharesThe Stock Exchange of Hong Kong Limited (Stock code: 1316)
Senior Notes Listing US$250,000,000 5.875%Senior Notes due 2021The Stock Exchange of Hong Kong Limited (Stock code: 5826)
COMPANY WEBSITEhttp://www.nexteer.com/

04 NEXTEER AUTOMOTIVE GROUP LIMITED INTERIM REPORT 2019
Business Overview
STRATEGY FOR PROFITABLE GROWTH
Nexteer’s six-point strategy for profitable growth continues to yield positive results for the Company. We use these guideposts in our daily decision-making – ultimately driving shareholder value and strengthening our number three global position in both steering and driveline.
A Well-Defi ned Plan to Drive Stakeholder Value
Expand& Diversify
Revenue Base
StrengthenTechnologyLeadership
Capitalise on EPS as Enabler
for ADAS
Optimise CostStructure
Pursue SelectAcquisitions& Alliances
Target China& Emerging
Markets
Strategy for Profi table Growth
FIRST HALF OF 2019 BUSINESS HIGHLIGHTSThe following highlights from the first half of 2019 demonstrate Nexteer’s focus on delivering long-term profitable growth:
• Increased Order-to-Delivery Backlog of Booked Business to US$25.6 billion – a 1.6% increase from US$25.2 billion as at December 31, 2018
• Successfully launched 21 new customer programmes across multiple product lines, regions and customers
• Continued expansion and diversification of our global footprint in regions strategically important to key customers – including India, Morocco and China
• Strengthened technology leadership and software expertise to drive business growth in automotive and new mobility applications
• Continued focus on operational efficiency and corporate social responsibility (CSR)
• Earned industry and customer recognition for product and manufacturing innovation, quality and excellence – as well as for exceptional customer relationships
05NEXTEER AUTOMOTIVE GROUP LIMITED INTERIM REPORT 2019
Business Overview
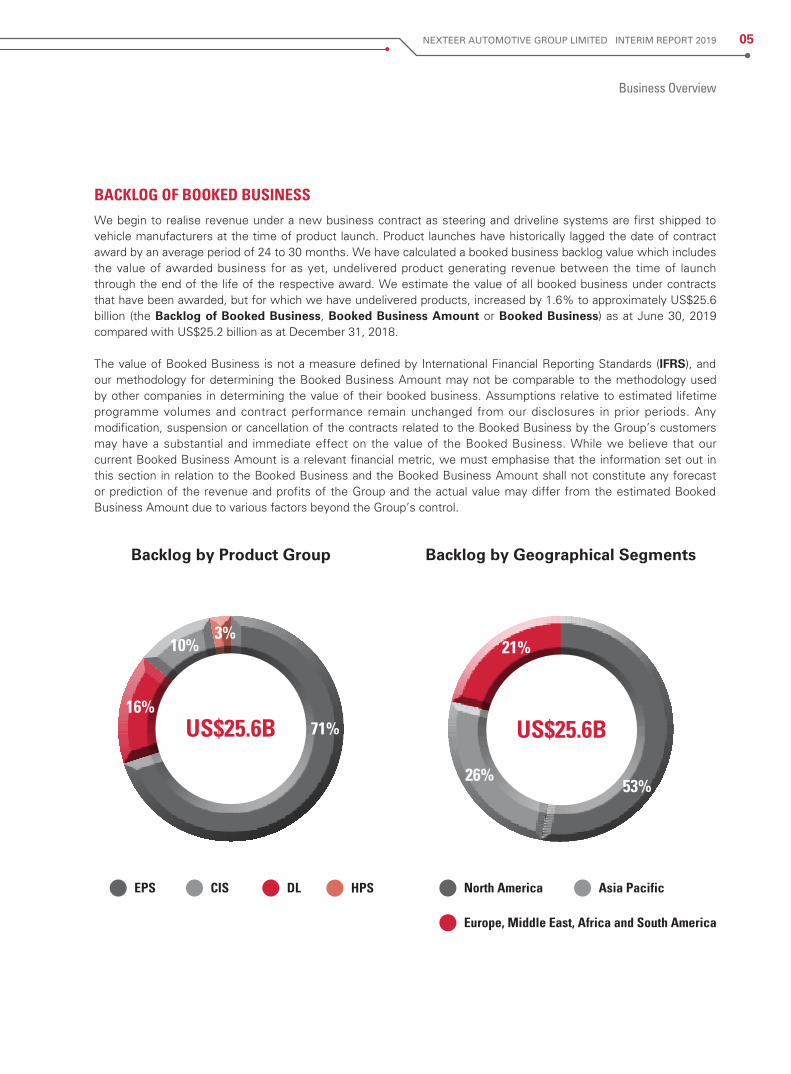
BACKLOG OF BOOKED BUSINESSWe begin to realise revenue under a new business contract as steering and driveline systems are first shipped to vehicle manufacturers at the time of product launch. Product launches have historically lagged the date of contract award by an average period of 24 to 30 months. We have calculated a booked business backlog value which includes the value of awarded business for as yet, undelivered product generating revenue between the time of launch through the end of the life of the respective award. We estimate the value of all booked business under contracts that have been awarded, but for which we have undelivered products, increased by 1.6% to approximately US$25.6 billion (the Backlog of Booked Business, Booked Business Amount or Booked Business) as at June 30, 2019 compared with US$25.2 billion as at December 31, 2018.
The value of Booked Business is not a measure defined by International Financial Reporting Standards (IFRS), and our methodology for determining the Booked Business Amount may not be comparable to the methodology used by other companies in determining the value of their booked business. Assumptions relative to estimated lifetime programme volumes and contract performance remain unchanged from our disclosures in prior periods. Any modification, suspension or cancellation of the contracts related to the Booked Business by the Group’s customers may have a substantial and immediate effect on the value of the Booked Business. While we believe that our current Booked Business Amount is a relevant financial metric, we must emphasise that the information set out in this section in relation to the Booked Business and the Booked Business Amount shall not constitute any forecast or prediction of the revenue and profits of the Group and the actual value may differ from the estimated Booked Business Amount due to various factors beyond the Group’s control.
US$25.6B
3%
71%16%
10%
HPSDLCISEPS
Backlog by Product Group Backlog by Geographical Segments
Europe, Middle East, Africa and South America
Asia PacificNorth America
US$25.6B
53%26%
21%

06 NEXTEER AUTOMOTIVE GROUP LIMITED INTERIM REPORT 2019
Business Overview
NEW PRODUCTION LAUNCHESWith the launch of 21 customer programmes during the first six months of 2019, we introduced new or enhanced product applications in steering and driveline. These programmes included incumbent and conquest business. Customer programmes that began production during the six months ended June 30, 2019 included:
OEMs Vehicle Nameplate Our Products
North AmericaFord Lincoln Aviator Columns, Halfshaft
Ford Explorer Columns, HalfshaftGM GMC Sierra Heavy Duty (HD) and
Chevrolet Silverado HDHPS Gear, HPS Pump, Halfshaft
Cadillac XT6 Rack-assist EPS (REPS), Halfshaft
Europe, Middle East, Africa & South America
PSA DS3 Crossback Single pinion-assist EPS (SPEPS)Peugeot 208 SPEPS
Asia PacificBYD BYD F3 Brush motor column-assist EPS (BEPS)Changan Changan CS35 Plus HalfshaftGM Cadillac XT6 REPS, HalfshaftMahindra Mahindra XUV300 HalfshaftRNM Nissan DAYZ Halfshaft
Mitsubishi eK Wagon HalfshaftSGMW MG Hector BEPSTata Tata Harrier HPS Pump, Halfshaft
CONTINUED GROWTH IN CONQUEST ENVIRONMENT
Nexteer continues to focus on market share gain through the achievement of revenue growth targets to drive organic growth with new customers and expand our presence on new platforms within existing customers. Although the industry has largely completed the hydraulic to electric conversion, the global steering supply base remains unconsolidated – creating a very competitive environment. Our success depends on the design capability, creativity, flexibility and cost profile we bring to each customer opportunity.
In the first half of the year, we continued to successfully displace our competitors for new business wins, including displacing top competitors on several new EPS, DL and CIS programmes for multiple global OEMs. Our ability to conquest pursuits like these over incumbent competitors is driven by our ability to be thoughtful and creative in product and process design – while still staying cost competitive. Our success can also be attributed to the strong customer relationships we have developed based on our flexibility, customer intimacy and ability to tailor applications as needed. Detailed preparation of next-generation products and a robust product portfolio that includes steering technologies of today and tomorrow are also critical to conquest success, especially as OEMs continue to focus their resources and attention on future technologies.

07NEXTEER AUTOMOTIVE GROUP LIMITED INTERIM REPORT 2019
Business Overview
Customer Diversification: Within our strategy for profitable growth, we emphasise the importance of expanding and diversifying our revenue base. We remain focused on securing incremental customer business opportunities that will further grow our backlog of booked business in 2019. In the past two years, Nexteer has added five new EPS customers, and continues to focus on these efforts. As we continue with successful expansion with new and existing customers, this creates a more balanced and diverse customer portfolio.
New Production Launches: 2019 will be a record launch year for Nexteer, with more than 50 customer programme launches planned for this year, with the Asia Pacific region accounting for about two-thirds of our launch activity. In a heavy customer programme launch year, resource allocation, prioritisation and driving efficiencies remain top focus areas across Nexteer to ensure we meet customer timing and quality expectations in the most cost-effective manner possible.
CONTINUED STRATEGIC FOOTPRINT EXPANSIONIn 2019, Nexteer is continuing our thoughtful global footprint diversification and expansion in regions strategically important to our key customers. These new facilities support our approach of producing in the region of consumption to ensure customer responsiveness and short supply lines.
New facilities opened in the first half of 2019 include:
• Software Centre in Bengaluru, India: To support growing demand for software-enabled safety and performance in advanced steering applications, Nexteer opened our India Software Centre (ISC) in January. At the time of this report, the ISC employed almost 140 software engineers with plans to grow to 200 employees by the end of 2019. The new facility focuses on downstream software production and validation – ensuring quality and compliance with our established product requirements as well as those required by external regulations. Meanwhile, Nexteer’s Global Technical Centre in the US, in tandem with regional Technical Centres in Poland and China, will continue upstream software development and research and development (R&D) innovation.
• EPS & DL Production Facility in Chennai, India: As Nexteer’s third manufacturing plant in India, the new Chennai facility was opened in January to expand regional production capacity for Nexteer’s column-assist EPS (CEPS) systems and DL components. Start of production began in May of this year.
• EPS & DL Production Facility in Kenitra, Morocco: In June, Nexteer opened the Kenitra facility – our first in Africa. This facility expands our SPEPS and DL production to support RNM, PSA and FCA customer programmes in Europe and Africa. Start of production is planned for September 2019.
• EPS Production Facility in Liuzhou, China: In June, Nexteer moved our Liuzhou plant to a new, Company-owned facility. The new facility provides customers with CEPS systems and related technologies and services. This new plant enhances Nexteer’s manufacturing capacity in the Asia Pacific region to meet the demand for EPS systems in the Chinese and Asia Pacific markets.

08 NEXTEER AUTOMOTIVE GROUP LIMITED INTERIM REPORT 2019
Business Overview
In the second half of 2019, we plan to open two additional facilities in China. The first will be for our new manufacturing facility in Wuhan as part of our Dongfeng Nexteer Steering Systems (Wuhan) Co., Ltd. (Dongfeng Nexteer) JV. This site will supply EPS primarily for Dongfeng and DPCA programmes. The second will be for our new, state-of-the-art Suzhou Technical Centre (STC). The new STC will serve the Asia Pacific region and act as the product line centre for our CEPS product line.
As part of our global footprint strategy, we have purposely equipped and empowered our regional teams to operate at a higher level of local autonomy. We seek to produce in the region of consumption, and we also focus on performing application engineering in the region of opportunity – within a globally consistent bill of design and bill of process which enables benefits such as error proofing and shared lessons learned. We believe R&D localisation is critical to being able to understand and respond to global customers’ needs and challenges.
CONTINUED STRENGTH AS A TECHNOLOGY LEADERNexteer continues to differentiate ourselves as an intuitive motion control specialist – rather than a “general practitioner.” We are committed to leveraging our strengths in advanced steering and DL to provide value-added solutions to our customers. Our global product development capabilities provide us with a competitive advantage, and we continue to expand these capabilities across the globe – including localising and aligning resources close to our customers. We have further strengthened our industry leadership by collaborating with customers, industry peers and others to continue to advance innovations for motion control solutions.
Diverse EPS Leadership: In February 2019, Nexteer celebrated a production milestone of 60 million EPS systems globally. Nexteer’s EPS systems provide reliable steering control in all driving conditions, while reducing fuel consumption and emissions. Our 60 millionth EPS production milestone came just 14 months after our 50 millionth milestone – which is a testament to our continued global expansion with new customers and in new markets.
Our global EPS milestone was quickly followed by another milestone – production of our 20 millionth REPS system in April. REPS systems are designed for heavier vehicles to handle higher front-axle loads and optimise packaging space. Nexteer is currently the number one REPS supplier globally and in North America, which positions us well to support industry megatrends such as the shift toward a product mix more heavily weighted with sport utility vehicles (SUVs) and trucks. In addition to our REPS leadership position, Nexteer is also the number one SPEPS supplier in Europe – which positions us well to support the region’s second fastest growing EPS architecture (Dual pinion-assist EPS (DPEPS), which Nexteer also sells, is currently the region’s fastest growing EPS architecture).
Nexteer has a broad EPS portfolio to serve all vehicle types, and we continuously work to improve our product offerings to align to evolving customer needs. One such example is our next-generation Brushless CEPS system, called Gen 3.5. Nexteer’s CEPS Gen 3.5 packs more technology and higher performance into a smaller space and has evolved to enable a broader application range of vehicles with added content to deliver increased product reliability, more software content and faster processing speed – all things that global OEMs desire. This new CEPS Gen 3.5 system will be launching on two new energy vehicle (NEV) programmes.

09NEXTEER AUTOMOTIVE GROUP LIMITED INTERIM REPORT 2019
Business Overview
Comprehensive Suite of Advanced Steering Technology: Through Nexteer’s comprehensive suite of advanced steering technology, we are enabling a new era of safety and performance for today’s world and an automated future. Our advanced steering technology suite supports Society of Automotive Engineers (SAE) ADAS Levels 1–5.
As the centre link of this suite, our Steer-by-Wire (SbW) unlocks new benefits for drivers and OEMs including new possibilities for advanced safety features, packaging flexibility and reuse of components. SbW supports traditional and varying levels of automated driving and is a preferred enabler of Automatic Emergency Steering (AES) technology.
In addition to SbW, our comprehensive suite of advanced steering technology also includes:
• High Availability EPS: Award-winning system that ensures the steering safety net is always on through intelligently optimised software designed for simultaneous, multi-path processing and hardware redundancies. These systems are capable of <10 failure in time (FIT) reliability ratings (FIT is measured per billion hours of use).
• Quiet Wheel™ Steering: Allows the steering wheel to remain still during AD mode – even while in the process of turning.
• Steering on Demand™ System: Enables safe, intuitive transitions of steering control between traditional driving and AD in vehicles capable of SAE ADAS Levels 3 and above.
• Stowable Steering Column: Allows the steering wheel to retract during hands-off automated driving.
Alignment to New Energy & Mobility Trends: Since the conversion of the conventional vehicle market to engine-independent steering is largely complete, vehicle autonomy and NEVs represent new and unique market channels for Nexteer. We are taking a thoughtful approach to these opportunities as they follow megatrends that cannot be ignored. Yet, we also realise these unique market opportunities will build slowly and require further work on infrastructure, regulations and safety and technical capabilities, so we continue to retain balance in this area. At the end of 2018, 21% of our EPS backlog comprised of EPS systems that can enable SAE ADAS Levels 3-5, while 9% of our EPS, CIS and DL backlog included solutions for electric vehicle (EV) applications.
As described earlier, our comprehensive suite of advanced steering technology will allow Nexteer to capitalise on technology as an enabler for ADAS. We continue to work with key customers to support commercialisation readiness of higher levels of vehicle autonomy (SAE ADAS Levels 3 and above). We continue to work with FCA and Waymo, and our steering systems are featured on every Chrysler Pacifica vehicle that they are testing on the road today. Current programme launches are planned for 2019 with Waymo and GM, while additional launches are planned in 2020 with Ford and FCA. In March of this year, Nexteer also had a unique opportunity to present our SbW and other ADAS-enabling technologies at BMW’s Winter Ride Session in Sweden.
Electrification and all forms of EVs are expected to grow substantially on a global scale – with China continuing the leadership position for production volume. Nexteer is well-positioned to support this megatrend with our industry-leading REPS and SPEPS systems, as well as DPEPS. These under-hood systems are preferred for EVs because they can support the increased vehicle weight of EVs. SbW also addresses motion control EV challenges in both traditional driving and varying levels of autonomy. SbW enhances packaging flexibility to accommodate batteries and provides benefits to EV drivers, such as enhancing road feedback and improving stability control.

10 NEXTEER AUTOMOTIVE GROUP LIMITED INTERIM REPORT 2019
Business Overview
Our steering systems are currently featured on GM’s battery electric vehicles (BEV), including those without steering wheels and SAE ADAS Level 5 capable. Within the electrification megatrend, OEMs are becoming increasingly interested in our REPS systems and ability to tailor this capability to meet their unique EV needs, especially on larger BEV vehicles. For example, Nexteer’s REPS systems can be tailored for BEV trucks to add functionality such as increasing the steering assist to support heavier loads and adjust for unique packaging needs required for the batteries.
Strategic Software Business Model: Along with industry thought leaders, we view software and electronics as key differentiators and expect market demand for software expertise to continue to grow. That’s why we are committed to differentiating ourselves through the deployment of a global team of software experts that is focused on the delivery of innovative solutions with speed, flexibility and seamless vehicle integration. As mentioned earlier, Nexteer further strengthened our software team with the opening of our ISC in January 2019, which provides downstream software support to our Global and Regional Technical Centres.
The industry is migrating toward domain centralisation, as well as vehicle-level designs that are more defined by software than hardware. OEMs require steering systems with advanced functionality and safety, especially in advanced motion control systems such as SbW and High Availability EPS. This in turn demands complex solutions and a stronger skill set in software and electronics, compared to traditional mechanical engineering. Through our strategic software model, Nexteer is fostering software innovation and ensuring the highest level of quality and compliance with Nexteer specifications, industry protocols and regulations.
Business Alliances & Partnerships: As a leader in our field, we recognise the importance of surrounding ourselves with other leaders in related areas to push the boundaries of motion control innovation and expand our market reach. We have the following business alliances and partnerships in place to support this effort:
• CNXMotion: As a 50/50 JV between Nexteer and Continental Automotive, CNXMotion, LLC (CNXMotion) moves with the agility of a small focused organisation to expand both companies’ portfolios and capabilities by accelerating trusted motion control. In March of this year, CNXMotion completed a second round of winter demonstrations in Sweden to review new features such as road surface detection, which showed our integration capabilities to use multiple system information sets to optimise performance. In addition, AD control continues to mature, with the latest generation exciting customers through its accuracy and natural feel. Several other customer demonstrations are planned for the second half of 2019. Customer events provide broad exposure to industry thought leaders in vehicle handling and SbW, as well as demonstrate that maximum vehicle level impact is a result of allowing subsystems, such as steering and braking, to work together collaboratively.
• Changan & Dongfeng: These deeply embedded alliances each provide Nexteer with unique market channels to expand our addressable market in China. Together, these two domestic OEMs hold about 20% of all of China’s domestic vehicle sales, so these JVs position us well in the critical Chinese market.

11NEXTEER AUTOMOTIVE GROUP LIMITED INTERIM REPORT 2019
Business Overview
Industry Thought Leadership: In the first half of 2019, Nexteer’s industry thought-leaders continued to be sought-after speakers at high-profile events around the world to discuss the challenges, opportunities and solutions in advanced safety and performance, as well as manufacturing excellence. Earlier this year, Nexteer speakers were featured at the following events:
• 2019 China Autonomous Vehicle Summit in Shanghai, China
• 2019 China Automotive Intelligent Manufacturing Innovation Conference in Shanghai, China
• iVT Autonomous Industrial Vehicle Technology Expo & Conference in Cologne, Germany
• Chassis.Tech Plus 2019 in Munich, Germany
• Steering Systems USA 2019 in Detroit, USA
• Best of Best Executive Roundtable in Shanghai, China
CONTINUED ADVANCEMENT IN NEW MOBILITY APPLICATIONSBeyond the automotive market, Nexteer is leveraging our propulsion experience to support adjacent markets and new forms of mobility, such as driverless vehicle opportunities. Programmes we have in the pipeline are enabling us to accumulate new and valuable experience. One such example is our work with GM on electric bicycles (eBikes). Nexteer is the exclusive supplier of mid-drive assemblies for GM’s first premium eBike brand, ARĪV – currently available for purchase in Europe. The mid-drive assemblies include motor, controller and gearing units, and we are utilising existing technologies to support this programme. We are also working in close collaboration with GM engineering to help refine the mid-drive units in terms of quality, cost and design. ARĪV eBikes are urban mobility-style bikes that align to GM’s plan for “zero crashes, zero emissions and zero congestion”.
CONTINUED COMMITMENT TO OPERATIONAL EFFICIENCESA critical element in driving shareholder value is continuous improvement in operational efficiencies and effectiveness. Our approach to continuous improvement includes employing a carefully developed common bill of design, bill of material and bill of process to enable easy read-across all of our manufacturing locations as soon as we identify an opportunity anywhere in the world. Here are two particular areas we want to highlight in this report:
Digital Trace™ Manufacturing (DTM): In March of this year, DTM was recognized with a Manufacturing Leadership Award from the National Association of Manufacturers for outstanding achievement in Enterprise Integration and Technology Leadership. This is the second year in a row that we have been honoured by this organisation for our commitment and leadership in manufacturing excellence. This latest award demonstrates the impact that DTM is having on redefining global manufacturing processes, tools and predictive analytics.
12 NEXTEER AUTOMOTIVE GROUP LIMITED INTERIM REPORT 2019
Business Overview
North America DL Operations Transformation: To improve our efficiency, quality and cost competitiveness in the DL market, Nexteer began transforming the footprint and manufacturing process at our Saginaw, US DL operations in 2018. This transformation will improve customer value by creating global consistency with our other state-of-the-art regional DL operations and enable us to take advantage of customer programme opportunities we see in the current market. Key elements of this transformation include: New assets and technology upgrades, greater reliance on our strategic supply base and enhanced process standards and disciplines. While the bulk of the rewards of this transformation will be realised in 2020 and beyond, this year remains critical to enabling a healthy future for Nexteer’s Saginaw, USA DL operations.
CONTINUED FOCUS ON CSRNexteer views CSR and sustainability as an opportunity – not an obligation. We believe that through sustainable practices, we can continue to improve our performance and provide greater value to all our stakeholders, including shareholders, employees, customers, suppliers, local communities and society. We are integrating sustainability into our global business strategies and operations to help drive performance in five key areas:
• Business Ethics
• Supply Chain
• Health, Safety & Environment
• Value Creation
• Community
We have achieved several key accomplishments recently, including our highest EcoVadis rating to date (Silver) and Environmental Stewardship Recognition from the Carbon Disclosure Project. We invite you to learn more about our culture and the strides we are making to improve our sustainable performance around the planet by reading our 2018 Sustainability Report, now available on Nexteer.com. We publish an annual Sustainability Report in accordance with the Environmental, Social and Governance Reporting Guide, as set out in Appendix 27 to the Rules Governing the Listing of Securities on The Stock Exchange of Hong Kong Limited (the Listing Rules).
CUSTOMER & INDUSTRY RECOGNITIONIn the first half of 2019, Nexteer was honoured for product and manufacturing innovation, quality and excellence – as well as for exceptional customer relationships. Here is a summary of achievements:
• Ford’s “Silver Level Manufacturing Award” for Nexteer Suzhou’s EPS Production
• SGMW’s “Excellent Responding Award” and “International Pioneer Award” for Nexteer Asia Pacific for our quality products, goods service and spirit of partnership
• PSA’s “Platinum Supplier Status Certificate of Excellence” for Nexteer Europe, Middle East, Africa & South America (EMEA & SA) in recognition of outstanding service
13NEXTEER AUTOMOTIVE GROUP LIMITED INTERIM REPORT 2019
Business Overview
• ThyssenKrupp’s “Delivery Quality Award” for Nexteer EMEA & SA
• National Association of Manufacturing’s “Manufacturing Leadership Award for Enterprise Integration and Technology Leadership”
• Moto ldea’s “Decade Award” for Nexteer Poland for making a significant impact on the automotive sector
• American Society for Quality’s (ASQ) “International Team Excellence Award Finalist” for Nexteer Suzhou
• ASQ’s “Attendee Choice Award of Innovative ideas for Internal Stakeholders” for Nexteer Suzhou
• Manpower Group’s “Friendly Place to Work Award” for Nexteer Poland
Nexteer not only wins industry awards and recognition, we help our customers win awards too:
• 2019 Motor Trend Truck of the Year: Ram 1500 featuring our REPS and CIS technologies
• 2019 Motor Trend SUV of the Year: Jeep® Wrangler featuring our CIS technologies
• 2019 North American International Auto Show (NAIAS) Truck of the Year: Ram 1500 featuring our REPS and CIS technologies
ORGANISATIONAL CHANGESWith effect from January 2, 2019, Mr. BENSON OT was appointed as Vice President, Global Sales and Marketing.
During the first half of 2019, the Company changed the titles of its divisional chief operating officers, namely Messrs. HOEG Dennis, LI Jun and BOYER Herve to divisional presidents to better align with external practices.
With effect from July 1, 2019, Mr. KALKMAN Jesse retired as Vice President, Chief Strategy Officer.
With effect from July 1, 2019, Mr. MILAVEC Robin was appointed as Senior Vice President, Chief Technology Officer and Chief Strategy Officer.

14 NEXTEER AUTOMOTIVE GROUP LIMITED INTERIM REPORT 2019
Financial Highlights
For the six months
ended June 30,
For the six months
ended June 30,
Results (US’$000) 2019 2018 Growth rate(Unaudited) (Unaudited)
Revenue 1,832,273 2,046,982 (10.5)%Gross profit 288,895 369,579 (21.8)%Profit before income tax 155,048 231,427 (33.0)%Income tax expense (22,750) (29,084) (21.8)%Profit attributable to equity holders of the Company 131,124 199,605 (34.3)%Profit for the period 132,298 202,343 (34.6)%Adjusted EBITDA 276,914 331,004 (16.3)%
As at June 30,
As at December 31,
Assets and Liabilities (US’$000) 2019 2018 Change(Unaudited) (Audited)
Non-current assets 1,663,508 1,549,296 7.4%Current assets 1,489,156 1,562,215 (4.7)%Non-current liabilities 568,857 580,825 (2.1)%Current liabilities 819,275 820,842 (0.2)%Capital and reserves attributable to the Group’s equity holders 1,725,320 1,671,810 3.2%
These financial highlights should be read in conjunction with the Group’s unaudited Condensed Consolidated Interim Financial Information for the six months ended June 30, 2019 (the Condensed Consolidated Interim Financial Information).

15NEXTEER AUTOMOTIVE GROUP LIMITED INTERIM REPORT 2019
Management Discussion and Analysis
The following management discussion and analysis should be read in conjunction with the unaudited Condensed Consolidated Interim Financial Information, included herein, which have been prepared in accordance with International Accounting Standards (IAS) 34 “Interim Financial Reporting”.
FINANCIAL REVIEWFinancial SummaryThe Group faced a number of macro-environmental headwinds during the first half of 2019 which challenged the financial performance of the business when compared with last year. The Group’s revenue declined by 10.5% in the first half of 2019 compared with the first half of 2018, with all three geographical segments negatively impacted. A decline in OEM production volume across every region and the unfavourable effect of foreign currency translation were the principal factors driving the Company’s revenue comparisons. The Company’s Asia Pacific segment was most significantly impacted by the macro-environment given both the overall decline in China OEM production volume and further declines in demand from its current customer base. While the Company’s North America segment is well positioned in full-size truck and SUV segments, which experienced slightly higher production demand during the first half of 2019 compared with a year ago, lower revenue arising from a customer vehicle platform transition impacting the Company’s CIS product line was an offsetting factor.
The Group’s continued focus on operational efficiencies and cost reduction efforts partially mitigated the impact of lower revenue, resulting in a decrease in net profit attributable to equity holders of 34.3% in the first half of 2019 compared with the same period a year ago. Lower net profit and continued investment for the future contributed to reduced cash flow in the first half of 2019. During the first six months of 2019, the Group successfully launched 21 new customer programmes – 9 programmes in North America, 2 programmes in EMEA & SA and 10 programmes in Asia Pacific.
Operating EnvironmentThe global automotive market has a direct impact on our business and operating results. Factors affecting the industry include macro-economic influences such as consumer confidence, fluctuations in commodity prices, currency, fuel prices and regulatory environments. The Company operates primarily in the US, Mexico, China, Poland, India and Brazil.
OEM light vehicle production softened from the first half of 2018 to the first half of 2019 as a result of a slowing global economy and the effect of trade frictions between the US and several foreign countries, most notably China. According to IHS Markit Ltd., global OEM light vehicle production for the six months ended June 30, 2019 decreased 6.7% compared to the six months ended June 30, 2018, with every region experiencing declines. North America light vehicle production for the six months ended June 30, 2019 declined by 2.5%, although North America full-size truck production was 1.7% higher compared with the same period last year. Asia Pacific light vehicle production for the six months ended June 30, 2019 decreased 7.5% compared to the six months ended June 30, 2018, with China light vehicle production declining by 13.5%. Light vehicle production in EMEA & SA decreased 5.3% for the six months ended June 30, 2019 compared to the six months ended June 30, 2018.
The Company continues to expand its global operating footprint to service its broad and growing customer base and accordingly, the financial results of the business are impacted by changes in foreign currencies measured against the US dollar, principally the European euro (Euro) and Chinese renminbi (RMB). The Group’s financial results during the first half of 2019 were unfavourably impacted by foreign currency translation as the US dollar strengthened against the Euro and RMB compared with the same period a year ago.

16 NEXTEER AUTOMOTIVE GROUP LIMITED INTERIM REPORT 2019
Management Discussion and Analysis
Raw material costs represent a significant portion of the Company’s cost of goods sold and changes in commodity costs have an impact on the financial results of the business in any given period. The Company strives to procure raw materials in the region of consumption and sale of products to its customers to minimise supply chain logistics as well as impacts from changes in foreign currencies and other factors. During 2018 and continuing into 2019, the US has imposed various tariffs on goods imported from several foreign countries, with tariffs on China imports being the most extensive. The purchase of commodities used in the US manufacturing of the Company’s products are largely sourced from US suppliers. Accordingly, tariff actions imposed between the US and China have had a minimal impact on the Company’s financial results through the first half of 2019 as commodity purchases from China and export sales to China from the Company’s US operations are not significant. The Company purchases finished and semi-finished components from third-party suppliers in the US, generally under fixed cost contractual arrangements, which contain materials such as aluminum and steel that are subject to current tariff regulations. The Company continues to work closely with its supplier base to mitigate the impact of such tariffs and through the first half of 2019 the impact on the Company’s financial results has not been significant.
RevenueThe Group’s revenue for the six months ended June 30, 2019 was US$1,832.3 million, a decrease of US$214.7 million or a 10.5% decrease from the six months ended June 30, 2018 of US$2,047.0 million. According to IHS Markit Ltd., global OEM production volume for the six months ended June 30, 2019 decreased 6.7% compared to the six months ended June 30, 2018, with China OEM production lower by 13.5%. Foreign currency translation decreased the Group’s revenue by approximately US$40.0 million, principally impacting the Asia Pacific and EMEA & SA segments given the strength of the US dollar compared with the RMB and Euro.
We measure the results of our operations by geographic segment regions. The change in revenue is analysed by volume, mix, price and foreign currency translation impact. Volume changes are driven by the volume of products sold and mix changes are driven by the type of products sold. Price measures the impact of changes within the pricing structure of each product sold. The impact of foreign currency translation is measured by the changes in foreign currencies compared with the US dollar.
Revenue by Geographical SegmentsFor the six months ended June 30, 2019, the Group experienced a decrease in revenue compared to the six months ended June 30, 2018, with each geographic segment contributing to the decrease.
The following table sets forth revenue by geographic segments for the periods indicated:
For the six months ended June 30, 2019
For the six months ended June 30, 2018
US$’000 % US$’000 %(Unaudited) (Unaudited)
North America 1,274,424 69.5 1,342,893 65.6Asia Pacific 305,370 16.7 418,245 20.4EMEA & SA 252,479 13.8 285,844 14.0
Total 1,832,273 100.0 2,046,982 100.0
17NEXTEER AUTOMOTIVE GROUP LIMITED INTERIM REPORT 2019
Management Discussion and Analysis
The change in revenue by geographical segments is primarily due to the following:
• North America segment – Revenue decreased by US$68.5 million, or a 5.1% decrease, for the six months ended June 30, 2019 compared with same period in 2018. Significant factors contributing to the decrease in revenue included lower overall North America OEM light vehicle production of 2.5% for the first six months ended June 30, 2019 compared with the same period in 2018 according to IHS Markit Ltd., and the loss of revenue arising from a customer vehicle platform transition impacting the Company’s CIS product line. The increase in North America OEM full-size truck production of 1.7% during the same period, as well as revenue from program launches during the first half of 2019, provided a partial offset to these factors.
• Asia Pacific segment – Revenue decreased by US$112.9 million, or a 27.0% decrease, for the six months ended June 30, 2019 compared with the same period in 2018. Significant factors contributing to the revenue decline included unfavourable foreign currency, lower China OEM production demand and customer pricing. The Asia Pacific segment experienced US$19.8 million of unfavourable foreign currency translation as the US dollar strengthened against the RMB during the first half of 2019 compared with same period in 2018. Overall OEM production volumes in the Asia Pacific segment decreased 7.5%, with China lower by 13.5% for the six months ended June 30, 2019 compared with same period in 2018, according to IHS Markit Ltd., reflecting a slowing China economy as well as the political and economic uncertainty of trade negotiations with the US. Several key China OEM customers of the Asia Pacific segment experienced higher production declines from slowing consumer demand during the period which further contributed to the revenue decline.
• EMEA & SA segment – Revenue decreased US$33.4 million, or a 11.7% decrease, for the six months ended June 30, 2019 compared with the same period in 2018. The EMEA & SA segment experienced US$20.2 million of unfavorable foreign currency translation as the US dollar strengthened against the Euro during the first half of 2019 compared with the same period in 2018. Weaker OEM production volume in Europe and South America, decreasing 5.3% for the six months ended June 30, 2019 compared to the six months ended June 30, 2018, according to IHS Markit Ltd., was a secondary driver contributing to the revenue decrease in the segment.
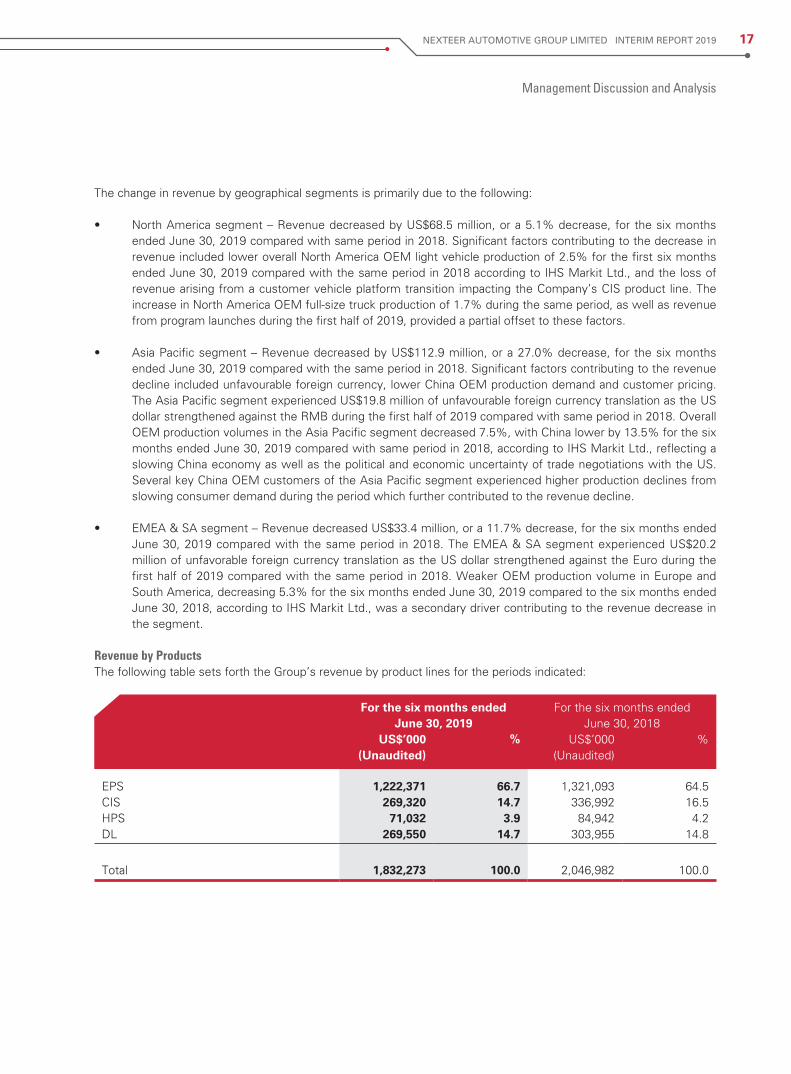
Revenue by ProductsThe following table sets forth the Group’s revenue by product lines for the periods indicated:
For the six months ended June 30, 2019
For the six months ended June 30, 2018
US$’000 % US$’000 %(Unaudited) (Unaudited)
EPS 1,222,371 66.7 1,321,093 64.5CIS 269,320 14.7 336,992 16.5HPS 71,032 3.9 84,942 4.2DL 269,550 14.7 303,955 14.8
Total 1,832,273 100.0 2,046,982 100.0

18 NEXTEER AUTOMOTIVE GROUP LIMITED INTERIM REPORT 2019
Management Discussion and Analysis
The Group experienced a decline in EPS revenue of US$98.7 million for the six months ended June 30, 2019 compared with the same period in 2018, largely reflecting a result of lower OEM production levels in key geographic regions, most notably lower demand from key China OEM customers of the Company’s Asia Pacific segment, as well as unfavourable currency and customer pricing. These factors were partially offset from the benefit of higher OEM full-size truck and SUV production in North America. CIS revenue declined by US$67.7 million for the six months ended June 30, 2019 compared with the same period in 2018, largely reflecting the impact of the loss of revenue from a customer vehicle platform transition during the period. This impact was partially offset by higher revenue associated with increased full-size truck production in North America. DL revenue declined by US$34.4 million for the six months ended June 30, 2019 compared with the same period in 2018, with lower Asia Pacific OEM production being the principal driver. The decrease in HPS revenue resulted from lower production demand from a key customer as expected.
Net Profit Attributable to Equity HoldersThe Group’s net profit attributable to equity holders of the Company for the six months ended June 30, 2019 was US$131.1 million or 7.2% of total revenue, a decrease of US$68.5 million, or a 34.3% decrease, compared to the six months ended June 30, 2018 of US$199.6 million, representing 9.8% of total revenue. The decrease was primarily attributable to the following factors:
• Unfavourable currency reflecting a stronger US dollar against both the RMB and Euro
• Lower OEM light vehicle production across all regions, in particular weak China demand, and the loss of revenue from a North America customer vehicle platform transition unfavourably impacting revenue derived from the Company’s CIS product line
• Unfavourable volume and mix from lower revenue, increased depreciation and amortisation expense related to carry-over and current period new customer programme launches and customer pricing were only partially offset by net material and manufacturing efficiencies and selling, general and administrative cost reductions
• Lower net finance costs driven by on-going debt amortisation and interest income from cash balances and lower income tax expense reflecting jurisdictional profitability provided a further offset to the weaker operating environment
Cost of SalesThe Group’s cost of sales for the six months ended June 30, 2019 was US$1,543.4 million, a decrease of US$134.0 million, or a 8.0% decrease, from US$1,677.4 million as compared with the six months ended June 30, 2018. The Group’s cost of sales for the six months ended June 30, 2019 primarily included raw material costs of US$1,083.4 million (for the six months ended June 30, 2018: US$1,204.3 million).
The Group’s cost of sales decreased principally as a result of lower revenue levels. Material savings initiatives during the first half of 2019 more than offset commodity inflation and tariff specific impacts. The lower OEM demand environment tempered the Company’s manufacturing cost reduction initiatives which only partially offset higher depreciation and amortisation and employee wage, benefits and other inflationary factors.
Depreciation and amortisation charged to cost of sales for the six months ended June 30, 2019 was US$107.3 million, an increase of US$22.0 million, or 25.7% from US$85.3 million for the six months ended June 30, 2018.
Amortisation of capitalised product development costs recorded as cost of sales amounted to US$45.6 million for the six months ended June 30, 2019, representing 2.5% of revenue, an increase of US$9.8 million, or 27.5% as compared with US$35.8 million, representing 1.7% of revenue for the six months ended June 30, 2018. We expect amortisation to continue to increase in future years with the launch of new customer programmes that are currently in development.

19NEXTEER AUTOMOTIVE GROUP LIMITED INTERIM REPORT 2019
Management Discussion and Analysis
For the six months ended June 30, 2019, the Group recorded a product development intangible asset impairment of US$4.2 million related to declining volumes on specific customer programmes in China. The impairment is recorded in the condensed consolidated income statement as cost of sales in the North America and Asia Pacific segments. A portion of the intangible asset impairment associated with customer programmes in China is recorded in the North America segment due the Company’s US domiciled intellectual property holdings.
Gross ProfitThe Group’s gross profit for the six months ended June 30, 2019 was US$288.9 million, a decrease of US$80.7 million or 21.8% as compared with US$369.6 million for the six months ended June 30, 2018. Gross profit percentage for the six months ended June 30, 2019 was 15.8%, a decrease of 230 basis points as compared to 18.1% for the six months ended June 30, 2018. Unfavourable foreign currency, lower OEM light vehicle production and customer specific vehicle platform demand, customer pricing and higher depreciation and amortisation were only partially mitigated by material and manufacturing cost efficiencies, net of inflation, resulting in a decrease in gross profit for the first half of 2019 compared to the same period in 2018.
Engineering and Product Development CostsFor the six months ended June 30, 2019, the Group’s engineering and product development costs charged to the income statement were US$65.4 million, representing 3.6% of revenue, an increase of US$5.9 million, or a 9.9% increase, as compared with US$59.5 million, representing 2.9% of revenue for the six months ended June 30, 2018. Capitalised interest related to engineering development costs was US$7.0 million for both the six months ended June 30, 2019 and for the six months ended June 30, 2018.
The Group’s aggregate investment in engineering and product development costs is defined as the sum of costs charged to the consolidated income statement and total costs capitalised as intangible assets which will be amortised in future periods upon launch of related customer programmes. For the six months ended June 30, 2019, the Group incurred an aggregate investment in engineering and product development costs of US$151.3 million, an increase of US$17.5 million, or a 13.1% increase, as compared with US$133.7 million for the six months ended June 30, 2018. The increase was driven by the Company’s continued focus on expanding its technical capabilities and resources around the world to pursue and acquire new customer programmes as evidenced by the growth in the Backlog of Booked Business, as well as on-going and increasing investments in ADAS and AD-enabling technologies.
Administrative ExpensesThe Group’s administrative expenses for the six months ended June 30, 2019 were US$57.6 million, representing 3.1% of revenue, a decrease of US$5.0 million or a 8.0% decrease, as compared to US$62.7 million, representing 3.1% of revenue for the six months ended June 30, 2018. Continuing efficiency efforts and focus on leveraging the Group’s cost base were the principal factors contributing to the decrease. Favourable foreign currency translation and lower employee stock compensation and long-term incentive expense also provided benefits in the current period compared with 2018.
Other Gains, netOther gains, net represents gains attributable to foreign exchange transactions, losses on disposal of property, plant and equipment and others. Other gains for the six months ended June 30, 2019 were US$3.1 million, an increase of US$1.0 million compared to a gain of US$2.2 million for the six months ended June 30, 2018. The increase was mainly attributable to the receipt of various government grants benefitting the Asia Pacific segment.

20 NEXTEER AUTOMOTIVE GROUP LIMITED INTERIM REPORT 2019
Management Discussion and Analysis
Finance Costs, netFinance costs, net, consist of interest income and expense reduced by interest capitalised on qualifying assets and product development. The Group’s net finance costs for the six months ended June 30, 2019 were US$2.3 million, a decrease of US$4.1 million as compared to US$6.4 million for the six months ended June 30, 2018. Excluding the impact of the increase in borrowings related to the adoption of IFRS 16, Leases, on-going debt repayment and interest income from cash balances were the largest contributors to the reduction in finance costs, net during the six months ended June 30, 2019 compared to 2018.
Share of Loss of Joint Ventures, netShare of loss of joint ventures, net relates to the Company’s investments in CNXMotion, Dongfeng Nexteer and Chongqing Nexteer Steering Systems Co., Ltd. (Chongqing Nexteer). For the six months ended June 30, 2019, the Group’s share of (loss) income in joint ventures amounted to (US$1.6 million), (US$1.0 million) and US$0.4 million related to CNXMotion, Dongfeng Nexteer, and Chongqing Nexteer, respectively (six months ended June 30, 2018: (US$1.3 million), (US$1.0 million) and US$0.3 million). CNXMotion was formed during the first half of 2017 and has incurred R&D costs focused on integrating lateral and longitudinal controls for mixed mode and AD applications. As a R&D entity, CNXMotion is not anticipated to generate direct revenue, but rather benefit the Company from the development and transfer of R&D that may be commercialised and used in the manufacture of future products. Dongfeng Nexteer was formed during 2017 and has not yet commenced production but has incurred organisational costs for the six months ended June 30, 2019. Chongqing Nexteer’s profitability increased during the six months ended June 30, 2019 compared to the six months ended June 30, 2018 as a result of increased revenue driven by increased customer demand.
Income Tax ExpenseThe Group’s income tax expense was US$22.8 million for the six months ended June 30, 2019, representing 14.7% of the Group’s profit before income tax, a decrease of US$6.3 million from US$29.1 million, or 12.6% of profit before tax for the six months ended June 30, 2018, which was primarily the result of reduced profits. Other items causing changes in the Group’s tax expense include tax credits, the impact of US tax reform, withholding tax expenses, and changes in the mix of income generated by US and non-US operations for the six months ended June 30, 2019 compared with 2018.
ProvisionsAs at June 30, 2019, the Group has provisions of US$85.4 million for restructuring, litigation, environmental liabilities, warranties and decommissioning, a decrease of US$3.7 million as compared to US$89.1 million as at December 31, 2018. The decrease in provisions was primarily due to the net change in warranty reserves due to US$5.1 million in cash payments on historical warranty provisions during the first half of 2019. Additionally, the Company has continued its efforts and focus on improving product quality and manufacturing traceability. As a result of these initiatives, the reversal of historical warranty provisions due to lower customer warranty settlements and future claims estimates almost entirely offset new warranty provisions recorded during the first half of 2019.

21NEXTEER AUTOMOTIVE GROUP LIMITED INTERIM REPORT 2019
Management Discussion and Analysis
Liquidity and Capital ResourcesCash FlowsOur business requires a significant amount of working capital, which is primarily used to finance the purchase of raw materials, capital spending for customer programmes and engineering and product development costs. We have historically met our working capital and other capital requirements principally from cash generated from operations and borrowings from third-party financial institutions. We utilise a combination of strategies, including intercompany dividends, intercompany loan structures and other distributions and advances to provide the funds necessary to meet our global liquidity needs. The Company utilises a global cash pooling arrangement to consolidate and manage our global cash balances, which improves cash management efficiency. In recent years, the Group has invested extensively in capital equipment and engineering and product development costs. For the six months ended June 30, 2019, the Group invested US$114.7 million and US$78.5 million in capital equipment and intangible assets, respectively.
The Group’s use of cash for the six months ended June 30, 2019 was directly related to its increased investment in capital and product development to support future growth. We believe that funds generated from operations and cash on hand will be adequate to fund our liquidity and capital requirements.
The following table sets forth a condensed consolidated statement of cash flows for the Group for the periods indicated:
For the six months
ended June 30,
2019
For the six months
ended June 30,
2018US$’000 US$’000
(Unaudited) (Unaudited)
Cash generated from (used in):
Operating activities 240,261 322,732Investing activities (194,846) (139,748)Financing activities (133,532) (166,620)
Net (decrease) increase in cash and cash equivalents (88,117) 16,364

22 NEXTEER AUTOMOTIVE GROUP LIMITED INTERIM REPORT 2019
Management Discussion and Analysis
Cash Flows Generated from Operating ActivitiesFor the six months ended June 30, 2019, the Group’s net cash generated from operating activities was US$240.3 million, a decrease of US$82.5 million compared to US$322.7 million for the six months ended June 30, 2018. The decrease in cash flows from operating activities was primarily due to a reduction in net profit and the timing of collection of customer trade receivables, partially offset by a decrease in cash taxes paid, as a result of a significant income tax receivable at December 31, 2018 which was received during the period ended June 30, 2019.
Cash Flows Used in Investing ActivitiesThe Group’s cash flows used in investing activities primarily reflect capital spending for purchases of machinery, equipment and tooling and capitalised engineering and product development costs as intangible assets to support customer programmes.
The following table sets forth the cash used in investing activities within the Group for the periods indicated:
For the six months
ended June 30,
2019
For the six months
ended June 30,
2018
US$’000 US$’000(Unaudited) (Unaudited)
Purchase of property, plant and equipment (114,721) (76,642)Addition of intangible assets (78,486) (67,253)Proceeds from sale of property, plant and equipment 738 1,376Change in restricted bank deposits – 6,886Investment in joint ventures (2,377) (4,115)
Net cash used in investing activities (194,846) (139,748)
Cash Flows Used in Financing ActivitiesFor the six months ended June 30, 2019, the Group’s net cash used in financing activities was US$133.5 million, a decrease of US$33.1 million compared to US$166.6 million for the six months ended June 30, 2018. The main contributor to the decrease is a reduction in net repayments of borrowings as the repayments during the first half of 2018 included the repayment of the Company’s US term loan. This was partially offset by an increase in dividends paid as a result of increased profits for the year ended December 31, 2018 as compared to 2017. The cash flows used in financing activities were mainly attributable to the net repayment of borrowings of US$44.8 million, finance costs paid of US$13.5 million, dividends paid to shareholders of the Company of US$77.7 million, offset by proceeds from exercise of share options of US$2.5 million.

23NEXTEER AUTOMOTIVE GROUP LIMITED INTERIM REPORT 2019
Management Discussion and Analysis
IndebtednessAs at June 30, 2019, the Group’s total borrowings was US$405.5 million, an increase of US$23.7 million from US$381.8 million as at December 31, 2018. This increase is primarily due to the adoption of IFRS 16, Leases, requiring the Group to record lease liabilities for certain leases with terms extending beyond 12 months. This increase has been partially offset by the payment of maturing debt.
The following table sets forth the balances of short and long-term borrowing obligations within the Group for the periods indicated:
As at June 30,
2019
As at December 31,
2018
US$’000 US$’000(Unaudited) (Audited)
Current borrowings 59,632 64,347Non-current borrowings 278,686 312,294Lease liabilities 67,148 5,113
Total borrowings 405,466 381,754
The table below sets forth the maturity profile of the borrowings within the Group for the periods indicated:
As at June 30,
2019
As at December 31,
2018
US$’000 US$’000(Unaudited) (Audited)
Within 1 year 72,225 66,228Between 1 and 2 years 39,844 65,067Between 2 and 5 years 275,577 250,459Over 5 years 17,820 –
Total borrowings 405,466 381,754
Details of the borrowings of the Group during the period are set out in note 12 to the unaudited Condensed Consolidated Interim Financial Information.
Pledge of AssetsThe Group has several secured borrowings at certain subsidiaries. The assets securing the borrowings differ by site and include accounts receivable, inventories and property, plant and equipment. As at June 30, 2019, the Group had approximately US$540.5 million total assets pledged as collateral, an increase of US$111.8 million as compared with US$428.7 million as at December 31, 2018. The increase in collateral pledged is directly related to increases in the balances of the underlying assets pledged. No changes in collateral arrangements have occurred from December 31, 2018 to June 30, 2019.

24 NEXTEER AUTOMOTIVE GROUP LIMITED INTERIM REPORT 2019
Management Discussion and Analysis
Exposure to Currency Rate Fluctuations and Related HedgesThe Group seeks to limit its foreign currency exposure through matching its purchase of materials and sale of finished goods in the same currencies subject to sourcing constraints. The Group monitors its remaining foreign currency exposure regularly to reduce the risk of foreign currency fluctuations in its operations.
Gearing RatioThe Group monitors capital structure on the basis of the gearing ratio. The gearing ratio is calculated as total borrowings divided by total equity at the end of the respective period.
The gearing ratio as at June 30, 2019 was 23.0%, an increase of 70 basis points as compared with December 31, 2018 which was 22.3%. The gearing ratio increased compared to 2018 as a result of increased borrowings due to the adoption of IFRS 16, Leases.
OTHER INFORMATIONFuture ProspectsThe Group strives to maintain leadership in global advanced steering and driveline systems, ADAS and AD technologies. We boost our prospects by leveraging five Nexteer differentiators in a competitive landscape:
1. Relentless innovation
2. Depth and breadth of our product portfolio
3. Systems integration experience
4. In-house ownership of R&D, design testing and manufacturing
5. Global manufacturing footprint and prowess
Our global footprint continues to enable our capitalisation on the market transition to EPS and continued growth prospects in China and other emerging markets. In addition to strengthening and expanding our current business and customer relationships, we are positioned to capitalise on the “next conversion wave” to ADAS and AD-enabling technologies such as SbW. The Company’s strong financial position also provides the opportunity to pursue selected strategic alliances and/or acquisitions to expand our technical capabilities and resources, product portfolio and geographic market and customer access.
Employees Remuneration PolicyAs at June 30, 2019, the Group had approximately 13,200 full-time employees. The Group’s remuneration policies are formulated based on the performance of individual employees and the Company’s performance and are reviewed regularly. Our full-time employees participate in various employee benefit plans including retirement benefits, extended disability benefits and workers’ compensation. In addition, we have adopted employee incentive plans designed to attract, retain, motivate and encourage employees to commit to enhancing value for us and the shareholders of the Company (the Shareholders) as a whole. For example, the Group has retention programmes that include individual development plans, merit wage adjustments, annual incentive plans and promotions. We offer training programmes to our full-time employees and contract personnel which are designed to develop the skills that we need to meet our enterprise goals and customer requirements and to meet certain training requirements such as mandated customer or regulatory requirement and contractual obligations.
The Group also uses contract personnel to support the workload of the business where considered the most efficient. As at June 30, 2019, we had approximately 800 personnel engaged on a contract basis.

25NEXTEER AUTOMOTIVE GROUP LIMITED INTERIM REPORT 2019
Corporate Governance/Other Information
CORPORATE GOVERNANCE PRACTICESThe Company is committed to maintaining high standards of corporate governance. The Company recognises that sound corporate governance practices are fundamental to our effective and transparent operation and to the Group’s ability to protect the rights of the Shareholders and enhance Shareholder value.
The Company has adopted its own Internal Control and Corporate Governance Policies, which are based on the principles, provisions and practices set out in the Corporate Governance Code and Corporate Governance Report (the Hong Kong CG Code) contained in Appendix 14 to the Listing Rules.
Except as expressly described below, in the opinion of the directors of the Board (the Directors), the Company has complied with all applicable code provisions set out in the Hong Kong CG Code and all applicable laws and regulations that have a significant impact on the business and operation of the Group throughout the six months ended June 30, 2019.
The Company periodically reviews its corporate governance practices with reference to the latest developments of the Hong Kong CG Code.
Chairman and Chief Executive OfficerUnder the Code Provision A.2.1 of the Hong Kong CG Code, the roles of chairman and chief executive officer should be separate and should not be performed by the same individual. During the period from January 1, 2019 to June 2, 2019, Mr. ZHAO Guibin was the Chairman of the Board and the Chief Executive Officer (CEO) of the Company. The Board believed that this structure would not impair the balance of power and authority between the Board and the management of the Company or the Group, given that: (i) decisions made by our Board require approval by at least a majority of our Directors and we believe there are sufficient checks and balances in the Board; (ii) Mr. ZHAO and the other Directors are aware of and undertake to fulfil their fiduciary duties as Directors, which require, among other things, that each Director, including Mr. ZHAO, acts for the benefit and in the best interests of the Group and will make decisions for our Group accordingly; and (iii) the balance of power and authority is ensured by the operations of the Board which is comprised of experienced and high calibre individuals who meet regularly to discuss issues affecting the operations of the Group. Moreover, the overall strategic, financial and operational policies of the Group are made collectively after thorough discussion at both the Board and senior management levels.
In the context of substantive change to and fierce competition in the global automotive industry, to achieve the Company’s vision of “A Leader in Intuitive Motion Control”, the Company’s CEO, Mr. ZHAO Guibin, needs to focus on the Company’s strategy and its execution and ceased to serve as the Chairman of the Board with effect from June 3, 2019. The Board has approved the appointment of Mr. WANG Jian, a non-Executive Director of the Company, as the Chairman of the Board in place of Mr. ZHAO Guibin with effect from June 3, 2019. Upon such appointment, the Company has complied with the Code Provision A.2.1 of the Hong Kong CG Code.
26 NEXTEER AUTOMOTIVE GROUP LIMITED INTERIM REPORT 2019
Corporate Governance/Other Information
COMPLIANCE WITH CODE OF CONDUCT REGARDING DIRECTORS’ SECURITIES TRANSACTIONSThe Company has adopted the Model Code for Securities Transactions by Directors of Listed Issuers (the Model Code) as set out in Appendix 10 to the Listing Rules as the Company’s code of conduct regarding securities transactions by the Directors of the Company. Having made specific enquiry of all Directors, all Directors have confirmed that they complied with the required standards set out in the Model Code for the period ended June 30, 2019.
The Company has also adopted its own code of conduct regarding employees’ securities transactions in terms no less exacting than the standard set out in the Model Code for the compliance by its relevant employees who are likely to be in possession of unpublished inside information of the Company in respect of their dealings in the Company’s securities.
The Company maintains and regularly reviews a sensitivity list identifying factors or developments which are likely to give rise to the emergence of inside information or development of a false market for its securities.
The Company ensures that confidentiality agreements are signed by all relevant parties to a transaction that is likely to give rise to the emergence of inside information or development of a false market for its securities. The Company also adopts appropriate measures to maintain the confidentiality of the information, such as using project codes and restricting access to such information to a limited group of recipients on a need-to-know basis.
The Company organises periodic training as it deems necessary for employees who, because of their office or employment, are likely to be in possession of inside information in relation to the Company, to help them understand the Company’s policies and procedures as well as their relevant disclosure duties and obligations.

27NEXTEER AUTOMOTIVE GROUP LIMITED INTERIM REPORT 2019
Corporate Governance/Other Information
RISK MANAGEMENT AND INTERNAL CONTROLThe Company has adopted a risk management and internal control system and associated procedures and conducts reviews of the effectiveness of the risk management and internal control system of the Group from time to time.
CHANGE IN DIRECTORS’ BIOGRAPHICAL DETAILS UNDER RULE 13.51B(1) OF THE LISTING RULES Mr. WANG Jian (王堅), a non-Executive Director, was elected and appointed as the Chairman of the Board with effect from June 3, 2019.
Mr. ZHAO Guibin (趙桂斌), an Executive Director, was elected and appointed as the Vice Chairman of the Board and no longer served as the Chairman of the Board with effect from June 3, 2019.
Mr. LIU Ping (劉平), a non-executive Director, was appointed as a member of the Audit and Compliance Committee with effect from June 3, 2019.
Except as disclosed above, there is no other change in the Directors’ biographical details which is required to be disclosed pursuant to rule 13.51B(1) of the Listing Rules.
INTERIM DIVIDENDThe Board does not recommend any interim dividend for the six months ended June 30, 2019.
AUDIT AND COMPLIANCE COMMITTEE AND REVIEW OF UNAUDITED CONDENSED CONSOLIDATED INTERIM FINANCIAL INFORMATIONThe Audit and Compliance Committee had reviewed together with management and the external auditor the unaudited Condensed Consolidated Interim Financial Information of the Company for the six months ended June 30, 2019. There has been no disagreement between the Audit and Compliance Committee or the auditor with the accounting treatment adopted by the Company.
PURCHASE, SALE OR REDEMPTION OF LISTED SECURITIES BY THE COMPANYThere was no purchase, sale and redemption of any listed securities of the Company by the Company or any of its subsidiaries during the six months ended June 30, 2019.
SHARE OPTION SCHEMEOn June 5, 2014, the Company adopted a share option scheme (the Share Option Scheme).
The Board may, at its discretion, invite any Directors (excluding Independent non-Executive Directors), senior management as well as other key employees approved by the Board as the Participants (as defined under the Share Option Scheme).
28 NEXTEER AUTOMOTIVE GROUP LIMITED INTERIM REPORT 2019
Corporate Governance/Other Information
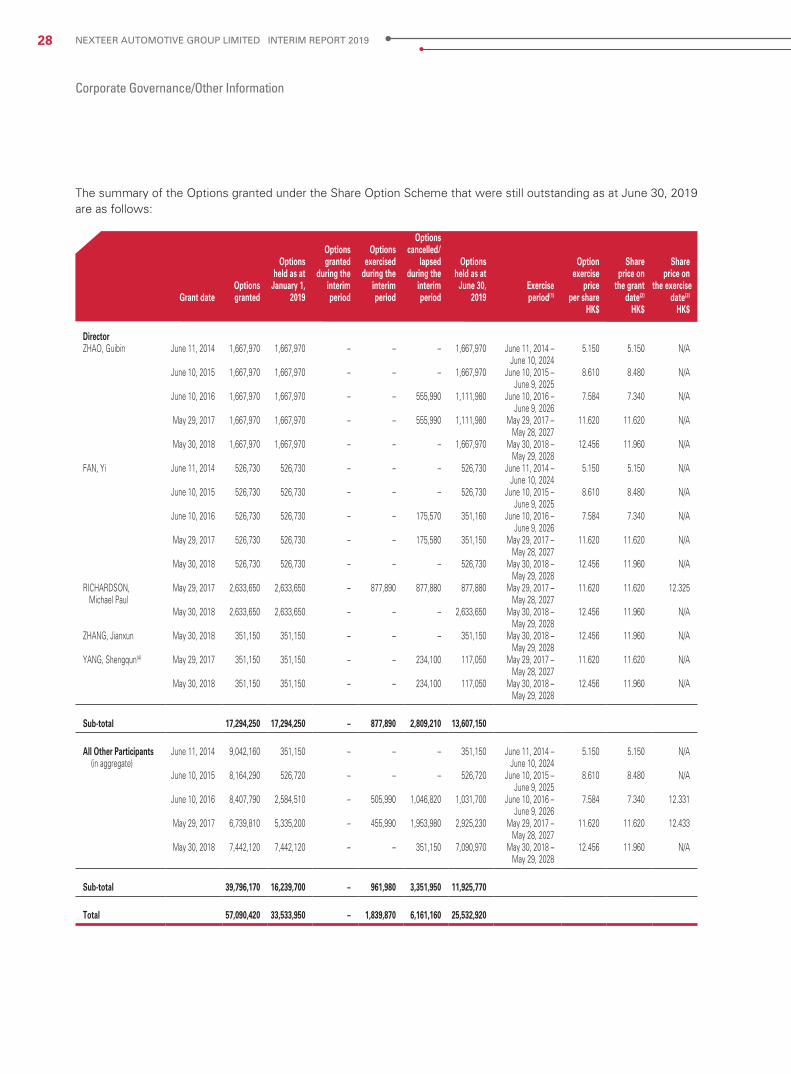
The summary of the Options granted under the Share Option Scheme that were still outstanding as at June 30, 2019 are as follows:
Grant dateOptionsgranted
Optionsheld as at
January 1,2019
Optionsgranted
during theinterimperiod
Optionsexercised
during theinterimperiod
Optionscancelled/
lapsedduring the
interimperiod
Optionsheld as at
June 30,2019
Exerciseperiod(1)
Optionexercise
priceper share
Shareprice on
the grantdate(2)
Shareprice on
the exercisedate(3)
HK$ HK$ HK$
DirectorZHAO, Guibin June 11, 2014 1,667,970 1,667,970 – – – 1,667,970 June 11, 2014 –
June 10, 20245.150 5.150 N/A
June 10, 2015 1,667,970 1,667,970 – – – 1,667,970 June 10, 2015 – June 9, 2025
8.610 8.480 N/A
June 10, 2016 1,667,970 1,667,970 – – 555,990 1,111,980 June 10, 2016 – June 9, 2026
7.584 7.340 N/A
May 29, 2017 1,667,970 1,667,970 – – 555,990 1,111,980 May 29, 2017 – May 28, 2027
11.620 11.620 N/A
May 30, 2018 1,667,970 1,667,970 – – – 1,667,970 May 30, 2018 – May 29, 2028
12.456 11.960 N/A
FAN, Yi June 11, 2014 526,730 526,730 – – – 526,730 June 11, 2014 – June 10, 2024
5.150 5.150 N/A
June 10, 2015 526,730 526,730 – – – 526,730 June 10, 2015 – June 9, 2025
8.610 8.480 N/A
June 10, 2016 526,730 526,730 – – 175,570 351,160 June 10, 2016 – June 9, 2026
7.584 7.340 N/A
May 29, 2017 526,730 526,730 – – 175,580 351,150 May 29, 2017 – May 28, 2027
11.620 11.620 N/A
May 30, 2018 526,730 526,730 – – – 526,730 May 30, 2018 – May 29, 2028
12.456 11.960 N/A
RICHARDSON, Michael Paul
May 29, 2017 2,633,650 2,633,650 – 877,890 877,880 877,880 May 29, 2017 – May 28, 2027
11.620 11.620 12.325
May 30, 2018 2,633,650 2,633,650 – – – 2,633,650 May 30, 2018 – May 29, 2028
12.456 11.960 N/A
ZHANG, Jianxun May 30, 2018 351,150 351,150 – – – 351,150 May 30, 2018 – May 29, 2028
12.456 11.960 N/A
YANG, Shengqun(4) May 29, 2017 351,150 351,150 – – 234,100 117,050 May 29, 2017 – May 28, 2027
11.620 11.620 N/A
May 30, 2018 351,150 351,150 – – 234,100 117,050 May 30, 2018 – May 29, 2028
12.456 11.960 N/A
Sub-total 17,294,250 17,294,250 – 877,890 2,809,210 13,607,150
All Other Participants (in aggregate)
June 11, 2014 9,042,160 351,150 – – – 351,150 June 11, 2014 – June 10, 2024
5.150 5.150 N/A
June 10, 2015 8,164,290 526,720 – – – 526,720 June 10, 2015 – June 9, 2025
8.610 8.480 N/A
June 10, 2016 8,407,790 2,584,510 – 505,990 1,046,820 1,031,700 June 10, 2016 – June 9, 2026
7.584 7.340 12.331
May 29, 2017 6,739,810 5,335,200 – 455,990 1,953,980 2,925,230 May 29, 2017 – May 28, 2027
11.620 11.620 12.433
May 30, 2018 7,442,120 7,442,120 – – 351,150 7,090,970 May 30, 2018 – May 29, 2028
12.456 11.960 N/A
Sub-total 39,796,170 16,239,700 – 961,980 3,351,950 11,925,770
Total 57,090,420 33,533,950 – 1,839,870 6,161,160 25,532,920

29NEXTEER AUTOMOTIVE GROUP LIMITED INTERIM REPORT 2019
Corporate Governance/Other Information
Notes:(1) The Options granted in 2014, 2015, 2016, 2017 and 2018 must be held for one year from June 11, 2014, June 10, 2015, June 10, 2016, May
29, 2017 and May 30, 2018 respectively. The Options are exercisable subject to, amongst other relevant vesting criteria, the vesting schedule of one-third at each anniversary of the Date of Grant of share options.
(2) The exercise price for the Options granted on June 11, 2014 was the closing price of the shares quoted on The Stock Exchange of Hong Kong Limited (the Stock Exchange) on the trading day on the Date of the Grant of the Options. The exercise price for the Options granted on June 10, 2015 and June 10, 2016 was the average closing price for five consecutive trading days prior to the Date of the Grant. The exercise price for the Options granted on May 29, 2017 was the closing price of the shares quoted on the Stock Exchange on the trading Date of the Grant of the Options. The exercise price for the Options granted on May 30, 2018 was HK$12.456, which was the average closing price for five consecutive trading days prior to the date of the grant (i.e. May 29, 2018). The closing price of the shares of the Company immediately before the Date of the Grant (i.e. May 29, 2018) was HK$12.48.
(3) Options exercised during the six months ended June 30, 2019.
(4) Mr. YANG, Shengqun retired as a non-Executive Director with effect from June 3, 2019.
DIRECTORS’ AND CHIEF EXECUTIVE INTERESTS AND SHORT POSITIONS IN SHARES AND UNDERLYING SHARESAs at June 30, 2019, the interests or short positions of the Directors or Chief Executives of the Company in the shares of the Company (the Shares), underlying Shares and debentures of the Company or its associated corporations (within the meaning of Part XV of the Securities and Futures Ordinance (the SFO)) required to be notified to the Company and the Stock Exchange pursuant to Divisions 7 and 8 of Part XV of the SFO (including interest or short positions which they were taken or deemed to have under such provisions of the SFO), or which would be required, pursuant to section 352 of the SFO, to be entered in the register referred to therein, or which would be required to be notified to the Company and the Stock Exchange pursuant to Model Code are as follows:
Interest in the Company
Name Capacity Nature of Interest
No. of underlying
Shares of the Company held (through
share options)(1)
Approximate Percentage of
Total Issued Shares %(2)
ZHAO, Guibin Director and Chief Executive Officer
Beneficial owner 7,227,870(L) 0.29
RICHARDSON, Michael Paul
Director Beneficial owner 3,511,530(L) 0.14
FAN, Yi Director Beneficial owner 2,282,500(L) 0.09ZHANG, Jianxun Director Beneficial owner 351,150(L) 0.01
Notes:(L) Denotes a long position in the Shares.
(1) These represent the interests in underlying Shares in respect of the Options granted by the Company.
(2) The calculation is based on the total number of 2,507,544,833 Shares in issue as at June 30, 2019.

30 NEXTEER AUTOMOTIVE GROUP LIMITED INTERIM REPORT 2019
Corporate Governance/Other Information
Except as disclosed above, as at June 30, 2019, none of our Directors and Chief Executives of the Company have any interests or short positions in the shares, underlying shares or debentures of the Company or its associated corporations (within the meaning of Part XV of the SFO) which were (i) recorded in the register required to be kept under section 352 of the SFO, or (ii) otherwise notified to the Company and the Stock Exchange pursuant to the Model Code.
DIRECTORS’ RIGHTS TO ACQUIRE SHARES OR DEBENTURESExcept as disclosed above, no rights to acquire benefits by means of the acquisition of Shares in or debentures of the Company or any of its subsidiaries were granted to any Director or their respective spouse or children under 18 years of age, nor were any such rights exercised by them. Neither the Company nor any of its subsidiaries was a party to any arrangement to enable the Directors, or their respective spouse or children under 18 years of age, to acquire such rights in any other body corporate for the six months ended June 30, 2019.
SUBSTANTIAL SHAREHOLDERS’ INTERESTS AND SHORT POSITIONS IN SHARES AND UNDERLYING SHARESAs at June 30, 2019, the following Shareholders (excluding the Directors and Chief Executives of the Company) had interests or short positions in any Shares and underlying Shares of the Company which will be required to be disclosed under provisions of Division 2 and 3 of Part XV of the SFO as recorded in the register required to be kept under Section 336 of the SFO:
Name Nature of Interest No. of Shares
Approximate Percentage of
Total Issued Shares %(1)
Nexteer Automotive (Hong Kong) Holdings Limited (Nexteer Hong Kong) (2)
Beneficial owner 1,680,000,000(L) 67.00%
Pacific Century Motors, Inc. (PCM China) (2)
Interest of controlled corporation
1,680,000,000(L) 67.00%
AVIC Automotive Systems Holding Co., Ltd. (AVIC Auto) (3)
Interest of controlled corporation
1,680,000,000(L) 67.00%
Aviation Industry Corporation of China, Ltd. (AVIC) (3)
Interest of controlled corporation
1,680,000,000(L) 67.00%
Notes:(L) Denotes a long position in the Shares.
(1) The calculation is based on the total number of 2,507,544,833 Shares in issue as at June 30, 2019.
(2) Nexteer Hong Kong is wholly-owned by PCM China, which is in turn owned as to 51% by AVIC Auto and as to 49% by Beijing E-Town International Automotive Investment & Management Co. Ltd. (北京亦莊國際汽車投資管理有限公司) (a direct wholly-owned subsidiary of Beijing E-Town International Investment & Development Co. Ltd.). Each of PCM China and AVIC Auto is deemed to be interested in the 1,680,000,000 Shares held by Nexteer Hong Kong.
(3) AVIC Auto is owned as to 70.11% by AVIC. AVIC is deemed to be interested in the 1,680,000,000 Shares held by Nexteer Hong Kong.

31NEXTEER AUTOMOTIVE GROUP LIMITED INTERIM REPORT 2019
Report on Review of Interim Financial Information
REPORT ON REVIEW OF INTERIM FINANCIAL INFORMATIONTO THE BOARD OF DIRECTORS OF NEXTEER AUTOMOTIVE GROUP LIMITED(incorporated in the Cayman Islands with limited liability)
INTRODUCTIONWe have reviewed the interim financial information set out on pages 32 to 70, which comprises the interim condensed consolidated balance sheet of Nexteer Automotive Group Limited (the “Company”) and its subsidiaries (together, the “Group”) as at June 30, 2019 and the interim condensed consolidated income statement, the interim condensed consolidated statements of comprehensive income, the interim condensed consolidated statement of changes in equity and the interim condensed consolidated statement of cash flows for the six-month period then ended, and a summary of significant accounting policies and other explanatory notes. The Rules Governing the Listing of Securities on The Stock Exchange of Hong Kong Limited require the preparation of a report on interim financial information to be in compliance with the relevant provisions thereof and International Accounting Standard 34 “Interim Financial Reporting”. The directors of the Company are responsible for the preparation and presentation of this interim financial information in accordance with International Accounting Standard 34 “Interim Financial Reporting”. Our responsibility is to express a conclusion on this interim financial information based on our review and to report our conclusion solely to you, as a body, in accordance with our agreed terms of engagement and for no other purpose. We do not assume responsibility towards or accept liability to any other person for the contents of this report.
SCOPE OF REVIEWWe conducted our review in accordance with International Standard on Review Engagements 2410, “Review of Interim Financial Information Performed by the Independent Auditor of the Entity”. A review of interim financial information consists of making inquiries, primarily of persons responsible for financial and accounting matters, and applying analytical and other review procedures. A review is substantially less in scope than an audit conducted in accordance with International Standards on Auditing and consequently does not enable us to obtain assurance that we would become aware of all significant matters that might be identified in an audit. Accordingly, we do not express an audit opinion.
CONCLUSIONBased on our review, nothing has come to our attention that causes us to believe that the interim financial information of the Group is not prepared, in all material respects, in accordance with International Accounting Standard 34 “Interim Financial Reporting”.
PricewaterhouseCoopersCertified Public Accountants
Hong Kong, August 13, 2019

32 NEXTEER AUTOMOTIVE GROUP LIMITED INTERIM REPORT 2019
Interim Condensed Consolidated Balance SheetAs at June 30, 2019
As at June 30,
2019
As at December 31,
2018Notes US$’000 US$’000
(Unaudited) (Audited)
ASSETS
Non-current assetsProperty, plant and equipment 7 950,278 933,244Right-of-use assets 8 63,679 –Land use rights 7 3,069 3,520Intangible assets 7 595,356 561,933Deferred income tax assets 8,486 8,621Other receivables and prepayments 10 25,565 25,034Investments in joint ventures 25(b) 17,075 16,944
1,663,508 1,549,296
Current assetsInventories 257,718 234,303Trade receivables 9 558,673 528,859Other receivables and prepayments 10 87,301 124,524Restricted bank deposits 3 3Cash and cash equivalents 585,461 674,526
1,489,156 1,562,215
Total assets 3,152,664 3,111,511
The notes on pages 38 to 70 are an integral part of this condensed consolidated interim financial information.
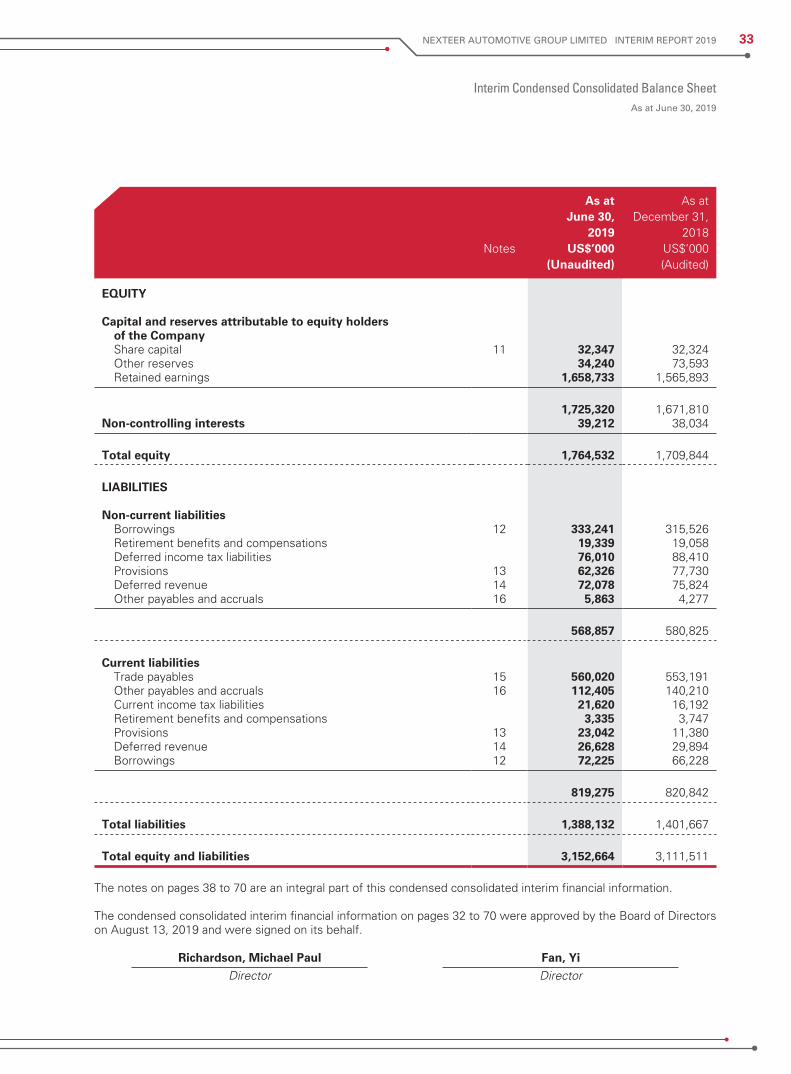
33NEXTEER AUTOMOTIVE GROUP LIMITED INTERIM REPORT 2019
Interim Condensed Consolidated Balance SheetAs at June 30, 2019
As at June 30,
2019
As at December 31,
2018Notes US$’000 US$’000
(Unaudited) (Audited)
EQUITY
Capital and reserves attributable to equity holders of the CompanyShare capital 11 32,347 32,324Other reserves 34,240 73,593Retained earnings 1,658,733 1,565,893
1,725,320 1,671,810Non-controlling interests 39,212 38,034
Total equity 1,764,532 1,709,844
LIABILITIES
Non-current liabilitiesBorrowings 12 333,241 315,526Retirement benefits and compensations 19,339 19,058Deferred income tax liabilities 76,010 88,410Provisions 13 62,326 77,730Deferred revenue 14 72,078 75,824Other payables and accruals 16 5,863 4,277
568,857 580,825
Current liabilitiesTrade payables 15 560,020 553,191Other payables and accruals 16 112,405 140,210Current income tax liabilities 21,620 16,192Retirement benefits and compensations 3,335 3,747Provisions 13 23,042 11,380Deferred revenue 14 26,628 29,894Borrowings 12 72,225 66,228
819,275 820,842
Total liabilities 1,388,132 1,401,667
Total equity and liabilities 3,152,664 3,111,511
The notes on pages 38 to 70 are an integral part of this condensed consolidated interim financial information.
The condensed consolidated interim financial information on pages 32 to 70 were approved by the Board of Directors on August 13, 2019 and were signed on its behalf.
Richardson, Michael Paul Fan, Yi Director Director

34 NEXTEER AUTOMOTIVE GROUP LIMITED INTERIM REPORT 2019
Interim Condensed Consolidated Income StatementFor the six months ended June 30, 2019
For the six months ended June 30,
2019 2018Notes US$’000 US$’000
(Unaudited) (Unaudited)
Revenue 6 1,832,273 2,046,982Cost of sales 18 (1,543,378) (1,677,403)
Gross profit 288,895 369,579Engineering and product development costs 18 (65,373) (59,484)Selling and distribution expenses 18 (9,404) (9,793)Administrative expenses 18 (57,629) (62,666)Other gains, net 17 3,142 2,183
Operating profit 159,631 239,819
Finance income 20 5,452 3,655Finance costs 20 (7,789) (10,073)
Finance costs, net (2,337) (6,418)Share of loss of joint ventures, net 25(b) (2,246) (1,974)
Profit before income tax 155,048 231,427Income tax expense 21 (22,750) (29,084)
Profit for the period 132,298 202,343
Profit attributable to:Equity holders of the Company 131,124 199,605Non-controlling interests 1,174 2,738
132,298 202,343
Earnings per share for profit attributable to equity holders of the Company for the period (expressed in US$ per share)– Basic and diluted 22 0.05 0.08
The notes on pages 38 to 70 are an integral part of this condensed consolidated interim financial information.

35NEXTEER AUTOMOTIVE GROUP LIMITED INTERIM REPORT 2019
Interim Condensed Consolidated Statement of Comprehensive Income For the six months ended June 30, 2019
For the six months ended June 30,2019 2018
US$’000 US$’000(Unaudited) (Unaudited)
Profit for the period 132,298 202,343
Other comprehensive loss
Items that will not be reclassified to profit or lossActuarial losses on defined benefit plans, net of tax (24) (17)
Items that may be reclassified subsequently to profit or lossExchange differences, net of tax (1,080) (22,104)
(1,104) (22,121)
Total comprehensive income for the period 131,194 180,222
Total comprehensive income for the period attributable to:Equity holders of the Company 130,016 178,021Non-controlling interests 1,178 2,201
131,194 180,222
The notes on pages 38 to 70 are an integral part of this condensed consolidated interim financial information.

36 NEXTEER AUTOMOTIVE GROUP LIMITED INTERIM REPORT 2019
Interim Condensed Consolidated Statement of Changes in EquityFor the six months ended June 30, 2019
For the six months ended June 30,
Non-controlling
interests
Share capital
Share premium
Merger reserve
Share-based
compensation reserve
Exchange reserve
Retainedearnings Sub-total Total
US$’000 US$’000 US$’000 US$’000 US$’000 US$’000 US$’000 US$’000 US$’000(note 10)
For the six months ended June 30, 2018 (Unaudited)
As at January 1, 2018 32,310 106,747 113,000 7,548 (43,271) 1,186,077 1,402,411 38,304 1,440,715
Adoption of IFRS 15 – – – – – 406 406 – 406
Comprehensive incomeProfit for the period – – – – – 199,605 199,605 2,738 202,343
Other comprehensive lossExchange differences, net of tax – – – – (21,567) – (21,567) (537) (22,104)Actuarial losses on defined benefit plans, net of tax – – – – – (17) (17) – (17)
Total comprehensive (loss) income – – – – (21,567) 199,588 178,021 2,201 180,222
Transactions with ownersValue of employee services provided under
share option scheme (note 19) – – – (1,103) – – (1,103) – (1,103)Transfer to share premium under exercise
of share options – 237 – (237) – – – – –Proceeds from exercise of share options 7 496 – – – – 503 – 503Dividends paid to shareholders (note 23) – (69,954) – – – – (69,954) – (69,954)Dividends paid to non-controlling interests – – – – – – – (3,097) (3,097)
As at June 30, 2018 32,317 37,526 113,000 6,208 (64,838) 1,386,071 1,510,284 37,408 1,547,692
For the six months ended June 30, 2019 (Unaudi ted)
As at January 1, 2019 32,324 38,289 113,000 6,940 (84,636) 1,565,893 1,671,810 38,034 1,709,844
Adoption of IFRS16 (note 3) – – – – – (2,227) (2,227) – (2,227)
Comprehensive incomeProfit for the period – – – – – 131,124 131,124 1,174 132,298
Other comprehensive (loss) incomeExchange differences, net of tax – – – – (1,084) – (1,084) 4 (1,080)Actuarial losses on defined benefit plans, net of tax – – – – – (24) (24) – (24)
Total comprehensive (loss) income – – – – (1,084) 131,100 130,016 1,178 131,194
Transactions with ownersValue of employee services provided under
share option scheme (note 19) – – – 990 – – 990 – 990Transfer to share premium under exercise
of share options – 970 – (970) – – – – –Proceeds from exercise of share options 23 2,442 – – – – 2,465 – 2,465Dividends paid to shareholders (note 23) – (41,701) – – – (36,033) (77,734) – (77,734)
As at June 30, 2019 32,347 – 113,000 6,960 (85,720) 1,658,733 1,725,320 39,212 1,764,532
The notes on pages 38 to 70 are an integral part of this condensed consolidated interim financial information.

37NEXTEER AUTOMOTIVE GROUP LIMITED INTERIM REPORT 2019
Interim Condensed Consolidated Statement of Cash FlowsFor the six months ended June 30, 2019
For the six months ended June 30,2019 2018
US$’000 US$’000(Unaudited) (Unaudited)
Operating activities
Cash generated from operations 241,652 343,692Income tax paid, net (1,391) (20,960)
Net cash generated from operating activities 240,261 322,732
Investing activities
Purchase of property, plant and equipment (114,721) (76,642)Addition of intangible assets and land use rights (78,486) (67,253)Proceeds from sale of property, plant and equipment 738 1,376Changes in restricted bank deposits – 6,886Investment in joint ventures (2,377) (4,115)
Net cash used in investing activities (194,846) (139,748)
Financing activities
Proceeds from borrowings 4,829 918Repayments of borrowings (49,607) (80,876)Finance costs paid (13,485) (14,114)Dividend paid to equity holders of the Company (77,734) (69,954)Dividends paid to non-controlling interests – (3,097)Proceeds from exercise of share options 2,465 503
Net cash used in financing activities (133,532) (166,620)
Net (decrease) increase in cash and cash equivalents (88,117) 16,364
Cash and cash equivalents at beginning of year 674,526 600,788Effect of exchange rate changes on cash and cash equivalents (948) (11,846)
Cash and cash equivalents at end of period 585,461 605,306
The notes on pages 38 to 70 are an integral part of this condensed consolidated interim financial information.

38 NEXTEER AUTOMOTIVE GROUP LIMITED INTERIM REPORT 2019
Notes to the Condensed Consolidated Interim Financial InformationFor the six months ended June 30, 2019
1 GENERAL INFORMATIONNexteer Automotive Group Limited (the Company) was incorporated in the Cayman Islands on August 21, 2012 as an exempted company with limited liability under the Companies Law (as amended), of the Cayman Islands. The address of the Company’s registered office is PO Box 309, Ugland House, Grand Cayman, KY1-1104, Cayman Islands.
The Company is an investment holding company. The Company, together with its subsidiaries (collectively referred to as the Group), are principally engaged in the design and manufacture of steering and driveline systems, Advanced Driver Assistance Systems (ADAS) and Automated Driving (AD) and components for automobile manufacturers and other automotive-related companies. The Group’s primary operations are in the United States of America (USA or US), Mexico, Poland and the People’s Republic of China (China) and are structured to supply its customers globally. The principal markets for the Group’s products are North America, Europe and China.
The Company’s directors regard Aviation Industry Corporation of China, Ltd. (AVIC), a company established in China, as being the ultimate holding company of the Company.
The Company’s shares have been listed on the Main Board of The Stock Exchange of Hong Kong Limited since October 7, 2013 (the Listing).
This condensed consolidated interim financial information (Condensed Financial Information) is presented in thousands of US dollars (US$’000), unless otherwise stated. This Condensed Financial Information was approved by the Board of Directors of the Company (the Board) for issue on August 13, 2019.
This Condensed Financial Information has not been audited.
2 BASIS OF PREPARATIONThis Condensed Financial Information has been prepared in accordance with International Accounting Standard (IAS) 34 “Interim Financial Reporting.” This Condensed Financial Information should be read in conjunction with the annual financial statements for the year ended December 31, 2018, which have been prepared in accordance with all applicable International Financial Reporting Standards (IFRS), as issued by the International Accounting Standards Board (IASB).
3 ACCOUNTING POLICIESIn addition to those described below, the accounting policies applied are consistent with those of the annual financial statements for the year ended December 31, 2018, as described in those annual financial statements.
New/revised standards, amendments to standards and interpretationsThe Group has adopted the following amendments which are relevant to the Group and mandatory for the accounting period beginning on January 1, 2019.
IFRS 16 LeasesIFRIC Interpretation 23 Uncertainty over income tax treatmentsAmendment to IAS 12 Income taxesAmendment to IAS 23 Borrowing costs

39NEXTEER AUTOMOTIVE GROUP LIMITED INTERIM REPORT 2019
Notes to the Condensed Consolidated Interim Financial InformationFor the six months ended June 30, 2019
3 ACCOUNTING POLICIES (Continued)
New/revised standards, amendments to standards and interpretations (Continued)In January 2016, the IASB issued IFRS 16, Leases, which introduces a lessee model that brings most leases on the balance sheet. The new standard establishes a right-of-use (ROU) model that requires a lessee to recognise a ROU asset and lease liability on the balance sheet for all leases with a term longer than 12 months.
The Group has adopted IFRS 16 effective January 1, 2019 using the modified retrospective approach to prepare the Condensed Financial Information. The cumulative effect of initially applying the new leasing standard was recognised as an adjustment of US$2,227,000 to the opening balance of retained earnings as at January 1, 2019. The comparative information has not been restated and continues to be reported under the accounting standards in effect for the prior year.
On adoption of IFRS 16, the Group recognised lease liabilities in relation to leases which had previously been classified as “operating leases” under the principles of IAS 17 Leases. Those liabilities were measured at the present value of the remaining lease payments, discounted using the applicable incremental borrowing rate as of January 1, 2019. IFRS 16 requires that the rate implicit in the lease be used if readily determinable. Generally, implicit rates are not readily determinable in our contracts and the incremental borrowing rate is used for each lease arrangement. The incremental borrowing rates are determined using rates specific to the term of the lease, economic environments where lease activity is concentrated, value of lease portfolio, and assuming full collateralisation of the loans. The weighted average lessee’s incremental borrowing rate applied to lease liabilities on January 1, 2019 was 5.9%.
The Group has elected the option, on a lease by lease basis, to value the associated ROU assets on a retrospective basis as if the new rules had always been applied. Other ROU assets, for leases where this election was not made, were measured at the amount equal to the lease liability, adjusted by the amount of any prepaid or accrued lease payments relating to that lease recognised in the balance sheet as at December 31, 2018. There were no onerous lease contracts that would have required an adjustment to the ROU assets at the date of initial application.
The Group elected the package of practical expedients, which permits a lessee to not reassess under the new standard its prior conclusions regarding lease identification, lease classification and initial direct costs. The Group also elected the practical expedient, for all asset classes, to account for each lease component of a contract and its associated non-lease components as a single lease component, rather than allocate a standalone value to each component of the lease. The Group did not elect the practical expedient which permits the use of hindsight when determining the lease term and assessing ROU assets for impairment. The Group has elected not to recongnise ROU assets and lease liabilities for short-term leases that have a lease term of 12 months or less and leases of low-value assets. The Group recognises the lease payments associated with these leases as an expense on a straight-line basis over the lease term.
For the purposes of calculating lease obligations under the standard, the Group’s lease terms may include options to extend or terminate the lease when it is reasonably certain that the Group will exercise such option. The Group’s leases do not contain material residual value guarantees or material restrictive covenants.

40 NEXTEER AUTOMOTIVE GROUP LIMITED INTERIM REPORT 2019
Notes to the Condensed Consolidated Interim Financial InformationFor the six months ended June 30, 2019
3 ACCOUNTING POLICIES (Continued)
New/revised standards, amendments to standards and interpretations (Continued)The majority of the Group’s global lease portfolio represents leases of real estate, such as manufacturing facilities and office buildings, while the remainder represents leases of personal property, such as vehicles. The Company determines if an arrangement contains a lease at inception. The majority of the Company’s lease arrangements are comprised of fixed payments and a limited number of these arrangements include a variable payment component based on certain index fluctuations.
Adoption of IFRS 16 resulted in the recording ROU assets of approximately US$61,054,000 and incremental lease liabilities of approximately US$58,619,000 recorded as borrowings within the interim condensed consolidated balance sheet, as at January 1, 2019.
The changes made to our interim condensed consolidated balance sheet as at January 1, 2019 for the adoption of IFRS 16 were as follows:
Balances as at December 31,
2018
Adjustments due to
IFRS 16
Balances as at January 1,
2019US$’000 US$’000 US$’000(Audited) (Unaudited) (Unaudited)
Balance sheet
Assets
Property, plant and equipment 933,244 (6,241) 927,003Right-of-use assets – 61,054 61,054
Liabilities
Borrowings 381,754 58,619 440,373Other payables and accruals 144,487 (1,579) 142,908
Equity
Retained Earnings 1,565,893 (2,227) 1,563,666

41NEXTEER AUTOMOTIVE GROUP LIMITED INTERIM REPORT 2019
Notes to the Condensed Consolidated Interim Financial InformationFor the six months ended June 30, 2019
3 ACCOUNTING POLICIES (Continued)
New/revised standards, amendments to standards and interpretations (Continued)IFRIC Interpretation 23 clarifies how to apply the recognition and measurement requirements in IAS 12 when there is uncertainty over income tax treatment. In such a circumstance, an entity shall recognise and measure its current or deferred tax asset or liability applying the requirements in IAS 12, Income Taxes based on taxable profit (loss), tax bases, unused tax losses, unused tax credits and applicable tax rates. The adoption of IFRIC Interpretation 23 did not have a significant effect on the Condensed Financial Information.
Amendment to IAS 12, Income Taxes clarifies that the income tax consequences of dividends on financial instruments classified as equity should be recognised according to where the past transactions or events that generated distributable profits were recognised. These requirements apply to all income tax consequences of dividends. The adoption of Amendment to IAS 12 did not have a significant effect on the Condensed Financial Information.
Amendment to IAS 23, Borrowing costs, clarifies that if a specific borrowing remains outstanding after the related qualifying asset is ready for its intended use or sale, it becomes part of general borrowing. The adoption of Amendment to IAS 23 did not have a significant effect on the Condensed Financial Information.
The following new standards, amendments to standards, and interpretations relevant to the Group have been issued but are not yet effective for the financial year beginning January 1, 2019 and have not been early adopted:
Amendment to IAS 1 and IAS 8 Presentation of financial statements and Accounting policies, changes in accounting estimates and errors
Management is in the process of assessing their related impacts to the Group.
4 CRITICAL ACCOUNTING ESTIMATES AND JUDGEMENTSThe preparation of Condensed Financial Information requires management to make judgements, estimates and assumptions that affect the application of accounting policies and the reported amounts of assets and liabilities, income and expense. Actual results may differ from these estimates.
In preparing this Condensed Financial Information, the significant judgements made by management in applying the Group’s accounting policies and the key sources of estimation uncertainty were the same as those that were applied to the consolidated financial statements for the year ended December 31, 2018.

42 NEXTEER AUTOMOTIVE GROUP LIMITED INTERIM REPORT 2019
Notes to the Condensed Consolidated Interim Financial InformationFor the six months ended June 30, 2019
5 FINANCIAL RISK MANAGEMENT AND FINANCIAL INSTRUMENTS5.1 Financial risk factors
The Group’s activities expose it to a variety of financial risks: market risk (including foreign exchange risk, cash flow interest rate risk and price risk), credit risk and liquidity risk. The Group’s overall risk management programme focuses on the unpredictability of financial markets and seeks to minimise potential adverse effects on the Group’s financial performance.
This Condensed Financial Information does not include all financial risk management information and disclosures required in the annual financial statements and should be read in conjunction with the Group’s annual financial statements as at December 31, 2018.
(a) Market riskThe objective of market risk management is to manage and control market risk exposures within acceptable parameters while optimising the return.
(i) Foreign exchange riskThe Group operates internationally and is exposed to foreign exchange risk arising from various currency exposures, primarily with respect to European euro (Euro), Polish zloty (PLN), Mexican peso and Chinese renminbi (RMB).
As at each period end, excluding transactional foreign exchange differences, if the US dollar strengthened by 10% against the Euro and RMB with all other variables held constant, the equity and post-tax result for each period would have decreased mainly as a result of foreign exchange differences on translation of Euro and RMB denominated assets and liabilities:
EquityPost-tax
ResultUS$’000 US$’000
As at and for the six months ended June 30, 2019 (Unaudited)
Euro 45,916 2,088RMB 48,905 3,306
As at and for the six months ended June 30, 2018 (Unaudited)
Euro 38,983 1,975RMB 52,760 10,901
A weakening of the US dollar by 10% against the above currencies would have had an equal but opposite effect to the amounts shown above, on the basis that all other variables remained constant.
Management monitors and analyses expected exchange rate developments and considers hedging foreign currency exposure should the need arise.
43NEXTEER AUTOMOTIVE GROUP LIMITED INTERIM REPORT 2019
Notes to the Condensed Consolidated Interim Financial InformationFor the six months ended June 30, 2019
5 FINANCIAL RISK MANAGEMENT AND FINANCIAL INSTRUMENTS (Continued)
5.2 Fair value estimationThe carrying amounts of the Group’s current financial assets and liabilities, including cash and cash equivalents, restricted bank deposits, trade receivables, other receivables and prepayments, trade payables, other payables and accruals and current borrowings approximate their fair values. The fair value of financial liabilities for disclosure purposes is estimated by discounting the future contractual cash flows at the current market interest rate available to the Group for similar financial instruments.
The Group had no financial assets or liabilities measured at fair value as at June 30, 2019 and December 31, 2018. The different levels are defined as follows:
• The fair value of financial instruments traded in active markets is based on quoted market prices at the balance sheet date. A market is regarded as active if quoted prices are readily and regularly available from an exchange, dealer, broker, industry group, pricing service or regulatory agency; and those prices represent actual and regularly occurring market transactions on an arm’s length basis. The quoted market price used for financial assets held by the Group is the current bid price. These instruments are included in Level 1.
• The fair value of financial instruments that are not traded in an active market is determined by using valuation techniques. These valuation techniques maximise the use of observable market data where it is available and rely as little as possible on entity specific estimates. If all significant inputs required to fair value an instrument are observable, the instrument is included in Level 2.
• If one or more of the significant inputs is not based on observable market data, the instrument is included in Level 3.
There were no transfers of financial assets between fair value hierarchy classifications.

44 NEXTEER AUTOMOTIVE GROUP LIMITED INTERIM REPORT 2019
Notes to the Condensed Consolidated Interim Financial InformationFor the six months ended June 30, 2019
6 REVENUE AND SEGMENT INFORMATION6.1 Revenue from contracts with customers
The Company contracts with customers, which are generally automotive manufacturers and automotive original equipment manufacturers, to sell steering and driveline systems and components. In connection with these contracts the Company also provides tooling and prototype parts. The Company does not have material significant payment terms as payment is received at or shortly after the point of sale.
Performance ObligationsThe following summarises types of performance obligations identified in a contract with a customer.
ProductsNature, timing of satisfaction of performance obligations, and payment terms
Production Parts The Company recognises the majority of revenue for production parts at a point in time upon shipment to the customer and transfer of the title and risk of loss under standard commercial terms.
A limited number of the Company’s customer arrangements for customised products with no alternative use provide the Company with the right to payment during the production process. These revenues are recognised over time as performance obligations under the terms of a contract are satisfied.
The amount of revenue recognised is based on the purchase order price. Customers typically pay for the product/prototype based on customary business practices with payment terms averaging 47–60 days.
Tooling The Company’s development and sale of tooling for customers is performed in connection with the preparations to produce and sell products to its customers. Customers typically pay for the tooling in a lump sum upon acceptance.
The Company recognises revenue for tooling over time as it satisfies its performance obligation. Revenue is recognised to the extent of costs incurred to date for reimbursable tooling from customers.
Engineering Design and Development/Prototypes
The Company recognises non-production related engineering design and development revenue, which is normally related to ADAS, performance improvement and business pursuit.
Revenue is recognised to the extent of reimbursable engineering expense incurred to date.

45NEXTEER AUTOMOTIVE GROUP LIMITED INTERIM REPORT 2019
Notes to the Condensed Consolidated Interim Financial InformationFor the six months ended June 30, 2019
6 REVENUE AND SEGMENT INFORMATION (Continued)
6.1 Revenue from contracts with customers (Continued)Contract balancesThe contract assets primarily relate to the Company’s rights to consideration for work completed but not billed at the reporting date on production parts, tooling and engineering design and development/prototype. The contract assets are reclassified into the receivables balance when the rights to receive payment become unconditional. There have been no impairment losses recognised related to contract assets arising from the Company’s contracts with customers. Contract liabilities are associated with consideration received from customers in advance of transferring goods promised in a contract. Recognition of revenue is deferred until the related performance obligations are satisfied in the future. The following table provides information about contract assets and contract liabilities from contracts with customers.
Contract assets(i)
Contract liabilities,
Current(ii)
Contract liabilities,
Non-Current(ii)
US$’000 US$’000 US$’000
Balances as at June 30, 2019 (Unaudited) 24,508 (27,746) (72,078)
Balances as at December 31, 2018 (Audited) 28,248 (32,639) (75,824)
Change in account balance (3,740) 4,893 3,746
(i) Contract assets are recorded within other receivables and prepayments.
(ii) Contract liabilities are recorded within deferred revenue and other payables and accruals.
6.2 Segment informationThe Group’s segment information is presented on the basis of internal reports that are regularly reviewed by the Group’s Chief Executive Officer (CEO), in order to allocate resources to the segments and assess their performance. For each of the Group’s reportable segments, the Group’s CEO reviews internal management reports on a quarterly basis.
The Group classifies its businesses into three reportable segments: North America, Asia Pacific and Europe, Middle East, Africa and South America (EMEA & SA). All of the Group’s operating segments typically offer the same steering and driveline products. The “Others” category represents parent company activities of the Company and activities of its non-operating direct and indirect subsidiaries, as well as elimination entries between segments.
The key performance indicators that the Group monitors to manage segment operations are:
• Operating income before interest, taxes, depreciation and amortisation (including impairment on property, plant and equipment and intangible assets) and share of results of joint ventures (Adjusted EBITDA).
• Total assets and total liabilities represent total current and non-current assets and total current and non-current liabilities of the segments and include assets and liabilities between operating segments.

46 NEXTEER AUTOMOTIVE GROUP LIMITED INTERIM REPORT 2019
Notes to the Condensed Consolidated Interim Financial InformationFor the six months ended June 30, 2019
6 REVENUE AND SEGMENT INFORMATION (Continued)
6.2 Segment information (Continued)Information about reportable segments and reconciliations of reportable segment revenues is as follows:
North America
Asia Pacific EMEA & SA Others Total
US$’000 US$’000 US$’000 US$’000 US$’000
For the six months ended June 30, 2019 (Unaudited)
Total revenue 1,287,171 314,599 259,113 – 1,860,883Inter-segment revenue (12,747) (9,229) (6,634) – (28,610)
Revenue from external customers 1,274,424 305,370 252,479 – 1,832,273Adjusted EBITDA 189,145 59,560 33,552 (5,343) 276,914
For the six months ended June 30, 2018 (Unaudited)
Total revenue 1,360,459 432,590 293,933 – 2,086,982Inter-segment revenue (17,566) (14,345) (8,089) – (40,000)
Revenue from external customers 1,342,893 418,245 285,844 – 2,046,982Adjusted EBITDA 219,524 87,660 28,793 (4,973) 331,004
Revenue transactions between segments are carried out at arm’s length. The revenue from external parties reported to the Group’s CEO is measured in a manner consistent with that in the interim condensed consolidated income statement.

47NEXTEER AUTOMOTIVE GROUP LIMITED INTERIM REPORT 2019
Notes to the Condensed Consolidated Interim Financial InformationFor the six months ended June 30, 2019
6 REVENUE AND SEGMENT INFORMATION (Continued)
6.2 Segment information (Continued)
North America
Asia Pacific EMEA & SA Others Total
US$’000 US$’000 US$’000 US$’000 US$’000
As at June 30, 2019 (Unaudited)
Total assets 1,964,130 884,686 402,424 (98,576) 3,152,664Total liabilities (753,925) (259,813) (161,570) (212,824) (1,388,132)
As at December 31, 2018 (Audited)
Total assets 1,908,820 773,213 377,087 52,391 3,111,511Total liabilities (770,975) (263,319) (145,659) (221,714) (1,401,667)
Reconciliations of reportable segment Adjusted EBITDA to those as determined under IFRS are as follows:
For the six months ended June 30,2019 2018
US$’000 US$’000(Unaudited) (Unaudited)
Adjusted EBITDA from reportable segments 276,914 331,004Depreciation and amortisation expenses (113,041) (91,185)Impairments on intangible assets(i) (4,242) –Finance costs, net (2,337) (6,418)Share of loss of joint ventures, net (2,246) (1,974)
Profit before income tax 155,048 231,427
Note:
(i) Impairment on intangible assets due to declining volumes on specific customer programmes in China, see note 7.
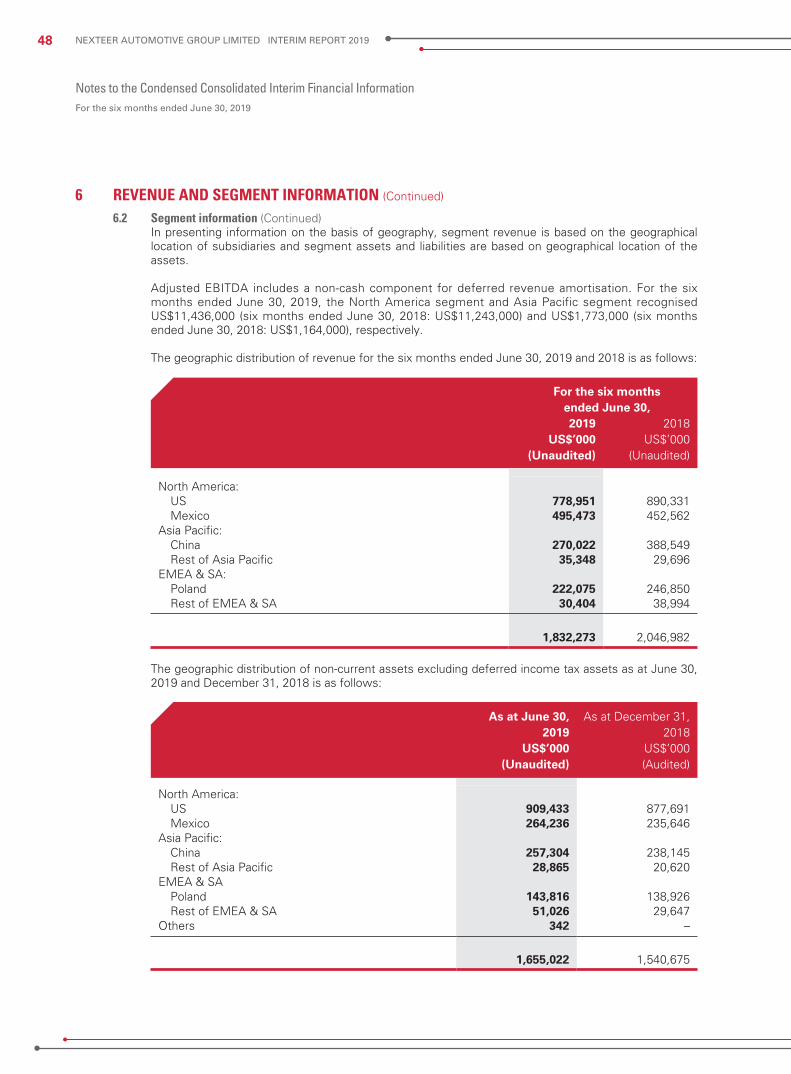
48 NEXTEER AUTOMOTIVE GROUP LIMITED INTERIM REPORT 2019
Notes to the Condensed Consolidated Interim Financial InformationFor the six months ended June 30, 2019
6 REVENUE AND SEGMENT INFORMATION (Continued)
6.2 Segment information (Continued)In presenting information on the basis of geography, segment revenue is based on the geographical location of subsidiaries and segment assets and liabilities are based on geographical location of the assets.
Adjusted EBITDA includes a non-cash component for deferred revenue amortisation. For the six months ended June 30, 2019, the North America segment and Asia Pacific segment recognised US$11,436,000 (six months ended June 30, 2018: US$11,243,000) and US$1,773,000 (six months ended June 30, 2018: US$1,164,000), respectively.
The geographic distribution of revenue for the six months ended June 30, 2019 and 2018 is as follows:
For the six months ended June 30,2019 2018
US$’000 US$’000(Unaudited) (Unaudited)
North America:US 778,951 890,331Mexico 495,473 452,562
Asia Pacific:China 270,022 388,549Rest of Asia Pacific 35,348 29,696
EMEA & SA:Poland 222,075 246,850Rest of EMEA & SA 30,404 38,994
1,832,273 2,046,982
The geographic distribution of non-current assets excluding deferred income tax assets as at June 30, 2019 and December 31, 2018 is as follows:
As at June 30, 2019
As at December 31, 2018
US$’000 US$’000(Unaudited) (Audited)
North America:US 909,433 877,691Mexico 264,236 235,646
Asia Pacific:China 257,304 238,145Rest of Asia Pacific 28,865 20,620
EMEA & SAPoland 143,816 138,926Rest of EMEA & SA 51,026 29,647
Others 342 –
1,655,022 1,540,675

49NEXTEER AUTOMOTIVE GROUP LIMITED INTERIM REPORT 2019
Notes to the Condensed Consolidated Interim Financial InformationFor the six months ended June 30, 2019
6 REVENUE AND SEGMENT INFORMATION (Continued)
6.2 Segment information (Continued)Disaggregation of revenue
North America
Asia Pacific EMEA & SA Total
US$’000 US$’000 US$’000 US$’000
For the six months ended June 30, 2019 (Unaudited)
EPS 759,720 222,003 240,648 1,222,371CIS 255,176 11,167 2,977 269,320HPS 60,018 2,869 8,145 71,032DL 199,510 69,331 709 269,550
1,274,424 305,370 252,479 1,832,273
North America
Asia Pacific EMEA & SA Total
US$’000 US$’000 US$’000 US$’000
For the six months ended June 30, 2018 (Unaudited)
EPS 744,911 307,837 268,345 1,321,093CIS 315,128 17,249 4,615 336,992HPS 69,476 4,236 11,230 84,942DL 213,378 88,923 1,654 303,955
1,342,893 418,245 285,844 2,046,982

50 NEXTEER AUTOMOTIVE GROUP LIMITED INTERIM REPORT 2019
Notes to the Condensed Consolidated Interim Financial InformationFor the six months ended June 30, 2019
6 REVENUE AND SEGMENT INFORMATION (Continued)
6.2 Segment information (Continued)Revenue by type
For the six months ended June 30,2019 2018
US$’000 US$’000(Unaudited) (Unaudited)
Production Parts 1,819,231 2,025,808Tooling 7,861 11,172Engineering Design and Development/Prototypes 5,181 10,002
1,832,273 2,046,982
Revenues from customers amounting to 10 percent or more of the Group’s revenue are as follows and reported in all segments:
For the six months ended June 30,2019 2018
US$’000 US$’000(Unaudited) (Unaudited)
GM 778,844 862,451Customer A 395,326 432,564Customer B 312,111 285,046
1,486,281 1,580,061

51NEXTEER AUTOMOTIVE GROUP LIMITED INTERIM REPORT 2019
Notes to the Condensed Consolidated Interim Financial InformationFor the six months ended June 30, 2019
7 PROPERTY, PLANT AND EQUIPMENT, LAND USE RIGHTS AND INTANGIBLE ASSETS
Property, plant and
equipmentLand use
rightsIntangible
assetsUS$’000 US$’000 US$’000
Six months ended June 30, 2019 (Unaudited)
Net book amount as at January 1, 2019 933,244 3,520 561,933Additions 83,764 (409) 85,953Adoption of IFRS 16(i) (6,241) – –Disposals (1,580) – –Impairments – – (4,242)Depreciation and amortisation (58,751) (42) (48,188)Exchange differences (158) – (100)
Net book amount as at June 30, 2019 950,278 3,069 595,356
Six months ended June 30, 2018 (Unaudited)
Net book amount as at January 1, 2018 884,118 1,500 494,530Additions 67,145 – 74,362Disposals (1,147) – –Depreciation and amortisation (52,855) (22) (38,308)Exchange differences (9,713) (20) (662)
Net book amount as at June 30, 2018 887,548 1,458 529,922
(i) As stated in note 3, the Company adopted IFRS 16, Leases, effective January 1, 2019. Existing financing lease assets were reclassified from property, plant and equipment to right-of-use assets at that date.
Intangible asset additions include additions for product development. Product development cost additions, including capitalised interest for the period ended June 30, 2019 were US$85,879,000 (six months ended June 30, 2018: US$74,221,000).
The Group recorded a product development intangible asset impairment of US$4,242,000 related to declining volumes on specific customer programmes in China. The impairment is recorded in the condensed consolidated income statement as cost of sales in the North America and Asia Pacific segments. A portion of the intangible asset impairment associated with customer programmes in China is recorded in the North America segment due the Company’s US domiciled intellectual property holdings.
Certain of the Group’s property, plant and equipment have been pledged as collateral under the Group’s borrowing arrangements. The carrying amounts of property, plant and equipment pledged as collateral were US$20,649,000 as at June 30, 2019 (December 31, 2018: US$38,412,000).

52 NEXTEER AUTOMOTIVE GROUP LIMITED INTERIM REPORT 2019
Notes to the Condensed Consolidated Interim Financial InformationFor the six months ended June 30, 2019
8 LEASESThe Company’s leases are mainly comprised of real-estate and vehicles. Information about leases for which the Company is a lessee is presented below.
Right-of-use assets
Real-Estate Vehicles Other TotalUS$’000
(Unaudited)
Balance as at January 1, 2019 53,304 871 6,879 61,054
Depreciation charge for thesix months ended June 30, 2019 5,237 201 622 6,060
Balance as at June 30, 2019 56,397 933 6,349 63,679
Additions to the right-of-use assets during the six months ended June 30, 2019 were US$9,626,000.
Lease liabilities(i) Gross lease liabilities – minimum lease payments:
As at June 30,
2019
As at December 31,
2018US$’000 US$’000
(Unaudited) (Audited)
Within 1 year 16,299 2,192Between 1 and 2 years 14,731 1,781Between 2 and 5 years 32,000 1,730Over 5 years 18,608 –
81,638 5,703Less: future finance charges (14,490) (590)
67,148 5,113

53NEXTEER AUTOMOTIVE GROUP LIMITED INTERIM REPORT 2019
Notes to the Condensed Consolidated Interim Financial InformationFor the six months ended June 30, 2019
8 LEASES (Continued)
Lease liabilities (Continued)(ii) Present value of lease liabilities:
As at June 30,
2019
As at December 31,
2018US$’000 US$’000
(Unaudited) (Audited)
Within 1 year 12,593 1,881Between 1 and 2 years 11,464 1,602Between 2 and 5 years 26,259 1,630Over 5 years 16,832 –
67,148 5,113Less: non-current portion (54,555) (3,232)
Current portion 12,593 1,881
For the six months ended June 30, 2019, the Group recognised interest on lease liabilities of US$1,833,000 in the interim condensed consolidated income statement.
For the six months ended June 30, 2019, the Group reccognised total cash outflow for leases of US$5,970,000 in the interim consolidated statement of cashflows.

54 NEXTEER AUTOMOTIVE GROUP LIMITED INTERIM REPORT 2019
Notes to the Condensed Consolidated Interim Financial InformationFor the six months ended June 30, 2019
9 TRADE RECEIVABLES
As at June 30, 2019
As at December 31, 2018
US$’000 US$’000(Unaudited) (Audited)
Trade receivables, gross 560,317 530,512Less: provision for impairment (1,644) (1,653)
558,673 528,859
Credit terms range primarily from 30 to 90 days after the invoice date depending on the customer and the geographical region. Ageing analysis of trade receivables based on invoice date is as follows:
As at June 30, 2019
As at December 31, 2018
US$’000 US$’000(Unaudited) (Audited)
0 to 30 days 336,684 302,18031 to 60 days 196,143 183,47861 to 90 days 22,795 37,844Over 90 days 4,695 7,010
560,317 530,512
Trade receivables of US$28,500,000 were past due but not impaired as at June 30, 2019 (December 31, 2018: US$30,881,000). These relate mainly to a number of customers for whom there is no history of default. The ageing analysis of these past due but not impaired receivables is as follows:
As at June 30, 2019
As at December 31, 2018
US$’000 US$’000(Unaudited) (Audited)
Overdue up to 30 days 22,010 24,897Overdue 31 to 60 days 2,388 936Overdue 61 to 90 days 1,392 551Overdue over 90 days 2,710 4,497
28,500 30,881
The provision for impairment of receivables includes estimates and assessments of individual receivables based on the creditworthiness of the respective customer current economic developments and the analysis of historical losses on receivables. The creditworthiness of a customer is assessed on their payment history, ability to make payments and customer credit rating from third party rating agencies.
The Group applies the simplified approach to providing for expected credit losses prescribed by IFRS 9, which permits the use of the lifetime expected loss provision for all trade receivables. To measure the expected credit losses, trade receivables have been grouped on shared credit risk characteristics and the days past due. The expected credit losses below incorporate forward looking information.
Trade receivables of US$1,644,000 were impaired as at June 30, 2019 on which full provisions were made (December 31, 2018: US$1,653,000). These individually impaired receivables are relatively long overdue.
The carrying amounts of trade receivables pledged as collateral were US$373,685,000 as at June 30, 2019 (December 31, 2018: US$267,081,000).

55NEXTEER AUTOMOTIVE GROUP LIMITED INTERIM REPORT 2019
Notes to the Condensed Consolidated Interim Financial InformationFor the six months ended June 30, 2019
10 OTHER RECEIVABLES AND PREPAYMENTS
As at June 30, 2019
As at December 31, 2018
US$’000 US$’000(Unaudited) (Audited)
Income and other taxes recoverable(i) 43,182 75,678Prepaid assets 31,571 34,150Deposits to vendors 5,885 6,769Contract assets (ii) 24,508 28,248Others 7,720 4,713
112,866 149,558Less: non-current portion (25,565) (25,034)
Current portion 87,301 124,524
(i) Balance mainly represents income and value-added tax recoverable and certain incentives granted to the Group for investing capital and maintaining jobs in the state of Michigan, USA.
(ii) As stated in note 6, under IFRS 15, the Company has some contracts with customers that require revenue to be recognised over time as costs are incurred. Contract assets balance represents rights to consideration for work completed but not billed, related to production parts, reimbursable customer tooling and engineering services.
11 SHARE CAPITAL
Number of ordinary shares Amount
Issued and fully paid:HK$0.10 each as at December 31, 2018 2,505,704,963 HK$250,570,496
Exercise of share options 1,839,870 HK$183,987
HK$0.10 each as at June 30, 2019 2,507,544,833 HK$250,754,483
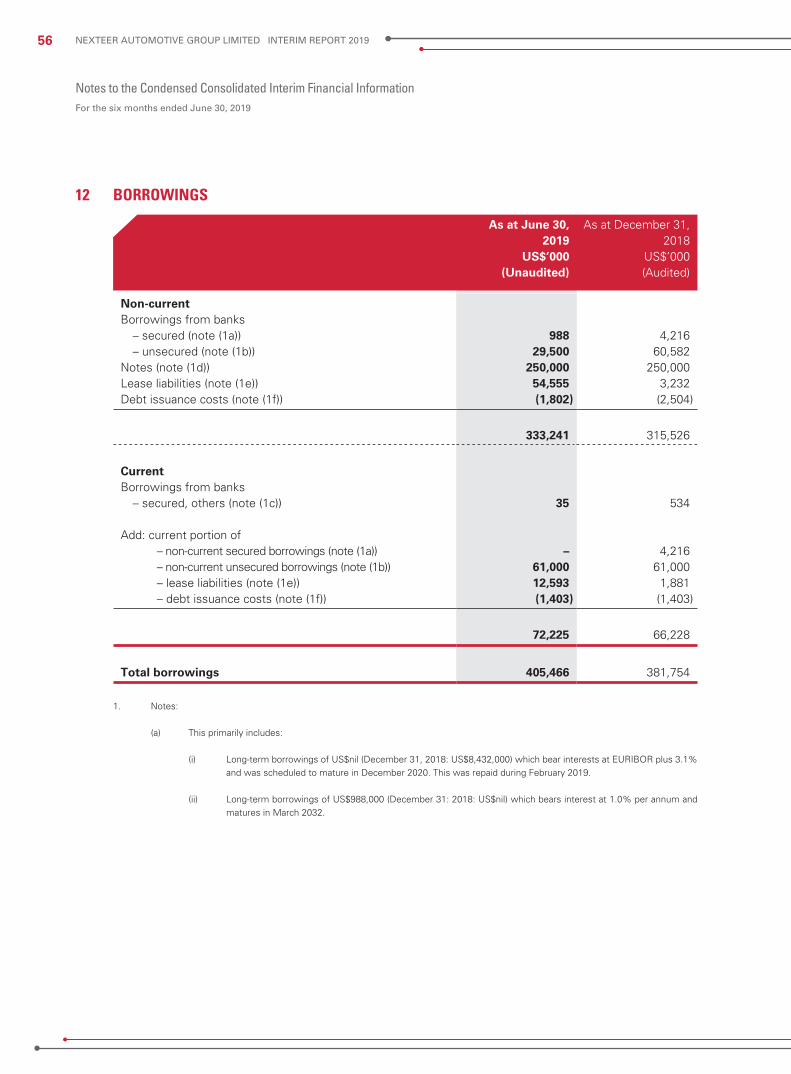
56 NEXTEER AUTOMOTIVE GROUP LIMITED INTERIM REPORT 2019
Notes to the Condensed Consolidated Interim Financial InformationFor the six months ended June 30, 2019
12 BORROWINGS
As at June 30,2019
As at December 31, 2018
US$’000 US$’000(Unaudited) (Audited)
Non-currentBorrowings from banks
– secured (note (1a)) 988 4,216– unsecured (note (1b)) 29,500 60,582
Notes (note (1d)) 250,000 250,000Lease liabilities (note (1e)) 54,555 3,232Debt issuance costs (note (1f)) (1,802) (2,504)
333,241 315,526
CurrentBorrowings from banks
– secured, others (note (1c)) 35 534
Add: current portion of– non-current secured borrowings (note (1a)) – 4,216– non-current unsecured borrowings (note (1b)) 61,000 61,000– lease liabilities (note (1e)) 12,593 1,881– debt issuance costs (note (1f)) (1,403) (1,403)
72,225 66,228 Total borrowings 405,466 381,754
1. Notes:
(a) This primarily includes:
(i) Long-term borrowings of US$nil (December 31, 2018: US$8,432,000) which bear interests at EURIBOR plus 3.1% and was scheduled to mature in December 2020. This was repaid during February 2019.
(ii) Long-term borrowings of US$988,000 (December 31: 2018: US$nil) which bears interest at 1.0% per annum and matures in March 2032.

57NEXTEER AUTOMOTIVE GROUP LIMITED INTERIM REPORT 2019
Notes to the Condensed Consolidated Interim Financial InformationFor the six months ended June 30, 2019
12 BORROWINGS (Continued)
1. Notes: (Continued)
(b) This primarily includes:
(i) Bank loans totaling US$90,500,000 as at June 30, 2019 (December 31, 2018: US$121,000,000), which are guaranteed by AVIC and Beijing E-Town International Investment & Development Co., Ltd., (indirect shareholders of Pacific Century Motors, Inc. which is an intermediate holding company of the Company), bear interest at LIBOR plus 3.5% per annum and due in semi-annual installments of US$30,500,000, which commenced in June 2014 and mature in October 2020 with the last repayment to be made then.
(ii) Long-term borrowings of US$nil (December 31, 2018: US$582,000) which bears interest at 4.75% and matures in August 2020. This was repaid in January 2019.
(c) This primarily includes:
(i) A revolving line of credit of US$nil as at June 30, 2019 (December 31, 2018: US$nil) with availability to borrow up to US$325,000,000 obtained by a subsidiary of the Group which bears interest at LIBOR plus a range of 1.25% to 1.75% per annum, depending on borrowing type, matures in February 2023 and is secured by trade receivables and inventories.
(ii) A factoring facility of US$nil (December 31, 2018: US$nil) with availability to borrow up to US$45,480,000 by a subsidiary of the Group which bears interest at EURIBOR plus 1.05% per annum, is secured by trade receivables and expires in December 2019.
(iii) A revolving line of credit of US$3,000 as at June 30, 2019 (December 31, 2018: US$nil) with availability to borrow up to US$2,894,000 by a subsidiary of the Group which bears interest at the Marginal Cost of Funds Based Lending Rate + 0.8% per annum, is secured by property, plant and equipment, trade receivables and inventories and expires in June 2020.
(iv) A revolving line of credit of US$32,000 as at June 30, 2019 (December 31, 2018: US$534,000) with availability to borrow up to US$2,864,000 by a subsidiary of the Group which bears interest at the Marginal Cost of Funds Based Lending Rate + 0.5% per annum, is secured by property, plant and equipment, trade receivables and inventories and expires in September 2019.
(d) Notes of US$250,000,000 in aggregate principal amount of 5.875% senior unsecured notes maturing in November 2021.
(e) See note 8 for details on lease liabilities.
(f) The Group capitalised debt issuance costs related to various borrowing as noted above. Amortisation of the debt issuance costs is recognised in the income statement as finance cost over the period of the borrowing using the effective interest method. The unamortised balance of debt issuance costs is US$3,205,000 as at June 30, 2019 (December 31, 2018: US$3,907,000).

58 NEXTEER AUTOMOTIVE GROUP LIMITED INTERIM REPORT 2019
Notes to the Condensed Consolidated Interim Financial InformationFor the six months ended June 30, 2019
12 BORROWINGS (Continued)
2. Maturity of borrowings
As at June 30,2019
As at December 31,2018
US$’000 US$’000(Unaudited) (Audited)
Within 1 year 72,225 66,228Between 1 and 2 years 39,844 65,067Between 2 and 5 years 275,577 250,459Over 5 years 17,820 –
405,466 381,754
3. The carrying amount and fair value of non-current borrowings are as follows:
Carrying amount Fair valueAs at June 30,
2019As at December 31,
2018As at June 30,
2019As at December 31,
2018US$’000 US$’000 US$’000 US$’000
(Unaudited) (Audited) (Unaudited) (Audited)
Bank borrowings 29,671 63,637 30,560 65,789Other borrowings 249,015 248,657 253,797 252,669
278,686 312,294 284,357 318,458
The fair values of bank borrowings are based on discounted cash flows using applicable discount rates based upon the prevailing market rates of interest available to the Group for financial instruments with substantially the same terms and characteristic as at the balance sheet dates. Such discount rates ranged from 4.71% to 5.01% as at June 30, 2019 (December 31, 2018: 0.91% to 4.31%), depending on the type of the debt and were within Level 2 of the fair value hierarchy.
The fair values of other borrowings are based on quoted prices in active markets and were within Level 1 of the fair value hierarchy.

59NEXTEER AUTOMOTIVE GROUP LIMITED INTERIM REPORT 2019
Notes to the Condensed Consolidated Interim Financial InformationFor the six months ended June 30, 2019
12 BORROWINGS (Continued)
4. Weighted average annual interest rates
As at June 30, 2019
As at December 31,2018
US$’000 US$’000(Unaudited) (Audited)
Bank borrowings 7.4% 6.4%Notes 5.9% 5.9%
5. Currency denomination
As at June 30,2019
As at December 31,2018
US$’000 US$’000(Unaudited) (Audited)
US$ 366,209 372,206RMB 17,048 581Euro 14,213 8,433Indian rupee 5,850 534Others 2,146 –
405,466 381,754
13 PROVISIONS
As at June 30, 2019 (Unaudited)
As at December 31, 2018 (Audited)
CurrentNon-
current Total CurrentNon-
current TotalUS$’000 US$’000 US$’000 US$’000 US$’000 US$’000
Restructuring – – – 195 – 195Litigation (note (a)) 59 242 301 59 208 267Environmental liabilities
(note (b)) 150 11,989 12,139 150 12,003 12,153Warranties (note (c)) 22,833 41,679 64,512 10,976 57,304 68,280Decommissioning (note (d)) – 8,416 8,416 – 8,215 8,215
23,042 62,326 85,368 11,380 77,730 89,110

60 NEXTEER AUTOMOTIVE GROUP LIMITED INTERIM REPORT 2019
Notes to the Condensed Consolidated Interim Financial InformationFor the six months ended June 30, 2019
13 PROVISIONS (Continued)
Movement of provisions is as follows:
RestructuringLitigation (note (a))
Environmental liabilities (note (b))
Warranties (note (c))
Decom- missioning
(note (d)) TotalUS$’000 US$’000 US$’000 US$’000 US$’000 US$’000
Six months ended June 30, 2019 (Unaudited)
As at January 1, 2019 195 267 12,153 68,280 8,215 89,110Additions (reversals) – 205 1 1,421 203 1,830Payments (197) (174) (16) (5,125) – (5,512)Exchange differences 2 3 1 (64) (2) (60)
As at June 30, 2019 – 301 12,139 64,512 8,416 85,368
Six months ended June 30, 2018 (Unaudited)
As at January 1, 2018 1,004 326 12,183 86,158 7,982 107,653Additions (reversals) – 382 – (190) 183 375Payments (780) (292) (10) (15,653) (106) (16,841)Exchange differences (21) (52) (11) (832) (17) (933)
As at June 30, 2018 203 364 12,162 69,483 8,042 90,254
Notes:
a. Litigation
The balance represents a provision primarily for certain labour claims brought against the Group. Litigation is subject to many uncertainties and the outcome of the individual litigated matters is not predictable with assurance. Based on currently available information, it is the opinion of management that the outcome of such matters will not have a material adverse impact on the Group.
b. Environmental liabilities
A provision is recognised for remediation costs to be incurred for the restoration of the manufacturing sites upon the initial recognition of the related assets.
c. Warranty
A provision is recognised for warranty costs associated with products sold to the customer principally at the time of sale or when it is determined that such obligations are probable and can be reasonably estimated. For the six months ended June 30, 2019, warranty provisions recorded were net of reversals of US$17,396,000 which related to adjustments of provisions recorded in prior periods as a current period estimate revision based on improved quality (June 30, 2018: US$11,614,000).
d. Decommissioning
This represents asset retirement obligations at certain of the Group’s manufacturing sites.

61NEXTEER AUTOMOTIVE GROUP LIMITED INTERIM REPORT 2019
Notes to the Condensed Consolidated Interim Financial InformationFor the six months ended June 30, 2019
14 DEFERRED REVENUEThe Group periodically receives upfront consideration from customers in connection with engineering, prototyping and pre-production programme-specific activities. These revenue amounts are deferred and recognised over the life of the related programme, which typically ranges between four and seven years. The carrying amount of deferred revenue is as follows:
As at June 30, 2019 (Unaudited)
As at December 31, 2018 (Audited)
CurrentNon-
current Total CurrentNon-
current TotalUS$’000 US$’000 US$’000 US$’000 US$’000 US$’000
Pre-production activity 26,628 72,078 98,706 29,894 75,824 105,718
Movement of deferred revenue is as follows:
For the six months ended June 30,
2019 2018US$’000 US$’000
(Unaudited) (Unaudited)
As at January 1 105,718 111,901Additions 6,177 7,980Amortisation (13,209) (12,407)Exchange differences 20 (89)
As at June 30 98,706 107,385
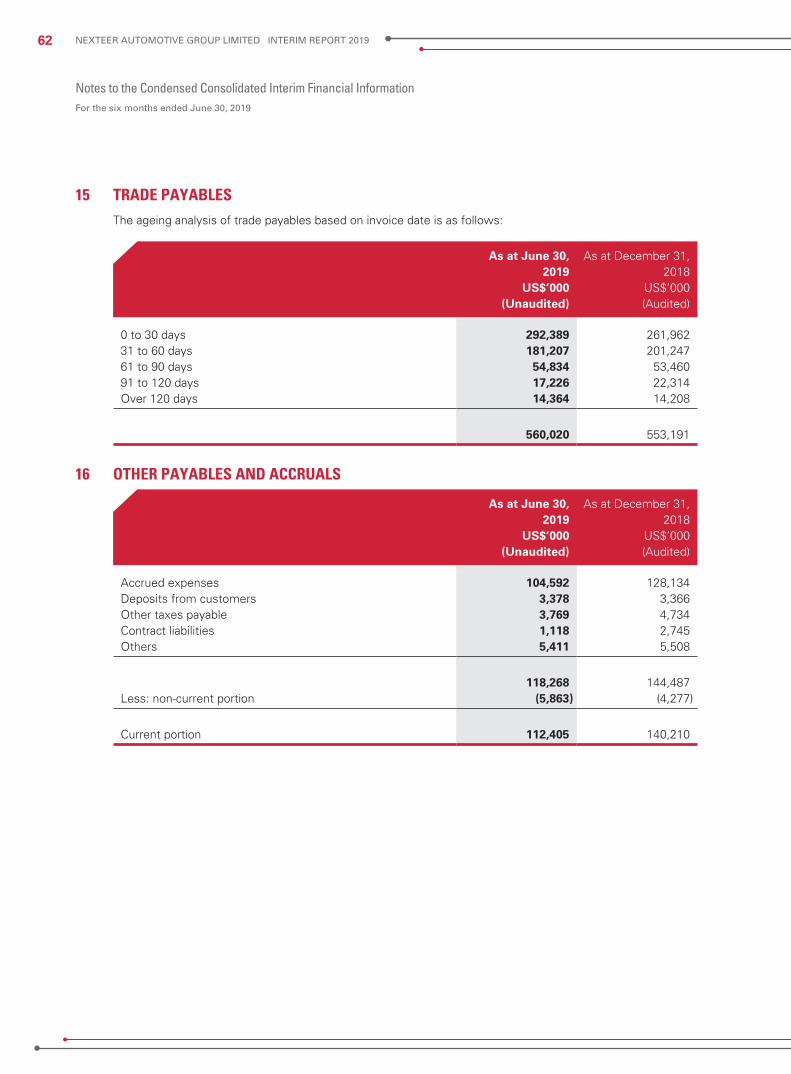
62 NEXTEER AUTOMOTIVE GROUP LIMITED INTERIM REPORT 2019
Notes to the Condensed Consolidated Interim Financial InformationFor the six months ended June 30, 2019
15 TRADE PAYABLESThe ageing analysis of trade payables based on invoice date is as follows:
As at June 30, 2019
As at December 31, 2018
US$’000 US$’000(Unaudited) (Audited)
0 to 30 days 292,389 261,96231 to 60 days 181,207 201,24761 to 90 days 54,834 53,46091 to 120 days 17,226 22,314Over 120 days 14,364 14,208
560,020 553,191
16 OTHER PAYABLES AND ACCRUALS
As at June 30, 2019
As at December 31, 2018
US$’000 US$’000(Unaudited) (Audited)
Accrued expenses 104,592 128,134Deposits from customers 3,378 3,366Other taxes payable 3,769 4,734Contract liabilities 1,118 2,745Others 5,411 5,508
118,268 144,487Less: non-current portion (5,863) (4,277)
Current portion 112,405 140,210

63NEXTEER AUTOMOTIVE GROUP LIMITED INTERIM REPORT 2019
Notes to the Condensed Consolidated Interim Financial InformationFor the six months ended June 30, 2019
17 OTHER GAINS, NET
For the six months ended June 30,
2019 2018US$’000 US$’000
(Unaudited) (Unaudited)
Foreign exchange gains 624 312(Loss) gain on disposal of property, plant and equipment (840) 229Others 3,358 1,642
3,142 2,183
18 EXPENSE BY NATURE
For the six months ended June 30,
2019 2018US$’000 US$’000
(Unaudited) (Unaudited)
Raw materials used 1,083,424 1,204,318Changes in inventories of finished goods and work-in-progress 4,734 (7,144)Employee benefit costs 259,777 292,383Temporary labour costs 60,577 60,672Supplies and tools 104,698 102,348Depreciation on property, plant and equipment (note 7) 58,751 52,855Depreciation on right-of-use asset (note 8) 6,060 –Amortisation on
– land use rights (note 7) 42 22– intangible assets (note 7) 48,188 38,308
Impairment (reversals of provisions) charges on– inventories (2,392) 2,088– receivables (9) (11)– intangible assets 4,242 –
Warranty expenses (reversals) (note 13) 1,421 (190)Auditors’ remuneration
– audit services 571 586Others 45,700 63,111
Total cost of sales, engineering and product development costs, selling and distribution, and administrative expenses 1,675,784 1,809,346
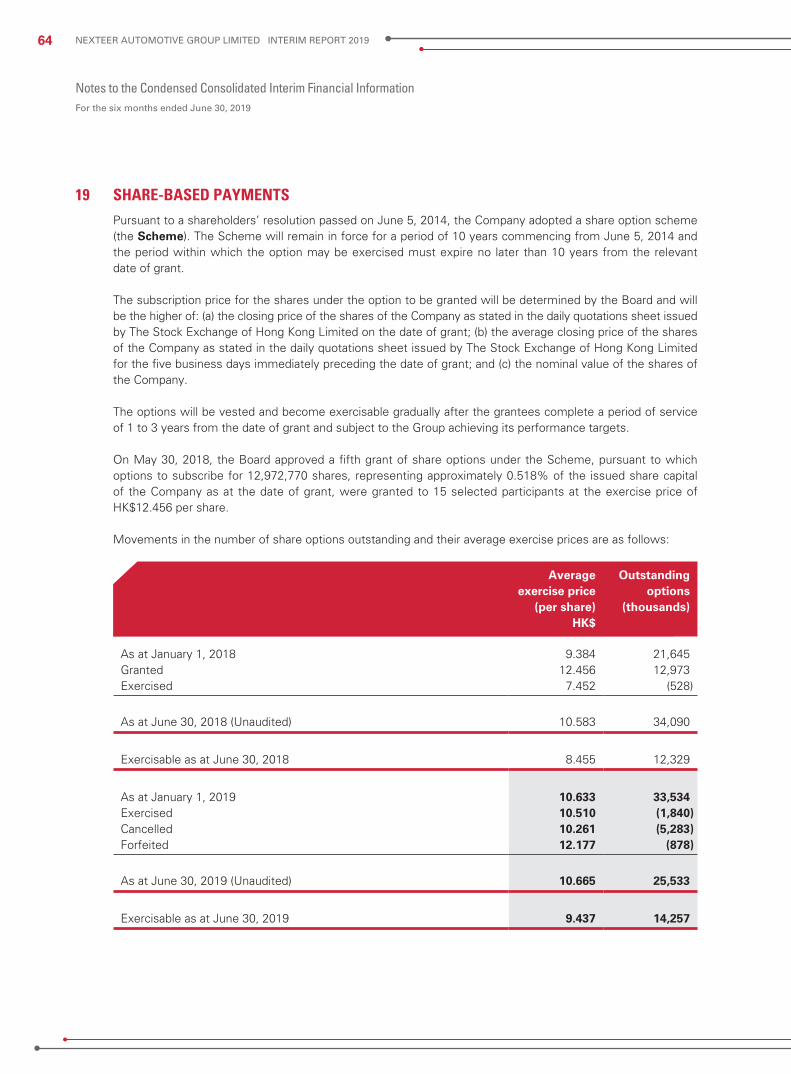
64 NEXTEER AUTOMOTIVE GROUP LIMITED INTERIM REPORT 2019
Notes to the Condensed Consolidated Interim Financial InformationFor the six months ended June 30, 2019
19 SHARE-BASED PAYMENTSPursuant to a shareholders’ resolution passed on June 5, 2014, the Company adopted a share option scheme (the Scheme). The Scheme will remain in force for a period of 10 years commencing from June 5, 2014 and the period within which the option may be exercised must expire no later than 10 years from the relevant date of grant.
The subscription price for the shares under the option to be granted will be determined by the Board and will be the higher of: (a) the closing price of the shares of the Company as stated in the daily quotations sheet issued by The Stock Exchange of Hong Kong Limited on the date of grant; (b) the average closing price of the shares of the Company as stated in the daily quotations sheet issued by The Stock Exchange of Hong Kong Limited for the five business days immediately preceding the date of grant; and (c) the nominal value of the shares of the Company.
The options will be vested and become exercisable gradually after the grantees complete a period of service of 1 to 3 years from the date of grant and subject to the Group achieving its performance targets.
On May 30, 2018, the Board approved a fifth grant of share options under the Scheme, pursuant to which options to subscribe for 12,972,770 shares, representing approximately 0.518% of the issued share capital of the Company as at the date of grant, were granted to 15 selected participants at the exercise price of HK$12.456 per share.
Movements in the number of share options outstanding and their average exercise prices are as follows:
Average exercise price
(per share)
Outstanding options
(thousands)HK$
As at January 1, 2018 9.384 21,645Granted 12.456 12,973Exercised 7.452 (528)
As at June 30, 2018 (Unaudited) 10.583 34,090
Exercisable as at June 30, 2018 8.455 12,329
As at January 1, 2019 10.633 33,534Exercised 10.510 (1,840)Cancelled 10.261 (5,283)Forfeited 12.177 (878)
As at June 30, 2019 (Unaudited) 10.665 25,533
Exercisable as at June 30, 2019 9.437 14,257

65NEXTEER AUTOMOTIVE GROUP LIMITED INTERIM REPORT 2019
Notes to the Condensed Consolidated Interim Financial InformationFor the six months ended June 30, 2019
19 SHARE-BASED PAYMENTS (Continued)
Share options outstanding and not yet exercisable at the end of the period have the following vesting dates and exercise prices:
Average exercise price
(per share)
Outstanding options
(thousands)HK$
May 28, 2020 11.620 3,212May 29, 2020 12.456 4,032May 29, 2021 12.456 4,032
The fair value of the share options charged to the interim condensed consolidated income statement was US$1,020,000 during the six months ended June 30, 2019 (six months ended June 30, 2018: US$1,259,000).
20 FINANCE COSTS, NET
For the six months ended June 30,
2019 2018US$’000 US$’000
(Unaudited) (Unaudited)
Finance income
Interest on bank deposits 5,452 3,655
Finance costs
Interest on bank borrowings 4,337 5,928Interest on notes 7,344 7,344
11,681 13,272
Interest on leases 1,833 172Other finance costs 1,333 3,737
14,847 17,181Less: amount capitalised in qualifying assets (7,058) (7,108)
7,789 10,073
Finance costs, net 2,337 6,418

66 NEXTEER AUTOMOTIVE GROUP LIMITED INTERIM REPORT 2019
Notes to the Condensed Consolidated Interim Financial InformationFor the six months ended June 30, 2019
21 INCOME TAX EXPENSE
For the six months ended June 30,
2019 2018US$’000 US$’000
(Unaudited) (Unaudited)
Current income tax 32,201 19,010Deferred income tax (9,451) 10,074
22,750 29,084
For interim income tax reporting, the Group estimates its annual effective tax rate and applies it to its ordinary income (loss) for the six months ended June 30, 2019 and 2018. The tax effects of certain unusual or infrequently occurring items, including changes in judgement about the realisability of deferred tax assets and effects of changes in tax laws or rates are recognised in the interim period in which they occur.
The effective income tax rates of 14.7% and 12.6% for the six months ended June 30, 2019 and 2018, respectively, vary from the statutory rates primarily due to tax credits, tax holidays, withholding taxes and foreign rate incentives in certain jurisdictions. The increase in the effective tax rate of 2.1 percentage points for the six months ended June 30, 2019 from 12.6% for the six months ended June 30, 2018 is primarily the result of the change in the mix of income earned in each taxing jurisdiction, increases to withholding tax expense and the impact of US tax reform.
22 EARNINGS PER SHAREa. Basic
Basic earnings per share is calculated by dividing the profit attributable to equity holders of the Company by the weighted average number of ordinary shares in issue during the period.
For the six months ended June 30,
2019 2018(Unaudited) (Unaudited)
Profit attributable to the equity holders of the Company (US$’000) 131,124 199,605
Weighted average number of ordinary shares in issue (thousands) 2,506,372 2,505,133
Basic earnings per share (in US$) 0.05 0.08

67NEXTEER AUTOMOTIVE GROUP LIMITED INTERIM REPORT 2019
Notes to the Condensed Consolidated Interim Financial InformationFor the six months ended June 30, 2019
22 EARNINGS PER SHARE (Continued)
b. DilutedDiluted earnings per share is calculated by adjusting the weighted average number of ordinary shares outstanding to assume conversion of all dilutive potential ordinary shares. The Company’s dilutive potential ordinary shares comprise shares issued under the Scheme that are vested as at June 30, 2019. The number of shares that would have been issued assuming the exercise of the share options less the number of shares that could have been issued at fair value (determined as the average market price per share for the six months ended June 30, 2019) for the same total proceeds is the number of shares issued for no consideration. The resulting number of shares issued for no consideration is included in the weighted average number of ordinary shares within the denominator for calculating diluted earnings per share. For the six months ended June 30, 2019 and 2018, the details are within the table below.
For the six months ended June 30,
2019 2018(Unaudited) (Unaudited)
Profit attributable to equity holders of the Company, used to determine diluted earnings per share (US$’000) 131,124 199,605
Weighted average number of ordinary shares in issue (thousands) 2,506,372 2,505,133
Adjustment for share options (thousands) 3,059 5,044
Weighted average number of ordinary shares in issue for calculating diluted earnings per share (thousands) 2,509,431 2,510,177
Diluted earnings per share (in US$) 0.05 0.08
23 DIVIDENDA dividend of approximately US$77,734,000 relating to the Group’s year ended December 31, 2018 earnings was paid during the six months ended June 30, 2019 (six months ended June 30, 2018: US$69,954,000). The Board does not recommend the payment of any interim dividend for the six months ended June 30, 2019 (six months ended June 30, 2018: US$nil).
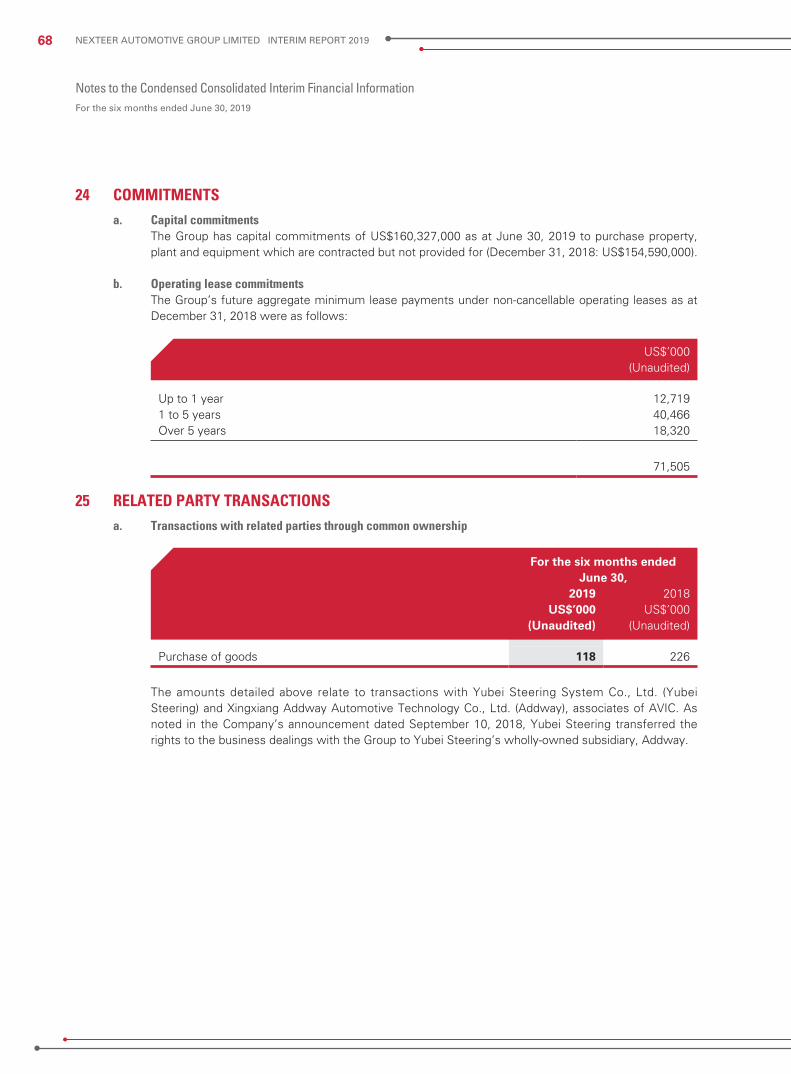
68 NEXTEER AUTOMOTIVE GROUP LIMITED INTERIM REPORT 2019
Notes to the Condensed Consolidated Interim Financial InformationFor the six months ended June 30, 2019
24 COMMITMENTSa. Capital commitments
The Group has capital commitments of US$160,327,000 as at June 30, 2019 to purchase property, plant and equipment which are contracted but not provided for (December 31, 2018: US$154,590,000).
b. Operating lease commitmentsThe Group’s future aggregate minimum lease payments under non-cancellable operating leases as at December 31, 2018 were as follows:
US$’000(Unaudited)
Up to 1 year 12,7191 to 5 years 40,466Over 5 years 18,320
71,505
25 RELATED PARTY TRANSACTIONSa. Transactions with related parties through common ownership
For the six months ended June 30,
2019 2018US$’000 US$’000
(Unaudited) (Unaudited)
Purchase of goods 118 226
The amounts detailed above relate to transactions with Yubei Steering System Co., Ltd. (Yubei Steering) and Xingxiang Addway Automotive Technology Co., Ltd. (Addway), associates of AVIC. As noted in the Company’s announcement dated September 10, 2018, Yubei Steering transferred the rights to the business dealings with the Group to Yubei Steering’s wholly-owned subsidiary, Addway.

69NEXTEER AUTOMOTIVE GROUP LIMITED INTERIM REPORT 2019
Notes to the Condensed Consolidated Interim Financial InformationFor the six months ended June 30, 2019
25 RELATED PARTY TRANSACTIONS (Continued)
b. Transactions with joint venturesNexteer (China) Holding Co., Ltd. (Nexteer China Holding) (a direct, wholly-owned subsidiary of the Company) holds a 50% ownership interest in a joint venture, Chongqing Nexteer Steering Systems Co., Ltd. (Chongqing Nexteer) in Chongqing, China. The joint venture was formed to manufacture and sell steering parts, and the remaining 50% interest is held by Chongqing Jianshe Industry (Group) Co., Ltd.
In March 2017, Nexteer China Holding signed a joint venture agreement with Dongfeng Motor Parts and Components (Group) Co., Ltd. to form Dongfeng Nexteer Steering Systems (Wuhan) Co., Ltd. (Dongfeng Nexteer). Located in Wuhan, China, the joint venture, equally owned by both parties, will design and manufacture EPS systems for Dongfeng Motor Group Co., Ltd. and its affiliated companies.
In January 2017, Nexteer Automotive Corporation (an indirect, wholly-owned subsidiary of the Company) agreed to form a joint venture with Continental Automotive Systems, Inc. Located in Grand Blanc, USA, the joint venture, CNXMotion, LLC (CNXMotion), is focused on integrating lateral and longitudinal control for mixed mode and automated driving applications.
As at June 30, 2019 the Group’s carrying amount of its investment in joint ventures is US$17,075,000 including US$11,615,000, US$5,460,000 and US$nil related to Chongqing Nexteer, Dongfeng Nexteer and CNXMotion, respectively, (December 31, 2018: US$11,255,000, US$5,689,000, US$nil). For the six months ended June 30, 2019, the Group’s share of (loss) income from the joint ventures amount to (US$2,246,000), including US$361,000, (US$965,000) and (US$1,642,000) related to Chongqing Nexteer, Dongfeng Nexteer and CNXMotion, respectively, (six months ended June 30, 2018: US$332,000, (US$1,001,000), (US$1,305,000)).
The following table sets forth the transactions between the Group and its joint ventures.
For the six months ended June 30,
2019 2018US$’000 US$’000
(Unaudited) (Unaudited)
Sale of product, equipment and services(i) 22,608 14,982
Purchase of services(i) 6,708 8,118
i. Services include engineering services, rent and other fees.

70 NEXTEER AUTOMOTIVE GROUP LIMITED INTERIM REPORT 2019
Notes to the Condensed Consolidated Interim Financial InformationFor the six months ended June 30, 2019
25 RELATED PARTY TRANSACTIONS (Continued)
c. Key management compensationThe remunerations of the Chief Executive Officer, directors and other key management members were as follows:
For the six months ended June 30,
2019 2018US$’000 US$’000
(Unaudited) (Unaudited)
Basic salaries, other allowances and benefits 3,521 2,809Bonuses 4,681 3,903Others 552 570
8,754 7,282
These remunerations are determined based on the performance of individuals and market trends.
Top Related