


Languages
Pages
Legal


UNIVERSITY OF NAIROBI
\ \
OCCUPATIONAL SEGREGATION IN THE EMPLOYMENT SECTOR: A CASE STUDY OF NAIROBI.
KENYA f r
BY
Susan Wambui Kahinga
Submitted in partial fulfillment of the requirement for the degree of Master of Arts in Gender and Development studies of the University of Nairobi.
November, 2006
University of NAIROBI Library
1

DECLARATION
I Susan Wambui Kahinga, Registration number N/50/P/7171/2002 do hereby declare that this project is my original work and has not been presented for a degree in any other university.
CANDIDATE
' DATE:
Susan Wambui Kahinga N/50/P/7171/2002
This project has been submitted for examination with my approval as the University supervisor.
SIGNATURE
DATE:
Dr. W.K Subbo Institute of African Studies University of Nairobi.
2

DEDICATION
M y study is dedicated to my dear Parents.
To my Mother who is an inspiration to the work I now present and the purpose of my
study. For her struggles and her achievements in life and for being the fire and light in my
life.
To my father for teaching me the values in my life and for my passion in education
without whose guidance and inspiration I could not have completed this work.
3
TABLE OF CONTENTS
Chapter 1:1.0 Introduction......................................................................................... 9
1.1 Background.............................................................................. 91.2 Problem Statement................................................................. 121.3 Objectives.............................................................................. 121.4 Justification............................................................................ 13
Chapter 2:2.0 Literature Review and TheoreticalFramework................................................................................................ 16
2.1 Literature Review................................................................... 162.2 Theoretical Framework...........................................................222.2.1 Neo classical, human capital model.....................................222.2.2 Feminist Gender Theories....................................................25
Chapter 3:3.0 Methodology.........................................................................................27
3.1 Data Collection methods........................................................273.2 Sampling procedure................................................................283.3 Ethical considerations............................................................. 293.4 Scope and limitations of the study..........................................29
Chapter 4:
4.0 Occupational Structure in the employmentsector.........................................................................................................31
4.1 Actual data collected.............................................................314.2 Occupational differentials in gender representation............ 354.3 Gender representation in hierarchy of administration......... 374.4 Gender and work values........................................................424.5 Factors considered by employers in hiring and award of
benefits..................................................................................45Chapter 5: Conclusion and recommendation...................................... 49
Bibliography............................................................................................ 54
Appendix A: Questionnaire................................................................... 56
4

LIST OF FIGURES AND TABLES
TABLES:
Table 1: Disparity in male and female representation in various occupations in Britain- 1951
Table 2: Disparity in male and female representation in various occupations in Tanzania- 1988
Table 3: Sex structure by school
Table 4: Sex structure by hospital in nursing
Table 5: Sex structure of doctors by hospital
Table 6: Sex structure by engineering company
Table 7: Sex structure by ICT company
Table 8: Hierarchy of administration in hospital A
Table 9: Hierarchy of administration in hospital B
Table 10: Hierarchy of administration in Engineering Company A
Table 11: Hierarchy of administration in Engineering Company C
Table 12: Hierarchy of administration in ICT Company A
Table 13: Hierarchy of administration in ICT Company B
Table 14: Hierarchy of administration in ICT Company C
5
FIGURES:
Figure 1: Male representation in all occupations
Figure 2: Female representation in all occupations
Figure 3: Comparison of factors considered in the promotion of staff
Figure 4: Comparison of factors considered in the selection of training of staff
Figure 5: Comparison of factors considered in the award of salary increments and benefits
LIST OF ACRONYMS:
ICT- Information and Communication Technology
US- United States of America
UK- United Kingdom
ILO- International Labour Organization
ITEC- Information Technology

AKNOWLEDGEMENTS
I would like to express my gratitude to the following people:
First and foremost to my lecturers for their encouraging words throughout my course and
more especially to my supervisor Dr. Subbo for his guidance in the preparation of this
work.
Secondly to my entire family for their support and encouragement and more especially to
my two sisters Lorraine and Linda for their provision of working space whenever I
needed it.
Lastly to Dr and Mrs. Wangati of Cedar Grove Academy for offering me a second chance
to education by providing the means to my finances through which I have managed to
pay for this course and being patient and understanding about the time I required in
concentrating on my course.
7

ABSTRACT
Gender equality has been a contentious issue in Africa and more so in Kenya for a long
time. Women have been disadvantaged in taking up positions equal to those of men in
society due to a variety of factors including lower educational level, family
responsibilities and gender specific roles and discrimination.
Our society has constantly discriminated women in taking up specific roles traditionally
set aside for males making these particular professions gender stereotyped. Other
occupations are seen as encompassing the nature of females and thus become female
oriented. The girl child has for a long time had to leave her schooling to attend to marital
duties as expected by society and family. Parents have married off their young daughters
as a source of wealth thus finding investment into their education a waste of money.
However, with recent attention on the girl child’s development in education and an
increase in the fight for gender equality, there could have arisen a change in the
occupational structure ignoring the traditionally stereotyped occupations for either
gender.
This work examines the possible changes in the occupational structure with regard to
traditionally stereotyped occupations. The first chapter is a general introduction giving
background information, aims and objectives of the study. The second chapter basically
examines the different theoretical approaches towards gender specific occupations and a
review of results from previous studies carried out in occupational segregation in
different regions. The third chapter describes the methodology of the study while the
fourth and fifth discuss the results of the study and makes recommendations
8
CHAPTER 1
1.0 INTRODUCTION:
1.1 Background
What is occupational segregation?
Occupational segregation is said to exist when gender/race groups are differently
distributed across occupations than is consistent with their overall shares of employment,
irrespective of the nature of job allocation (Martin J. Watts, 2001).
Theories that attempt to account for the establishment and maintenance of segregation
include those based on individual differences, including human capital theory; those that
are based on ideas of discrimination by employers, including labor market discrimination
theories; and those that take as their central premise, the notion of systematic barriers
within organizations, including inter group and dual labor theories. No one theory
accounts single-handedly for the establishment and continuance of gender segregation,
together they help to make sense of these employment phenomena. There has been
relatively little empirical research to test these theories at organizational level.
There are therefore a number of influences, which affect occupational segregation and
research shows that they are mutually reinforcing. Decisions made by individuals
contribute to the perpetuation of occupational segregation, but perceived occupational
segregation in turn influences individuals’ choices.
9

Occupational segregation remains one of the strongest influences on young people’s
choice of career, with individuals preferring those occupations in which they see their
gender represented. However, according to Miller (2004), this is not a static process,
there is evidence that girls (and to a lesser extent, boys) become willing to consider a
wider choice of occupations as they become older. Unsurprisingly, ability, attitudes and
interest all influence career choice but attitudes and interest have a stronger influence on
job choice than ability.
Parental attitudes continue to have a significant impact on career decisions of young
people. This is particularly the case amongst some minority ethnic communities. Parents
influence decisions both directly, through their views on appropriate jobs, and indirectly
through their influence on the development of young people’s attitudes to school
subjects. The teaching style adopted in schools is a further factor, which influences the
perception of school subjects, particularly the sciences. The advice and guidance offered
to young people also affects this process, but research suggests that career advisors may
not challenge career stereotypes and see this role outside their area of responsibility.
Women continue to lag behind their male counterparts in the development process
despite the obvious social changes. More so in the employment sector a big gap is still
felt in the involvement of women in decision-making positions in many organisations that
have a direct impact on the economy of the country.
Women are unable to have an easy access to better paying jobs and to jobs they are
qualified for. Women are discriminated against in their work places and therefore not
accorded equal training and promotion opportunities as their male counterparts. Several
women have to contend with sexual harassment from their superiors in order to keep their
jobs or to get a promotion despite even higher qualifications than their male counterparts.
In spite of all the household responsibilities the woman has to deal with, the economic
situation has dictated that women have to earn a living to supplement the household
income. Furthermore, more households in recent times are becoming female headed-
10
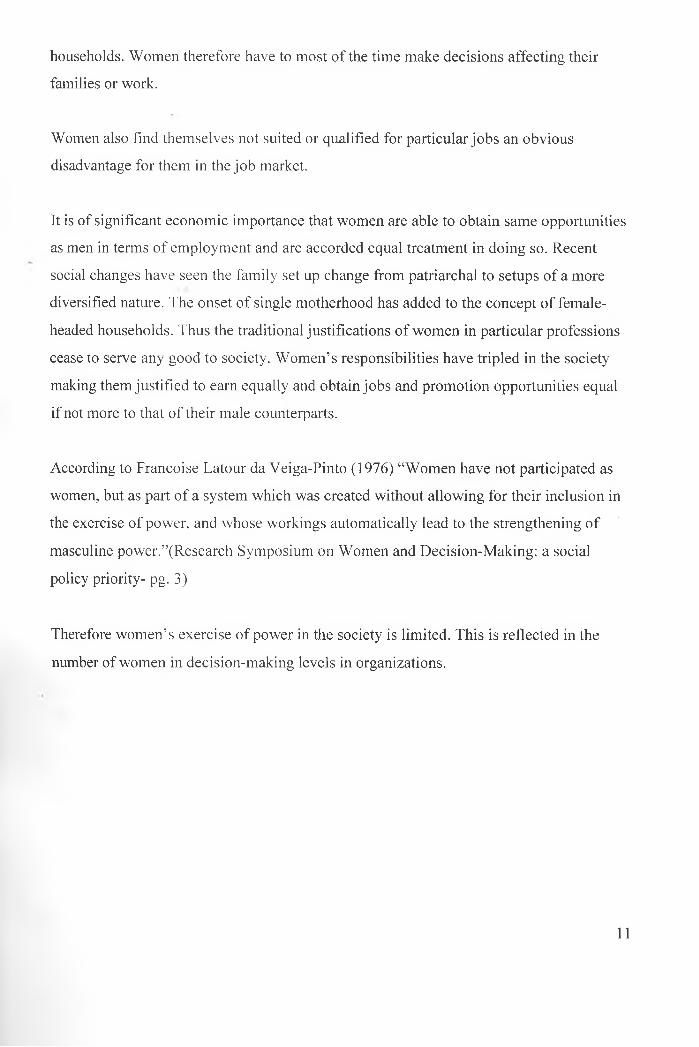
households. Women therefore have to most of the time make decisions affecting their
families or work.
Women also find themselves not suited or qualified for particular jobs an obvious
disadvantage for them in the job market.
It is of significant economic importance that women are able to obtain same opportunities
as men in terms of employment and are accorded equal treatment in doing so. Recent
social changes have seen the family set up change from patriarchal to setups of a more
diversified nature. The onset of single motherhood has added to the concept of female
headed households. Thus the traditional justifications of women in particular professions
cease to serve any good to society. Women’s responsibilities have tripled in the society
making them justified to earn equally and obtain jobs and promotion opportunities equal
if not more to that of their male counterparts.
According to Francoise Latour da Veiga-Pinto (1976) “Women have not participated as
women, but as part of a system which was created without allowing for their inclusion in
the exercise of power, and whose workings automatically lead to the strengthening of
masculine power.’’(Research Symposium on Women and Decision-Making: a social
policy priority- pg. 3)
Therefore women’s exercise of power in the society is limited. This is reflected in the
number of women in decision-making levels in organizations.
11
1.2 PROBLEM STATEMENT:
This study was based on the hypothesis that despite increased empowerment of women
especially in educational attainment and the gradual washing away of a prohibitive
culture dictating attitudes towards different occupations there still existed a large gap in
gender in terms of occupational structure. Thus there were still a large number of women
to be found in the lower occupational structures in organizations and fewer in the middle
and top levels. The fact that the number of educated women had risen and the fact that
domestic responsibilities were now reduced due to the inclusion of the household aids
had increased women’s time to take part in more demanding occupations. However most
women were not confident enough to take on the challenges faced in these types of jobs.
The attitude from employers had also not changed despite various testimonial situations
from women professionals who had started organizations and led them to success. My
study set out to observe if there was any actual change in the attitudes accorded
to different types of jobs by observing the occupational structure in different stereotyped
industries in the country.
1.3 OBJECTIVES :
The study investigated how women were represented in proportion to their population
despite equal qualification status as their male counterparts and offer recommendations to
bridge the gaps. The main objectives for the study were:
Broad objective:To study the horizontal and vertical occupational segregation by gender in the formal
sector of employment.
Specific objectives:
1. To determine the involvement of women in male dominated fields and men in
female dominated fields
2. To link educational attainment to the lack or gain of employment opportunities.
12

1.4 JUSTIFICATION
The project was proposed out of the increased nature of the feminization of poverty.
More households were observed to be increasingly female-headed households. Increased
population in the country had seen a higher ratio of females to males. The HIV/ Aids
pandemic had also realized more females left without any breadwinners except for
themselves. Difficulties faced by women in accessing jobs in a broad range of categories
had limited their chances of better pay and thus better livelihood for them and their
families greatly increasing women's never ending cycle of poverty and plunging them
further below the line of poverty. Increased female labour participation would see more
women increase their standards of living and those of their families. This could only be
achieved if women were able to participate in all job categories.
The woman’s state today as regards employment has changed.
Today women are protected by the legislature. Thus women have:-
a) The right to vote in the majority of the countries.
b) As concerns equality of remuneration between men and women, the ILO adopted a
convention on the subject (No. 100) in 1951.
c) Education is also available to both men and women, in principal in all countries.
The developments in the definitions adopted by ILO with reference to Labour Force
Activity have furnished an equal playing ground for progression for both men and
women in terms of opportunities for employment. I will sample some of these definitions
below:
Definition: Labour Force Activity:-
1. 1954 -Persons who perform some work for pay or profit.(ILO, 1976)
2. 1960-All persons of either sex who furnish the supply of labour for the production of
economic goods and services. (ILO, 1976)
13

3. 1982-All persons of either sex who furnish the supply of labour for the production of
economic goods and services and defined by the United Nations Systems of National
accounts and balances (ILO, 1982)
According to these systems (of national income accounts), the production of economic
goods and services should include all production and processing of primary products,
whether for the market, for baiter or for own consumption. (Women’s participation in the
labour force: A methods test in India for improving its measurement (Richard Anker et
al, 1988 pg. 8)
Yet women were not adequately represented in decision-making. Even in trade union
movement, women have great difficulty in securing proper representation, even in the
branches of production where they are most numerous. Women who are at an equal
playing level with men in educational qualifications find it hard to obtain these positions
than their male counterparts.
According to all these recent developments in the protection of women’s rights in the
production process, there should have been a more significant change experienced by
women in terms of employment exposure. However, according to recent statistics, this
was not so. Women still experienced a gap in the kind of jobs they were able to access-
income differentials, promotions and training opportunities.
According to the Analytical report on Gender dimensions volume XI (2002), proportions
of the economically inactive males were considerably lower than females. In Nairobi,
25% of the unemployed populations were women while only 14.5 % were men. One of
the reasons attributed to the low participation of women in economic activity was their
low participation in decision-making levels.
According to the Analytical Report on labour force Volume IX, although females
contributed 57.1 % of the unemployed, their share in active job search at the national
level was only 34.7 %, which was about half the share of active male job searchers.14

Could the reason behind this be the culturally attached attitudes towards working by
women or was it more so the non-availability of labour markets for females thus the
resignation to housewife duties? During the 1999 census, this disparity was attributed to
lower educational levels for females as compared to men. The 1999 census gender
analysis however showed that the unemployment rates for females in the early ages of
15-29 years were higher than those for males as compared to 1989 showing an increased
female participation in the labour markets. The unemployment rate of even educated
females’ showed a higher disparity. Only 7.7% of the population aged 15-64 years of
male university graduates lacked employment while 18.9 % of female university
graduates lacked jobs-almost triple that of men.
Studies in Kenya had not ventured into the organizational structure and my study would
be able to shed some light into vertical gender representation in organizations.
15

CHAPTER 2
2.0 LITERATURE REVIEW AND THEORETICAL FRAMEWORK
2.1 LITERATURE REVIEW:
According to the Human Development Report of 1995, women take on a larger share of
the work-paid and unpaid. On average 53% in developing countries, 51 % in industrial.
I will now undertake to explain the various changes in occupational segregation at the
various regions i.e. international, regional and national regions.
The first world countries seem to have made progress in the inclusion of women in once
male dominated occupations. According to Martin J. Watts(2001), the US military has
been successful in pursuing policies of integration and affirmative action. The process of
integration began when President Truman signed executive order 9981 in 1948 ordering
the equality of treatment and opportunity for all persons in the armed services during his
re-election campaign. The passing of the Women’s Integration Act in the same year
enabled women to be mobilized, but they were restricted to 2% of enlisted soldiers and
10 % of female enlisted soldiers. In 1967, this restriction was lifted, but female
representation in the military did not rise significantly until the 1970’s. Women’s entry
into the military was made easier in 1973 by a change in gender exclusion policies,
following concerns about manpower shortages in a voluntary military. Many non-combat
jobs became available for women, who are now also allowed to work on combat aircraft
and ships but are excluded from front-line infantry, armor and artillery units, and other
units and occupations, such as submarines and Special Forces.
The National Skills strategy noted that women as a group within the UK still lag behind
men in terms of their skills and qualifications. Despite this, there is still no explicit
strategy that address these identified skill needs of women.(Miller et al,2004)
16

According to ‘Women.. .a world Survey 1985’, the hourly wages of working women in
manufacturing industries are on average three-fourths those earned by men. In 1950 there
were 27 million more boys than girls enrolled in primary and secondary levels of
education; in 1985 there were 80 million more boys than girls enrolled. Women are 50
per cent of the teachers in primary schools, 31 per cent in secondary schools and 26 per
cent in higher education.
In developing countries, two-thirds of the women over the age of 25 ( and about half the
men) have never been to school.
Educated women rank higher in verbal skills than educated men but in the global
community not including China, there are 130 million more adult women than men who
cannot read and write.
Women account for half the students studying for advanced degrees in the humanities,
education and fine arts; for one -quarter in the more powerful fields of law, engineering
and medicine. Although they comprise fifty per cent of the enfranchised population,
women hold no more than 10 per cent of the seats in national legislature. In one
government in three, there are no women in the executive council which represents the
highest decision making body of the country. In those cabinets where women are
included, there is usually one woman.
A relatively large portion of the women’s paid labor force is unemployed or under
employed.
There is more hidden employment among women. Large numbers are in the informal
sector or involuntarily working part time. In the third world, an especially large
proportion of women is known to be self-employed, often as vendors or on piecework at
home.
In industrialized countries, women also represent the vast majority of part time workers.
The nature of the work in service industries permits it and often, family responsibilities
require it. The majority of employed women were found to be married. Even when
employed, surveys showed that they continued to carry the main burden of household
work.17
Wage gap: There is a persistent substantial wage gap between men and women. ILO
attributes the gap mainly to concentration of women in lower paying occupations rather
than to overt differences in pay scales for the same or similar jobs. Aside from the blatant
forms of direct discriminations which government legislation has helped diminish but not
wipe out, indirect discrimination which results in lower pay levels persists in many
forms, implicit in recruitment procedures and training and promotion policies which
_ favor men.
In “Women... .a world survey” the occupational segregation in the job market is in those
jobs considered to be of lower responsibility and skill, therefore paid less. Relatively few
reach management and supervisory levels. According to the survey, most women are
involved in agriculture, industry and services. Within all the three major fields women
are clustered in unskilled, dead-end jobs with low pay and little potential for training or
advancement.
In agriculture, if cash crops are grown, women tend to do the back-breaking planting,
weeding and harvesting; men to operate whatever mechanical equipment is available.
In the services, women are largely in menial jobs, primarily as domestics or in the
informal sector, selling food and homegrown crops.
In industry they provide cheap assembly-line labor for the rapidly growing multinational
operations in textiles, apparel and electronic products.
Women’s occupational concentration is seen to be associated with unfavorable work
patterns: lower wages, lower status, and longer hours, fewer or no fringe benefits and less
1 security.
A study done in Britain in 1951 showed a great disparity between male and female
workers in the employment sector. The table below shows the findings of the study:
18

Table 1: Disparity in male and female representation in various occupational
categories in Britain-1951
Type of Job Male representation % Female representation %
Road transport workers 14.2 Nil
Salesman, shop assistants 14.5 14.3
Fitters, machine erectors 14.3 Nil
Engineering foremen 14.4 Nil
Clerks, typists 15.4 15.3
Managers in industrial
undertakings
15.6 Nil
Professional Engineers,
architects
17.3 Nil
Teachers 19.1 19.6
(Source: Occupation and Pay in Great Britain, 1951; page 8)
The status of managers who were women also showed a low distribution in various
sectors:
In the Public Service only 15.4 % of the managers were women. There were 32.0 % of
women employed as secretaries and registrars of companies, institutes and charities. In
the textiles industry and textile goods; leather and leather goods, female representation
stood at 11.2 %. Women in transportation took 42.4 % of the employees while those in
retail and wholesale businesses were 20.7 %. Female bank managers and inspectors were
very few represented at 0.7 %. However, there was a higher representation of females in
service industries and more so in restaurants at 67.5 % and in hotels and public houses at
46.0%.
Occupational segregation in the developed countries centers especially in the service
sector, which has absorbed the bulk of women’s influx into the labor force. A study
carried out by Sivard R.L. showed how narrowly focused the job concentration is. In
Austria for example (1981) 63 percent of women worked in six out of 75 occupations. In
Sweden, out of 270 occupational categories in the census, more than 40 percent of
women were in just five jobs: secretary, nurse’s aide, sales worker, cleaner and19

children’s nurse. The study also established that those jobs, which were common for
women generally, included very few men. In the Swedish list for example, there were
nine women for one man.
Sivard also found that there was relatively little change in the degree of occupational
segregation though there had been some gender cross-over i.e. women entering fields
previously confined largely to men and vice versa, their representation was in low
numbers. Comparatively women filled very few management positions and in top
management they were extremely rare.
Miller et al’s study on occupational segregation across Europe concentrated on
occupations that were the most strongly segregated i.e. construction, engineering,
plumbing and Information and Communication Technology (ICT) (all male dominated),
and childcare (female dominated)
Vertical segregation according to Theme H. serves as an invisible barrier to women’s
progression to more senior levels. Statistics from several countries showed that less than
10 percent of directors in British companies are women, and that women only make up
30 percent of management positions (excluding directors). Horizontal segregation in this
study was used to also find out how many women were channeled to specific occupations
and vice versa. In the UK for example women were found to comprise 69 percent or
more of administrative and secretarial occupations, personal service and sales and
customer service occupations, while men make up more of managers and senior officials,
skilled trades, and process, plant and machine operatives. Women were also found to be
under-represented in ITEC (electronic and communications) occupations.
According to Aili Mari Tripp’s study of the occupational distribution in Tanzania, 1988 (
in” Unequal burden”) from a sample of 287 people the findings brought out worrying
figures in the disparity in men’s and women’s activities.

Table 2: Disparity in male & female representation in various occupational
categories in Tanzania-1988
Gender representation
Type of Work Women Men Total (percent)
Informal work 66 68 67
Employed 9 36 23
Retired 0 8 4
Farming 72 44 59
No occupation 13 0 7
Bina Agarwal's study of India in “Unequal Burden” showed the female labour force
participation in all India to be at 24.4 %
21

2.2 THEORETICAL FRAMEWORK
Occupational segregation is important because it is a major source of labour market
rigidity and economic inefficiency. Excluding a majority of workers from a majority of
occupations, is wasteful of human resources, increases labour market inflexibility
reducing an economy’s ability to adjust to change. With the globalization of production
and intensified international competition, these factors have assumed greater importance.
Occupational segregation by sex is detrimental to women. It has an important negative
effect on how men view women and on how women view themselves. This in turn
negatively affects women’s status and income and consequently many social variables
such as mortality and morbidity, poverty and income inequality. The persistence of
gender stereotypes also has negative effects on education and training and thus causes
gender-based inequalities to be perpetuated into future generations.
Theories formulated focus on factors related to labour supply which generally focus on
why women “prefer” certain types of occupation (e.g. they may “prefer” those with
flexible hours in order to allow time for child care) and factors related to labour demand
which focus on why employers generally “prefer” to hire women or men for particular
occupations and why women and men have different opportunities for promotion and
career development within firms.
I will concentrate on the two theories outlined below:
1. The neo-classical, human capital model
2. Feminist/ gender theories
2.2.1 The neo-classical, human capital model
It assumes that workers and employers are rational and that labour markets function
efficiently. Therefore workers seek out the best paying jobs after taking into
consideration their own personal endowments (e.g. education and experience), constraints
(e.g. young child to take care of), and preferences (e.g. a pleasant work environment).
22

Employers on the other hand try to maximize their profits by maximizing productivity
and minimizing costs to the extent possible, but because of competition and efficient
labour markets, they pay workers their marginal product.
On the labour supply side, these theorists stress the lower levels of female human capital
in terms of both what women bring to the labour market (less education, less relevant
fields of study e.t.c.), as well as what they acquire after joining the labour market (less
experience than men owing to intermittent or truncated labour market participation due to
marriage and/ or household/ child-care responsibilities). Thus according to these theories,
women rightfully receive lower pay than men because of their lower productivity.
The productivity-related variables of education and labour market experience are
believed also to affect women’s choice of occupation. Women would rationally choose
occupations with relatively high starting pay, relatively low returns to experience, and
relatively low penalties for temporary withdrawal from the labour force- including
occupations which are flexible in terms of entry and working hours.
Arguments against these theories:
1. Women’s labour force commitment has increased greatly in recent decades.
2. The amount of household and family-based work, which needs to be done, has fallen
in recent years owing to increasing age at marriage and falling fertility as well as the
use of household aids (washers, cookers, and vacuum cleaners e.t.c).
3. The increasing incidence of female-headed households all over the world (Anker
quoting Buvini, 1995) implies that ever more women need to work continuously
simply to earn a living. These various changes imply that women are gaining greater
labour market experience, which means that according to these theories, should lead
to major changes in the types of occupation women prefer and are offered. Despite all
these changes, occupational segregation by sex remains very high all over the world.
4. Amongst the most important occupations, many male dominated ones (e.g. transport
driver and auto mechanic) do not require more experience or continuity of
employment than many female dominated ones (e.g. secretary and other clerical
worker.) If anything the opposite is true. Being a secretary requires considerably23

more knowledge and skills and makes more mental demands than being a delivery
truck driver, yet secretaries receive lower pay.
On the labour demand side according to these theories, many of the factors influencing
women’s and men’s preferences for particular occupations also influence employer’s
preferences for female or male workers. Thus jobs requiring a high level of education are
more likely to be offered to men than to women as are jobs where experience and on -
the-job training are relatively important. Both these arguments are questionable where
both sexes have now achieved similar levels of education and labour force participation.
Women are considered to be higher cost workers (even when the same wage rate applies)
because of the supposedly higher, indirect labour costs associated with women workers.
This should affect the type of job employers offer women, depending on the relative
importance of each of these factors for each occupation^ For example women said to
have a higher rate of absenteeism.) Women are said to be late to work more frequently
and to have higher labour turnover rates, which can be an important indirect cost. Women
workers may also require separate toilet facilities at the workplace for themselves and
creches for their children. Women are sometimes said to be less flexible than men as
regards being able to stay late or to work on official leave days. Again according to
recent studies conducted by Anchor and Hein, 1985 and 1986, the differences in
absenteeism in male and female workers proved to be minimal. This was attributed to the
greater likelihood of men leaving for another job and of women leaving their jobs for
family reasons.
Labour laws and regulations sometimes directly affect the demand for women workers.
Protective legislation sometimes prohibits women from working in certain occupations or
under certain conditions.( e.g. night work- provisions of the ILO’s Night Work (Women)
Convention, 1919( No. 4); from working underground in mines (Underground Work
(Women) Convention, 1935 (No. 45); or from carrying heavy loads( the Maximum
Weight Convention, 1967 (No. 127). Although these laws aim to protect women, they are
no longer relevant because of the invention of machines, which can be easily operated by
either gender and introduction of safety devices and should therefore be changed.24

Labour laws can increase the comparative cost of employing female workers. For
example, paid maternity leave increases the cost of women workers relative to men and
so can become an indirect form of sex discrimination if employers have to bear this cost.
2.2.2 FEMtMST/CENDEK THEORIES
They are mainly concerned with non-labour market variables which economists take as
given. A basic premise of gender theories is that women’s disadvantaged position in the
labour market is caused by, and is a reflection of, patriarchy and women's subordinate
position in the society and family. In all societies, household work and childcare are seen
as women’s chief responsibility. The fact that these societal norms and perceptions bear
little relation to the daily lives of many women, men and families do not detract from
their influence on people’s behavior and their contribution to gender-based discrimination
against women.
This division of responsibilities and the patriarchal ordering of society are instrumental in
determining why women usually accumulate less human capital compared with men
before entering the labour market- that is why girls receive less education than boys, and
are less likely to pursue fields of study, such as sciences and crafts, of greater relevance
to the labour market. Overall, women are perceived as having lesser need for labour
market skills. These same influences are also instrumental in explaining why women
acquire less labour market experience, on average because many of them withdraw from
the labour force early, and many others withdraw from the labour force temporarily.
Gender theorists list out 13 characteristics commonly attributed to women, which may
have an effect on occupational segregation, by sex. They are divided into three groups of
stereotypes (positive, negative and other).
The five “positive” stereotypes are: a caring nature; skill and experience in household-
related work; greater manual dexterity; greater honesty; attractive physical appearance.
These characteristics are said to help “qualify” women for the following occupations:
nurse, doctor, social worker, teacher, maid, housekeeper, cleaner, cook, waiter,25
launderer, hairdresser, spinner, weaver, knitter, tailor/dressmaker, midwife, sewer, typist,
cashier/book-keeper, salesperson, accountant, receptionist, street vendor and shop
assistant.
The five negative stereotypes are: disinclination to supervise others; lesser physical
strength; lesser ability in science and mathematics; lesser willingness to travel; and lesser
willingness to face physical danger and to use physical force. These characteristics
negatively affect women’s acceptability in various occupations, which consequently
helps ensure that they become typically “male” occupations. They would in effect
disqualify women from the following types of occupations: manager, supervisor,
government executive officer/ administrator, legislative official, construction worker,
miner/quarrier, well driller, physical scientist, architect, engineer, mathematician,
statistician, aircraft officer and worker, ship officer and worker, transport equipment
driver/operator, fire-fighter, police officer and security guard,
Three other stereotypes are identified namely: greater willingness to take orders, greater
docility and lesser inclination to complain about work or working conditions, lesser
inclination to join trade unions, greater tolerance of monotonous repetitive work; greater
willingness to accept lower wages and less need for income; and greater interest in
working at home. These stereotypes have a greater influence on he general characteristics
typifying “female” occupations (such as low pay, high flexibility, low status, less
decision making authority) than on disqualifying women for particular occupations.
Gender theorists also point out how cultural restrictions contribute to the establishment of
what is acceptable work for women and how in some countries they effectively bar
women from certain occupations. Among Muslims , purdah effectively forbids women
from interacting with unknown men in public. As a result, many Muslim women are
discouraged from taking sales jobs except in shops where all customers are women;
women are excluded from factory jobs except when the entire factory workforce is
female
26

CHAPTER 3
3.0 METHODOLOGY
Research being “an inquiry into the nature of the reasons for and the consequences of any
particular set of circumstances”, the research methods used inquired into the occupational
structures in various perceived stereotyped industries.
The methods used were both qualitative and quantitative. The two methods removed the
bias associated with each kind of method. It also helped to bring out the various
objectives of the study. This helped to obtain primary data on what proportions of the
sample studied were in the various occupations and measured attitudes attached to certain
occupations by both the employer and employee.
3.1 DATA COLLECTION
STRUCTURED QUESTIONAIRRE METHOD:
A structured questionnaire with closed and open-ended questions was used for the study..
The questionnaire obtained data for job titles, gender engaged in the job activity and job
related qualifications .A sample questionnaire is provided in the Annex section.
INTERVIEW METHOD:
It was not possible to obtain all answers as per my questiomiaire without a personal
interview with the supervisors of the employees in the organizations picked up. The time
limit in doing my study also propelled me to seek direct answers from the interviewees
and therefore the two methods were combined. I found this an advantage, as I was able to
probe further and avoid questions being left out.
27

3.2 SAMPLING PROCEDURE
A sample of the population for the study was picked from the various industries in
Nairobi City and not more than five kilometers for the central business district.
The study concentrated on various industries where more women were expected to have
higher representation in all occupational categories and the various industries where
women were expected to have lower representation in all occupational categories. A
neutral industry in which no gender specification was assumed yet was chosen.
SAMPLING FRAME:
As the study concentrated on particular stereotyped occupations i.e. teaching, nursing
(“female dominated”) , engineering (“male dominated”) and the ICT as the neutral
industry, I picked out the various companies offering these occupations. I then used the
directory, as my sampling frame .The companies forming the sample were located within
the central business district of Nairobi and not more than 5 km from it. Since the
objectives of the study were to establish gender representation in occupations selected,
questionnaires were administered to supervisors/human resource managers.
Schools in Nairobi: Three schools were chosen with a total sample of 109 teachers. The
questionnaires were administered to the heads of departments who supervised the
teachers.
ICTs
Three companies were chosen for the study with a total sample of 36 ICT professionals.
The companies had small populations and thus the director/C.E.O’s answered the
questionnaires.
Hospitals: I picked out two major hospitals in Nairobi ( Kenyatta National Hospital and
Nairobi Hospital) with a total sample of 2059 nurses and 249 doctors. Data was collected
from the human resource department head.
28

Engineering: I picked out at least 6 Engineering companies for the study with a total
sample of 350 engineers. Again data was collected from the heads of departments and
supervisors of the engineering companies.
3.3 ETHICAL CONSIDERATIONS:
This study also took into account ethical considerations while being conducted.
A prior call to the various companies was made to inform of intention and allow the
heads to be conversant with the objectives of the study. This brought an added advantage,
as collecting information with their prior approval was easy and avoided time wasting.
The questionnaire was precise and clear to avoid the feeling of embarrassing the
company and time wastage on their part.
Companies were not required to give their names to remove any feeling of victimization
in the final analysis and would only give information relevant to the study.
Companies were also made aware of their rights to any information felt as confidential or
that, which could be of potential harm to the company if exposed.
Companies through their directors made an informed decision about whether or not they
wished to participate in the study.
Details of the study were given in the introduction letter including identification of me
the researcher, number of companies involved, benefits of the study and purpose of the
study.
3.4 SCOPE AND LIMITATIONS OF THE STUDY:
The study was limited to the employment sector. It targeted various occupations in the
employment sector that were seen as gender stereotyped (teaching, nursing, and
engineering) and a relatively new field (the ICT industry)
The targeted population sample was chosen from Nairobi for the study as the city being
the capital of Kenya had fewer limitations for full and equal employment due to a multi
cultural environment that is vibrant with all types of industry. The area also holds the29

literate population of the country with the inclusion of both genders. Since my study
hoped to capture changes in the organizational structure in view of changes in literacy
(thus qualifications), the area was ideal.
The study had its limitations because I was not able to pick out other employment sectors
in play.
The problem of cooperation also arose, as some companies did not want to spend time in
answering the questionnaire and did not hand them back. Some also created a chain of
bureaucracy and failed to fill in the questionnaire.
There was however a lot of cooperation from the companies that did answer their
questionnaire as I was able to interact with the personnel departments to obtain the data
as well as hold an interview with the employers. A lot of bias was removed this way.
30

CHAPTER 4
4.0 OCCUPATIONAL STRUCTURE IN THE EMPLOYMENT SECTOR
4.1 Data Collected
Data from the various fields studied is presented in the form of tables and figures
showing the findings of the study.
Teaching industry:
Table 3 below shows the sex structure obtained in schools studied. There was a relatively
higher representation of females in each of the schools at 61%, 60% and 65% for schools
A, B and C respectively.
Table 3: Sex structure by school
School
Sex of the respondents
TotalMale Teachers Female Teachers
School A 24 (39%) 37(61%) 61 (100%)
SchoolB 2 (40%) 3 (60%) 5 (100%)
SchoolC 15 (35%) 28 (65%) 43 (100%)
Total 41 (38%) 68 (62%) 109(100%)
Hospital industry:
Table 4 shows the sex structure in the field of nursing in the hospitals studied. Hospital A
had a higher number of nurses than hospital B. It should however be noted that Hospital
A is a public hospital while Hospital B is a private hospital. The disparity in gender
representation was highly notable in both hospitals as 82 % and 92 % of the nurses in
Hospital A and B respectively were female nurses. Male nurses had a low representation
of 18% and 8% for Hospital A and B respectively.
31
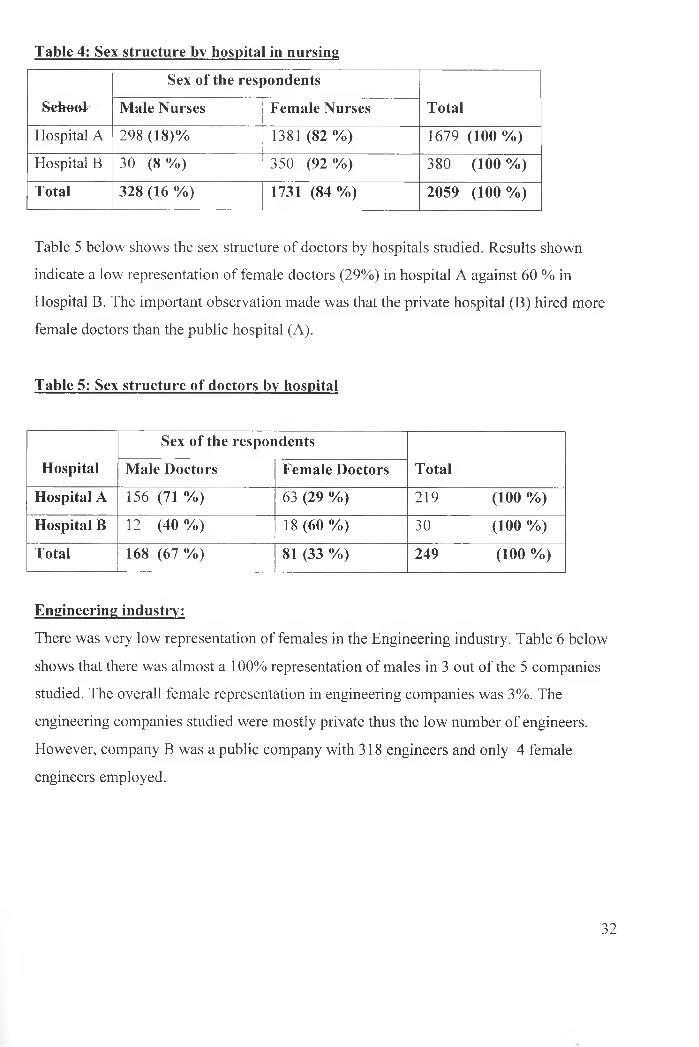
Table 4: Sex structure by hospital in nursing
Sefeool
Sex of the respondents
TotalMale Nurses Female Nurses
Hospital A 298 (18)% 1381 (82 %) 1679 (100 %)
Hospital B 30 (8%) 350 (92 %) 380 (100 %)
Total 328 (16 %) 1731 (84 %) 2059 (100 %)
Table 5 below shows the sex structure of doctors by hospitals studied. Results shown
indicate a low representation of female doctors (29%) in hospital A against 60 % in
Hospital B. The important observation made was that the private hospital (B) hired more
female doctors than the public hospital (A).
Table 5: Sex structure of doctors by hospital
Hospital
Sex of the respondents
TotalMale Doctors Female Doctors
Hospital A 156 (71 %) 63 (29 %) 219 (100%)
Hospital B 12 (40 %) 18 (60 %) 30 (100 %)
Total 168 (67 %) 81 (33 %) 249 (100 %)
Engineering industry:
There was very low representation of females in the Engineering industry. Table 6 below
shows that there was almost a 100% representation of males in 3 out of the 5 companies
studied. The overall female representation in engineering companies was 3%. The
engineering companies studied were mostly private thus the low number of engineers.
However, company B was a public company with 318 engineers and only 4 female
engineers employed.
32

Table 6: Sex structure by Engineering company
Engineering Sex of the respondents
Company Male Engineers Female Engineers Total
Company A 5 (100%) 0 (0 %) 5 (100 %)
Company B 314 (99%) 4 (1 %) 318 (100 %)
Company C 3 (100%) 0 (0 %) 3 (100 %)
Company D 5 (56 %) 4 (44 %) 9 (100 %)
Company E 2 (67 %) 1 (33 %) 3 (100 %)
Company F 10 (83 %) 2 (17 %) 12 (100 %)
Total 339 (97 %) 11 (3 %) 350 (100 %)
Information and Communication Technology industry:
The ICT industry was studied as a new industry in the Kenyan employment sector the
objective to find out if any gender stereotyping would be observed. Results from Table 7
indicate a low representation of females in the industry at an average of 17% indicating a
trend of male stereotyping in the industry. All companies showed a high male
representation with only company B showing a slightly higher female representation of
36%.
Table 7: Sex structure by ICT company
ICT
Company
Sex of respondents
Total
Male ICT
professionals
Female ICT
Professionals
Company A 16 (94 %) 1 (6 %) 17 (100 %)Company B 7 (64 %) 4 (36 %) 11 (100 %)
Company C 7 (88 %) 1 (12 %) 8 (100 %)
Total 30 (83 %) 6 (17 %) 36 (100 %)
33

Figure 1: Male representation in all occupations
□ Teaching
□ Doctor 17%
□ Nursing 41%
□ ICT9%
■ Engineering 2%
□ Teaching 31%
■ Teaching □ Nursing □ Doctor DICT ■ Engineering
Figure 1 brings out a high representation of males in Engineering, ICT and Doctor
Professions at 32%, 22% and 28% respectively. There is low representation of males in
nursing (5%) and teaching (13%).
Figure 2 brings out a high representation of females in teaching and nursing professions
at 31% and 41 % respectively. There is low representation of females in Engineering
(2%) and ICT (9%).
34

4.2 DIFFERENTIALS IN GENDER REPRESENTATION IN OCCUPATIONAL
CATEGORIES
To Differentiate between representation of both genders in the teaching industry
Where X was larger gender represented (in this case female)
Where Y was lesser gender represented (in this case male)
And W was the total number of teachers in the schools studied
(68-41)/ 109 *100= 25 %
This means that there were 25% less males represented in the teaching industry i.e. there
were 25 % more females than males in the teaching industry, a gap that seemed to be
slowly closing.
To obtain the differential percentage of gender in the nursing profession
(X-Z)/W *100
Where X was larger gender represented (in this case female)
Where Y was lesser gender represented (in this case male)
And W was the total number of nurses in the hospitals studied
The results show that there were 68 % more females than males in the nursing occupation
making it a gender-stereotyped profession.
To obtain difference in representation of both genders in the profession of doctors:
(X-Z)/W *100
Where X was larger gender represented (in this case male)
Where Y was lesser gender represented (in this case female)
And W was the total number of doctors in the hospitals studied
(X-Z)/W *100
(1731-328) /2059*100 = 68 %
(168-81 )/249* 100
= 35 %35
The results show that there were 35 % fewer females as doctors in the two hospitals
studied. The gender disparity here was not felt as much as in nursing.
To obtain difference in representation of both genders in the engineering profession
(X-Z)/W*100
Where X was larger gender represented (in this case male)
Where Y was lesser gender represented (in this case female)
And W was the total number of engineers in the companies studied
(339-11 )/3 50* 100
= 94%
This was the widest felt gap with males out numbering females by a gap of 94 %. The
gap told of a negative perception of females in the Engineering profession thus the
insignificant representation.
To obtain difference in representation of both genders in the Information
Technology profession
(X-Z)/W *100
Where X was larger gender represented (in this case male)
Where Y was lesser gender represented (in this case female)
And W was the total number of ICT workers in the companies studied
(30-6)/36* 100
=67 %
The results show that there was a 67 % less representation of females in the ICT
profession in the industry. This being a recent profession and one, which could be placed
as, stereotyped in one gender points to an attitude development in the requirements for
the profession.
36

4.3 GENDER REPRESENTATION IN THE HIERARCHY OF
ADMINISTRATION IN THE INDUSTRIES STUDIED:
School A:
Almost an equal playing field was observed in the teaching environment for this school at
53 % for males and 46 % for females. Arguments based on the earlier results and the
theories supporting gender stereotyped occupations should have brought out a higher
representation of females in administrative roles being the profession that is suited to
their physical and psychological outfit. However an involvement by females in less
scientific subjects and more in socially related fields (guidance and counselling,
languages, careers e.t.c.) was observed.
Males on the other hand headed what were more science-oriented fields but it also needs
to be pointed out that males held the three top positions thus were at a stronger position
of influence in decision making.
SchoolB
The results form school B showed that males held the two top posts of manager and head
teacher too.
SchoolC
Data from this school showed a higher representation of males at the top of the hierarchy,
as was the case in the other two schools. The results were therefore consistent and
showed a continuing trend of a male dominated occupational structure in the teaching
industry. All teachers should have been able to compete at the same level due to their
educational qualification, which was at the same level. In one case, one female happened
to have the highest educational qualification (Degree) but was placed very low in the
hierarchy. These results showed some amount of discrimination if the highest sought for
factor would be the educational level. This was not necessarily true as the second in
command was male and had a higher level of education as compared to the highest in
authority.
37

Table 8: Hierarchy of administration in Hospital AS n o . A d m i n i s t r a t i v e p o s i t i o n M a l e s F e m a l e s T o t a l
R e p r e s e n t a t i o n
E d u c a t i o n a l Q u a l i f i c a t i o n
1 C h i e f N u r s e 0 ( 0 % ) 1 ( 1 0 0 % ) 1 ( 1 0 0 % ) 1st D e g r e e - B s c
2 D e p u t y C h i e f N u r s e 0 ( 0 % ) 1 ( 1 0 0 % ) 1 ( 1 0 0 % ) D i p l o m a + D e g r e e ( B s c )
3 A s s i s t a n t C h i e f N u r s e 0 ( 0 % ) 12 ( 1 0 0 % ) 12 ( 1 0 0 % ) D i p l o m a + d e g r e e s ( B s c )
4 S e n i o r C h i e f N u r s e 7 ( 9 % ) 71 ( 9 1 % ) 7 8 ( 1 0 0 % ) D i p l o m a + d e g r e e ( B s c )
5 N u r s i n g O f f i c e r I 4 8 ( 1 4 % ) 2 9 5 ( 8 6 % ) 3 4 3 ( 1 0 0 % ) D i p l o m a
6 N u r s i n g O f f i c e r I 1 7 6 ( 3 3 % ) 1 5 7 ( 6 7 % ) 2 3 3 ( 1 0 0 % ) D i p l o m a
7 N u r s i n g O f f i c e r 1 1 I 4 0 ( 2 0 % ) 1 5 9 ( 8 0 % ) 1 9 9 ( 1 0 0 % ) C e r t i f i c a t e
8 S e n i o r E n r o l l i n g N u r s e 2 ( 3 % ) 7 7 ( 9 7 % ) 7 9 ( 1 0 0 % ) C e r t i f i c a t e
9 E n r o l l e d N u r s e I 6 9 ( 1 2 % ) 501 ( 8 8 % ) 5 7 0 ( 1 0 0 % ) C e r t i f i c a t e
10 E n r o l l e d N u r s e 1 1 13 ( 1 1 % ) 101 ( 8 9 % ) 1 1 4 ( 1 0 0 % ) C e r t i f i c a t e
11 E n r o l l e d N u r s e I 1 I 14 ( 3 0 % ) 3 2 ( 7 0 % ) 4 6 ( 1 0 0 % ) C e r t i f i c a t e
T o t a l 2 6 9 ( 1 6 % ) 1 4 0 7 ( 8 4 % ) 1 6 7 6 ( 1 0 0 % )
The results from hospital A above showed a gender stereotyped profession with the males
having no representation in the top 14 positions taken by the chief nurse, deputy chief
nurse and 12 assistant chief nurses. As we saw earlier there were only a very small
percentage of males in the nursing profession. There was a noticeable link in position and
educational level ranging from 1st degree from the top to diploma and certificate
respectively towards the bottom. Recruitment procedures were very specific and the
various administration levels were attained on educational qualifications.
Table 9: Hierarchy of administration in hospital B
S n o . A d m i n i s t r a t i v eP o s i t i o n
M a l e s F e m a l e s T o t a l
r e p r e s e n t a t i o nE d u c a t i o n a l
q u a l i f i c a t i o n1 Manager 0 ( 0 % ) 1 ( 1 0 0 % ) 1 ( 1 0 0 % ) 1st Degree(Bsc)2 Matron 0 ( 0 % ) 1 ( 1 0 0 % ) 1 ( 1 0 0 % ) 2nd Degree (Msc)3 Assistant Matron 0 ( 0 % ) 3 ( 1 0 0 % ) 3 ( 1 0 0 % ) 1st Degree(Bsc)4 Charge Sisters 0 ( 0 % ) 11 ( 1 0 0 % ) 11 ( 1 0 0 % ) !sl Degree (Bsc)5 Sisters 2 ( 2 % ) 96 ( 9 8 % ) 98 ( 1 0 0 % ) Diploma6 138 senior staff
nurse8 ( 5 % ) 138 ( 9 5 % ) 146 ( 1 0 0 % ) Diploma
7 Staff nurse 20 ( 1 3 % ) 131 ( 8 7 % ) 151 ( 1 0 0 % ) DiplomaT o t a l 3 0 ( 7 % ) 3 8 1 ( 9 3 % ) 4 1 1 ( 1 0 0 % )
38
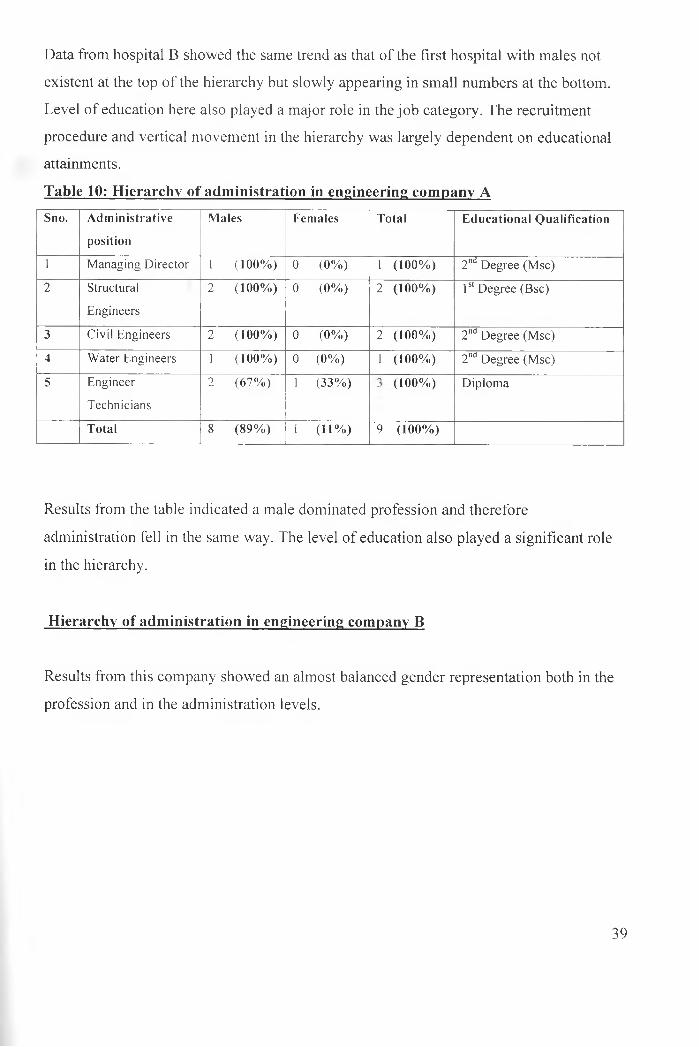
Data from hospital B showed the same trend as that of the first hospital with males not
existent at the top of the hierarchy but slowly appearing in small numbers at the bottom.
Level of education here also played a major role in the job category. The recruitment
procedure and vertical movement in the hierarchy was largely dependent on educational
attainments.
Table 10: Hierarchy of administration in engineering company AS n o . A d m i n i s t r a t i v e
p o s i t i o n
M a l e s F e m a l e s T o t a l E d u c a t i o n a l Q u a l i f i c a t i o n
1 Managing Director 1 ( 1 0 0 % ) 0 ( 0 % ) 1 ( 1 0 0 % ) 2nd Degree (Msc)
2 Structural
Engineers
2 ( 1 0 0 % ) 0 ( 0 % ) 2 ( 1 0 0 % ) 1st Degree (Bsc)
3 Civil Engineers 2 ( 1 0 0 % ) 0 ( 0 % ) 2 ( 1 0 0 % ) 2nd Degree (Msc)
4 Water Engineers 1 ( 1 0 0 % ) 0 ( 0 % ) 1 ( 1 0 0 % ) 2nd Degree (Msc)
5 Engineer
Technicians
2 ( 6 7 % ) 1 ( 3 3 % ) •A ( 1 0 0 % ) Diploma
T o t a l 8 ( 8 9 % ) 1 ( 1 1 % ) 9 ( 1 0 0 % )
Results from the table indicated a male dominated profession and therefore
administration fell in the same way. The level of education also played a significant role
in the hierarchy.
Hierarchy of administration in engineering company B
Results from this company showed an almost balanced gender representation both in the
profession and in the administration levels.
39

Table 11: Hierarchy of administration in engineering company C
S n o . A d m i n i s t r a t i v e
P o s i t i o n
M a l e s F e m a l e s T o t a l E d u c a t i o n a l
Q u a l i f i c a t i o n
1 Managing Director 1 ( 1 0 0 % ) 0 ( 0 % ) 1 ( 1 0 0 % ) 2nd Degree(Msc)
2 Head o f Department
Structures
1 ( 1 0 0 % ) 0 ( 0 % ) 1 ( 1 0 0 % ) 2"d Degree(Msc)
3 Head o f Department
civil works
0 ( 0 % ) 1 ( 1 0 0 % ) 1 ( 1 0 0 % ) 2nd Degree (Msc)
4 Civil Engineers 2 ( 6 7 % ) 1 ( 3 3 % ) 3 ( 1 0 0 % ) 1st Degree (Bsc)
5 Engineers
(structures)
1 ( 5 0 % ) 1 ( 5 0 % ) 2 ( 1 0 0 % ) Ist Degree (Bsc)
6 Technicians 2 ( 6 7 % ) 1 ( 3 3 % ) 3 ( 1 0 0 % ) Diploma
7 Engineers (water) 1 ( 1 0 0 % ) 0 ( 0 % ) 1 ( 1 0 0 % ) Diploma
Total 8 ( 6 7 % ) 4 ( 3 3 % ) 12 ( 1 0 0 % )
This was a public company and showed an order in hierarchy based on educational
levels. There was female representation at the top of the hierarchy and therefore little bias
shown. However there were very few females in this company employed as engineers.
Table 12: Hierarchy of administration in ICT Company AS n
0 .
A d m i n i s t r a t i v e P o s i t i o n M a l e s F e m a l e s T o t a l E d u c a t i o n a l
Q u a l i f i c a t i o n
i M a n a g in g D ire c to r 1 ( 1 0 0 % ) 0 ( 0 % ) 1 ( 1 0 0 % ) I st D e g re e -B s c
2 S o f tw a re D ire c to r 1 ( 1 0 0 % ) 0 ( 0 % ) 1 ( 1 0 0 % ) 1SI D e g re e = B s c
3 O ffic e A d m in is tra to r 0 ( 0 % ) 1 ( 1 0 0 % ) 1 ( 1 0 0 % ) D ip lo m a
4 P ro g ra m m e rs 4 ( 1 0 0 % ) 0 ( 0 % ) 4 ( 1 0 0 % ) 1st D e g re e B sc + D ip lo m a
5 O ff ic e a ss is ta n t 0 ( 0 % ) 1 ( 1 0 0 % ) 1 ( 1 0 0 % ) C e r tif ic a te
T o t a l 6 ( 7 5 % ) 2 ( 2 5 % ) 8 ( 1 0 0 % )
This company showed female representation at the lower levels of administration and
mainly in support duties to the senior staff. The females were therefore not engaged in
the ICT industry as professionals.
40

Table 13: Hierarchy of administration in ICT Company B
S n o . A d m i n i s t r a t i v e
P o s i t i o n
M a l e s F e m a l e s T o t a l E d u c a t i o n a l
Q u a l i f i c a t i o n
1 P e rm a n e n t S e c re ta ry 1 ( 1 0 0 % ) 0 ( 0 % ) 1 ( 1 0 0 % ) 3 rd D e g re e -P h d
2 S e n io r D e p u ty s e c re ta ry 1 ( 1 0 0 % ) 0 ( 0 % ) 1 ( 1 0 0 % ) 2 nd D e g re e -M s c
3 D e p a r tm e n t h e ad s 7 ( 8 7 . 5 % ) 1 ( 1 2 . 5 % ) 8 ( 1 0 0 % ) 1sl D e g re e -B s c
T o t a l 9 ( 9 0 % ) 1 ( 1 0 % ) 10 ( 1 0 0 % )
Data from table 13 above shows low representation of females at the top of the hierarchy
and vice versa for males. There was only one female head of department against 7 males.
Table 14 : Hierarchy of administration in ICT Company C
S n o . A d m i n i s t r a t i v e
P o s i t i o n
M a l e s F e m a l e s T o t a l E d u c a t i o n a l Q u a l i f i c a t i o n
1 C h ie f E x e c u tiv e
O ff ic e r
1 ( 1 0 0 % ) 0 ( 0 % ) 1 ( 1 0 0 % ) I s' D e g re e - B sc
2 A d m in is tra tio n
M a n a g e r
0 ( 0 % ) 1 ( 1 0 0 % ) 1 ( 1 0 0 % ) I s' D e g re e -B A
3 M a rk e tin g
M a n a g e r
1 ( 1 0 0 % ) 0 ( 0 % ) 1 ( 1 0 0 % ) D ip lo m a
4 T e c h n ic a l
M a n a g e r
1 ( 1 0 0 % ) 0 ( 0 % ) 1 ( 1 0 0 % ) 1st D e g re e -B sc
T o t a l 3 ( 7 5 % ) 1 (2 5 % ) 4 ( 1 0 0 % )
Data from this table showed a higher representation of males in the management level at
75 per cent with female representation at 25 per cent. There were different qualifications
attached to the different positions as is shown in the table.
41

4.4 GENDER AND WORK VALUES
The next section looks at analysis on perception ratings for each gender towards certain
work values. This section brings out any prejudices held against either gender with regard
to their generalized ability to uphold various working values expected from their
employers and which give approval or disapproval for hiring, firing, demotion or
promotion. The values were tested in a bid to prove or disprove the various theories on
the hiring of particular gender due to already perceived positives or negatives in the
values outlined. The values tested were as outlined below and the outcome and
significance will be discussed separately.
a) Punctuality to work- Punctuality to work plays a major role in the type of job one
handles and employees with very demanding jobs would have to be very punctual.
Females however could be affected due to family responsibilities.
b) Time flexibility - various high paying jobs demand time flexibility from their
employers. Employees who are likely to extend their working hours are more suitable for
such jobs. Furthermore the extra money paid for such jobs is an attractive package.
c) Handling work stress- Demanding jobs also come with a lot of expectations due to
tight schedules and an employee’s ability to handle this kind of stress positively will be
an asset to the company and therefore easily promoted.
d) Team Playing-The only way to rising up the ladder is through team playing, a quality
that has been enhanced in organisations for effective running of affairs in the company.
The ability to work well in teams is positive for employers and would be one that the
employers would use to hire, promote, demote and fire their employees.
e) Flexibility of Location- Companies, which have more than one branch or require
frequent travel, require staff who are willing to work from any location on demand as
need arises. An employer would therefore work comfortably with employees flexible in
location.
f) Absenteeism- Absenteeism leads to low production and inefficiency and employers
would also use this characteristic as a reason for promotion, demotion or firing of staff,
gj Completion of work deadlines- Work completed on time means the ability to move
on to other projects and no backlogs for the company. Inability of staff to complete their
42

work on time is negative for the growth of the company and would be a reason for
demotion/ promotion.
I will now discuss the outcome on the above values from my research.
1. Perception for male and female employees on: Punctuality to work
An overall 36 % of the companies rated their male workers to be punctual to work while
only 14 % rated their female workers as punctual. However both male and female
workers appear to be rated on the same level of punctuality with 43% of the companies
giving an equal rating in punctuality to their male and female workers. On this value then
neither gender can be denied the necessary benefits at work.
2. Perception for male and female workers on: Time Flexibility
Time flexibility for females came out to be perceived negatively with 71 % of the
companies interviewed giving a fair rating for the females while only 28 % of the
companies gave males a fair rating. Male workers got a 57% score on a high rating in
time flexibility while only 21% of the companies gave their female workers a high rating
on time flexibility. Only 28 % of the companies interviewed gave an equal rating for both
their male and female workers. It can therefore be concluded that females are not
generally perceived as being time flexible and would therefore not suit in a job requiring
odd working hours. Most supervisors interviewed indicated that males easily accepted
tasks performed above normal working hours and could therefore work on more
challenging jobs. Females on the other hand would have to make decision with difficulty
and delay and were therefore suited for less time demanding jobs.
3. Perception on handling work stress
An overall 43 % of the companies interviewed gave a high rating for their male workers
in being able handle work stress and thus more able to handle very demanding jobs for a
longer time while only 1 % applied for their female workers. Again females were
portrayed here as less able to handle demanding jobs. In the few instances where males
43
got a poor rating on handling work stress, they were reported to result to drug abuse and
alcohol when pushed to the wall.
4. Perception on the value of Team Playing
On the value of team playing ability, females got a higher rating than their male
counterparts with 50 % while only 43 % of the companies gave their male workers a high
value on team playing. This could be attributed to the social nature of females and the
competition driven male. Based on this then, female workers should be able to get
necessary benefits with regard to their team playing abilities.
5. Perception on : Flexibility of Location
Male employees were perceived as “Very flexible” in the case of change of location of
job with 100% of the companies giving them this rating. A mere 37 % of the companies
rated females highly in flexibility with 57 % of them giving females a “poor” rating in the
case of flexibility of location. This however according to most supervisors was attributed
to the family responsibilities carried by women. According to one supervisor in an
engineering firm, “Most females will immediately drop the job and opt for another
company if asked to leave current location. The decision is not theirs alone but the
husband and children’s also.”
6. Perception on :Absenteeism y
In this category, 71 % of the companies reported their male workers to have a lower
absenteeism rate than their female counterparts who were rated by only 50% of the
companies as to having low absenteeism rates. However absenteeism did not feature as
contentious factor as no company gave a high absenteeism rate rather the codes for low
and moderate were used. This factor then showed that there would be no basis for gender
discrimination in the award of benefits relating to low absenteeism.
7. Perception on : Completion of work deadlines
In this category, 100% of the companies gave their male workers a high rating on
punctuality while females made a 71.4 % in the ratings. However the completion of work
44

deadlines was rated equally for both male and female workers at 71.4 %. This shows that
both male and female workers were perceived to be committed to their work and
therefore an asset to their companies.
4.5 FACTORS CONSIDERED BY EMPLOYERS IN HIRING, & AWARD OF
BENEFITS
The next section concentrates on the last part of the questionnaire, which sought to find
out considerations on the part of the employer in hiring and awarding benefits to their
employees in the case of training, promotion and salary increments. The main aim of this
section was to bring out the basis for discrimination (if any) in the hiring of staff to
particular jobs and also in the promotion and award of benefits including training.
Considerations for: Hiring Staff
The basis for hiring of staff came out quite clearly with 71.4 % of the companies listing
“Qualifications” of the employee to be considered first, followed by “Experience” and
lastly “Gender”. In 86 % of the companies, the issue of “Gender” was not relevant at all
while hiring staff. However 14 % of the companies were considerate of gender while
hiring. In one company a change of policy to eradicate corruption had seen a higher
preference for females in the workforce as they were seen to be more honest and with
much more responsibility in their homes to risk corruption. In another company however,
a preference for males was quoted when looking for efficiency in the work place.
Promotion of Staff:
Regarding this benefit, 57 per cent of the supervisors interviewed listed achievement of
targets together with performance for consideration when offering promotion to staff.
The experience held by the employee was placed second at 43 per cent while
Loyalty/commitment and dedication were listed third place at 29 per cent.
The qualifications of employee came in fourth place at 21 per cent.
45
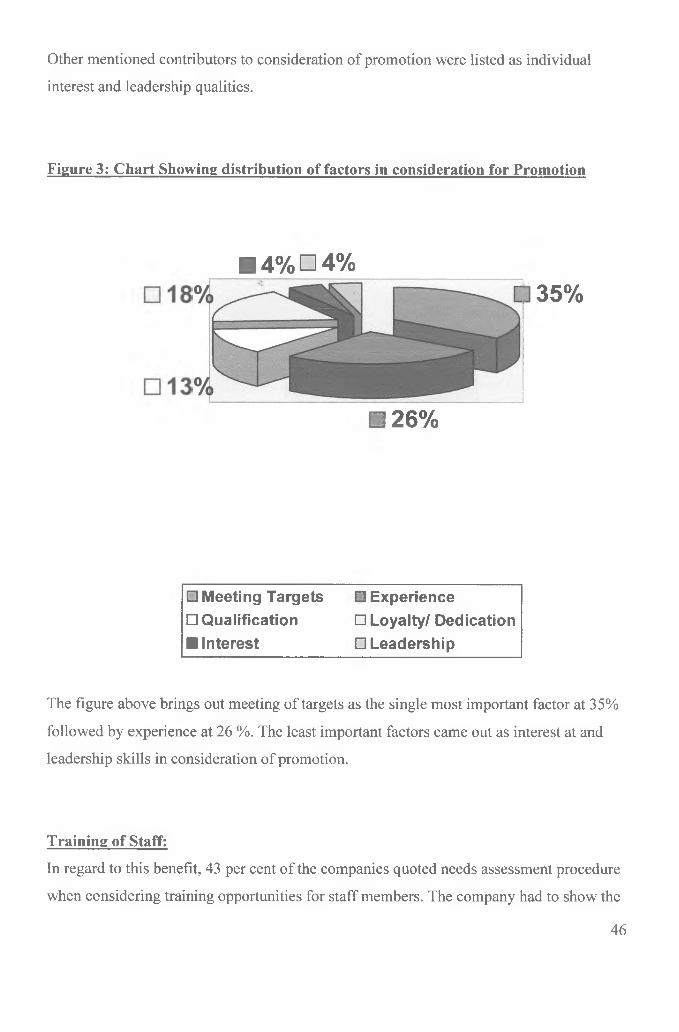
Other mentioned contributors to consideration of promotion were listed as individual
interest and leadership qualities.
Figure 3: Chart Showing distribution of factors in consideration for Promotion
□ 4% □ 4%35%
□ 26%
□ Meeting Targets □Experience□ Qualification □ Loyalty/ Dedication■ Interest □ Leadership
The figure above brings out meeting of targets as the single most important factor at 35%
followed by experience at 26 %. The least important factors came out as interest at and
leadership skills in consideration of promotion.
Training of Staff:
In regard to this benefit, 43 per cent of the companies quoted needs assessment procedure
when considering training opportunities for staff members. The company had to show the
46
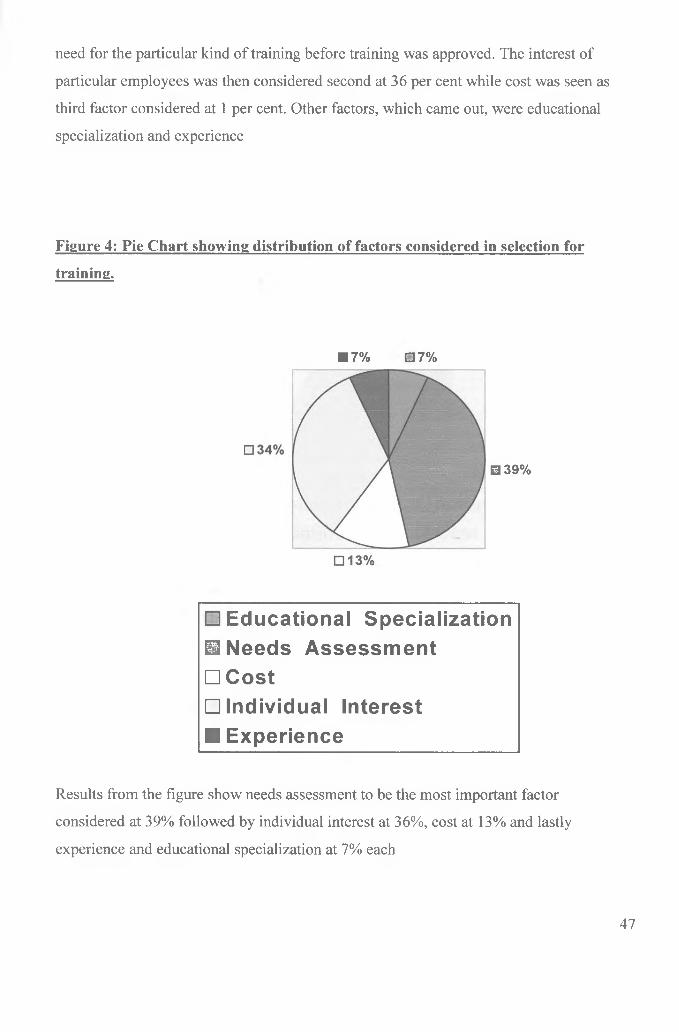
need for the particular kind of training before training was approved. The interest of
particular employees was then considered second at 36 per cent while cost was seen as
third factor considered at 1 per cent. Other factors, which came out, were educational
specialization and experience
Figure 4: Pie Chart showing distribution of factors considered in selection for
training.
■ 7% □ 7%
□ 39%
□ Educational Specialization□ Needs Assessment□ Cost□ Individual Interest ■ Experience
Results from the figure show needs assessment to be the most important factor
considered at 39% followed by individual interest at 36%, cost at 13% and lastly
experience and educational specialization at 7% each
47
Figure 5: Factors considered in the award of salary increments and benefits
■ 4%
□ 15%
□ 8%
□ 19%□ Performance □ Reliability □ Initiative□ Experience B Qualification □ CostB Achievements
Salary Increment and benefits:
The conditions outlined by companies for the award of salary increment and other
benefits including house allowance, travel and meals allowance, medical benefits e.t.c to
its employees is important to the extent that there should be no discrimination. The
results of the study done showed that performance of the employee was the single most
factor considered when awarding salary increments and benefits to employees at 38 %.
The least considered factor was achievements at 4%. The figure above displays the
factors, which came out as important in the consideration for salary increments and other
benefits.
48

CHAPTER 7
CONCLUSION AND RECOMMENDATIONS
The results from my study clearly showed a demarcation in occupations with regard to
gender. Occupations in the Kenyan society were still viewed as stereotyped occupations
for specific gender groups. This was shown by a very small percentage of either gender
being represented in occupations traditionally set-aside for specific gender.
The occupation of Engineering saw a higher representation of males and only a very
small percentage saw women represented in the field. This is despite the obvious societal
challenges and the inclusion of women in education.
The field in nursing though showing entry of males into the field however still showed a
high demarcation with females dominating the field in every aspect.
The teaching industry showed an almost equal representation of either gender but
demarcations were clear in the hierarchy of administration where despite an occupation
seen to be in the hands of females their representation in administration was meager.
There was also a clear demarcation in fields of interest in the teaching industry with
males on the technical subjects of Mathematics and Sciences and females in the Arts and
Languages.
The ICT industry was meant to be a neutral gender occupation as this is a relatively new
occupation where no gender specifications were made. However my study showed that
the field was already emerging as a male dominated field. The ICT industry is growing
everyday with all industries being required to be proficient in information technology. It
is no doubt that this field holds a lot of opportunities for the youth. Females should
especially not be left out of an opportunity to be in one of the fastest growing industries.
It was interesting to note that no company had an “Equal Opportunity employment
Policy”. Since the companies were interviewed in the understanding that they were
traditionally “Gender Stereotyped professions” it was easy to assume that the lack of this
policy is a factor that had contributed to discrimination in hiring of staff.
49
The conditions outlined for the selection of staff in training were very open to both
gender and left little room for discrimination as only the individual and company interest
were considered. Both male and female employees were able to contest for further
training in their fields. The limiting factors would be their own interest in the training and
the company’s financial limitations.
However as seen from the results on the values of absenteeism, completion of work
deadlines, punctuality, flexibility of location and time and the conditions outlined for the
consideration of salary increments and benefits and promotion, females were at a
disadvantage. This was because most companies did not rate their female workers well in
terms of the above values. Females in fact scored low in the punctuality to work and
flexibility of time and location and even in making deadlines. This showed that most of
the females would fail to be considered for salary increments and promotions, as they
would then not be reliable to their company, which was a factor, rated highly in salary
increment.
Due to their family roles as we pointed out earlier, performance of females at work was
affected. A male employee would be able to put in more hours to his job without
interruption as opposed to his female colleague. This in itself was a disadvantage to
earning a promotion or salary increment.
With experience rating highly as a third factor, women even seemed more disadvantaged
due to work interruptions. In the private sector this meant possibility of losing the job.
The chance of gaining more experience was limited due to non-flexibility of work
location. Male workers would more easily earn a promotion or salary raise as opposed to
their female counterparts.
Qualifications of the employee was one of the factors highly considered for a promotion
or salary raise. Male and female employees would compete equally if qualifications were
the only factor to be considered. From the results of the study most females were as
educated as their male counterparts and some rated even better. However qualification
came as a third factor after performance and experience therefore placing females at a
disadvantage.
Overall, the attitude of the working population had not changed in its view of role
placement and the ability of either gender to accomplish any role given to them and in
their interest. Women too were limited by this lack of change in society burdening them50

with their expected roles in society while challenging them with the difficulties of a
modern society. Women were therefore caught in the hurdle trying to balance the two
against a male dominated society.
RECOMMENDATIONS:
Based on my conclusions above, there needs to be a change in policy and attitude at three
levels:
■ The individual
■ The Family and society
■ The government
The Individual:
The greatest limitation in achievement was found in the individual and begged for a
change in attitude and perception of various occupations. Each occupation should be
viewed as a means to personal achievement and one that can be performed by any
individual. In this respect both men and women should be open to all kinds of fields to
create a more diverse employment sector and therefore create more employment
opportunities. Parents need to stop telling children what to be but encourage them in all
areas and leave them to discover their own interest. Girls should be encouraged to gain
interest in technical subjects and boys encouraged in gaining interest in caring and
nurturing.
The Family and Society:
Roles given to boys and girls at home, school and in the neighbouring environment are a
strong factor in influencing their careers. Boys and girls should be given the same tasks to
accomplish in order to remove the attitude associated with different roles. Parents should
act as role models and be able to interchange roles in the house thus children will not
identify themselves with particular roles but with the responsibility to fill a need.
Society needs to stop shunning ambitious women who are interested in leadership
positions and award these positions on merit thus women will feel encouraged to further
their skills.51

The government:
The role of the government will play a major role in enforcing what the family, society and individual attempt to do.
1. The government needs to take affirmative action in ensuring all females and
males qualified in “Stereotyped Professions” are employed in such organisations.
2. An “Equal Opportunity Employment Policy” should be made mandatory for all employers.3. A non-discrimination policy should be put in place in all work places to ensure all
workers are protected in their work places and are not harassed for being in the “wrong”
profession”
4. The Government through its Education Ministry should re-introduce in their
primary curriculum the technical and home care subjects (Craft and Home Science) to
give every boy and girl skills in performing any role in their homes.
5. The government should put in place a Programme to award scholarships to males
and females who want to pursue fields in which their gender is under represented. This
will wake society into a new era of competitiveness.
Other recommendations have been brought out in earlier studies conducted in
“Occupational Segregation”. I have outlined a few of them below:
1. Reductions in working hours- Shorter working hours have been found to be a
contribution to health and quality of life. Additional non-work time permits
individuals to spend more time with their children to take part in a wider range of
leisure activities and to be more socially active (Michael White, 1987). The large
entry of women into industrial and commercial work force and the unsuitability of
existing working schedules for many women who are seeking to combine paid work
with child rearing have been found to be unfair for them. The role of fathers in child
rearing needs to be considered and both fathers and mothers given shorter work52

schedules to be able to cope and help each other in their family responsibilities. This
kind of adjustment would create an equal competitive ground for both male and
female workers.
2. Legislation in control of wages, salaries— the need for a women’s bureau-The
Government in its sessional paper (pg. 63) acknowledged the inequalities encountered
by women and recommended the establishment of a well-staffed women’s bureau
within the Government to monitor and to promote their better integration into the
economy. It also recommended that the Government undertake a full scale general
review of the status of women with a view toward outlining steps which should be
taken to assure an optimum contribution on their part to the nation’s political, social
and economic development. The women’s bureau would ensure that women’s
working conditions are not used as a tool against them in the acquiring of a promotion
or salary increment.
3. Putting in place non-discriminatory policies- by following the example of the
United States Employment services by adopting a policy of obtaining from an
applicant only that information which is necessary to determine his/her qualifications
for employment and facilitate job placement. To directly deal with discrimination
(against minority groups including women) policies with concerns outlined below
should be implemented.
a) To promote employment opportunities for all applicants on the basis of
their skills, abilities and job qualifications.
b) To make definite continuous effort with employers with whom
relationships are established to the end that their hiring specifications
be based exclusively on job performance factors.
c) To enable an Equal Employment Opportunity environment
(U.S Commission of Civil Rights Employment, 1961. Pg. 115)
53

BIBLIOGRAPHY
Anker. Richard (1980): “ Research on Women ’s Roles and Demographic
Change ” , International Labour Office, Geneva.
Anker, Richard, M.E. Khan and R.B. Gupta (1988): L Women ’v Participation in
the Labour Force; a methods test in India for improving its measurement”
International Labour Office, Geneva.
Anker Richard. Forthcoming, (1995) “ Gender and Job: Sex segregation of
occupations in the world” Geneva, ILO.
Anker Richard, (1997): “Theories of Occupational segregation by sex: An
overview” International Labour Review, Volume 136, Number 3.Geneva, ILO.
Barbara Reskin. Lowell Hargens, Mark Handock, (2002-2003) 'The structure of
Occupational Segregation by Sex, race. Ethnicity and Hispanicity” CSSS Seed
Grants Program Awards for 2002-2003
Central Bureau of Statistics (August, 2002): “Analytical Report on Labour Force
Volume Lx. Kenya Population and Housing Census”. Ministry of Finance and
Planning.
Central Bureau of Statistics (August, 2002): “Analytical Report on Gender
Dimensions Volume XI. Kenya 1999 Population and Housing Census”.
Ministry of Finance and Planning.
Doeringer Peter; Piore, Michael. (1971). “Internal Labour Markets and
Manpower analysis” Lexington, MA, D.C. Heath and Co.
Date-Bah, Eugenia. (1986). ”Sex segregation and discrimination in Accra-
Tema: causes and consequences” in Anker and Hein, pp235-276.
54
Francoise Latour da Veiga-Pinto (1976): “Research Symposium on Women and
Decision-Making; a social policy priority”. International Institute for Labour
Studies, 1976.
Michael White: “Working Hours; assessing the potential for reduction”
International Labour Office, Switzerland.
Miller L, Neathey F, Pollard E, Hill D. (2004). “Occupational Segregation,
Gender Gaps and Skill Gaps”. Equal Opportunities Commission (EOC) Working
Paper 15
Republic of Kenya (1973): " Sessional Paper on Employment”. Government
Printers.
Routh G. (1965): uOccupation and Pay in Great B r i ta in Cambridge University
Press.
Sivard R.L. (1985 ).”Women...a world survey” Ford Foundation. New York
Theme H. (2002). ”Reducing Gender Gaps and supporting job desegregation”
Centre for Statistics and Social Sciences.
Bina Agarwal ( 1 9 9 2 Unequal Burden : Economic Crises, persistent poverty
and women’s work'" West View Press.
U.S. Commission of Civil Rights (1961): "Emp/oyment-U.S." Government
Printing Office, Washington D.C.
UNDP (1995), Human Development Report. New York, NY, Oxford University
Press.
World Bank. 1994. Enhancing Women ’,v Participation in Economic
Development55
APPENDIX A: QUESTIONAIRRE
A STUDY OF OCCUPATIONAL SEGREGATION IN THE EMPLOYMENT SECTOR: THE CASE OF NAIROBI, KENYA
QUESTIONAIRRE
1. Company Type - a) Service ( Hospital or School) b) Information Technology
c) Construction e) Engineering2. Any mission & vision statement adapted by the company? ( a) yes b) no3. If Yes to Q 2 write down the statement adopted and when it was adopted.
4. Any organizational philosophy followed by the company? (a) yes b) no
5. If Yes to Q 4 write down the philosophy adopted and when it was adopted.
6. Number of employed staff (in figures).......................
7. Number of teachers/ doctors/ nurses/engineers/ construction workers/ ICTprofessionals (in figures)................................
8. Number of male teachers/ doctors/ nurses/engineers/ construction workers/ ICTprofessionals (in figures)................................
9. Number of female teachers/ doctors/ nurses/engineers/ construction workers/ ICTprofessionals (in figures).......................
10. Outline hierarchy of administration by filling the table below
Position Number of males Number of females Educational level ( fill ascertificate,diploma, 1st degree, 2nd degree e.t.c
12345678910
56

11121314151617181920
11. How would you rate your female employee’s performance through your interaction with them? Indicate by marking one choice in the following values below:
a) Punctuality to work -a) often punctual c) always punctual d) never punctual
b) Time flexibility - a) very flexible b) not flexible c) fairly flexible
c) Handling work stress- a) Very good b) good c) moderate d) poor
d) Team playing - a) Very good b) good c) moderate d) poor
e) Flexibility of location( if required to perform task in an area outside current location)-a) very flexible b) not flexible c) fairly flexible
f) Absenteeism from work a ) High b) low c) moderate
g) Completion of work deadlines: a) punctual b) late
12. How would you rate your male employee’s performance through your interaction with them? Indicate by marking one choice in the following values below:
a) Punctuality to work -a) often punctual c) always punctual d) never punctual
b) Time flexibility - a) very flexible b) not flexible c) fairly flexible
c) Handling work stress- a) Very good b) good c) moderate d) poor
d) Team playing - a) Very good b) good c) moderate d) poor
e) Flexibility of location( if required to perform task in an area outside current location)
-a) very flexible b) not flexible
f) Absenteeism from work a )High b) low
c) fairly flexible
c) moderate % w
g) Completion of work deadlines: a) punctual b)late 57

13. Mark in order of preference your considerations when hiring staff on the following aspects:
a) Experienceb) Qualificationsc) Gender
14. What conditions do you outline for your staff for promotion?
15. What conditions do you outline for your staff selection in training?
16. What conditions do you outline for your staff for salary increments and benefits? ( use the back of this page to answer )
58
Top Related