


Languages
Pages
Legal


This work has been digitalized and published in 2013 by Verlag Zeitschrift für Naturforschung in cooperation with the Max Planck Society for the Advancement of Science under a Creative Commons Attribution4.0 International License.
Dieses Werk wurde im Jahr 2013 vom Verlag Zeitschrift für Naturforschungin Zusammenarbeit mit der Max-Planck-Gesellschaft zur Förderung derWissenschaften e.V. digitalisiert und unter folgender Lizenz veröffentlicht:Creative Commons Namensnennung 4.0 Lizenz.
Nuclear Quadrupole Resonance in Amorphous Semiconductors * P. Craig Taylor Department of Physics, University o f Utah, Salt Lake City, U T 84112, U S A
Z. Naturforsch. 51a , 6 0 3 - 6 1 0 (1996); received November 20, 1995
Nuclear quadrupole resonance ( N Q R ) has provided a valuable tool for investigating the local structural order in semiconducting glasses. Measurements of N Q R lineshapes and spin-lattice relaxation times help elucidate the local structural order and the unusual vibrational properties, respectively, o f these glasses. In addition, N Q R lineshape measurements on samples that are made under condit ions that produce solids whose structures are far from equilibrium, such as fast-evap-orated films or rapidly-drawn fibers, provide detailed information on the changes in the local structural order from that which occurs in the well-annealed amorphous semiconductors.
Key words: N Q R , chalcogenide glasses, amorphous semiconductors, structure, vibrational properties.
Introduction
The interpretation of the usual scattering experi-ments, such as x-ray, neutron or electron scattering, is in the case of amorphous semiconductors greatly complicated by the absence of long range periodic order. Therefore information concerning the static and dynamic properties of these solids must be gath-ered from many different experimental techniques. In the chalcogenide (group IV) and pnictide (group V) amorphous semiconductors nuclear quadrupole reso-nance (NQR) is a particularly useful technique. This usefulness results from the fact that N Q R provides information on interatomic spacings and thus local structural order. In the case of 7 5As, analyses of the N Q R lineshapes yield detailed information on the lo-cal bonding at the arsenic sites in the glasses, and in some cases also about the so-called "intermediate range order" that occurs on a scale of several inter-atomic spacings. Of particular importance is the fact that 7 5As N Q R measurements can distinguish be-tween As-chalcogen and As -As bonds in a wide range of chalcogenide glass systems. One can also examine the detailed local structural rearrangements that ac-company the well-known photo-induced polymeriza-tion that occurs in some of these semiconducting glasses. 7 5As N Q R measurements also probe some dynamic processes in these amorphous semiconduc-
* Presented at the XHIth International Sympos ium on Nu-clear Quadrupole Interactions, Providence, Rhode Island, U S A , July 2 3 - 2 8 , 1995.
Reprint requests to Prof. P. Craig Taylor.
tors, processes such as highly anharmonic "tunneling" or "disorder" modes that are supposed to exist in all of these materials.
We will discuss local bonding information obtained primarily from 7 5As N Q R in chalcogenide and pnic-tide amorphous semiconductors. The use of spin-lat-tice relaxation measurements to probe disorder modes in these materials will also be discussed. The As-con-taining amorphous semiconductors of most interest include amorphous arsenic, simple binary arsenic-chalcogenide glasses, such as As2Se3 and As 2S 3 , and more complicated chalcogenide glasses, such as the metal chalcogenide systems including C u - A s - S e and C u - A s - S .
Nuclear Quadrupole Resonance
The theoretical foundations of N Q R can be found in many reviews [1]. We summarize here only the ele-ments essential for an understanding of the data pre-sented below. The N Q R Hamiltonian can be written in the form
/ = I Q I , (1)
where I is the nuclear spin operator and Q is the quadrupolar tensor. This tensor contains the gradient of the electric field (EFG) at the nuclear site and the quadrupole moment of the nucleus, Q. In the principal axis system one can use the maximum component of the tensor, Vzz, and the asymmetry in the remaining two components, (Vxx- Vyy)/Vzz, to define two indepen-dent parameters, eq and q, respectively, (e is the elec-tronic charge). In the case of 7 5As, 7 = 3/2 and there
0932-0784 / 96 / 0500-615 $ 06.00 © - Verlag der Zeitschrift für Naturforschung, D-72072 Tübingen

604 P.C. Taylor • NQR in Amorphous Semiconductors
are two doubly degenerate energy levels whose sepa-ration yields a resonant frequency given by
•2qQ 2 h
1 + 2 \ 1 /2
(2)
Because there is only one resonant transition one can-not independently determine the two independent parameters q and r] from the N Q R absorption.
Experimental Details
The experiments described in this review all involve use of a s tandard pulsed spectrometer whose features have been described in [2, 3]. The pulse sequence em-ployed was usually a 9 0 ° - T - 180° sequence, after which the spin echo was observed. The glassy samples used were made by methods described in [4].
Binary Chalcogenide Glasses
In the binary chalcogenide glasses we shall use as examples the prototype glasses, As2Se3 , As 2S 3 , and A s 2 0 3 . In these stoichiometric glasses the arsenic atoms are bonded to three chalcogens and the N Q R spectra of the glasses are essentially centered about the N Q R line (or lines) observed in the layered, crystalline modifications [2, 5]. This fact is illustrated for the glasses As2Se3 and As 2 S 3 in Figure 1. In this figure the open squares and circles represent the 7 5As N Q R echo intensities as functions of frequency. Solid and dashed vertical lines indicate the positions of
5As N Q R absorpt ions in several crystalline modifi-cations in these two binary systems. The linewidths of the crystalline N Q R spectra are so narrow on the scale of Fig. 1 that they cannot be accurately represented [6]. In the A s - S e and A s - S systems, the stoichiometric composit ions (A2B3) exhibit similar nearest neighbor order in both the amorphous and crystalline phases. In particular, each arsenic is bonded to three chalco-gen atoms, and each chalcogen to two arsenics. The much broader lines in the glasses are due to small distortions in the apex bond angles of the AsS3 or AsSe3 pyramidal units. Estimates of the distortions in the apex pyramidal bonding angles for the As sites in these glasses yield distributions whose half widths are only a few degrees [2, 7], Note in particular that one specific crystalline modification in the A s - S system, namely orpiment or As 4S 4 which is a molecular crys-
0.4 0.6
° A l 0 4 S e 0 . 6 ° l a " AjjSj crystal
As2Se3 A s , S ,
AssS.
45 55 65 75 F R E Q U E N C Y ( M H z )
85 95
Fig. 1. 7 5 A s N Q R spectra in selected crystall ine and glassy chalcogenides . The spectra for the crystals are indicated sche-matical ly because they are t o o narrow to be d isplayed accu-rately on the scale of this figure.
tal that contains A s - A s bonds, exhibits 7 5 As N Q R frequencies well outside of those observed in the stoi-chiometric binary glass. We will demonstra te below that one can use this separation to probe the presence of A s - A s bonds in the arsenic chalcogenide glasses. One can also infer from the positions of these N Q R lineshapes and other details of the N Q R data that vestiges of the ring structures (intermediate range or-der) of the crystalline compounds are maintained in the glasses [2]. An example of this ring structure is shown for a particular crystalline modification in the A s - O system (claudetite) in Figure 2. Note in Fig. 2 that the basic conclusions drawn for the sulfur and selenium systems also hold for the oxide system. In particular, the 7 5As lineshape in glassy A s 2 0 3 is much broader than those that occur in the crystalline com-pounds, and this lineshape is centered about the lay-ered crystalline modification (claudetite) as opposed to the molecular form (arsenolite). Similar conclusions can be drawn in the oxide system with regard to dis-tortions in the pyramidal A s 0 3 apex bond angles.
In mixed systems, such as glassy As2SJCSe3_JC, the 5As N Q R lineshapes exhibit peaks that scale essen-
tially linearly with x. Results such as this suggest that the mixed A s - S e pyramidal structures occur essen-tially randomly [8] with no evidence for segregation of the chalcogen elements suggested in some models [9],
Arsenic-Arsenic Bonds
In non-stoichiometric binary chalcogenide glasses and in metal-chalcogenide glassy systems, such as

605 P.C. Taylor • NQR in Amorphous Semiconductors
105 110 115 120 v ( M H z )
Fig. 2. 7 5 A s N Q R spectrum in glassy A s 2 0 3 . The N Q R frequencies for two crystalline modifications of A s 2 0 3 , claudetite and arsenolite, are indicated by arrows at the top of the figure. Also shown are the local ring structure of claudetite and the local molecular structure of arsenolite.
C u - A s - S and C u - A s - S e , 7 5As N Q R measurements have recently been employed to study the occurrence of As -As bonds in the non-stoichiometric composi-tions [4, 10]. An example of this use of 7 5As N Q R is shown in Fig. 3, which compares the spectrum for an As2Se3 fiber, whose 75As N Q R lineshape differs only subtly from that of the well-annealed bulk glass (see discussion below), with that of glassy AsSe, where essentially all As sites have at least one A s - A s bond. (If one assumes that the nearest-neighbor coordina-tion numbers for As and Se do not change from the stoichiometric composition and that each As site has
10
I 8
£ 6 to z uj I— E « o z er; 2 oc
°48 58 68 78 88 F R E Q U E N C Y ( M H z )
Fig. 3. 7 5 A s N Q R spectra of a glassy As 2 Se 3 fiber (dashed line and open circles) and a bulk samples of glassy A s 0 5 S e 0 5 . In glassy As 0 5 Se 0 5 , essentially all of the arsenic a toms are bonded to at least one other arsenic. See text for details.
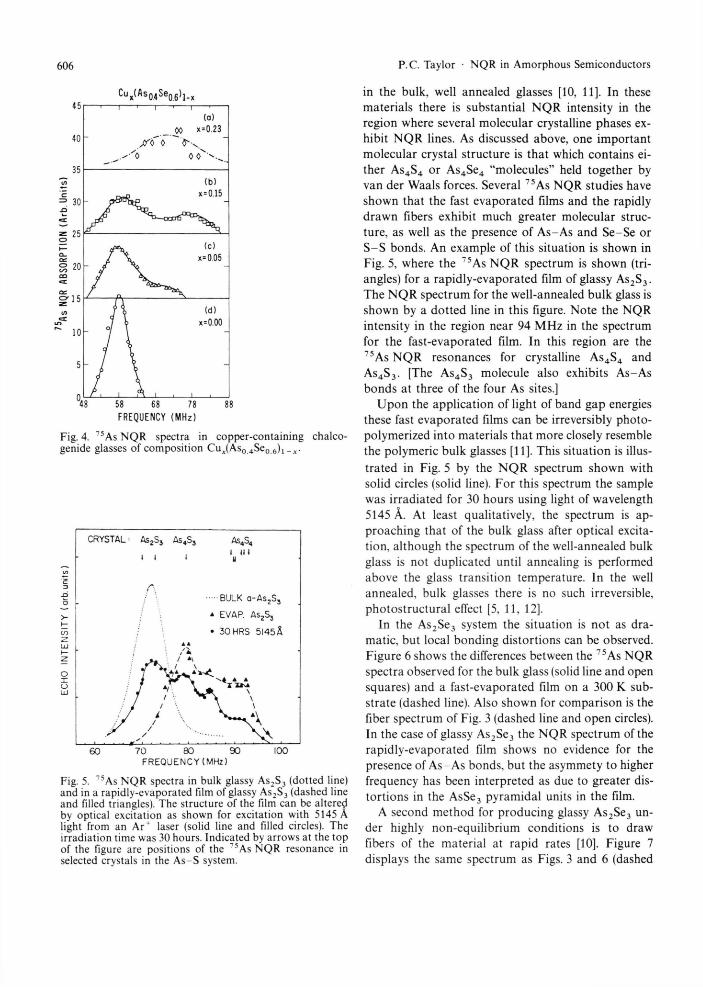
at most one A s - A s bond, then one can easily calculate that all As sites have one As-As bond for the compo-sition AsSe.) The 7 5As N Q R spectrum for glassy AsSe is peaked at the position of the N Q R resonances in crystalline As4Se4 , in which each arsenic site has one A s - A s bond. We take this correspondence as evidence that the 7 5As N Q R is sensitive to the presence of A s - A s bonds in the chalcogenide glasses. In fact, one can use this identification to "count" As -As bonds in other non-stoichiometric chalcogenide composi-tions. We use as an example the metal chalcogenide glass system, C u - A s - S e , as shown in Figure 4. It can be shown that along the pseudo binary line C u 2 S e - A s 2 S e 3 there exist no As -As bonds, but along the line C u - A s 2 S e 3 the fraction of As sites that con-tains one A s - A s bond increases with the copper con-centration [4]. The presence of the peak near 78 M H z for 15 at. % Cu in Fig. 4 is a qualitative indication of this fact. In fact, more detailed measurements on both Se and S metal chalcogenide systems have shown that the 7 5As N Q R spectra can be employed to measure with reasonable quantitative accuracy the fraction of As sites that contain one As -As bond [4].
Glasses Far From Equilibrium
The N Q R spectra observed in fast evaporated films of amorphous As 2S 3 and As2Se3 and in rapidly drawn fibers of As2Se3 are very different from those observed
606 P.C. Taylor • NQR in Amorphous Semiconductors
45
40
35 U)
=> 30
er
o_ I 20 OO
«X ir> " 10
5
°48 58 68 78 88 FREQUENCY (MHz)
Fig. 4. 7 5 A s N Q R spectra in copper-containing chalco-genide glasses of composi t ion Cu x (As 0 4 S e 0 6 ) j
FREQUENCY (MHz)
Fig. 5. 7 5AS N Q R spectra in bulk glassy A s 2 S 3 (dotted line) and in a rapidly-evaporated film of glassy A s 2 S 3 (dashed line and filled triangles). The structure of the film can be altered by optical excitation as shown for excitation with 5145 A light from an Ar" laser (solid line and filled circles). The irradiation time was 30 hours. Indicated by arrows at the top of the figure are posit ions of the " 5As N Q R resonance in selected crystals in the A s - S system.
in the bulk, well annealed glasses [10, 11]. In these materials there is substantial N Q R intensity in the region where several molecular crystalline phases ex-hibit N Q R lines. As discussed above, one important molecular crystal structure is that which contains ei-ther AS4S4 or As4Se4 "molecules" held together by van der Waals forces. Several 7 5As NQR studies have shown that the fast evaporated films and the rapidly drawn fibers exhibit much greater molecular struc-ture, as well as the presence of As-As and Se-Se or S - S bonds. An example of this situation is shown in Fig. 5, where the 7 5As N Q R spectrum is shown (tri-angles) for a rapidly-evaporated film of glassy As2S3 . The N Q R spectrum for the well-annealed bulk glass is shown by a dotted line in this figure. Note the NQR intensity in the region near 94 MHz in the spectrum for the fast-evaporated film. In this region are the 7 5As N Q R resonances for crystalline As 4 S 4 and AS4S3. [The As 4S 3 molecule also exhibits As-As bonds at three of the four As sites.]
Upon the application of light of band gap energies these fast evaporated films can be irreversibly photo-polymerized into materials that more closely resemble the polymeric bulk glasses [11]. This situation is illus-trated in Fig. 5 by the N Q R spectrum shown with solid circles (solid line). For this spectrum the sample was irradiated for 30 hours using light of wavelength 5145 Ä. At least qualitatively, the spectrum is ap-proaching that of the bulk glass after optical excita-tion, although the spectrum of the well-annealed bulk glass is not duplicated until annealing is performed above the glass transition temperature. In the well annealed, bulk glasses there is no such irreversible, photostructural effect [5, 11, 12],
In the As2Se3 system the situation is not as dra-matic, but local bonding distortions can be observed. Figure 6 shows the differences between the 7 5As NQR spectra observed for the bulk glass (solid line and open squares) and a fast-evaporated film on a 300 K sub-strate (dashed line). Also shown for comparison is the fiber spectrum of Fig. 3 (dashed line and open circles). In the case of glassy As2Se3 the NQR spectrum of the rapidly-evaporated film shows no evidence for the presence of A s - A s bonds, but the asymmety to higher frequency has been interpreted as due to greater dis-tortions in the AsSe3 pyramidal units in the film.
A second method for producing glassy As2Se3 un-der highly non-equilibrium conditions is to draw fibers of the material at rapid rates [10]. Figure 7 displays the same spectrum as Figs. 3 and 6 (dashed
Cu x (As 0 4 Se 0 6 ) 1 . x

607 P.C. Taylor • NQR in Amorphous Semiconductors
line) of a fiber, which was drawn at 40 m/min and was annealed at 300 K for one year. As seen from Fig. 6, this spectrum is very close to that of the well-annealed bulk glass. If the draw rate is increased to 75 m/min and the fiber is placed immediately in liquid nitrogen to stall the annealing process, then the 7 5As N Q R spectrum in Fig. 7 shown by the solid line (and open squares) is observed. Annealing at 200 °C for several hours produces the spectrum indicated by the dashed line (and solid circles) in Figure 7. In analogy with the case for the rapidly-evaporated films, the spectrum approaches that of the well-annealed bulk glass, but the glass spectrum is not duplicated unless the anneal-ing is performed above the glass transition tempera-ture. In the case of the rapidly-drawn fibers these results are corroborated by differential scanning calorimetry [12].
Influence of Defects
In glassy As2Se3 and As2S3 one may introduce sig-nificant densities (1017 spins/cm3) of paramagnetic de-fects ("dangling" Se and As bonds) by optical excita-tion with light of energy greater than or equal to the optical band gap energies. It is not surprising that the presence of these defects does not alter the 7 5 As N Q R spectra of the well-annealed chalcogenide glasses [5]. This fact is illustrated for glassy As2Se3 in Figure 8. In this figure the solid triangles represent data taken on
the well-annealed glass, and the open circles represent data taken after optical excitation. The excitation was performed, and the N Q R spectra were recorded, at 77 K. Although the N Q R lineshape is unchanged, there are better signal-to-noise ratios for the data taken after optical excitation because the spin-lattice
$ Draw Rate 75 m/min i Annealed at 200°C
Aged Fiber
58 66 74 82 FREQUENCY (MHz)
90
Fig. 7. 7 5 As N Q R spectra in an As 2 Se 3 fiber pulled at 40 m/ min and annealed at 300 K for about one year (dashed line), in a rapidly drawn fiber pulled at 75 m/min and immediately stored at 77 K (solid line and open squares), and in the same fiber annealed at 200 °C (dashed line and solid circles).
Fig. 6. 7 5 As NQR spectra in bulk glassy As 2 Se 3 (solid line and open squares), in a rapidly evaporated film (dashed line), and in a fiber pulled at 40 m/min and annealed at 300 K for about one year (short dashed line and open circles).
Fig. 8. 7 5 As N Q R spectra in bulk glassy As 2 Se 3 (solid trian-gles) and in bulk glassy As 2 Se 3 after optical excitation at 77 K (open circles). See text for details.

608
T (K)
Fig. 9. Temperature dependence of the relative number of paramagnetic states in glassy As 2 Se 3 after optical excitation at 77 K. The solid line shows the data measured using elec-tron spin resonance, and the three data points are extracted from the spin-lattice relaxation times observed in ^5As N Q R . See text for details.
relaxation rate has increased dramatically. This in-crease is due to the presence of the paramagnetic cen-ters produced by the irradiation. The proof of this assertion is shown in Fig. 9, where the relative number of electron spin resonance (ESR) centers is plotted as a function of annealing temperature after optical exci-tation at 77 K. The solid line represents data obtained by direct measurement of these centers using ESR, and the solid points represent data obtained from measurements of the values in the N Q R experi-ments. It is evident from this figure that the decrease in Tx in the 5As NQR measurements is due to the increase in the paramagnetic Se and As dangling bonds.
Amorphous Arsenic
In addition to the chalcogenide glasses, an 5 As N Q R lineshape has also been observed for amor-
phous arsenic (a-As). Unlike the largely symmetric lineshapes observed in the chalcogenide glasses, the lineshape in a-As is highly asymmetric and is not cen-tered about either of the two crystalline modifications. At 4 K the lineshape observed in semiconducting, orthorhombic arsenic is centered near 46 M H z (dashed line in Fig. 10a), and the lineshape of the semi-metallic, rhombohedral arsenic is centered near 23.5 MHz. (The difference between the structures of these two crystalline forms of As is subtle. They are both layered compounds, but the orthorhombic form has six-membered rings where the As appears in a
P.C. Taylor • NQR in Amorphous Semiconductors
V (MHz)
Fig. 10. ( a ) 7 5 As N Q R in orthorhombic As (dashed line) and amorphous arsenic (solid line and filled circles), (b) calculated N Q R spectrum using a simple tight-binding model and a model for amorphous As with the dihedral angle distribu-tion, P ( S ) , shown in the inset. See text for details.
staggered configuration while the rhombohedral modification has six-membered rings in the chair con-figuration.) On the other hand, the N Q R lineshape in a-As is highly asymmetric and peaked near 65 MHz (solid line and filled circles in Figure 10 a). Calcula-tions based on a very simple tight-binding model sug-gest that the bonding in these three forms of As is essentially p-type and that the s admixtures of the bonding wave functions are approximately 3, 7, and 10% in rhombohedral , orthorhombic, and amor-phous arsenic, respectively [14, 15]. The asymmetry in the 7 5As N Q R spectrum for a-As has been shown to be due to the distribution in dihedral bonding angles (angular rotation between adjacent pyramids con-nected by a given A s - A s bond) in the amorphous phase. A simple calculation based on a molecular model of a-As is shown in Figure 10 b. The inset to Fig. 10 b shows the dihedral angle distribution for this model. Although, in this simple model calculation, the calculated spectrum does not match the observed spectrum in any quantitative way, the qualitative trend is obtained.

609 P.C. Taylor • NQR in Amorphous Semiconductors
100
10
T,
1
(sec)
0.1
0 .01
I 10 100 1000 T (K)
Fig. 11. Tempera ture dependences of the spin-lattice relax-at ion times for 7 5 As N Q R in several a m o r p h o u s semicon-ductors .
ir> c
-O
> -
cn LU o LLJ CC
z o t— cr (vj I— LLJ z CD «X
</>
J 0 10 20 30
( T I M E ) 1 / 2 ( m s e c ) 1 / 2
Fig. 12. Recovery of the magnetization following a 90° - 1 8 0 ° -echo pulse sequence in a series of Cu x (As 0 4 Se 0 6)x _ x glasses. N o t e that the da t a are plotted as funct ions of the square root of the time. See text for details.
Spin-Lattice Relaxation and "Disorder Modes"
Spin-lattice relaxation is the process by which the ensemble of nuclear spins transfers energy to the lat-tice after rf excitation. For nuclei with spin greater than Vi, such as 75As, this relaxation often results from a modulat ion of the electric field gradient by a Raman process involving either phonons or some other lattice modes. In crystalline solids the low-tem-perature behavior exhibits a very rapid temperature dependence (exponential or power law with the power law exponent —7 or —9). In amorphous solids the spin lattice relaxation times Ti usually obey a power law whose exponent is approximately —2. Typical curves for 7 5As N Q R are shown in Fig. 11 for two chalcogenide glasses, one pnictide amorphous semi-conductor (a-As) and one oxide glass. The inter-pretation of this behavior is that the relaxation in-volves a Raman process where highly anharmonic two-level systems, often called "disorder modes," sub-stitute for at least one of the phonons. Measurements of T! in a wide range of semiconducting and insulating glasses using a wide range of nuclei show that this relaxation mechanism is important in essentially all glasses [16].
One final feature of the spin-lattice relaxation in glassy solids should be mentioned. Usually this relax-ation does not exhibit a well-defined rate (exponential decay of the magnetization), but rather a distribution of rates is observed. This distribution is often well-approximated by an exponential in the square root of the time as shown for a series of Cux(As0 4Se0 6) j glasses in Figure 12. This particular behavior is prob-ably due to slow spin diffusion in the magnetically excited 7 5 As system coupled with the existence of an inhomogeneous distribution of relaxation centers [4],
Summary
The prototype chalcogenide glasses, As2Se3 , As2S3 , and A S 2 0 3 , provide examples to illustrate the use of 7 5 As N Q R as a probe of the local structural order and of some of the vibrational properties. In these stoi-chiometric glasses the arsenic atoms are three-fold coordinated to the two-fold coordinated chalcogen atoms, and the N Q R spectra are centered about the N Q R lines observed in corresponding layered crys-talline modifications. Although the 7 5As NQR lines are broad in the glasses, crude estimates of the distortions
C u x ( A s 0 . 4 s 0 . 6 ' l - x

610 P.C. Taylor • NQR in Amorphous Semiconductors
in the arsenic pyramidal units that are necessary to produce these broadenings yield half widths of only a few degrees. Further interpretations of the N Q R spec-tra suggest that the ring structures present in the crys-tals are at least partially preserved in the glasses.
In chalcogenide glasses for which As-As bonds oc-cur, such as glasses made with excess arsenic, rapidly evaporated films, or rapidly drawn fibers, the
5As N Q R spectra can be used to estimate the num-bers of such bonds. In glasses made under conditions that produce structures far from equilibrium, the N Q R spectra are also useful in probing the changes in these structures produced by annealing or by optical excitation. A standard photo-polymerization process that occurs in rapidly deposited As2Se3 and As 2S 3
glassy films is the optically induced break-up of As -As (and also presumbably of Se-Se or S - S ) bonds that are replaced by As-Se or A s - S bonds.
Amorphous arsenic exhibits an asymmetric 7 5As lineshape that occurs at higher frequencies than either of the related, layered crystalline modifications. This lineshape can be explained by the local bonding dis-tortions introduced by the orientational disorder between adjacent As3 pyramidal units that make up the amorphous phase. Even though these distortions are significant, the bonding remains predominantly p-type in amorphous arsenic.
In amorphous semiconductors that contain arsenic, the 5 As spin lattice relaxation is almost always due to a Raman process where at least one highly anhar-monic two-level system (disorder mode) replaces one of the phonons. In general the decays of magnetiza-tion are not exponential in time but rather exponen-tial in the square-root of the time. This unusual behav-ior is attributed to the existence of an inhomogeneous distribution of relaxation centers possessing different relaxation rates. In cases where the 7 5As nuclear spin diffusion is not rapid enough, such a distribution can produce the observed square-root-of-time behavior.
A cknowledgemen ts
As a causal scan of the references below will sub-stantiate, the author is deeply indebted to many col-leagues whose contributions to the work described in this review have been critical. Among those listed, M. Rubinstein, D.J. Treacy, and U. Strom were pri-marily responsible for the early work on the chalco-genide glasses, G. E. Jellison and G. L. Petersen for the work on amorphous arsenic, and P. Hari, Z. M Saleh, and G. A. Williams for the more recent work on metal chalcogenide glasses and fibers. The continuing sup-port of the National Science Foundation and the Of-fice of Naval Research is gratefully acknowledged.
[1] See, for example, T. P. Das and E. L. Hahn, Nuclear Quadrupole Resonance Spectroscopy, Solid State Physics, Suppl. 1, Academic, New York 1958.
[2] M. Rubinstein and P. C. Taylor, Phys. Rev. B9, 4258 (1974).
[3] P. Hari, P. C. Taylor, K. A. Cerqua-Richardson, and W. C. LaCourse, Phys. Rev. B51, 2347 (1995).
[4] Z. M. Saleh, G. A. Williams, and P. C. Taylor, Phys. Rev. B40, 10557 (1989).
[5] P. C. Taylor, U. Strom, W. M. Pontuschka, and D. J. Treacy, J. Phys. Soc. Japan 49, 1155 (1980).
[6] D. J. Treacy and P. C. Taylor, Solid State Commun. 40, 135 (1981).
[7] P. C. Taylor, in Physics of Disordered Materials, D. Adler, H. Fritzsche, and S. R. Ovshinsky, eds., Plenum, New York 1985, p. 517.
[8] D. J. Treacy, S. G. Greenbaum, U. Strom, and P. C. Taylor, J. Non-Cryst. Solids 59&60, 847 (1983).
[9] J. C. Philips, C. A. Beevers, and S. E. B. Gould, Phys. Rev. B12, 5274 (1980).
[10] P. Hari, P. C. Taylor, K. A. Cerqua-Richardson, and W. C. LaCourse, Phys. Rev. B51, 2347 (1995).
[11] D. J. Treacy, U. Strom, P. B. Klein, P. C. Taylor, and T. P. Martin, J. Non-Cryst. Solids 35&36, 1035 (1980).
[12] D. J. Treacy, P. C. Taylor, and P. B. Klein, Solid state Commun. 32, 423 (1979).
[13] W. C. LaCourse, C. T. Ho, K. Cerqua-Richardson, R. K. MacCrone. P. Hari, and P. C. Taylor, Glastech. Ber. Glass Sei. Technol. 68 C2 , 4 (1995).
[14] G. E. Jellison Jr., G. L. Petersen, and P. C. Taylor, Phys. Rev. B22, 3903 (1980).
[15] G. L. Petersen, G. E. Jellison Jr., and P. C. Taylor, J. Molec. Structure 58, 263 (1980).
[16] P. C. Taylor, J. Non-Cryst. Solids 59&60, 109 (1983).
Top Related