


Languages
Pages
Legal

With rental rates decreasing in neighbouring Dubai, rents in Sharjah and Ajman also came under pressure. In addition, despite the recently implemented ownership regulations, the sales market in Sharjah witnessed low levels of activity, due in part, to the substantial launch of competing affordable product in Dubai.
Northern EmiratesQ2 2015 Report
Property Review
Northern EmiratesApartment rental rates were 4% higher than in Q2 2014.+4
% A
PART
MEN
T AN
NU
ALRE
NTA
L G
ROW
TH
Q2 2015 REPORT
2 © Asteco Property Management, 2015
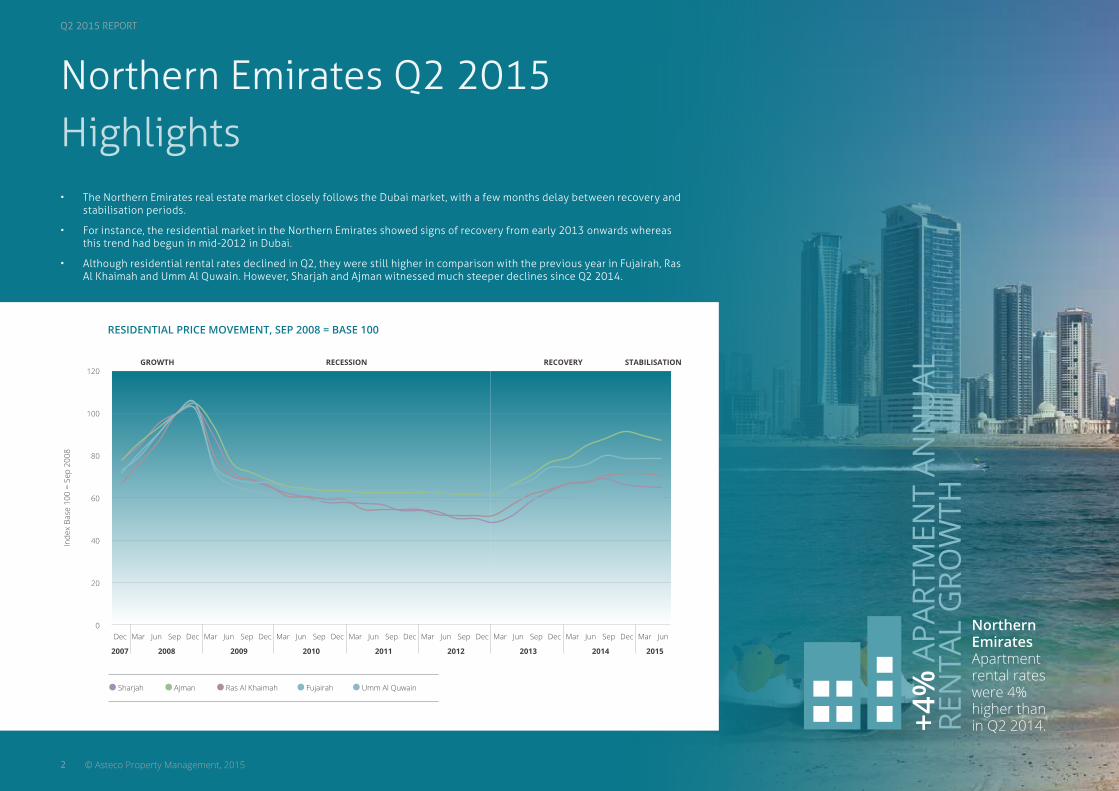
Northern Emirates Q2 2015 Highlights• The Northern Emirates real estate market closely follows the Dubai market, with a few months delay between recovery and
stabilisation periods.
• For instance, the residential market in the Northern Emirates showed signs of recovery from early 2013 onwards whereas this trend had begun in mid-2012 in Dubai.
• Although residential rental rates declined in Q2, they were still higher in comparison with the previous year in Fujairah, Ras Al Khaimah and Umm Al Quwain. However, Sharjah and Ajman witnessed much steeper declines since Q2 2014.
Inde
x Ba
se 1
00 =
Sep
200
8
RESIDENTIAL PRICE MOVEMENT, SEP 2008 = BASE 100
120
100
80
60
40
20
0Dec Mar Mar Mar Mar Mar Mar Mar MarJun Jun Jun Jun Jun Jun Jun JunSep Sep Sep Sep Sep Sep SepDec Dec Dec Dec Dec Dec Dec
20092007
GROWTH RECOVERY STABILISATIONRECESSION
2008 2010 2011 2012 2013 2014 2015
Sharjah Ajman Ras Al Khaimah Fujairah Umm Al Quwain

Q2 2015 REPORT
3© Asteco Property Management, 2015
Northern Emirates
Arabian Gulf
311
11
11
11
5
1
10
8
9
3
2
6
4
7
Northern Emirates Area Map
ABU DHABI
DUBAI
SHARJAH FUJAIRAH
RAS AL KHAIMAHUMM AL QUWAIN
AJMAN
SHARJAH
1 Abu Shagara2 Al Khan3 Al Majaz4 Al Nahda5 Al Qasimiyah6 Al Taawun7 Al Wahda8 Corniche / Buhaira9 Khaledia10 King Faisal & King Abdul Aziz Streets
Mina Al Arab
Marjan Island
1
2
Al Hamra
3
RAS AL KHAIMAH
1 Mina Al Arab2 Marjan Island3 Al Hamra
UNITED ARAB EMIRATES
Q2 2015 REPORT
4 © Asteco Property Management, 2015
Northern Emirates Rental Rates Q2 2015
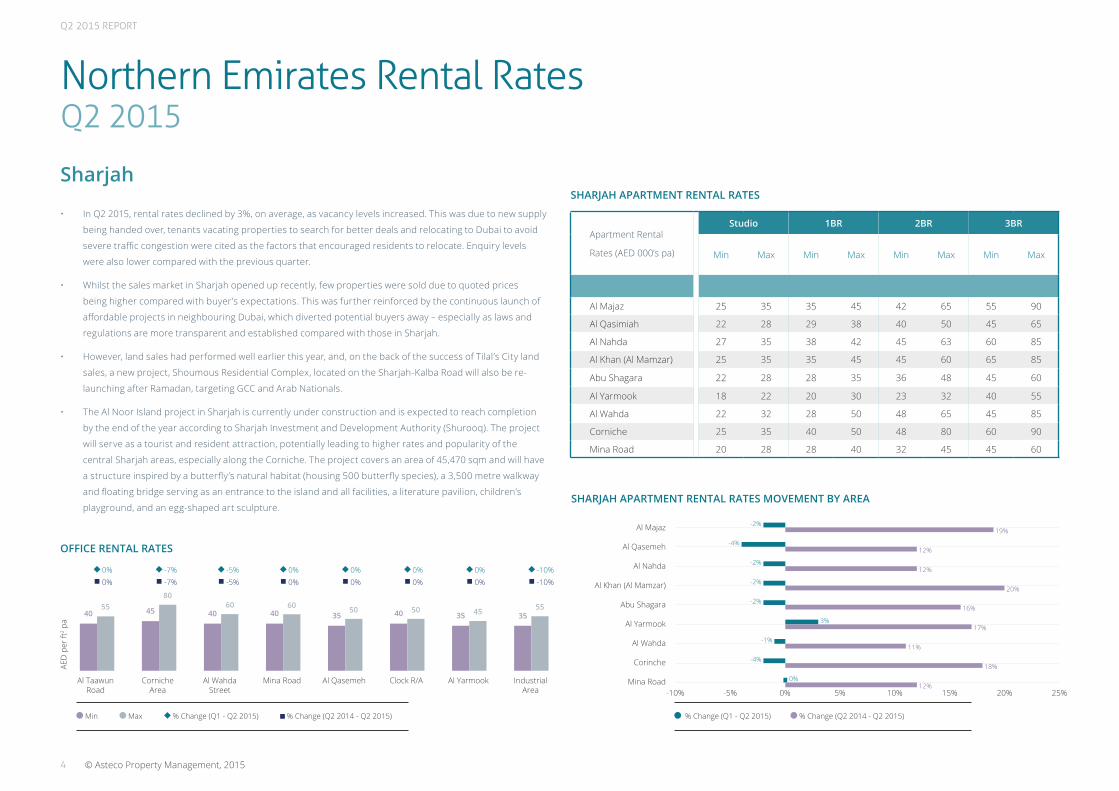
Sharjah
Apartment Rental
Rates (AED 000’s pa)
Studio 1BR 2BR 3BR
Min Max Min Max Min Max Min Max
Al Majaz 25 35 35 45 42 65 55 90
Al Qasimiah 22 28 29 38 40 50 45 65
Al Nahda 27 35 38 42 45 63 60 85
Al Khan (Al Mamzar) 25 35 35 45 45 60 65 85
Abu Shagara 22 28 28 35 36 48 45 60
Al Yarmook 18 22 20 30 23 32 40 55
Al Wahda 22 32 28 50 48 65 45 85
Corniche 25 35 40 50 48 80 60 90
Mina Road 20 28 28 40 32 45 45 60
OFFICE RENTAL RATES
SHARJAH APARTMENT RENTAL RATES
Min Max % Change (Q1 - Q2 2015) % Change (Q2 2014 - Q2 2015)
AED
per
ft2 p
a
Al TaawunRoad
CornicheArea
Al WahdaStreet
Mina Road Al Qasemeh Al YarmookClock R/A IndustrialArea
3545 40 40 35 40 3540554550506060
8055
• In Q2 2015, rental rates declined by 3%, on average, as vacancy levels increased. This was due to new supply
being handed over, tenants vacating properties to search for better deals and relocating to Dubai to avoid
severe traffic congestion were cited as the factors that encouraged residents to relocate. Enquiry levels
were also lower compared with the previous quarter.
• Whilst the sales market in Sharjah opened up recently, few properties were sold due to quoted prices
being higher compared with buyer’s expectations. This was further reinforced by the continuous launch of
affordable projects in neighbouring Dubai, which diverted potential buyers away – especially as laws and
regulations are more transparent and established compared with those in Sharjah.
• However, land sales had performed well earlier this year, and, on the back of the success of Tilal’s City land
sales, a new project, Shoumous Residential Complex, located on the Sharjah-Kalba Road will also be re-
launching after Ramadan, targeting GCC and Arab Nationals.
• The Al Noor Island project in Sharjah is currently under construction and is expected to reach completion
by the end of the year according to Sharjah Investment and Development Authority (Shurooq). The project
will serve as a tourist and resident attraction, potentially leading to higher rates and popularity of the
central Sharjah areas, especially along the Corniche. The project covers an area of 45,470 sqm and will have
a structure inspired by a butterfly’s natural habitat (housing 500 butterfly species), a 3,500 metre walkway
and floating bridge serving as an entrance to the island and all facilities, a literature pavilion, children’s
playground, and an egg-shaped art sculpture.SHARJAH APARTMENT RENTAL RATES MOVEMENT BY AREA
% Change (Q1 - Q2 2015) % Change (Q2 2014 - Q2 2015)
Al Majaz
Al Qasemeh
Al Nahda
Al Khan (Al Mamzar)
Abu Shagara
Al Yarmook
Al Wahda
Corinche
Mina Road-10% -5% 0% 5% 10% 15% 20% 25%
19%
12%
12%
20%
16%
11%
17%
18%
12%
-2%
-4%
-2%
-2%
-2%
-1%
3%
-4%
0%
0%0%
-7%-7%
-5%-5%
0%0%
0%0%
0%0%
0%0%
-10%-10%
Q2 2015 REPORT
5© Asteco Property Management, 2015
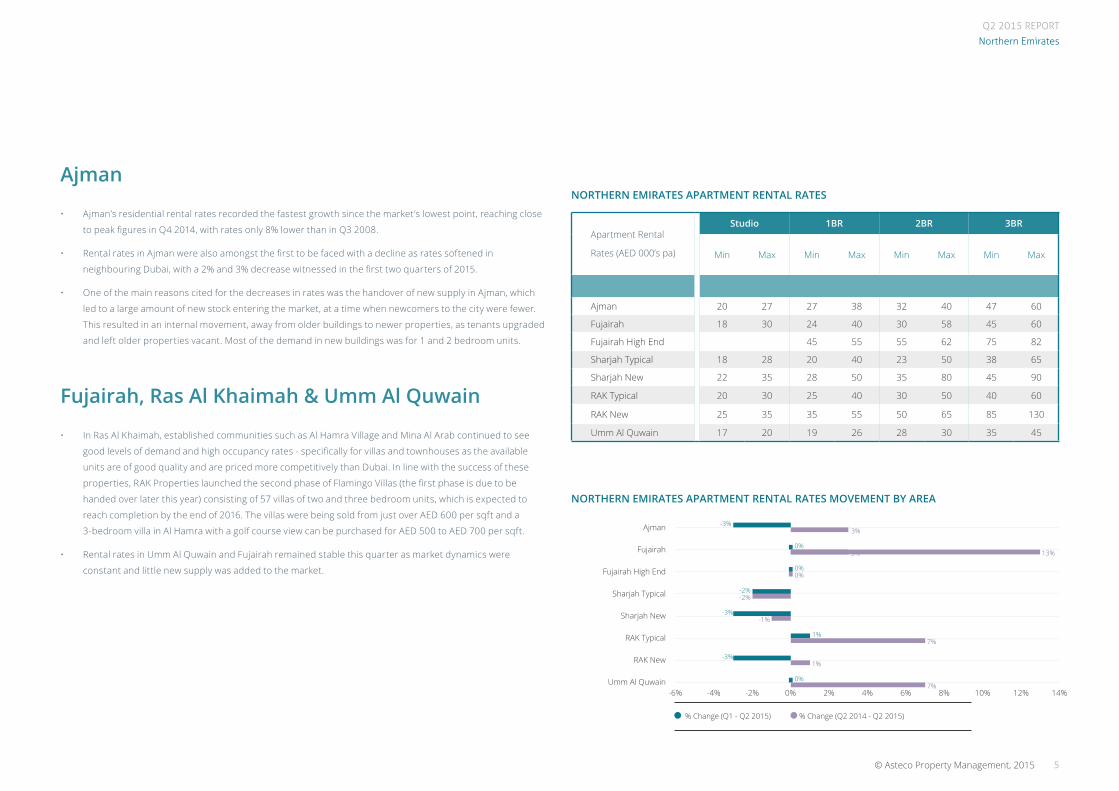
Northern Emirates
Apartment Rental
Rates (AED 000’s pa)
Studio 1BR 2BR 3BR
Min Max Min Max Min Max Min Max
Ajman 20 27 27 38 32 40 47 60
Fujairah 18 30 24 40 30 58 45 60
Fujairah High End 45 55 55 62 75 82
Sharjah Typical 18 28 20 40 23 50 38 65
Sharjah New 22 35 28 50 35 80 45 90
RAK Typical 20 30 25 40 30 50 40 60
RAK New 25 35 35 55 50 65 85 130
Umm Al Quwain 17 20 19 26 28 30 35 45
NORTHERN EMIRATES APARTMENT RENTAL RATES
• Ajman’s residential rental rates recorded the fastest growth since the market’s lowest point, reaching close
to peak figures in Q4 2014, with rates only 8% lower than in Q3 2008.
• Rental rates in Ajman were also amongst the first to be faced with a decline as rates softened in
neighbouring Dubai, with a 2% and 3% decrease witnessed in the first two quarters of 2015.
• One of the main reasons cited for the decreases in rates was the handover of new supply in Ajman, which
led to a large amount of new stock entering the market, at a time when newcomers to the city were fewer.
This resulted in an internal movement, away from older buildings to newer properties, as tenants upgraded
and left older properties vacant. Most of the demand in new buildings was for 1 and 2 bedroom units.
• In Ras Al Khaimah, established communities such as Al Hamra Village and Mina Al Arab continued to see
good levels of demand and high occupancy rates - specifically for villas and townhouses as the available
units are of good quality and are priced more competitively than Dubai. In line with the success of these
properties, RAK Properties launched the second phase of Flamingo Villas (the first phase is due to be
handed over later this year) consisting of 57 villas of two and three bedroom units, which is expected to
reach completion by the end of 2016. The villas were being sold from just over AED 600 per sqft and a
3-bedroom villa in Al Hamra with a golf course view can be purchased for AED 500 to AED 700 per sqft.
• Rental rates in Umm Al Quwain and Fujairah remained stable this quarter as market dynamics were
constant and little new supply was added to the market.
Ajman
Fujairah, Ras Al Khaimah & Umm Al Quwain
NORTHERN EMIRATES APARTMENT RENTAL RATES MOVEMENT BY AREA
% Change (Q1 - Q2 2015) % Change (Q2 2014 - Q2 2015)
Ajman
Fujairah
Fujairah High End
Sharjah Typical
Sharjah New
RAK Typical
RAK New
Umm Al Quwain-6% -4% -2% 0% 2% 4% 6% 8% 10% 12% 14%
3%
3%
0%
7%
7%
-2%
-1%
1%
13%
-3%
0%
0%
0%
1%
-2%
-3%
-3%
Q2 2015 REPORT
6 © Asteco Property Management, 2015
UAE ComparisonQ2 2015RESIDENTIAL RENTAL RATES
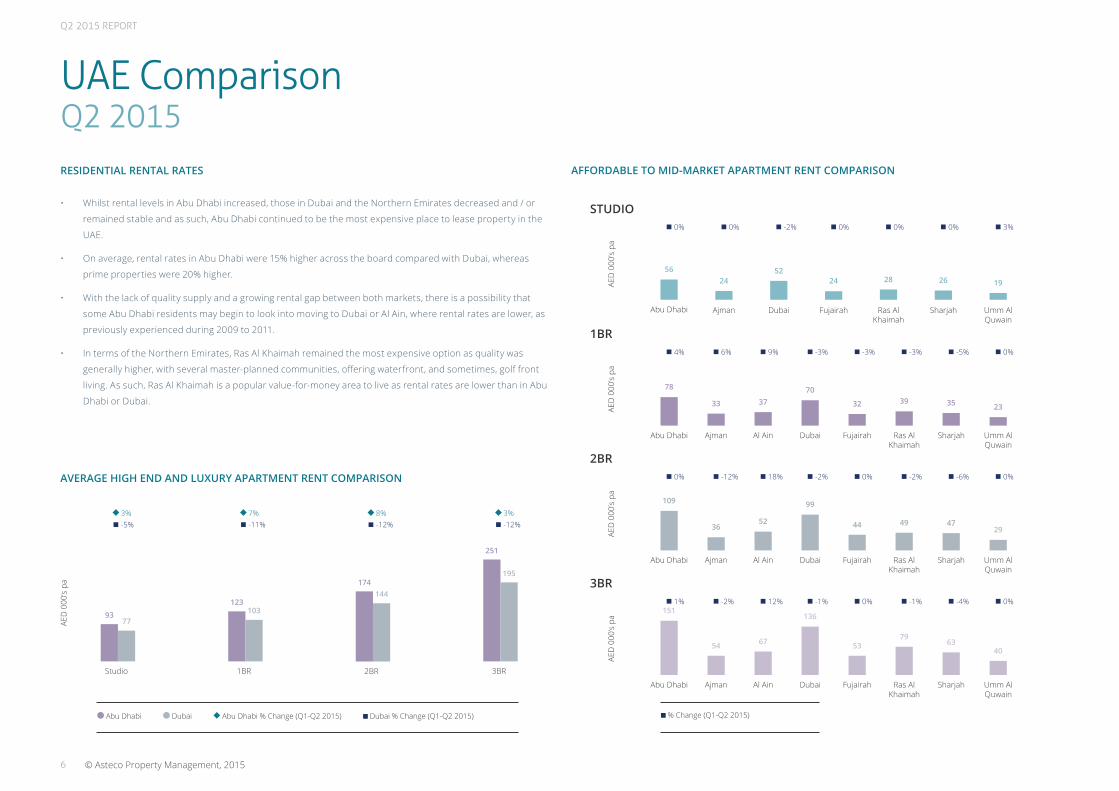
• Whilst rental levels in Abu Dhabi increased, those in Dubai and the Northern Emirates decreased and / or
remained stable and as such, Abu Dhabi continued to be the most expensive place to lease property in the
UAE.
• On average, rental rates in Abu Dhabi were 15% higher across the board compared with Dubai, whereas
prime properties were 20% higher.
• With the lack of quality supply and a growing rental gap between both markets, there is a possibility that
some Abu Dhabi residents may begin to look into moving to Dubai or Al Ain, where rental rates are lower, as
previously experienced during 2009 to 2011.
• In terms of the Northern Emirates, Ras Al Khaimah remained the most expensive option as quality was
generally higher, with several master-planned communities, offering waterfront, and sometimes, golf front
living. As such, Ras Al Khaimah is a popular value-for-money area to live as rental rates are lower than in Abu
Dhabi or Dubai.
AFFORDABLE TO MID-MARKET APARTMENT RENT COMPARISON
AED
000
’s pa
AED
000
’s pa
AED
000
’s pa
Abu Dhabi
78
Abu Dhabi
109
Abu Dhabi
151
Ajman
33
Ajman
36
Ajman
54
Al Ain
37
Al Ain
52
Al Ain
67
Dubai
70
Dubai
99
Dubai
136
Fujairah
32
Fujairah
44
Fujairah
53
Ras AlKhaimah
39
Ras AlKhaimah
49
Ras AlKhaimah
79
Sharjah
35
Sharjah
47
Sharjah
63
Umm AlQuwain
23
Umm AlQuwain
29
Umm AlQuwain
40
1BR
2BR
3BR
AED
000
’s pa
Abu Dhabi
56
Ajman
24
Dubai
52
Fujairah
24
Ras AlKhaimah
28
Sharjah
26
Umm AlQuwain
19
0% 0% -2% 0% 0% 0% 3%
STUDIO
% Change (Q1-Q2 2015) Abu Dhabi Dubai Abu Dhabi % Change (Q1-Q2 2015) Dubai % Change (Q1-Q2 2015)
AED
000
’s pa
Studio
3%-5%
1BR
7%-11%
2BR
8%-12%
3BR
251
174
123
93
195
144
10377
3%-12%
AVERAGE HIGH END AND LUXURY APARTMENT RENT COMPARISON
4% 6% 9% -3% -3% -5%-3% 0%
0% -12% 18% -2% 0% -6%-2% 0%
1% -2% 12% -1% 0% -4%-1% 0%
Q2 2015 REPORT
7© Asteco Property Management, 2015
UAE Comparison
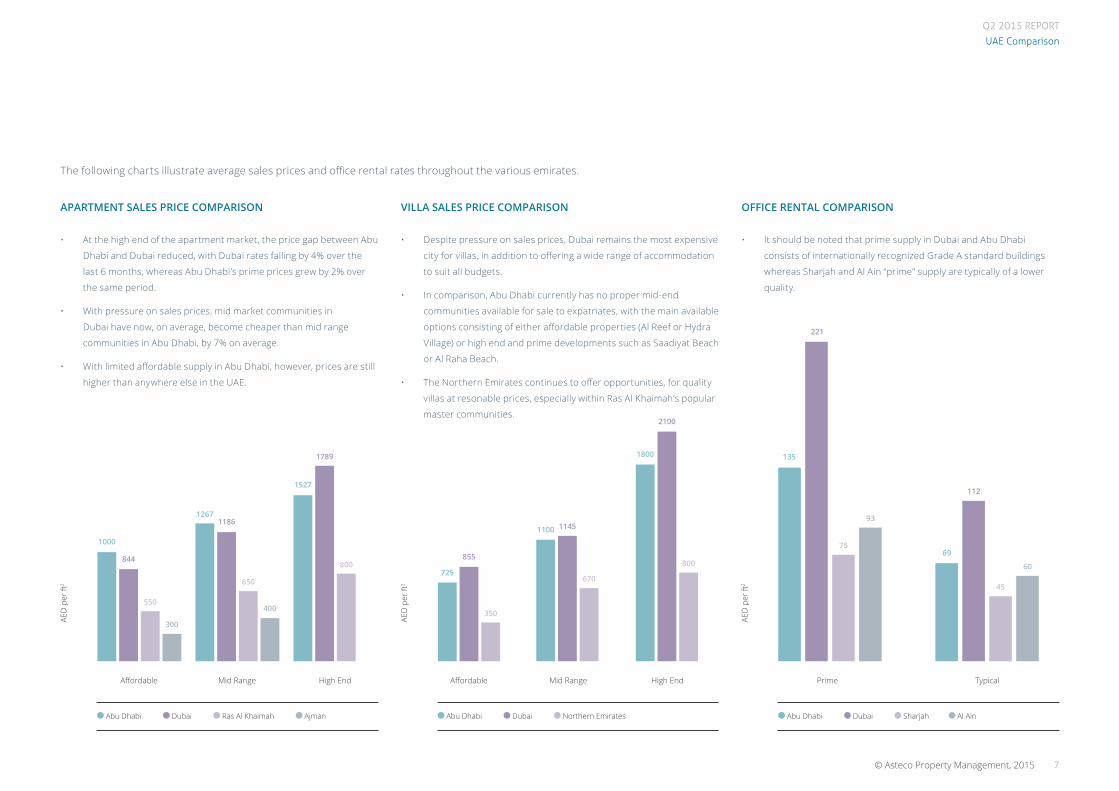
The following charts illustrate average sales prices and office rental rates throughout the various emirates.
Abu Dhabi Dubai Ras Al Khaimah Ajman Abu Dhabi Dubai Northern Emirates Abu Dhabi Dubai Sharjah Al Ain
AED
per
ft2
AED
per
ft2
AED
per
ft2
Affordable Affordable PrimeMid Range Mid RangeHigh End High End Typical
APARTMENT SALES PRICE COMPARISON
• At the high end of the apartment market, the price gap between Abu
Dhabi and Dubai reduced, with Dubai rates falling by 4% over the
last 6 months, whereas Abu Dhabi’s prime prices grew by 2% over
the same period.
• With pressure on sales prices, mid market communities in
Dubai have now, on average, become cheaper than mid range
communities in Abu Dhabi, by 7% on average.
• With limited affordable supply in Abu Dhabi, however, prices are still
higher than anywhere else in the UAE.
VILLA SALES PRICE COMPARISON
• Despite pressure on sales prices, Dubai remains the most expensive
city for villas, in addition to offering a wide range of accommodation
to suit all budgets.
• In comparison, Abu Dhabi currently has no proper mid-end
communities available for sale to expatriates, with the main available
options consisting of either affordable properties (Al Reef or Hydra
Village) or high end and prime developments such as Saadiyat Beach
or Al Raha Beach.
• The Northern Emirates continues to offer opportunities, for quality
villas at resonable prices, especially within Ras Al Khaimah’s popular
master communities.
OFFICE RENTAL COMPARISON
• It should be noted that prime supply in Dubai and Abu Dhabi
consists of internationally recognized Grade A standard buildings
whereas Sharjah and Al Ain “prime” supply are typically of a lower
quality.
844
1186
1789
1000
1267
1527
550
650
800
300
400
855
725
350
11451100
670
2100
1800
800
221
112
135
6975
45
93
60
Q2 2015 REPORT
8 © Asteco Property Management, 2015
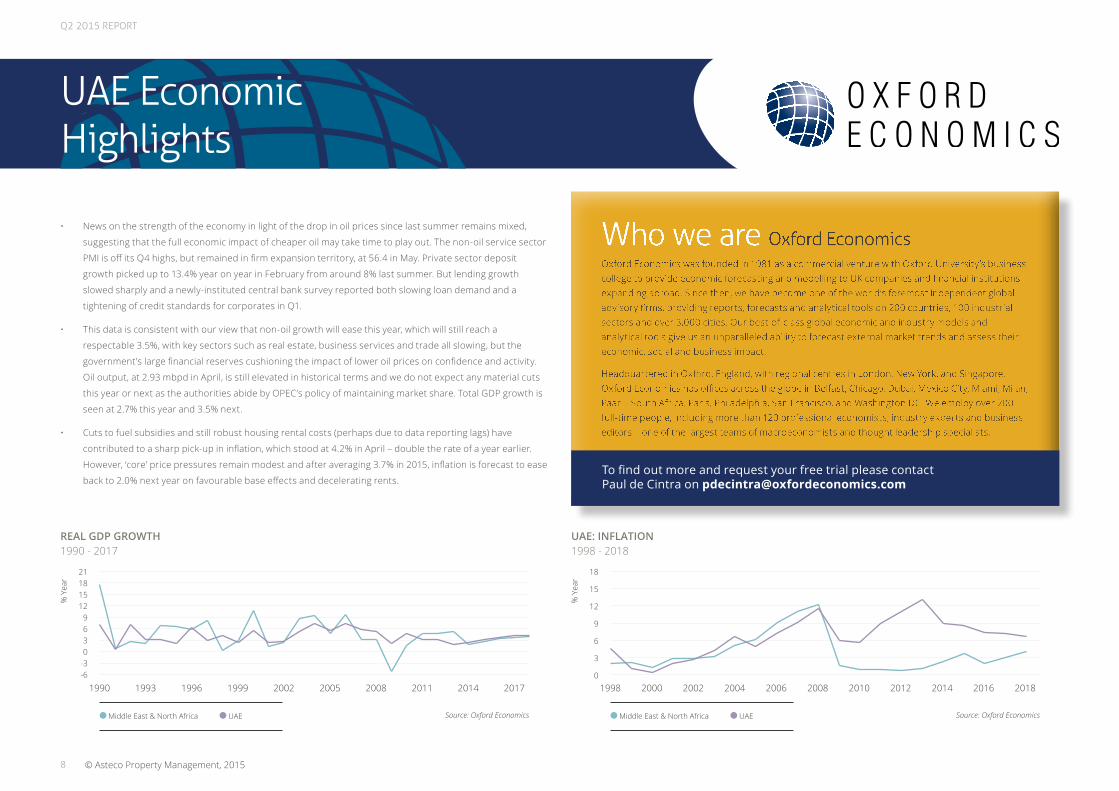
• News on the strength of the economy in light of the drop in oil prices since last summer remains mixed,
suggesting that the full economic impact of cheaper oil may take time to play out. The non-oil service sector
PMI is off its Q4 highs, but remained in firm expansion territory, at 56.4 in May. Private sector deposit
growth picked up to 13.4% year on year in February from around 8% last summer. But lending growth
slowed sharply and a newly-instituted central bank survey reported both slowing loan demand and a
tightening of credit standards for corporates in Q1.
• This data is consistent with our view that non-oil growth will ease this year, which will still reach a
respectable 3.5%, with key sectors such as real estate, business services and trade all slowing, but the
government’s large financial reserves cushioning the impact of lower oil prices on confidence and activity.
Oil output, at 2.93 mbpd in April, is still elevated in historical terms and we do not expect any material cuts
this year or next as the authorities abide by OPEC’s policy of maintaining market share. Total GDP growth is
seen at 2.7% this year and 3.5% next.
• Cuts to fuel subsidies and still robust housing rental costs (perhaps due to data reporting lags) have
contributed to a sharp pick-up in inflation, which stood at 4.2% in April – double the rate of a year earlier.
However, ‘core’ price pressures remain modest and after averaging 3.7% in 2015, inflation is forecast to ease
back to 2.0% next year on favourable base effects and decelerating rents.
Who we are Oxford Economics Oxford Economics was founded in 1981 as a commercial venture with Oxford University’s business college to provide economic forecasting and modelling to UK companies and financial institutions expanding abroad. Since then, we have become one of the world’s foremost independent global advisory firms, providing reports, forecasts and analytical tools on 200 countries, 100 industrial sectors and over 3,000 cities. Our best-of-class global economic and industry models and analytical tools give us an unparalleled ability to forecast external market trends and assess their economic, social and business impact.
Headquartered in Oxford, England, with regional centres in London, New York, and Singapore, Oxford Economics has offices across the globe in Belfast, Chicago, Dubai, Mexico City, Miami, Milan, Paarl - South Africa, Paris, Philadelphia, San Francisco, and Washington DC. We employ over 200 full-time people, including more than 120 professional economists, industry experts and business editors—one of the largest teams of macroeconomists and thought leadership specialists.
Middle East & North Africa UAE Middle East & North Africa UAE Source: Oxford Economics Source: Oxford Economics
% Y
ear
% Y
ear
REAL GDP GROWTH 1990 - 2017
UAE: INFLATION 1998 - 2018
1990 1993 1996 1999 2002 2005 2008 2011 2014 2017 1998 2000 2002 2004 2006 2008 2010 2012 2014 2016 2018
21181512
9630
-3-6
18
15
12
9
6
3
0
UAE EconomicHighlights
To find out more and request your free trial please contact Paul de Cintra on [email protected]
Q2 2015 REPORT
9© Asteco Property Management, 2015
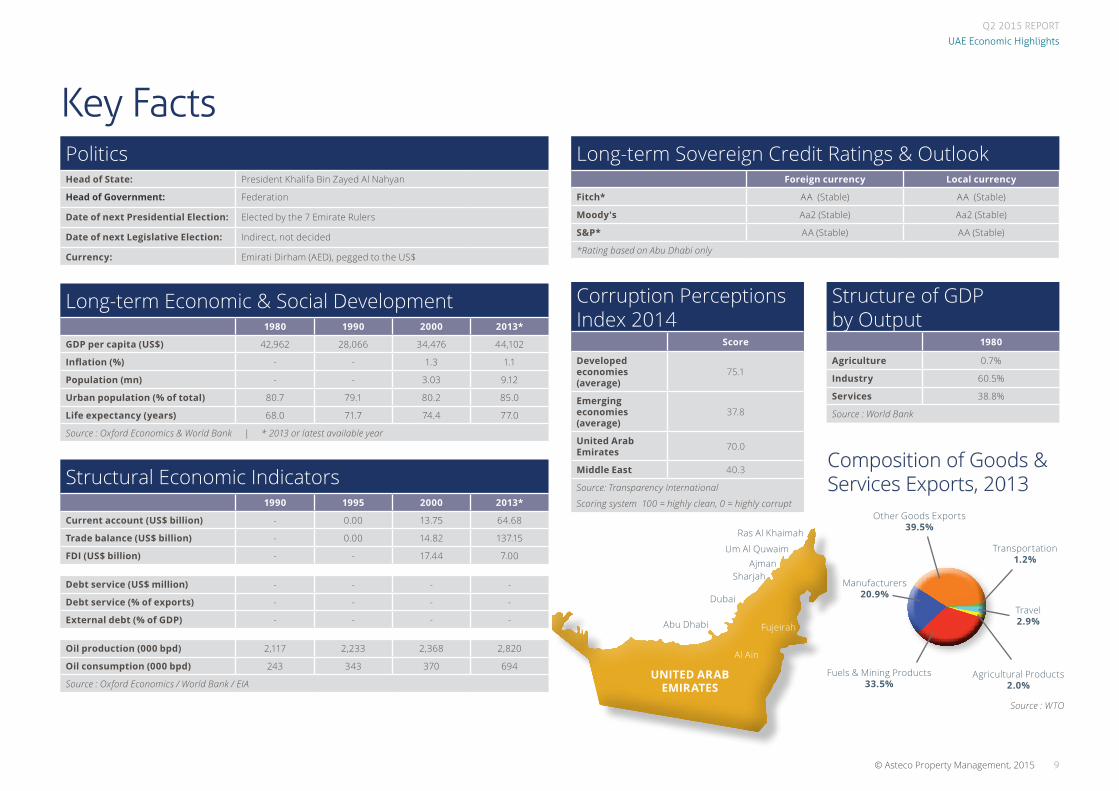
Key FactsLong-term Sovereign Credit Ratings & Outlook
Foreign currency Local currency
Fitch* AA (Stable) AA (Stable)
Moody's Aa2 (Stable) Aa2 (Stable)
S&P* AA (Stable) AA (Stable)
*Rating based on Abu Dhabi only
Corruption Perceptions Index 2014
Score
Developed economies (average)
75.1
Emerging economies (average)
37.8
United Arab Emirates 70.0
Middle East 40.3
Source: Transparency International
Scoring system 100 = highly clean, 0 = highly corrupt
PoliticsHead of State: President Khalifa Bin Zayed Al Nahyan
Head of Government: Federation
Date of next Presidential Election: Elected by the 7 Emirate Rulers
Date of next Legislative Election: Indirect, not decided
Currency: Emirati Dirham (AED), pegged to the US$
Long-term Economic & Social Development1980 1990 2000 2013*
GDP per capita (US$) 42,962 28,066 34,476 44,102
Inflation (%) - - 1.3 1.1
Population (mn) - - 3.03 9.12
Urban population (% of total) 80.7 79.1 80.2 85.0
Life expectancy (years) 68.0 71.7 74.4 77.0
Source : Oxford Economics & World Bank | * 2013 or latest available year
Structural Economic Indicators1990 1995 2000 2013*
Current account (US$ billion) - 0.00 13.75 64.68
Trade balance (US$ billion) - 0.00 14.82 137.15
FDI (US$ billion) - - 17.44 7.00
Debt service (US$ million) - - - -
Debt service (% of exports) - - - -
External debt (% of GDP) - - - -
Oil production (000 bpd) 2,117 2,233 2,368 2,820
Oil consumption (000 bpd) 243 343 370 694
Source : Oxford Economics / World Bank / EIA
Structure of GDP by Output
1980
Agriculture 0.7%
Industry 60.5%
Services 38.8%
Source : World Bank
Other Goods Exports 39.5%
Transportation 1.2%
Agricultural Products 2.0%
Travel 2.9%
Manufacturers 20.9%
Fuels & Mining Products 33.5%
Ras Al Khaimah
Um Al QuwaimAjman
Sharjah
Dubai
UNITED ARABEMIRATES
Al Ain
FujeirahAbu Dhabi
Composition of Goods & Services Exports, 2013
Source : WTO
UAE Economic Highlights
Q2 2015 REPORT
10 © Asteco Property Management, 2015
VALUATION & ADVISORYOur professional advisory services are conducted by suitably qualified personnel all of whom have had extensive real estate experience within the Middle East and internationally.
Our valuations are carried out in accordance with the Royal Institution of Chartered Surveyors (RICS) and International Valuation Standards (IVS) and are undertaken by appropriately qualified valuers with extensive local experience.
The Professional Services Asteco conducts throughout the region include:
• Consultancy and Advisory Services• Market Research• Valuation Services
SALESAsteco has established a large regional property sales division with representatives based in the UAE, Qatar and Jordan. Our sales teams have extensive experience in the negotiation and sale of a variety of assets.
LEASINGAsteco has been instrumental in the leasing of many high-profile developments across the GCC.
ASSET MANAGEMENTAsteco provides comprehensive asset management services to all property owners, whether a single unit (IPM) or a regional mixed use portfolio. Our focus is on maximising value for our Clients.
OWNERS ASSOCIATIONAsteco has the experience, systems, procedures and manuals in place to provide streamlined comprehensive Association Management and Consultancy Services to residential, commercial and mixed use communities throughout the GCC Region.
SALES MANAGEMENTOur Sales Management services are comprehensive and encompass everything required for the successful completion and handover of units to individual unit owners.
LICENSINGOur brand, network, system and procedures are now available in territories across the MENA region. Our Licensing services currently include Real Estate Brokerage Franchising and associated support services with many of the key elements designed specifically around the franchisee, making it a truly unique and bespoke franchise opportunity.
The Middle East’s largest full service real estate consultancy company, Asteco was formed in Dubai in 1985. Over the years, Asteco has gained enormous respect for consistently delivering high quality, professional, value-added services in a transparent manner. It is also widely recognised for its involvement with many of the projects that have defined the landscape and physical infrastructure of the Emirates.
Asteco has an essential combination of local knowledge and international expertise. A deeply established brand, renowned for its application of the latest technological advances, its commitment to transparency, winning strategies and human expertise. Undisputed real estate experts, Asteco represents a significant number of the region’s top property owners, developers and investors.
Q2 2015 REPORT
11© Asteco Property Management, 2015
John Stevens, BSc MRICSManaging Director/Director, Asset Services+971 600 54 [email protected]
John Allen, BSc MRICSDirector, Valuation & Advisory+971 600 54 [email protected]
Julia Knibbs, MScResearch & Consultancy Manager, UAE+971 600 54 [email protected]
Zahra Alvi, MScResearch Analyst+971 600 54 [email protected]
Q2 2015 REPORT
Xxx
© Asteco Property Management, 2015
Q2 2015 Report
UAE Property Review
DISCLAIMER: The information contained in this report has been obtained from and is based upon sources that Asteco Property Management believes to be reliable, however, no warranty or representation, expressed or implied, is made to the accuracy or completeness of the information contained herein, and same is submitted subject to errors, omissions, change of price, rental or other conditions, withdrawal without notice, and to any special listing conditions imposed by our principals. Asteco Property Management will not be held responsible for any third-party contributions. All opinions and estimates included in this report constitute Asteco Property Management’s judgment, as of the date of this report and are subject to change without notice. Figures contained in this report are derived from a basket of locations highlighted in this report and therefore represent a snapshot of the Dubai market. Due care and attention has been used in the preparation of forecast information. However, actual results may vary from forecasts and any variation may be materially positive or negative. Forecasts, by their very nature, involve risk and uncertainty because they relate to future events and circumstances which are beyond Asteco Property Management’s control. For a full in-depth study of the market, please contact Asteco Property Management’s research team. Asteco Property Management LLC. Commercial Licence No. 218551. Paid-up Capital AED4,000,000.
Top Related