


Languages
Pages
Legal

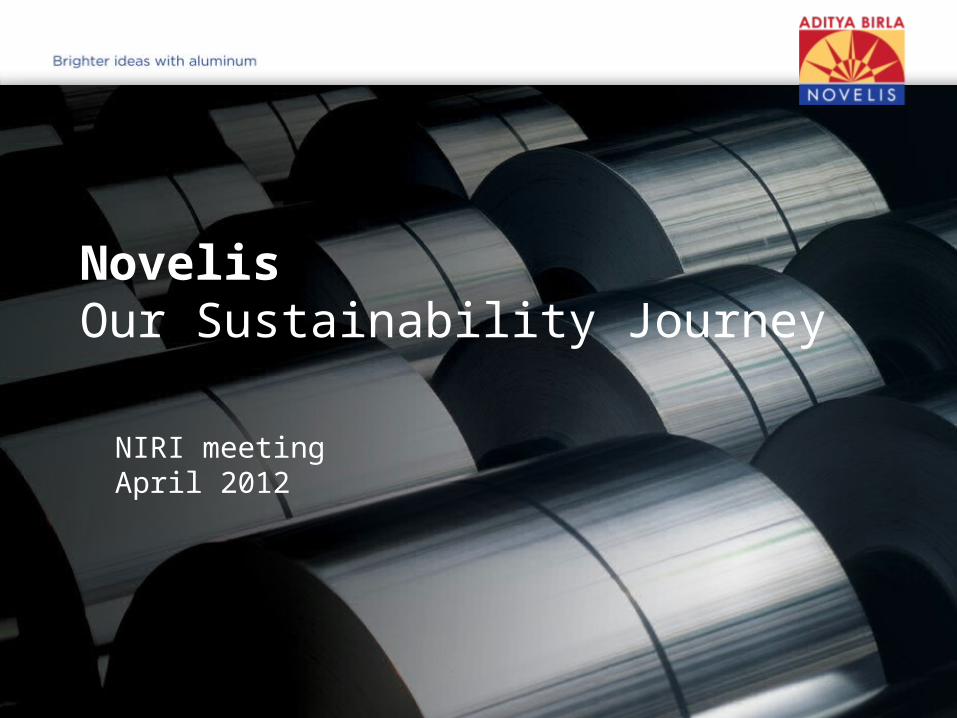
NIRI meeting April 2012
NovelisOur Sustainability Journey
2
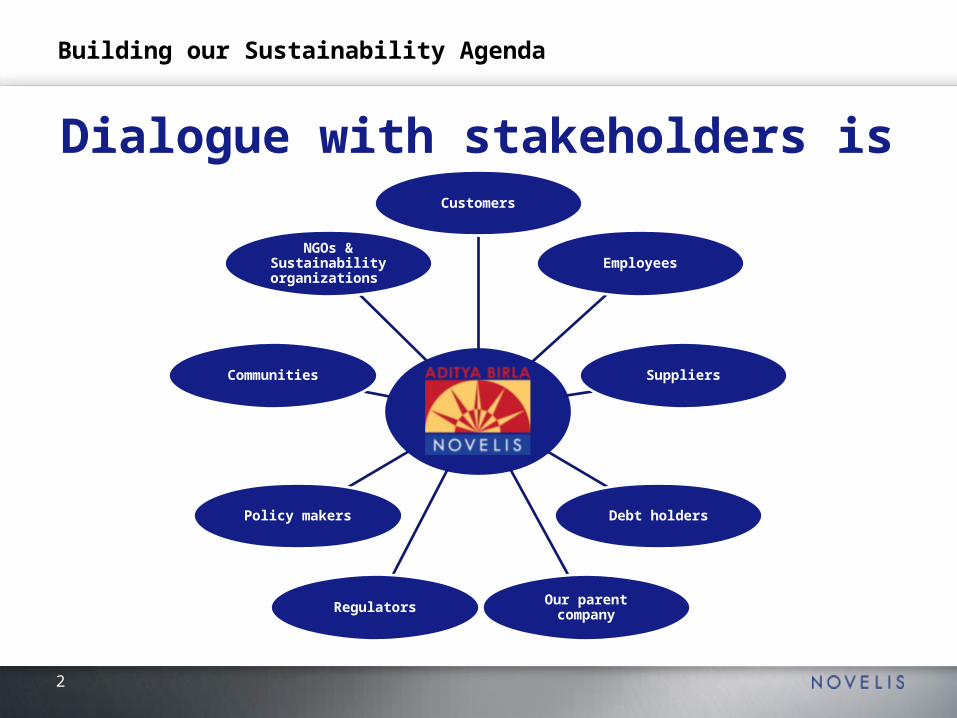
Building our Sustainability Agenda
Dialogue with stakeholders is keyCustomers
Employees
Suppliers
Debt holders
Our parent companyRegulators
Policy makers
Communities
NGOs & Sustainability organizations
3
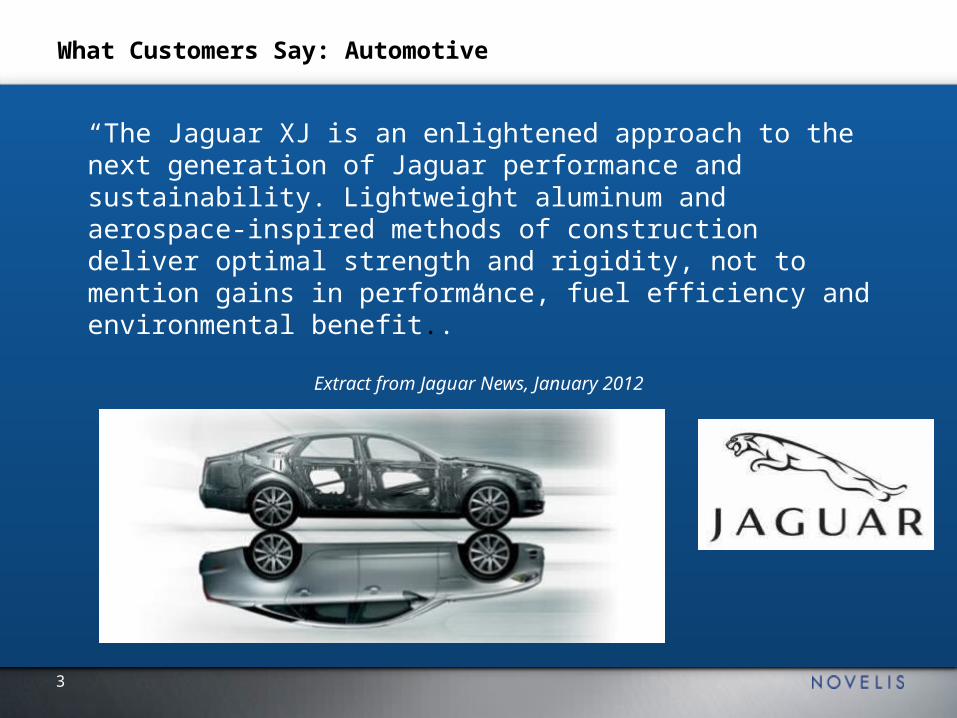
What Customers Say: Automotive
“The Jaguar XJ is an enlightened approach to the next generation of Jaguar performance and sustainability. Lightweight aluminum and aerospace-inspired methods of construction deliver optimal strength and rigidity, not to mention gains in performance, fuel efficiency and environmental benefit..”
Extract from Jaguar News, January 2012
4
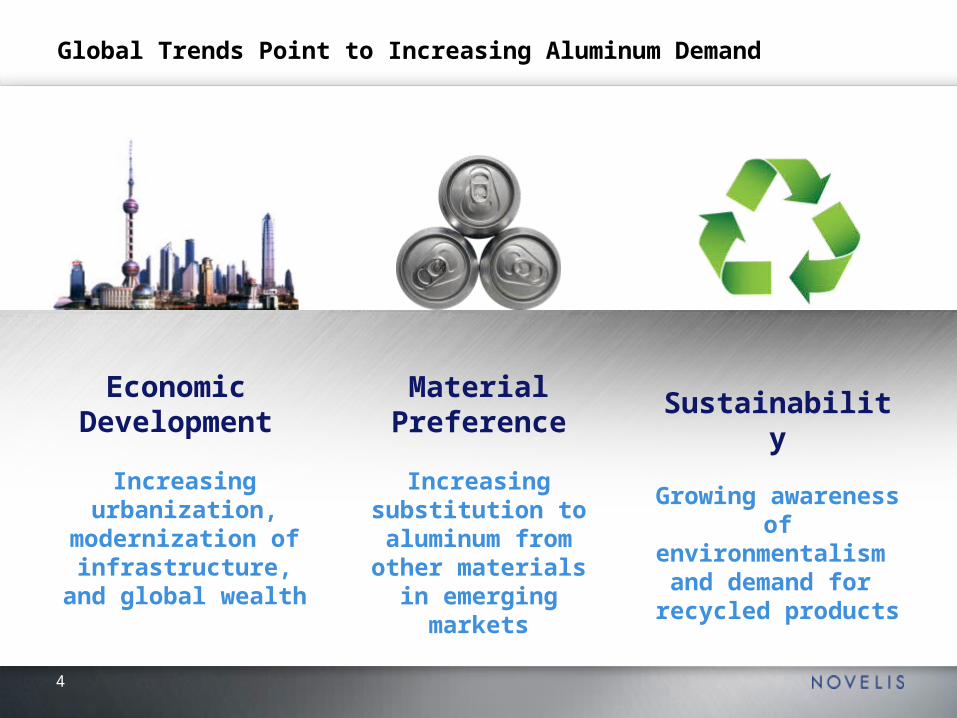
Global Trends Point to Increasing Aluminum Demand
Economic Development
Increasing urbanization,
modernization of infrastructure, and
global wealth
Material Preference
Increasingsubstitution to aluminum from
other materials in emerging markets
Sustainability
Growing awareness of environmentalism and demand for
recycled products

5
Tho
usan
ds o
f to
nnes
1950 1960 1965 1975 1985 1995 2000 2005 2010 20150
5,000
10,000
15,000
20,000
25,000
Source: Novelis Fact Base; CRU
Global demand for rolled aluminium is growing
4% or 700 thousand extra tonnes per year until 2015

6
Who is World-Class in Sustainability?

7
Main Related Issues for Novelis
Carbon footprint of our industry• Process and Product
Primary resource availability• Energy, metal, other raw materials and water
Developing Sustainability partnerships along the supply chain• Raw material to recycling
Regulatory & external stakeholders perception of aluminium

8
Economy Environment Social
Grow our long term profitability whilst we balance economic, environment and social interests
Be aligned to our strategy and embedded across our organization
Offer innovative aluminum low carbon solutions while providing society positive benefits across the application’s life cycle
The Novelis Sustainability Approach will…
9
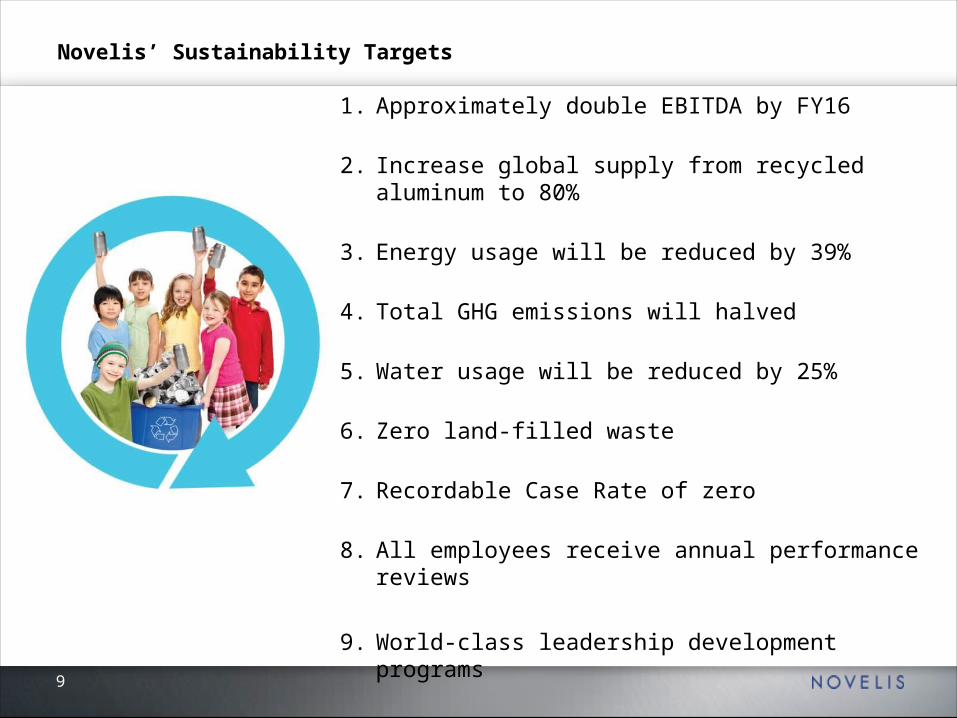
Novelis’ Sustainability Targets
1. Approximately double EBITDA by FY16
2. Increase global supply from recycled aluminum to 80%
3. Energy usage will be reduced by 39%
4. Total GHG emissions will halved
5. Water usage will be reduced by 25%
6. Zero land-filled waste
7. Recordable Case Rate of zero
8. All employees receive annual performance reviews
9. World-class leadership development programs
10. 100% of operations have local engagement programs
10
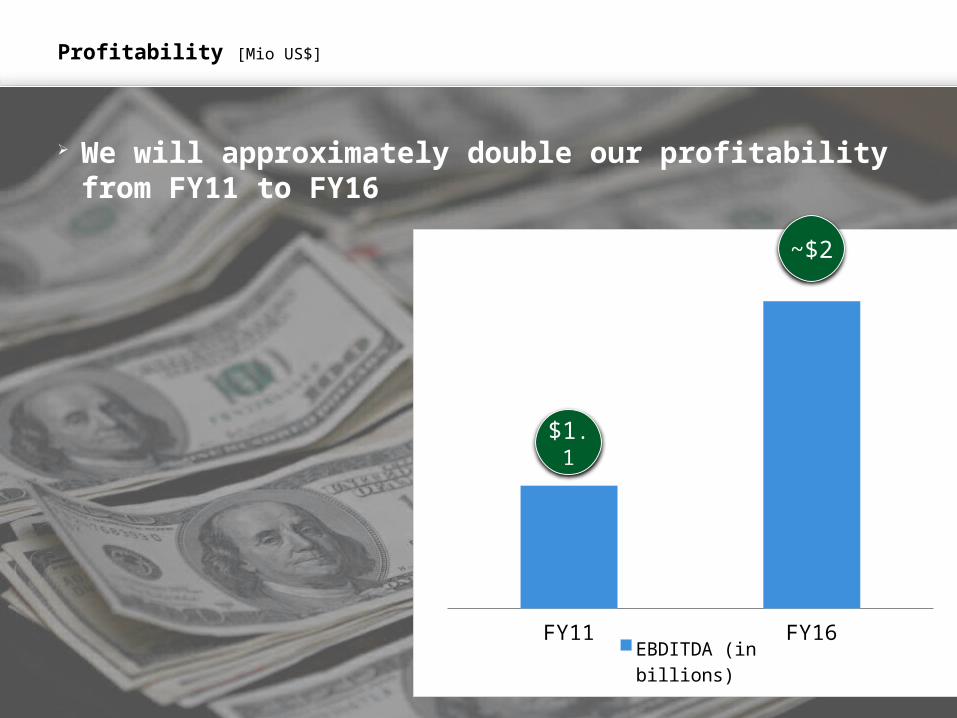
Profitability [Mio US$]
We will approximately double our profitability from FY11 to FY16
FY11 FY16
EBDITDA (in billions)
$1.1
~$2

11
Novelis will reduce the lifecycle environmental impact of aluminum products by increasing its global supply from recycled aluminum to 80% by 2020
Baseline FY'11 Vision 2020
Pre-Consumer Post-Consumer
Recycling [% on FRP sales]
30%33%
80%
Baseline average FY’07-09

12
Baseline FY'11 Vision 2020
Scope 1 Scope 2Scope 3 (Prime) Scope 3 (Transp.)
GHG Emissions [million Tonnes of CO2eq.]
The total GHG emissions will be almost halved
Scope 1 (fuels) and 2 (electricity)
Scope 3 (primary and transportation)
21.020.2
11.1
Baseline average FY’07-09

13
Created in order to critique our performance help us apply external best practices to our program improve our external dialogue and credibility
Members with experience from the following organizations: Stuart Hart, Enterprise for a Sustainable World, Cornell University Jeff Keefer, DuPont Miguel Milano, Instituto LIFE, Brazil Jonathon Porritt, Forum for the Future Matt Arnold, JP Morgan Novelis CEO, Chief Strategy Officer and Chief Sustainability Officer
Novelis Sustainability Advisory Council

14
Novelis Sustainability Report
First Sustainability Report issued in 2011
Annual commitment to report progress against our targets
Engagement process ongoing with our key stakeholders
© 2012 Boardwalk Capital Management
An Investor Perspective on Sustainability
B. Scott Sadler, CFASpring 2012
16© 2012 Boardwalk Capital Management
1. Sustainability -- Why it matters to investors
2. Our approach, research and resources.
3. The Evolution of ESG Investing
Overview

17© 2012 Boardwalk Capital Management
1.SustainabilityWhy it matters
18© 2012 Boardwalk Capital Management.
Why sustainability matters to investors
Scrutiny of environmental, social and corporate governance (ESG) factors uncovers truly superior companies.
A portfolio comprised of ESG best-of-class companies has been shown to outperform over time.
ESG worst-of-class firms have likewise underperformed.
Sustainability leaders more fully disclose risks, have a lower cost of capital and give investors fewer negative surprises.
Significant benefits can accrue to society by favoring companies with superior environmental and social standards.
19© 2012 Boardwalk Capital Management.
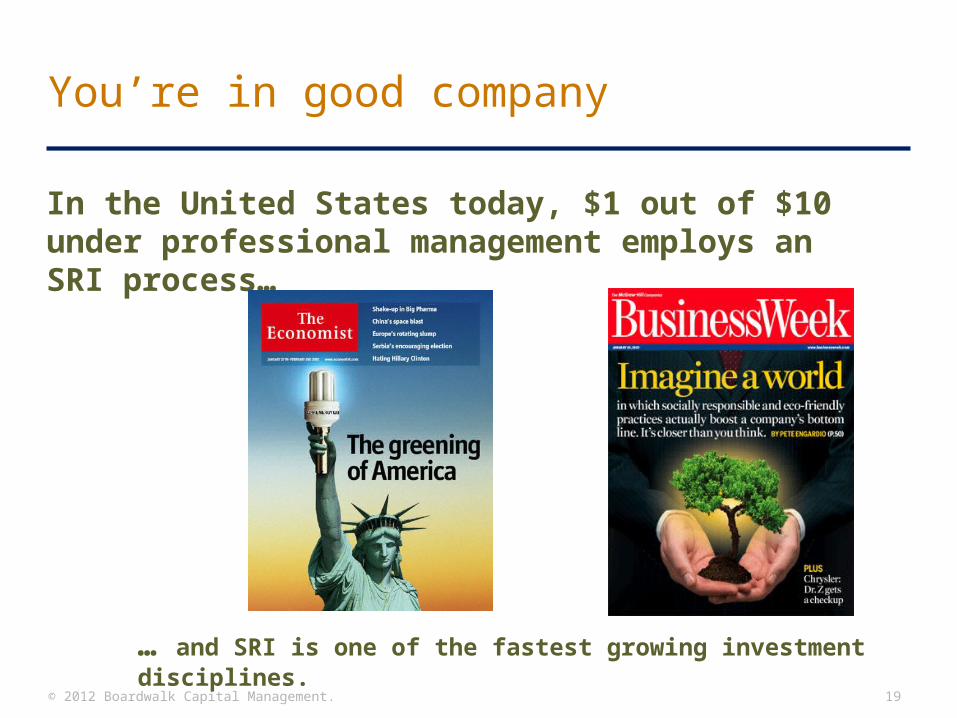
You’re in good company
In the United States today, $1 out of $10 under professional management employs an SRI process…
… and SRI is one of the fastest growing investment disciplines.
20© 2012 Boardwalk Capital Management.
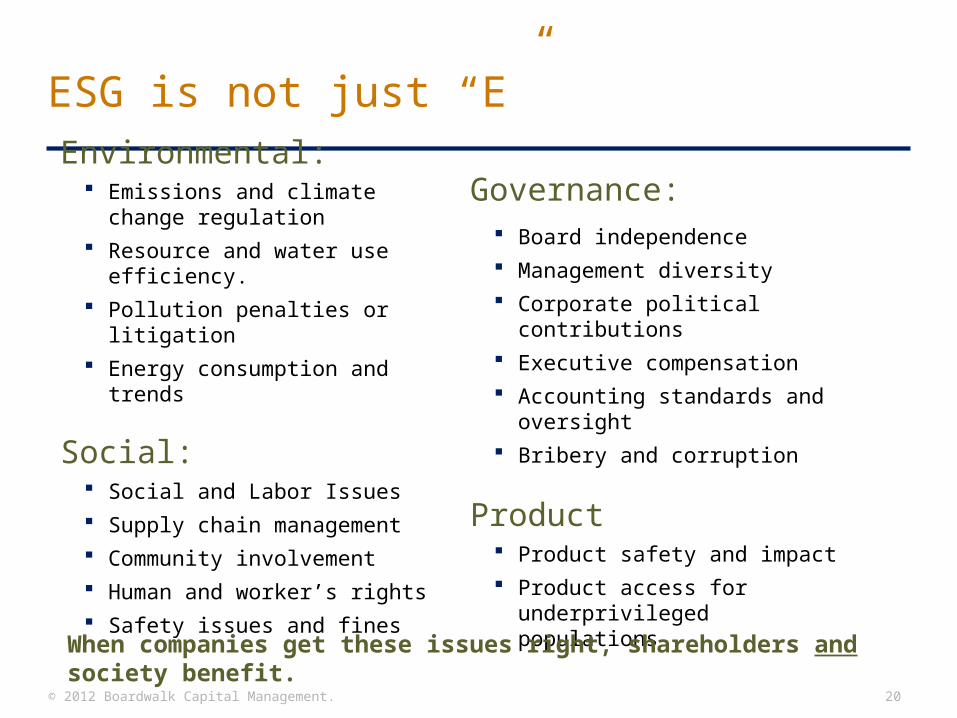
ESG is not just “E”
Environmental: Emissions and climate change
regulation
Resource and water use efficiency.
Pollution penalties or litigation
Energy consumption and trends
Social: Social and Labor Issues
Supply chain management
Community involvement
Human and worker’s rights
Safety issues and fines
Governance: Board independence
Management diversity
Corporate political contributions
Executive compensation
Accounting standards and oversight
Bribery and corruption
Product Product safety and impact
Product access for underprivileged populations
When companies get these issues right, shareholders and society benefit.

21© 2012 Boardwalk Capital Management
2. OurApproach

22© 2012 Boardwalk Capital Management.
Boardwalk’s approach to SRI
Invest in best-of-class, financially-strong companies
Diversify by industry and country
Apply sustainable principles across all asset classes
Include non-conventional assets
Rebalance regularly to mitigate risk
23© 2012 Boardwalk Capital Management.
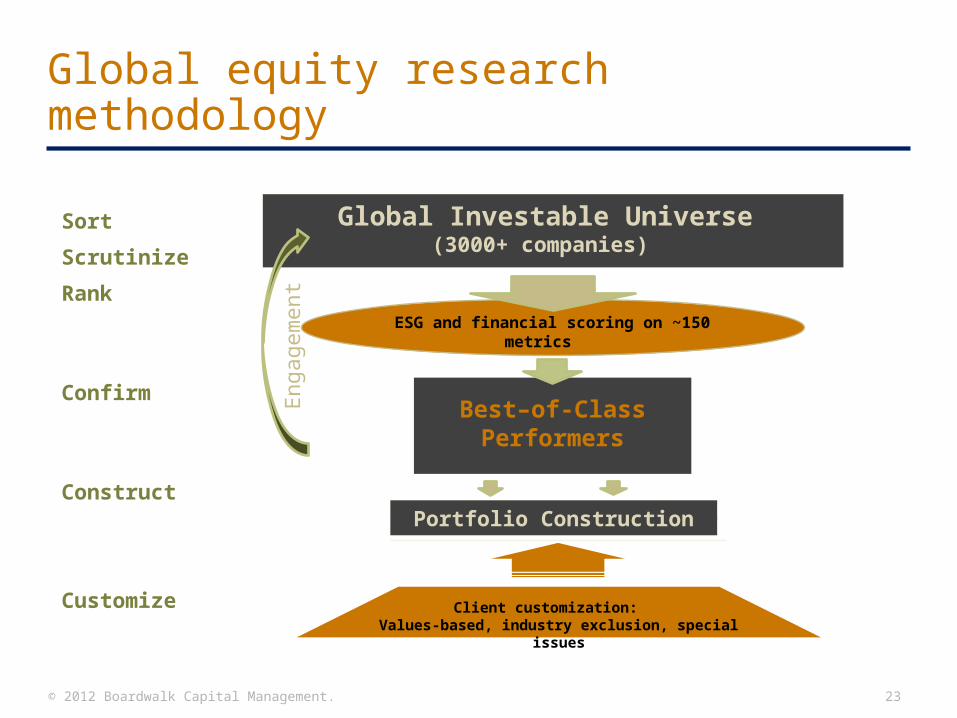
Global equity research methodology
ESG and financial scoring on ~150 metrics
Eng
agem
ent
Best–of-Class Performers
Global Investable Universe (3000+ companies)
Portfolio Construction
Sort
Scrutinize
Rank
Confirm
Construct
Customize Client customization: Values-based, industry exclusion, special issues
24© 2012 Boardwalk Capital Management.
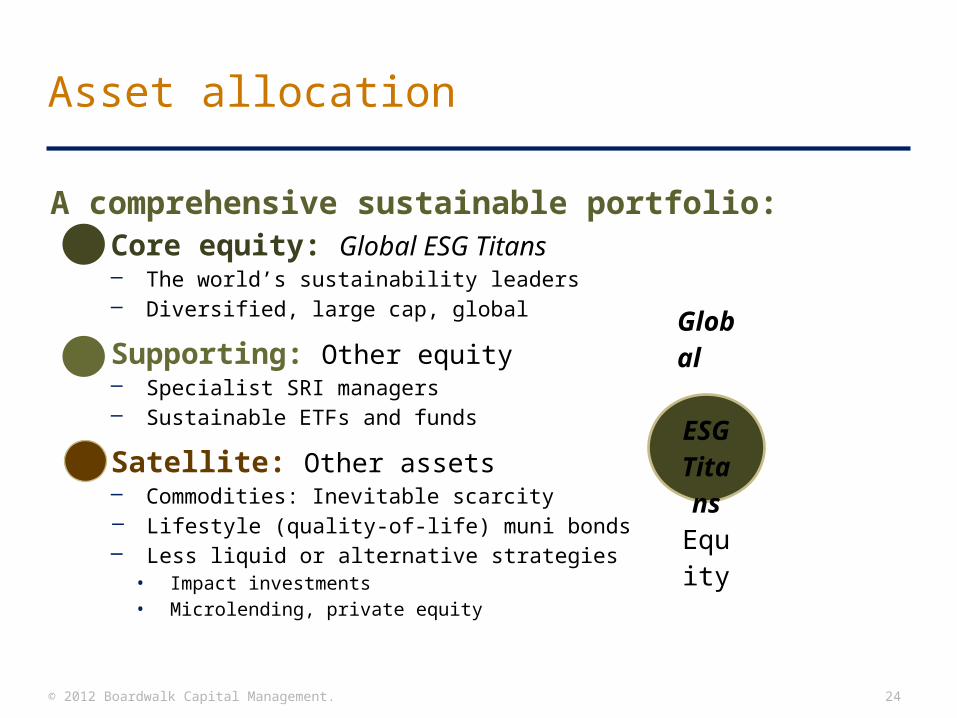
Asset allocation
A comprehensive sustainable portfolio: Core equity: Global ESG Titans
– The world’s sustainability leaders– Diversified, large cap, global
Supporting: Other equity– Specialist SRI managers– Sustainable ETFs and funds
Satellite: Other assets– Commodities: Inevitable scarcity– Lifestyle (quality-of-life) muni bonds– Less liquid or alternative strategies
• Impact investments• Microlending, private equity
Global ESG Titans
Equity

25© 2012 Boardwalk Capital Management
3. Evolution
26© 2012 Boardwalk Capital Management.
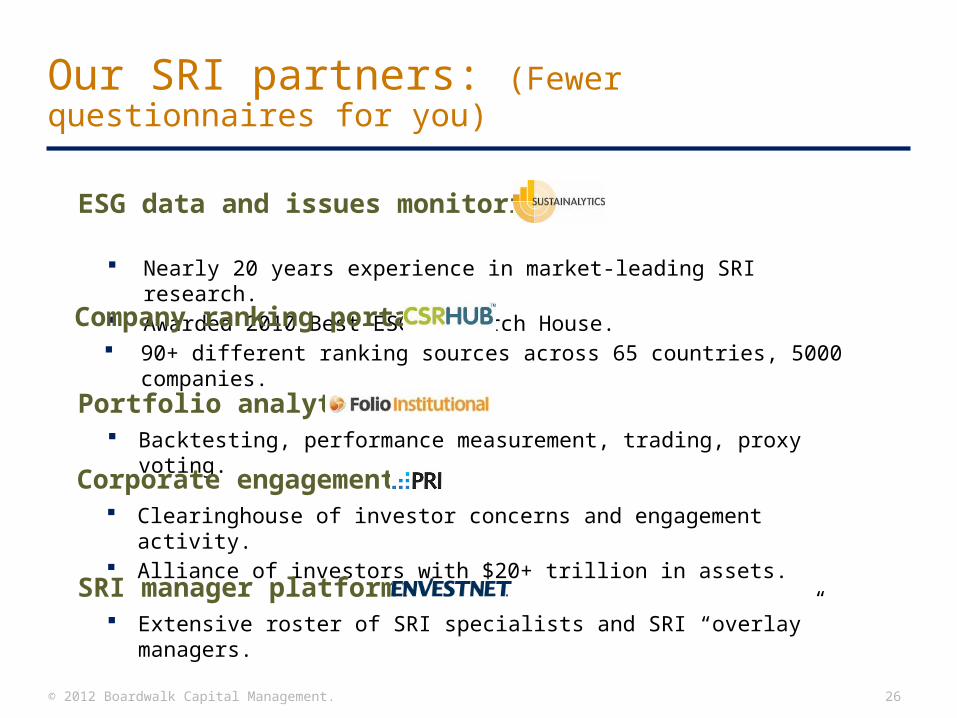
Our SRI partners: (Fewer questionnaires for you)
ESG data and issues monitoring: Nearly 20 years experience in market-leading SRI research. Awarded 2010 Best ESG Research House.
Company ranking portal: 90+ different ranking sources across 65 countries, 5000 companies.
Portfolio analytics: Backtesting, performance measurement, trading, proxy voting.
Corporate engagement: Clearinghouse of investor concerns and engagement activity. Alliance of investors with $20+ trillion in assets.
SRI manager platform: Extensive roster of SRI specialists and SRI “overlay” managers.

27© 2012 Boardwalk Capital Management.
-- One Source for ESG data Governance Governance Governance Governance Governance Governance Social Social Social
Company Name GroupAverage
Total Rating Score
Governance Group
Average
Governance Score
Social Group
Average
Social Score
Environment Group
Average
Environment Score
Business Ethics Group
Average
Business Ethics Score
Public Policy Group
Average
Public Policy Score
Corporate Governance
Group Average
Corporate Governance
Score
Contractors & Supply
Chain Group Average
Contractors & Supply
Chain Score
Customers Group
Average
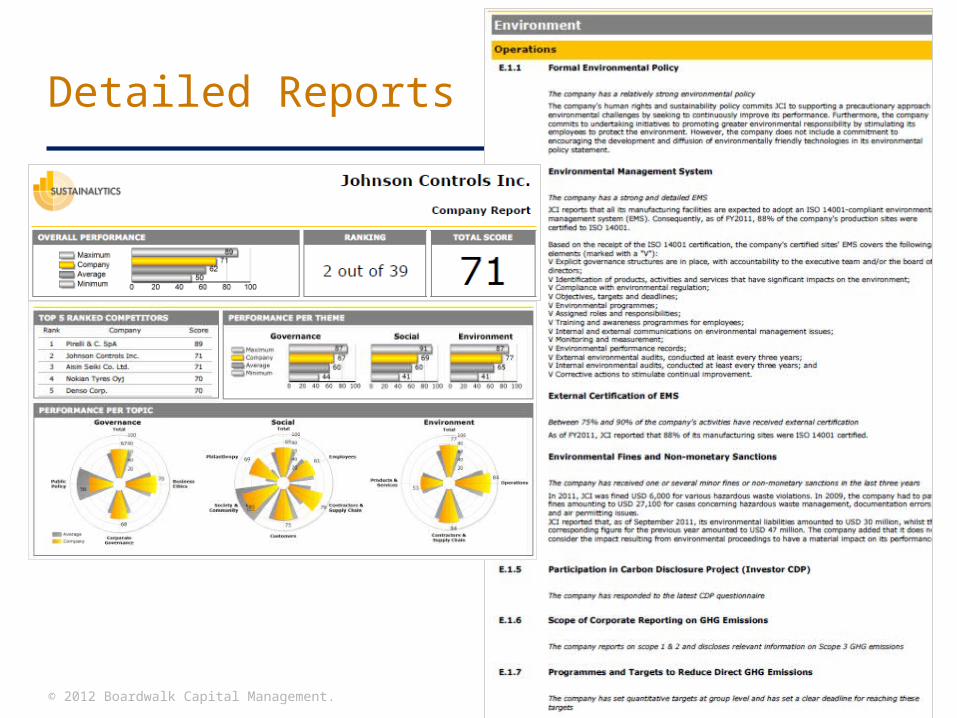
Johnson Controls Inc. 64.2 75.5 59.9 68.5 62.8 81.8 68.9 73.3 58.5 75.0 80.8 68.8 56.0 62.9 56.5 100.0 74.6
Aisin Seiki Co. Ltd. 64.2 66.7 59.9 53.6 62.8 63.1 68.9 80.2 58.5 55.0 80.8 75.0 56.0 47.1 56.5 46.4 74.6
Continental AG 64.2 69.6 59.9 65.6 62.8 69.3 68.9 72.7 58.5 65.0 80.8 75.0 56.0 63.8 56.5 53.6 74.6
Compagnie Generale DES Etablissements Michelin SCA
64.2 68.3 59.9 59.3 62.8 69.7 68.9 73.3 58.5 55.0 80.8 68.8 56.0 60.4 56.5 100.0 74.6
Magna International, Inc. 64.2 65.6 59.9 67.2 62.8 62.0 68.9 68.7 58.5 73.0 80.8 75.0 56.0 60.4 56.5 75.0 74.6
Denso Corp. 64.2 65.1 59.9 52.9 62.8 68.2 68.9 70.3 58.5 47.0 80.8 75.0 56.0 52.3 56.5 89.3 74.6
Bridgestone Corp. 64.2 54.5 59.9 47.4 62.8 45.7 68.9 69.5 58.5 37.0 80.8 75.0 56.0 49.2 56.5 64.3 74.6
Fiat S.p.A. 63.7 83.9 59.4 80.3 63.2 87.8 66.3 83.4 57.1 70.0 76.5 68.8 56.9 91.7 65.1 95.8 65.0
BMW Group 63.7 75.7 59.4 57.3 63.2 90.1 66.3 76.3 57.1 52.0 76.5 56.3 56.9 61.9 65.1 100.0 65.0
Renault SA 63.7 74.9 59.4 67.7 63.2 78.0 66.3 76.7 57.1 65.0 76.5 100.0 56.9 61.9 65.1 83.3 65.0
Ford Motor Co. 63.7 74.2 59.4 75.5 63.2 71.5 66.3 75.2 57.1 70.0 76.5 68.8 56.9 81.7 65.1 100.0 65.0
Volkswagen AG 63.7 72.7 59.4 66.0 63.2 81.6 66.3 70.5 57.1 65.0 76.5 62.5 56.9 67.7 65.1 79.2 65.0
Toyota Motor Corp. 63.7 64.7 59.4 55.9 63.2 45.4 66.3 82.5 57.1 50.0 76.5 81.3 56.9 54.4 65.1 54.2 65.0
Honda Motor Co., Ltd. 63.7 64.4 59.4 59.9 63.2 55.5 66.3 72.8 57.1 65.0 76.5 75.0 56.9 51.9 65.1 50.0 65.0
Environment Environment Environment Environment Environment EnvironmentCompany Name
Environment Group
Average
Environment Score
Contractors & Supply
Chain Group Average
Contractors & Supply Chain
Score
Operations Group
Average
Operations Score
Products & Services Group
Average
Products & Services
Score
Johnson Controls Inc. 68.9 73.3 80.9 84.0 72.3 78.2 51.9 53.1Aisin Seiki Co. Ltd. 68.9 80.2 80.9 84.0 72.3 89.2 51.9 53.1Continental AG 68.9 72.7 80.9 84.0 72.3 77.3 51.9 53.1Compagnie Generale DES Etablissements Michelin SCA 68.9 73.3 80.9 84.0 72.3 78.2 51.9 53.1
Toyota Industries Corporation 68.9 76.1 80.9 100.0 72.3 79.1 51.9 53.1Denso Corp. 68.9 70.3 80.9 84.0 72.3 79.1 51.9 37.5Fiat S.p.A. 66.3 83.4 62.4 83.3 66.5 83.3 68.0 83.5BMW Group 66.3 76.3 62.4 50.0 66.5 89.6 68.0 76.2Renault SA 66.3 76.7 62.4 48.9 66.5 92.7 68.0 74.6Ford Motor Co. 66.3 75.2 62.4 100.0 66.5 60.4 68.0 77.7Volkswagen AG 66.3 70.5 62.4 58.3 66.5 77.1 68.0 70.0Toyota Motor Corp. 66.3 82.5 62.4 84.4 66.5 72.9 68.0 91.2Honda Motor Co., Ltd. 66.3 72.8 62.4 63.9 66.5 67.7 68.0 82.3
28© 2012 Boardwalk Capital Management.
Detailed Reports

29© 2012 Boardwalk Capital Management.
-- ESG tools on the webDATA SOURCES FOR THIS COMPANYAsset4Carbon Disclosure Project 2008Carbon Disclosure Project 2009 Full DataCarbon Disclosure Project 2010 Full DataCarbon Disclosure Project--all respondents
CDP Water Data 2010Copenhagen CommuniqueCorporate Knights Global 100 - 2011Covalence Ethical QuotientCR’s 100 Best Corporate Citizens 2011Div50 2010EPA Climate LeadersEthisphereGlassdoorGlobal 100 List 2010Global Reporting Initiative 2010Goodness 500Governance Metrics InternationalHuman Rights Campaign 2011 ListIW FinancialMSCI ESG Intangible Value AssessmentMSCI Global Compact +NASDAQ OMX CRD Global Sustainability IndexNewsweek Top 500 Global Green Cos 2011
Newsweek Top 500 Green Companies 2010Newsweek Top 500 Green Companies 2011Top 100 Military Friendly EmployersTrucostUN Global Compact 2010UN Office on Drugs & Crime Anti-CorruptionVigeo

30© 2012 Boardwalk Capital Management.
Mainstreaming ESG Information
on Huffington Post.com ESG Data on Bloomberg
31© 2012 Boardwalk Capital Management.
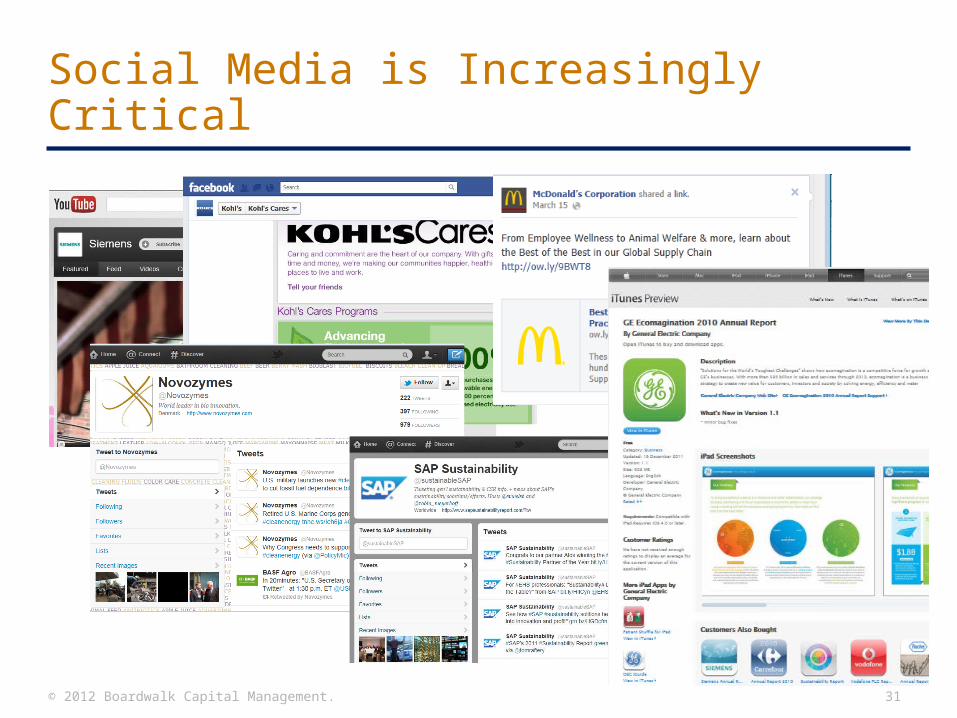
Social Media is Increasingly Critical

32© 2012 Boardwalk Capital Management.
Thanks for all you do
© 2012 Boardwalk Capital Management
Boardwalk Capital Management is a proud signatory of the UN Principles for Responsible Investment.
Boardwalk Capital Management is an active member of the Green Chamber of the South.
An investor initiative in partnership with UNEP FI and the UN Global Compact
An investor initiative in partnership with UNEP FI and the UN Global Compact
Follow us on:
Top Related