


Languages
Pages
Legal


New Madrid and Wabash Valley Seismic Study: Assessing the Impacts on Natural Gas
Transmission Pipelines and Downstream Markets by Using “NGFast”
“
Presented by:Edgar Portante, Steve Folga, Shabbir Shamsuddin, Michael McLamore,
Leah Talaber, Vic Hammond, Jim Kavicky, and Brian CraigArgonne National Laboratory, Argonne, IL USA
February 24, 2009
Prepared for:
FEMA Region V New Madrid Seismic Zone Planning Workshop
Indianapolis, IN
Work sponsored by FEMA Region V Disaster Operations Division, Chicago, IL USA

2
Order of Presentation
Brief Description of NGFast Simulation ModelObjectives of the New Madrid Natural Gas Pipeline StudyScenarios Covered by the Study Major Assumptions and MethodologyOverview of the U.S. Natural Gas Pipeline SystemKey Findings – New Madrid and Wabash EventsSummary of Damages and Estimated Restoration TimeSeismic Performance of Underground Storage FacilitiesConclusions – Natural Gas Pipeline StudyConclusions – New Madrid Electric Transmission Line Study

3
NGFast: Model for Natural Gas Pipeline Breaks and Downstream Impacts – Salient Features
Linear, steady-state model provides aquick estimate of impacts on thedownstream market of:−
single or multiple pipeline breaks−
flow reduction problemsThis national model includes:~ 80 interstate and other pipelines~ 1,800 local distribution companies (LDCs)~ 800 state border points
Compensated/uncompensated modesaccount for effects of mitigating measuressuch as:−
underground storage (UGS)−
liquefied natural gas (LNG)−
production facilities−
spare pipeline capacityGraphical user interface (GUI) navigationuses “point-and-click” features, is superfast, and is easy to use
Graphical and tabular HTML –formatted outputsApplications
–
DOE exercise analysis–
hurricane analysis–
seismic analysis–
others as appropriate

4
NGFast Analysis Output
For a postulated flow disruption in a specific border point(s) and month of the year, NGFast assesses impacts, including:
Downstream states affected LDCs affected per stateLoad shed per customer class per LDCNumber of customers per class typeMW of electric power plants affectedDetailed per state pre- and post-disruption load and flow levels
Options on remedial actions to minimize overall impact
NGFast Model Version 5.01

5
Primary Objectives of the Current Seismic Study
Assessment of impact on natural gas interstate transmission pipelines
Identification of specific pipelines affected
Identification of probable location of pipeline breaks
Assessment of downstream impacts in terms of population and business customers affected
Estimate of restoration time from the perspective of industry experts

6
Scenarios Covered by the Study
1: New Madrid Event with M 7.7 quake involving the northern segment and the Boot Heel of Missouri.
2: Wabash Valley Event with M 6.8 quake
3: Simultaneous New Madrid and Wabash Events with M 7.7 and 6.8, respectively
.
Three Scenarios Covered

7
Key Assumptions Used for Impact Assessment
Events occurred on Feb. 24 at 2:00 a.m.A pipeline segment break triggered by the earthquakes implies 100% flow reduction along the pipeline Transmission pipelines through the seismic zones are generally ductile, made of steel, are arc welded, and are buried at an average of 4 to 6 ft below ground surface.Order of load shedding:–
gas-fired power plants–
industrial–
commercial–
residential

8
Methodology, Models, and Sources of Data
Used HAZUS MH-MR3 for damage functions and fragility curvesUsed Argonne’s NGFast model for pipeline break simulation and assessment of downstream impacts Used industry-based experience for estimating restoration time
Methodology and Models
Data Sources and GraphicsFor ground motion, used FEMA-provided shake maps (PGA, PGV, liquefaction)For NGFast and pipe characterization, used:−
EIA 176−
EIA state border files−
FERC 567−
Platts PowerMap−
DOT’s National Pipeline Mapping System−
ESRI Arc Map−
Industry expertsNatural Gas Storage Assessment and Restoration: used inputs from industry subject-matter experts
NGFast: rapid assessment of impacts of natural gas pipeline breaks at U.S. borders and import points

9
Overview of U.S. Natural Gas Pipeline System
The U.S. natural gas system is a complex network of interconnected high-volume, high-pressure pipelines.

10
Occurring simultaneously
Emergency remedial actions implemented
Summary of Key Findings
Scenario 3: Combined New Madrid and Wabash Valley Seismic Events

11
New Madrid and Wabash Valley: Key Finding 1Ten interstate pipelines are at high risk for multiple damage from New Madrid and Wabash Valley earthquakes

12
New Madrid and Wabash Valley: Key Finding 2All ten at-risk pipelines would be damaged by at least one break and several leaks due to PGA, PGV, and liquefaction with implications on Region V states
Pipeline Break in Wabash
Pipeline Break in New Madrid

13
Typical Emergency Actions by Pipeline Companies to Mitigate Impacts
Declare emergency gas days and enforce “force majeure” measures
Coordinate, prioritize, decide, and implement gas re-routing options
Prioritize, decide, and implement load shedding options
As much as possible, spare residential customers from being shed
Assess, prioritize, and implement temporary, quick work-around
remedial actions on damaged pipes
Organize crews, materials, supervisory personnel, and support staff toimmediately commence temporary and permanent repair work

14
New Madrid and Wabash Events Emergency Remediation Measures before Permanent Restoration
Available Emergency Mitigation Measures−
selectively shed interruptible loads (e.g., power plants, industrial loads)
−
increase withdrawal from UGS
−
increase flow from spare capacity from interconnected but unaffected pipelines
−
withdraw LNG from storage
−
increase production from nearby fieldsOther Possible Sources of Gas
–
Rocky Mountains–
Canada–
Gulf of Mexico via other unaffected pipelines

15
New Madrid and Wabash Valley Events Downstream Impacts with Emergency Remedial Actions: Key Finding 3
All FEMA Region V states, except Minnesota, would experience substantial delivery reduction, ranging from 2% to 27%

16
Downstream Impacts with Emergency Remedial Measures: Key Finding 4
Implementation of emergency remedial measures could limit the number of people affected to about 60,000–100,000 (or 20,000–33,000 households) across several states; a large number of electric, industrial, and commercial customers (50,000–140,000) would also be shed
40 Type Low HighResid 15 15 Comm 6,415 32,076 Indust 4,860 14,580 Elect 16 49 Total 11,307 46,720
Illin
ois
People Affected:
2,195 Type Low HighResid 896 896 Comm 7,028 35,141 Indust 272 817 Elect - - Total 8,197 36,854
Ken
tuck
y
People Affected:
75,371 Type Low HighResid 31,145 31,145 Comm 11,593 57,964 Indust 845 2,535 Elect 1 2 Total 43,583 91,646
Mis
sour
i
People Affected:
2,472 Type Low HighResid 985 985 Comm 1,113 5,565 Indust 221 664 Elect 4 13 Total 2,324 7,227
Indi
ana
People Affected:
Residential Sector Not Affected
- Type Low HighResid - - Comm 2,560 12,801 Indust 458 1,375 Elect 9 27 Total 3,028 14,203
Ohi
o
People Affected:
- Type Low HighResid - - Comm - - Indust - - Elect 2 5 Total 2 5
Wis
cons
in
People Affected:
- Type Low HighResid - - Comm - - Indust 4 11 Elect 8 23 Total 11 34
Mic
higa
n
People Affected:
- Type Low HighResid - - Comm 2 11 Indust 29 87 Elect 0 1 Total 32 99
Tenn
esse
e
People Affected:

17
New Madrid and Wabash Valley Downstream Impacts with Emergency Remedial Measures: Key Finding 5
In terms of amount of natural gas-fired power plants’ capacity affected due to gas curtailment, the amount of megawatts of power at risk per state is low

18
Summary of Damages in New Madrid Area
A. Pipeline Damage Due to PGV and Estimated Restoration Time

19
Summary of Compressor Damages in New Madrid
B. Compressor Station Damage and Restoration

20
Wabash Valley Area Summary of Underground Storage and Pipeline Damages
A. Underground Storage at Risk Due to PGA and Estimated Restoration Time
B. Pipeline Damage Due to PGV, PGA, and Liquefaction and Estimated Restoration Time

21
Wabash Valley Area Summary of Compressor Damages
C. Compressor Damage Due to PGA and Estimated Restoration Time

22
Seismic Performance of Underground Storage Facilities
In general, experts agree that UGS within 100 miles of the quake’s epicenter may be at risk of some damage, depending on the intensity of the quake and the direction of the seismic wave
In general, UGS fields are quite resilient against seismic disturbance unless the structure is located at the fault line
According to seismologists, only the top 50 ft of soil is subject to liquefaction, meaning that little damage is expected to occur to subsurface UGS fields because the typical depth of sandstone and rock is 1,000–2,000 ft
Most underground damage involves the vertical surface-to-underground cavern pipeline at a point where the pipeline meets the cap rock of the underground structure
Other damage may involve the fracture of the cap rock that lines the storage core of the underground structure; the fracture may result in gas leaking or migrating to the surface
Most UGS is located near the Wabash Valley, except for two small facilities whose surface structures may be at risk due to PGA; the other UGSs are assumed to be functional

23
Natural Gas Study: Conclusions and Summary of Key Findings
Key Finding 1: Ten interstate pipelines would be at risk of damage due to the events
Key Finding 2: All ten pipelines would experience at least one break and several leaksdue to PGA, PGV, and liquefaction
Key Finding 3: Even with implementation of emergency remedial measures, all FEMA Region Vstates (except Minnesota) and other nearby states would experience a substantial reduction in delivery, ranging from 2% to 27% Indiana ~ 18% Michigan ~ 18% Illinois ~13%Ohio ~12% Wisconsin ~2%
Key Finding 4: Even with emergency remedial actions, the seismic events would impact:– 20,000–30,000 households (or 60,000–100,000 people)– 50,000–140,000 Industrial and commercial customers or units
Key Finding 5: A well-orchestrated implementation of remediation measures would limit impact on natural gas-fired power to insignificant levels (less than 2% of installed capacity)
Key Finding 6: In general, all underground storage facilities (except for 2) would not experienceany serious damage so as to make them dysfunctional
Key Finding 7: Restoring damaged pipelines to full functionality would take about 1–3 monthsdepending on how the pipeline companies subdivide and “phase” the work, the availability ofcrews, conditions of access roads, and resolved target completion times; restoration forresidential and industrial customers would take 2–4 and 4–8 weeks, respectively
24
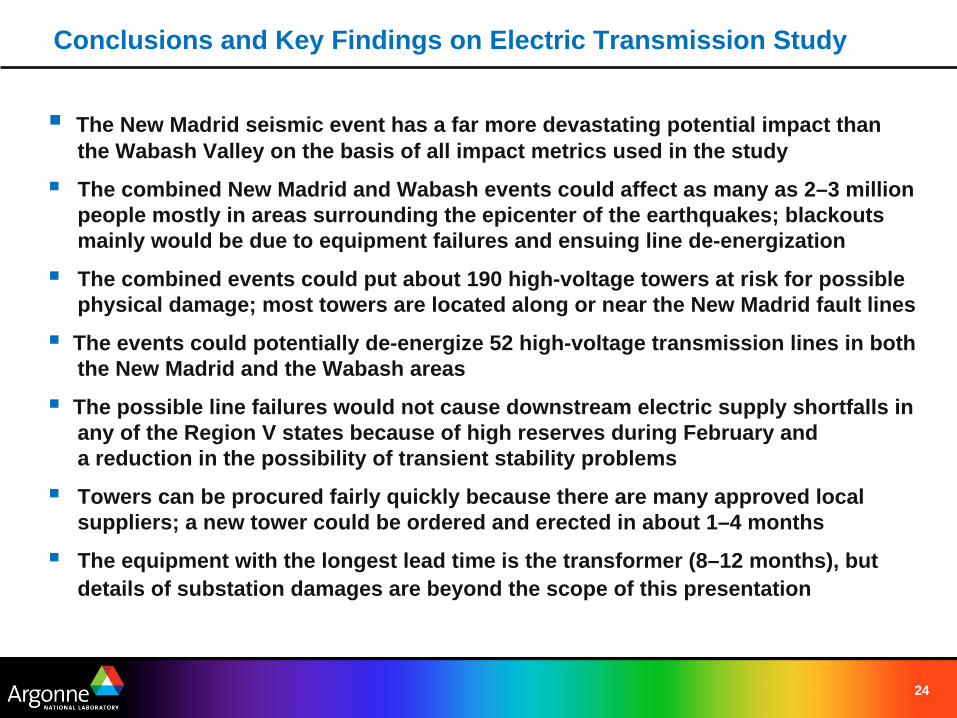
Conclusions and Key Findings on Electric Transmission Study
The New Madrid seismic event has a far more devastating potential impact than the Wabash Valley on the basis of all impact metrics used in the study
The combined New Madrid and Wabash events could affect as many as 2–3 millionpeople mostly in areas surrounding the epicenter of the earthquakes; blackoutsmainly would be due to equipment failures and ensuing line de-energization
The combined events could put about 190 high-voltage towers at risk for possiblephysical damage; most towers are located along or near the New Madrid fault lines
The events could potentially de-energize 52 high-voltage transmission lines in boththe New Madrid and the Wabash areas
The possible line failures would not cause downstream electric supply shortfalls inany of the Region V states because of high reserves during February anda reduction in the possibility of transient stability problems
Towers can be procured fairly quickly because there are many approved localsuppliers; a new tower could be ordered and erected in about 1–4 months
The equipment with the longest lead time is the transformer (8–12 months), but details of substation damages are beyond the scope of this presentation

25
Contact Information
Edgar C. PortanteArgonne National LaboratoryE-mail: [email protected]: 630-252-7965
Stephen M. Folga
Argonne National Laboratory
E-mail: [email protected]
Phone: 630-252-3728
Top Related