


Languages
Pages
Legal


Costs of Doing Business in Ireland 2011 June 2011
NCC Costs of Doing Business in Ireland 2011 1 June 2011
Introduction to the NCC
The National Competitiveness Council was established by Government in 1997. It reports to the
Taoiseach on key competitiveness issues facing the Irish economy and offers recommendations on
policy actions required to enhance Ireland’s competitive position.
Each year the NCC publishes two annual reports.
Benchmarking Ireland’s Performance is a collection of statistical indicators of Ireland’s
competitiveness performance in relation to 17 other economies and the OECD or EU average.
Ireland’s Competitiveness Challenge uses this information along with the latest research to
outline the main challenges to Ireland’s competitiveness and the policy responses required to
meet them.
As part of its work, the NCC also publishes other papers on specific competitiveness issues.
The work of the National Competitiveness Council is underpinned by research and analysis
undertaken by Forfás – Ireland’s policy advisory board for enterprise, trade, science, technology and
innovation.

NCC Costs of Doing Business in Ireland 2011 2 June 2011
Chairman’s Preface
Ireland is battling to restore economic stability and to return to a
sustainable path of economic growth and to protect our reputation as an
excellent location to do business. A determined focus on our international
competitiveness is central to our recovery. As a small, open economy,
dependent on trade as a source of revenue, it is imperative that Irish
enterprises are in a position to compete successfully for business in
international markets. Cost competitiveness is one of the key determinants
of any firms’ success.
This report from the National Competitiveness Council addresses Ireland’s cost environment. On a positive note, notwithstanding the firestorm of bad news relating to the fiscal and banking crises, the business environment remains resilient. Indeed, there have clear been significant improvements in cost competitiveness over the last year or so.
At the broadest level, the European Commission have acknowledged that Ireland represents a rare
example of an economy which has successfully achieved reductions in costs – we know that since the
beginning of 2008, the differential between Irish and euro area prices has narrowed. This has been
driven by a number of factors: we know that labour costs, which account for a significant proportion
of the overall cost base for firms have grown at a lower rate than in our key competitors. Painful as
it has been for many, the sharp reduction in property values means that firms can acquire or rent
premises at rates which as recently as three years ago would have been unimaginable. In terms of
utility and professional service costs, in general prices have declined from their peak, all of which
means that Ireland has become a much more attractive location to do business.
I must, however, express a major note of caution. There is no room for complacency. While
improvements in our cost base have boosted our international competitiveness, Ireland has a long
way to go to restore structural and enduring cost competitiveness. To date we have achieved
reductions in cost primarily as a result of cyclical factors – by and large, the collapse in consumer
demand, both domestically and internationally, has impacted positively upon prices. If we are to
face down emerging threats such as increasing global oil prices, a resumption of inflation, and
potential adverse currency movement’s vis-à-vis sterling and/or the dollar, Irish policy must deliver
outcomes which embed lasting, structural reform. Only structural reform will ensure that the gains
we make are of a permanent nature and will not quickly be eroded upon any resumption in growth.
The analysis and recommendations herein focus on delivering just this sort of reform. The
recommendations focus on (i) ensuring that the labour market operates in a manner which supports
both competitiveness and employment; (ii) reinvigorating the property market and eliminating those
factors which contributed to the creation of a bubble; (iii) maintaining a competitive cost
environment for key utilities such as energy and waste; and (iv) boosting levels of competition in
the non-traded sectors of the economy. Implementation of the Council’s recommendations would
represent a major step in ensuring Ireland’s future competitiveness and prosperity.

NCC Costs of Doing Business in Ireland 2011 3 June 2011
At the same time, the Council are very much aware that cost competitiveness is only one element
of Ireland’s international offering. In parallel with reducing costs, we must protect and maintain
policies which offer competitive advantage such as our pro-enterprise tax regime, and address
issues currently proving challenging for enterprise – we must, for example, ensure that viable
enterprise can access sufficient and timely credit. At the same time, we must also enhance the
productivity of our firms and our wider economy. As noted in the Council’s recent statement on
competitiveness priorities, higher productivity is the glue which sustains high living standards and
competitiveness. Productivity is an overarching concept, which encompasses skills, education and
training; innovation; and infrastructure. Each of these elements will be considered in detail in the
NCC’s forthcoming report Ireland’s Competitiveness Scorecard which will benchmark Ireland’s
performance against a range of key competitor countries. The lessons drawn from this analysis will
then be used to develop a set of policy recommendations designed to further boost Ireland’s
competitiveness in the Council’s Competitiveness Challenge 2011 report, due to be published
towards the end of this year.
Finally I would like to thank the members of the Council and the advisors from the relevant
Government departments for their input on this report. I would also like to acknowledge the
research and analytical support provided by the Forfás executive.
Dr Don Thornhill
Chairman, National Competitiveness Council
NCC Costs of Doing Business in Ireland 2011 4 June 2011
Council Members
Dr Don Thornhill Chairman
Brendan Butler Director of Strategy, Trade, EU and International Affairs, IBEC
Donal Byrne Chairman, Cadbury Schweppes Ireland Limited
Shay Cody General Secretary, IMPACT
Michael Delaney Vice President for Development, Cork Institute of Technology
Pat Delaney Director of Sectors and Regions, IBEC
Clare Dunne Assistant Secretary, Department of Enterprise, Jobs and Innovation
Marcus Hewson
Annette Hughes Director, DKM Economic Consultants
Harry Lorton Chairman, H & A Marketing and PR
Seán Murphy Deputy Chief Executive, Chambers Ireland
Declan Purcell Chairman, Competition Authority
Martin Shanahan Chief Executive, Forfás
William Slattery Executive Vice President and Head of European Offshore Domiciles,
State Street International (Ireland) Limited
Paul Sweeney Chief Economist, Irish Congress of Trade Unions
John Travers Consultant and Founding Chief Executive Officer, Forfás and Science
Foundation Ireland
Council Advisers
Paul Bates Assistant Secretary, Department of Transport, Tourism, and Sport
Mark Griffin Assistant Secretary, Department of Environment, Community and
Local Government
Kevin McCarthy Assistant Secretary, Department of Education and Skills
Eamonn Molloy Assistant Secretary, Department of Communications, Energy and
Natural Resources
David Moloney Assistant Secretary, Department of Finance
John Murphy Assistant Secretary, Department of Transport, Tourism, and Sport
Liam Nellis
Aidan O’Driscoll
Chief Executive, InterTrade Ireland
Assistant Secretary, Department of Agriculture, Fisheries and Food
Research and Administration
Adrian Devitt Forfás
Conor Hand Wilton Park House
Michelle Nic Gearailt Wilton Place
Dublin 2
Tel: 01 607 3000 Fax 01 607 3030 Email: [email protected]
Web: www.competitiveness.ie
NCC Costs of Doing Business in Ireland 2011 5 June 2011
CONTENTS
Executive Summary 6 1. Introduction 19
1.1 Overview of Ireland’s Cost Competitiveness 19
1.2 What Drives Costs? 21
1.3 High Costs Damage Enterprise Growth 22
1.4 Methodology 23
2. Cost Profiles 25 2.1 Summary Cost Profiles 25
2.2 Sectoral Cost Profiles 26
3. Labour Costs 29 3.1 Summary 29
3.2 Labour Cost Indices and Unit Labour Costs 30
3.3 Social Security Contributions and Labour Taxation 33
3.4 Policy Focus – Labour Market Efficiency 35
4. Property Costs 42 4.1 Summary 42
4.2 Property Cost Indicators 43
4.3 Policy Focus – Commercial Property in Ireland 47
4.4 Drivers of Demand and Supply 49
4.5 Conclusions and Recommendations 51
5. Utility Costs 60 5.1 Summary 60
5.2 Energy and Fuel 61
5.3 Environmental Utilities 63
5.4 Telecommunications 64
5.5 Policy Focus – Energy and Waste Recommendations 66 6. Business and Professional Services Costs 69 6.1 Summary 69
6.2 Prices for Professional and Business Services 70
6.3 Focus on Specific Sectors 71
6.4 Policy Focus – Competition in Professional Services 75
7. Indirect Business Costs 83 7.1 Summary 83
7.2 Consumer Price Levels and Trends in Prices 84
7.3 Consumer Price Index 85
7.4 Policy Discussion 88
Appendix - Summary of Specialist Databases 89
NCC Costs of Doing Business in Ireland 2011 6 June 2011
Executive Summary
Cost competitiveness improved further in 2010, building on the advances made in 2008 and 2009.
Ireland’s international cost competitiveness is now at levels not witnessed since February 20031. As
Ireland repositions itself once again as an export growth led economy, cost competitiveness will be
central to the performance of our exporters. Cost competitiveness, however, is important for all
enterprises, not just those who export. The performance of all enterprises will ultimately determine
our competitiveness and so it is important that markets operate efficiently, regardless of whether
these are exposed to international trade or are servicing domestic consumers.
Data from the European Commission illustrates that the gap in cost competitiveness between
Ireland and the euro area (EA 16) and the broader EU 27 has decreased over the past number of
years2.
Ireland’s cost base was impacted by nominal wage and price declines across many sectors along with
an upturn in economy-wide productivity measures. The Central Bank of Ireland measures the impact
of both exchange rate movements and price changes - they have estimated that between April
1 Central Bank of Ireland, Real Harmonised Competitiveness Indicators (HCI), Online Database 2 European Commission, Directorate-General for Economic and Financial Affairs, Price and Cost Competitiveness - Quarterly data on price and cost competitiveness of the European Union and its Member States, ECFIN/E-4 Fourth quarter 2010 3 The real effective exchange rate is the nominal effective exchange rate (a measure of the value of a currency against a weighted average of several foreign currencies) divided by a price deflator or index of costs.
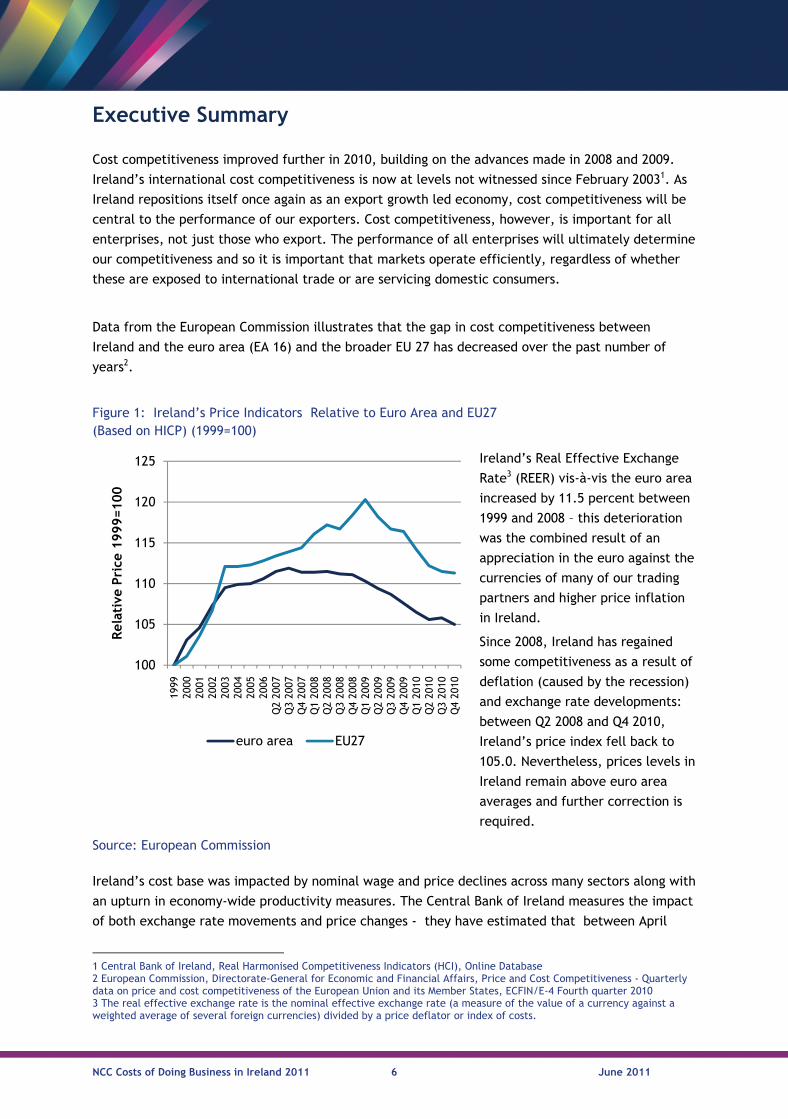
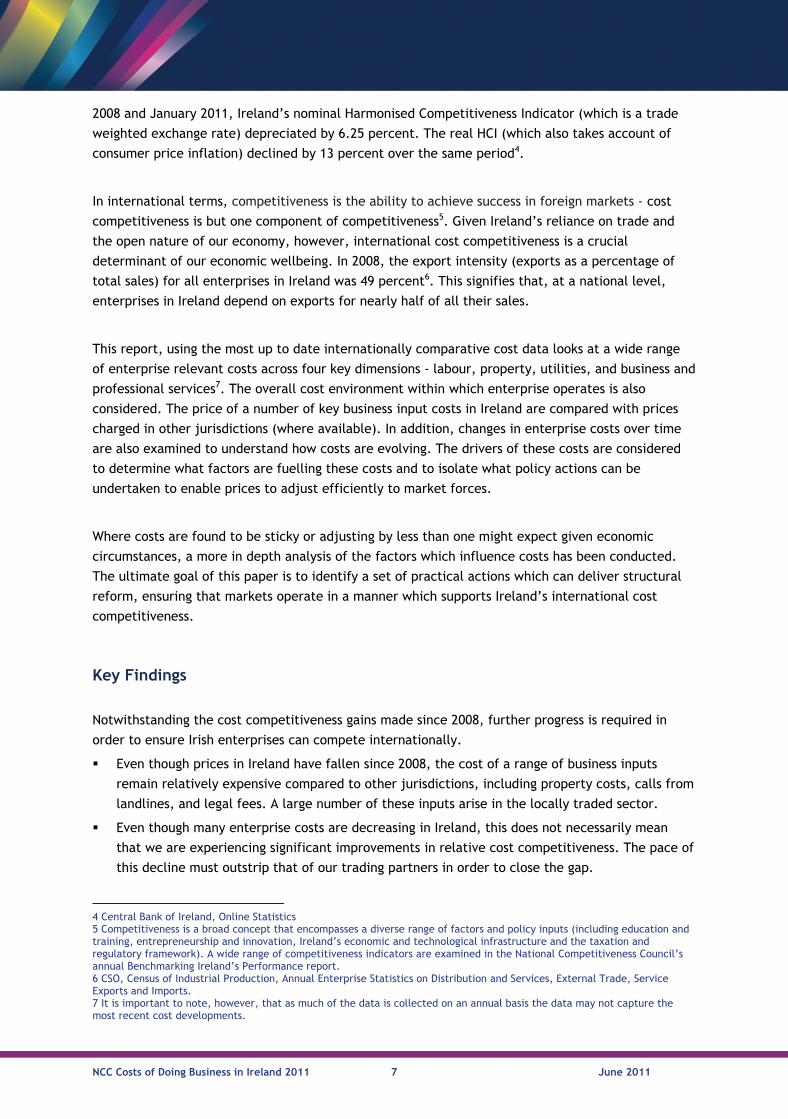
Figure 1: Ireland’s Price Indicators Relative to Euro Area and EU27 (Based on HICP) (1999=100)
Ireland’s Real Effective Exchange
Rate3 (REER) vis-à-vis the euro area
increased by 11.5 percent between
1999 and 2008 – this deterioration
was the combined result of an
appreciation in the euro against the
currencies of many of our trading
partners and higher price inflation
in Ireland.
Since 2008, Ireland has regained
some competitiveness as a result of
deflation (caused by the recession)
and exchange rate developments:
between Q2 2008 and Q4 2010,
Ireland’s price index fell back to
105.0. Nevertheless, prices levels in
Ireland remain above euro area
averages and further correction is
required.
Source: European Commission
100
105
110
115
120
125
1999
2000
2001
2002
2003
2004
2005
2006
Q2
2007
Q3
2007
Q4
2007
Q1
2008
Q2
2008
Q3
2008
Q4
2008
Q1
2009
Q2
2009
Q3
2009
Q4
2009
Q1
2010
Q2
2010
Q3
2010
Q4
2010
Rel
ativ
e Pri
ce 1
999=100
euro area EU27
NCC Costs of Doing Business in Ireland 2011 7 June 2011
2008 and January 2011, Ireland’s nominal Harmonised Competitiveness Indicator (which is a trade
weighted exchange rate) depreciated by 6.25 percent. The real HCI (which also takes account of
consumer price inflation) declined by 13 percent over the same period4.
In international terms, competitiveness is the ability to achieve success in foreign markets - cost
competitiveness is but one component of competitiveness5. Given Ireland’s reliance on trade and
the open nature of our economy, however, international cost competitiveness is a crucial
determinant of our economic wellbeing. In 2008, the export intensity (exports as a percentage of
total sales) for all enterprises in Ireland was 49 percent6. This signifies that, at a national level,
enterprises in Ireland depend on exports for nearly half of all their sales.
This report, using the most up to date internationally comparative cost data looks at a wide range
of enterprise relevant costs across four key dimensions - labour, property, utilities, and business and
professional services7. The overall cost environment within which enterprise operates is also
considered. The price of a number of key business input costs in Ireland are compared with prices
charged in other jurisdictions (where available). In addition, changes in enterprise costs over time
are also examined to understand how costs are evolving. The drivers of these costs are considered
to determine what factors are fuelling these costs and to isolate what policy actions can be
undertaken to enable prices to adjust efficiently to market forces.
Where costs are found to be sticky or adjusting by less than one might expect given economic
circumstances, a more in depth analysis of the factors which influence costs has been conducted.
The ultimate goal of this paper is to identify a set of practical actions which can deliver structural
reform, ensuring that markets operate in a manner which supports Ireland’s international cost
competitiveness.
Key Findings
Notwithstanding the cost competitiveness gains made since 2008, further progress is required in
order to ensure Irish enterprises can compete internationally.
Even though prices in Ireland have fallen since 2008, the cost of a range of business inputs
remain relatively expensive compared to other jurisdictions, including property costs, calls from
landlines, and legal fees. A large number of these inputs arise in the locally traded sector.
Even though many enterprise costs are decreasing in Ireland, this does not necessarily mean
that we are experiencing significant improvements in relative cost competitiveness. The pace of
this decline must outstrip that of our trading partners in order to close the gap.
4 Central Bank of Ireland, Online Statistics 5 Competitiveness is a broad concept that encompasses a diverse range of factors and policy inputs (including education and training, entrepreneurship and innovation, Ireland’s economic and technological infrastructure and the taxation and regulatory framework). A wide range of competitiveness indicators are examined in the National Competitiveness Council’s annual Benchmarking Ireland’s Performance report. 6 CSO, Census of Industrial Production, Annual Enterprise Statistics on Distribution and Services, External Trade, Service Exports and Imports. 7 It is important to note, however, that as much of the data is collected on an annual basis the data may not capture the most recent cost developments.
NCC Costs of Doing Business in Ireland 2011 8 June 2011
Where costs have decreased, these have largely been as a result of the cyclical rather than
structural factors. There is a danger that if structural barriers preventing costs from adjusting
are not removed, once an economic recovery kicks in, recent competitiveness gains will be
rapidly eroded. For instance, while the cost of industrial electricity for large energy users in
Ireland decreased significantly (-27%) in 2010, these welcome price falls were largely the result
of cyclical factors - the steep decline in global fuel prices (gas and coal) and temporary national
subsidies which are to be phased out by the end of 2012. As such, lower prices are unlikely to be
sustainable into the medium term without more fundamental policy reform.
Changes in cost and price competitiveness depend not only on cost and price trends but also on
exchange rate movements. Exchange rates are volatile and not under our control. In order to
improve cost competitiveness we should concentrate on cost factors that can be influenced
domestically.
The importance of Various Costs to Enterprise - Sectoral Cost Profiles
According to KPMG analysis, a large proportion of costs for service sectors (89 percent) and
research and development centres (87 percent) are location sensitive – these are the costs over
which Ireland has most influence8. In manufacturing sectors, 44 percent of costs are determined
locally, while the majority of costs (e.g. raw materials, capital goods) are largely set on world
markets.
For manufacturing sectors, the contribution of labour costs to total location sensitive costs
varies from 45 percent in the plastic sector to 56 percent in the medical devices sector.
Transport and utilities are also a significant cost input for a number of manufacturing sectors.
Within service sectors, labour costs account for 74 percent of total location sensitive costs.
Taxes and property leasing costs are significant for service operations.
For R&D sectors, 70 percent of total location sensitive costs are accounted for by labour. The
leasing of property is a major cost element across all benchmarked R&D sectors.
Labour Costs
Labour costs are the largest single location sensitive cost component for services (83 percent)
R&D (80 percent) and manufacturing (52 percent) operations.
Labour cost growth rates in Ireland slowed significantly in 2008 and the first half of 2009. Over
this period, growth rates were lower than the EU-27 and euro area-16 average growth rates.
Total labour costs include wages, taxes on income and employer and employee social security
contributions. Ireland has the tenth highest total labour costs level in the OECD and is in line
with a number of western European countries (Figure 3.2). Ireland has the fifth highest net
wage level in the OECD-28, 35.5 percent above the OECD-28 average. This is a result, in part, of
Ireland’s low (but increasing) tax wedge on labour.
8 KPMG, Competitive Alternatives, 2010
NCC Costs of Doing Business in Ireland 2011 9 June 2011
During 2010, Ireland experienced a more pronounced decline in ULC (-4.4%) relative to the
OECD-25 (-0.46%) and the euro area-14 (0.85%), indicating an improvement in competitiveness
(Figure 3.4).
Ireland has the second highest statutory monthly minimum wage (€1,462) amongst the countries
benchmarked (although Ireland’s rate is actually set in terms of an hourly rate of €8.65). The
minimum wage is more prevalent in certain sectors, notably in hotels and restaurants,
wholesale and retail and other locally traded service industries.
The NCC has developed a number of recommendations designed to ensure that the labour
market operates in a manner which supports both competitiveness and employment – they are
designed to ensure that the labour market adjusts in an efficient and timely manner and so that
wage developments reflect economic developments.
Labour Market Recommendations Ireland needs to maintain incentives to stay in or return to the labour market, and to encourage employment growth. Given Ireland’s large debt burden which has arisen as a result of the property collapse,
economic recession, and bank bailout, it is inevitable that taxes will rise further. The required increases are likely to have a further impact on domestic demand which has already been adversely affected by recent policy changes. The proportion of employment supported by the domestic activity has fallen from 50 percent in 2007 to 40 percent in 2011, largely as a result of the collapse in consumption. In addressing the fiscal and labour market challenges which confront us, the Government must be cognisant of the impact of its actions on domestic demand. The key is to ensure that additional taxation measures are designed to protect job creation and facilitate a recovery in consumer demand. A competitive tax wedge is vital to encourage employment growth across all income categories and to incentivise people to remain in or return to the labour market.
High replacement ratios between social welfare and net pay for employment weaken the incentives to return to the labour force. A major challenge exists to protect those on low incomes and social welfare benefits while ensuring that incentives to remain in or return to the labour market are strengthened and that businesses are incentivised to take on additional staff.
While the steep rise in unemployment has affected people across society, those with lower
educational attainment are more likely to be unemployed. There are risks of workers disengaging
from the labour force as they experience long term unemployment. We need to ensure that the
education and training system delivers for the unemployed and workers in vulnerable sectors.
Activation: Activation measures aimed at improving the employability of unemployed persons by providing ‘progression pathways’ of relevant job search, training, education and employment opportunities for different target groups.
Participation: Ensuring that the training and education needs of target groups such as young unemployed, those previously employed in sectors most affected by restructuring, long term unemployed, older workers and women returners are provided for through enterprise relevant programmes.
Upskilling: Boosting our human capital by enhancing education and skills levels in line with the National Skills Strategy is essential to meet the needs of the Smart Economy and the need to improve productivity.
NCC Costs of Doing Business in Ireland 2011 10 June 2011
Property Costs
The value of commercial properties in Ireland peaked in Q4 2007. Since 2008, property prices
have been in a steep decline. The value/ cost of retail properties fell by 29 percent, offices by
28 percent, and industrial premises by 27 percent between Q4 2008 and Q4 2009.
The cost of constructing and renting both industrial and office units declined sharply in Ireland
during 2010. However, in relative terms, the impact of these decreases on Irish cost
competitiveness has been reduced as there have also been significant cost decreases in many
other countries.
In terms of commercial office space in Dublin, the vacancy rate rose from 5 percent in 2000 to
15 percent on average between 2002 and 2008. Take up of office space peaked in 2006-08,
before dropping back suddenly as demand fell. This increased the vacancy rate and now nearly
one in four square metres of space in the Dublin office market is vacant.
The industrial market in Dublin went through a similar pattern as the office market. In the case
of the industrial market, however, the vacancy rate began to rise earlier – in 2006 – and now
stands at almost 25 percent.
The NCC has examined the key drivers of commercial property prices over recent years. Based
on this analysis, a series of recommendation to improve the efficiency of the market are
proposed. These recommendations focus on three main objectives:
(i) Providing certainty to all stakeholders about the long term viability of the commercial
property market;
(ii) Reinvigorating the commercial property market in Ireland in the short term - despite
recent negative experiences, a properly functioning property market is a vital part of
any vibrant economy; and
(iii) Supporting sustainable development over a longer time horizon.
NCC Costs of Doing Business in Ireland 2011 11 June 2011
Property Recommendations
To provide certainty about the long term viability of the commercial property market, the
NCC recommends that:
NAMA should provide more information on:
(i) The loans that it has acquired and how it proposes to deal with unfinished developments, as well as its criteria for future provision of development finance.
(ii) How NAMA assets will be disposed of - an orderly programme of disposals and interventions is desirable – in essence, this means that properties should brought to the market on a phased basis over the course of the next few years.
A lack of information is creating uncertainty. The Property Services Regulatory Authority should collect data on both purchasing and leasing relating to (1) Price (2) Quantity (e.g. floor space) (3) Quality (e.g. location, finish) for commercial and residential property.
To reinvigorate the property market in Ireland in the short term, the NCC recommends that:
A broadly based and equitable valuation based residential property tax should be introduced as quickly as possible. This would represent a shift away from transaction based taxation.
The feasibility of introducing legislation to facilitate downward rent adjustments for existing leaseholders should be explored further.
To support sustainable development over a longer time horizon, the NCC recommends that:
Local Authorities develop more robust and transparent charging mechanisms for local
authority charges that match levies with the economic cost of providing development.
A demand led, planned approach is a prerequisite for sustainable development. In all cases,
a demand assessment should be undertaken to inform development plans and zoning.
Other steps to reform planning in Ireland should also be considered, including:
Increasing the population density of Irish cities; and
The rollout of ePlanning.
The rollout of infrastructure projects, which supports sustainable development of
commercial property, should be prioritised such that provision is:
Demand led;
Tackles issues of national or regional importance;
Has an impact that could not be achieved with a different approach or with greater
efficiency of government investment;
Generates value for money, leverage and commercial return; and
The project could not be delivered by another body.
Coordination in the rollout of different infrastructure services should be improved to
maximise efficiency and reduce costs.
NCC Costs of Doing Business in Ireland 2011 12 June 2011
Utility Costs
The cost of industrial electricity for large energy users in Ireland decreased significantly (-27%)
in 2010. Ireland is now the fifth cheapest of the 14 benchmarked countries and costs are lower
than the euro area average. Despite reductions also being recorded for electricity costs for SMEs
in 2010, Ireland remains the fourth most expensive location benchmarked, although the gap
with the euro area average continued to narrow. These reductions, however, would appear to
be temporary in nature – the phasing out of a temporary rebate for large users and global fuel
price changes are likely to result in higher prices in the future.
Ireland is relatively competitive in terms of industrial gas prices and Irish industrial gas prices
were 12 percent below the euro area average in 2010. This is a significant improvement.
The average cost of treated water services in Ireland increased by 0.8 percent between 2010
and 2011. Based on the internationally comparable data (2009 is the most recent data available)
Ireland is competitive with our main trading partners on this measure. Waste water services
increased by 4.1 percent between 2010 and 2011. No internationally comparable data is
available for waste water costs.
Based on 2010 survey data, the average price that could be negotiated for landfill fees in the
Irish market ranged from €86 to €111 per tonne (including the levy). Singapore and New Zealand
are the cheapest location for landfill (Figure 5.5). However, Ireland’s cost competitiveness is
likely to have improved as Irish prices have continued to fall sharply. Massachusetts is the
cheapest location for thermal treatment at a cost of €46 per tonne - Flanders the most
expensive of the benchmarked locations at €110 per tonne (Figure 5.6).
With regard to telecommunications, speed, access and cost are key in determining
competitiveness. Ireland is the eighth most expensive location of the 13 countries benchmarked
for a basket of business calls and is the fourth most expensive for a high usage basket of mobile
calls including VAT.
The NCC recommendations are primarily focused on the two areas of most concern – energy
costs and waste costs.
NCC Costs of Doing Business in Ireland 2011 13 June 2011
Utilities Recommendations
Significant investment in Ireland’s energy transmission and distribution infrastructure is
planned over the period to 2025 which will be financed through future increases in
electricity prices. This investment will enable renewable technologies to connect to the
grid and to ensure that key regional centres can support energy intensive investment
projects. Given reduced levels of economic activity, the NCC believes that potential
exists to extend delivery over a longer period of time and delay projects which are no
longer justified by projected demand growth.
The NCC recommends that subsidies for peat generated electricity should be phased out
due to the cost implications for electricity customers (estimated by the Commission for
Energy Regulation to add 5 percent to all bills in 2010/2011) and the impact on the
environment.
The NCC recommends that the existing REFIT scheme should be revised so that the price
supports are transitional as they are for other technologies, with decreasing support
levels over time to address cost competitiveness concerns. In addition, the price support
should be changed from a fixed guaranteed price to a premium on the wholesale price.
The premium should be subject to a cap to protect customers in the event of high fossil
fuel prices.
Applying much higher - or new - waste levies will increase the costs of doing business
further, particularly for those in manufacturing (in key sectors such as food and
pharmaceuticals). Increases in the landfill levy should reflect the pricing of externalities
(i.e. putting a price on environmental and other damage caused by landfill).
The NCC recommends that a waste-to-energy levy should not be considered until a
competitive waste-to-energy market is established here.
A volumetric levy on incineration levels should not be introduced as it stands to inhibit
economies of scale which are essential to bringing Irish waste costs more into line with
our competitors. Such a cap would also run counter to the internationally accepted
waste management hierarchy.
The NCC supports the introduction of user charges for consumers (e.g. water charges for
households) which broaden the tax base.
NCC Costs of Doing Business in Ireland 2011 14 June 2011
Business and Professional Service Costs
For many professional and business service sectors, only limited price data is available.
The Services Producer Price Index (SPPI) shows that the costs of selected services in Ireland are
now 0.7 percent above 2006 levels9. This contrasts with the experience in other EU states
examined, where the costs of these services have increased significantly relative to 2006 prices
- the UK (+10.1%), Netherlands (+6.6%), Finland (+13%) and Sweden (+7.8%).
Over the course of the economic downturn, four of the five business and professional sectors
examined have shown substantial corrections in prices. Furthermore, where downward
adjustments have taken place, the scale of these adjustments has outpaced that of any other
country examined. Since 2006, however, the index indicates that legal services prices increased
by 12 percent10. World Bank data also indicates that Irish legal cost compare poorly to those in
other countries.
Data from the Harmonised Index of Consumer Prices shows that insurance costs also increased
by 34 percent between 2006 and 2011.
While price moderation has occurred in a range of business services, in many cases Irish prices
are coming down from a high base (e.g. World Bank data has found that the cost of enforcing a
legal contract are third highest amongst the 19 countries benchmarked). Further price
reductions are required if Ireland is to achieve sustainable and enduring price competitiveness.
In policy terms, the NCC has focused on those sectors where prices remain high despite the
recession. Recommendations relate to issues such as barriers to competition, market structure,
and consumer empowerment.
9 The Services Producer Price Index (SPPI) is an experimental survey by the CSO which measures changes in the average prices charged by domestic service producers to other businesses for a selected range of services. In most cases these services are provided to business customers only and so individual price indices should not be considered indicative of more general price trends in the economy. The index covers transaction costs from business to business and excludes consumers who are covered in the Consumer Price Index (CPI). Similar indices are produced by the national statistics offices of several other EU member states allowing for a degree of comparison. 10 SPPI Q4 2010 data on legal services is based on responses received from 18 companies and covers 118 price observations. The majority of firms that responded employ between 10 and 49 employees. The survey does not include data on prices for barrister services. Given the small sample size used to create the sub-indices for accountancy and legal costs caution should be used when analysing the results.
NCC Costs of Doing Business in Ireland 2011 15 June 2011
Business and Professional Service Recommendations The regulation of a sector influences the manner in which prices in that sector can accurately adjust to market forces. In this regard, the NCC recommends that:
No professional body should be allowed to restrict the number of entrants into that
profession;
Independent regulation is generally preferable to self-regulation. This would not preclude
members of professional bodies from being represented as a minority on any regulatory
body;
Where possible, a variety of pro-competitive mechanisms should be used instead of
traditional restrictive rules (e.g. requiring the publication of historical or survey-based price
information is a less restrictive mechanism rather than regulatory price controls).
Competition Policy
Anti-competitive practises keep prices artificially high. The Government has a role to play in
ensuring that competition policy facilitates market operation. Good competition policy must
work in tandem with strong regulations in economic, social and environmental policy. To deliver
pro-active competition policies, the NCC recommends that:
Government Departments should be formally required to consider and respond to
recommendations of the Competition Authority in a timely manner, with specific timelines set down for such consideration and implementation of such recommendations, as appropriate. The Department of Enterprise, Jobs and Innovation should co-ordinate a report to Government on each Department’s response to recommendations of the Competition Authority.
Data on Professional Services
Ensuring that robust and internationally comparable price data is available is essential to
understand the operation of the professional services sector. Given the importance of this
sector, the CSO should continue to work with stakeholders to further develop the Services
Producer Price Index, and to develop comparable data on price levels.
NCC Costs of Doing Business in Ireland 2011 16 June 2011
Sector Specific Recommendations – Legal Services
NCC recommendations on legal services draw extensively on the work of the Competition
Authority and the Legal Costs Working Group. Greater detail can be found from these sources.
(i) Regulation of the Legal Profession
The NCC recommends the establishment of an independent regulator for the legal profession.
This recommendation has also been included in the EU/IMF Programme of Financial Support for
Ireland and the Programme for Government. The NCC recommends that this new body should
incorporate the regulation of training for solicitors and barristers, and would be tasked with
approving those institutions who wish to provide such training.
(ii) Legal Service Costs
The opaque manner in which legal costs are formed and assessed prevents consumers from
understanding the relationship between legal services rendered and final costs. In order to
deliver increased transparency and efficiency to legal services costs the NCC recommends that
a Legal Costs Assessment Office be established to replace the Taxing Master’s Office, as
recommended by the Legal Costs Working Group and echoed in the EU/IMF Programme of
Financial Support for Ireland.
The Legal Costs Assessment Office should have a remit to cover costs arising from all
courts, not just the High and Supreme Courts as is the case currently for the Taxing Master;
Legal costs should be assessed on the basis of work done, rather than on the size of
awards; and
The general practice of allowing junior counsel’s fees at two-thirds that of senior counsel
has been recognised as anti-competitive (e.g., by the Competition Authority). In many
instances, however, the practice continues – this was acknowledged by the Dáil Committee
of Public Accounts in their Third Interim Report on the Procurement of Legal Services.
Parties with responsibility for overseeing legal costs should ensure that the practice is no
longer tolerated.
(iii) Competitive Tendering
The State, as one of the largest consumer of legal services in the economy should ensure that
legal services are subject to the same competition as other services. The NCC recommends
that, where practicable, legal services to be provided to the State by solicitors and barristers
in private practice should be procured in accordance with the guidelines set out by National
Public Procurement Policy Unit (NPPPU), requiring prospective legal service providers to
compete with one another on the basis of cost and quality.
(iv) Structural Reform of the Legal Profession
The NCC recommends considering the creation of a single tier counsel system.
The NCC recommends that solicitors be permitted to act as lead counsel when advocating in court with a barrister.
The NCC recommends that suitably qualified professionals, in addition to solicitors, be allowed to provide conveyancing services.
NCC Costs of Doing Business in Ireland 2011 17 June 2011
Indirect Business Costs
A comparison of consumer costs between a number of major international cities indicates that
Dublin’s cost competitiveness improved between 2009 and 2010 as the city moved from sixth
most expensive to ninth most expensive location amongst 18 benchmarked cities.
Following a period of significant increase, the consumer price index peaked in 2008 when prices
were 28 percent above 2001 prices. Since then the index has fallen and prices in February 2011
were 4.5 percent below the peak level. However, the pace of decline in the consumer price
index slowed towards the end of 2010 and increased in February and March 2011.
Between February 2010 and February 2011, Ireland experienced a 0.9 percent increase in the
harmonised index of consumer prices (HICP), the smallest increase in the European Union.
During the same period the euro area HICP increased by 2.4 percent.
Ireland is an expensive location for purchasing groceries. For a comparable basket of food and
non-alcoholic beverages in 2009, Ireland ranks as the second most expensive European country,
19.4 percent above the euro area-16 average.
Sector Specific Recommendations – Insurance Services
The NCC supports the recommendations contained in the 2005 report on non-life insurance
by the Competition Authority. While a substantial number of Competition Authority
recommendations have been accepted by Government, a small number of
recommendations relating to the collection and publication of insurance related data
remain outstanding. The NCC recommends that insurance related data be published in
accordance with the recommendations set out in the 2005 Competition Authority Report.
This would deliver transparency to the market and prevent rigidities that arise as a result
of asymmetric information.
Sector Specific Recommendations – Legal Services (Continued)
(v) Empowering the Consumer
There a number of actions which could be used to empower the consumer and thus address
inefficiencies in the market and allow prices to adjust in response to wider economic
conditions and price movements elsewhere.
The current restrictions which prevent consumers from switching solicitors should be
abolished;
Individual consumers and enterprises should be allowed to directly access legal advice
from barristers – access to such advice is currently restricted by the Bar Council; and
Both solicitors and barristers should be required to issue detailed and meaningful fee
and/or fee estimate letters to prospective clients.
(vi) Procedural Reform
The procedural reforms recommended by the Legal Cost Working Group are designed to make
the operation of the courts more efficient and to reduce cost, and so should be implemented.

NCC Costs of Doing Business in Ireland 2011 18 June 2011
In 2005, health and education cost indices (which are influenced by public sector policy, but
which contain significant private sector elements) were 15 percent above the overall CPI.
Despite falls in the overall CPI in 2010, prices for both health and education continued to rise.
In March 2011, they were 28 and 35 percent higher than the CPI respectively.
Reductions in the cost of living are essential if real incomes are to be maintained. While Ireland has
already regained some cost competitiveness, further progress is required if Ireland is to return to
strong economic and employment growth. There are also risks which threaten to undermine recent
competitiveness gains – the CPI suggests that domestically driven inflation is on the rise, global oil
prices have increased, EU interest rates seem certain to increase further over the coming months,
and sterling is likely to remain weak for the foreseeable future.
It is difficult for small open economies, particularly those that share a currency with larger regions,
to control their rate of price inflation, as this is, to a significant degree, determined by events
outside domestic control. Nonetheless, as noted throughout this report, there are a number of
policy levers available to Government which can be used to restore Ireland’s cost competitiveness.
Implementation of these recommendations would represent a major step in ensuring Ireland’s
future competitiveness and prosperity.
NCC Costs of Doing Business in Ireland 2011 19 June 2011
1. Introduction
Generating sustainable broad based export-led growth is essential to rebuilding our economy. In
order to deliver growth, policies need to facilitate the convergence of Irish business costs towards
the levels of our trading partners. In the absence of a currency devaluation policy lever to manage
cost competitiveness pressures, the policy focus needs to be on achieving enhanced competitiveness
through cost reductions in key business inputs and productivity growth11. While painful in the short
term, the alternative is a prolonged period of weak or negative growth, high unemployment and
emigration.
The NCC has benchmarked Ireland’s cost competitiveness for a number of years. This year’s report,
however, goes beyond the benchmarking exercise of previous editions, and addresses three key
issues:
1. How does Ireland compare on key business input costs?
2. Are the markets for various business input costs functioning efficiently?
3. What actions are required to improve cost competitiveness?
1.1 Overview of Ireland’s Cost Competitiveness
Defining national cost competitiveness is complex. National competitiveness is a broad concept that
encompasses a diverse range of factors and policy inputs including education and training,
entrepreneurship and innovation, Ireland’s economic and technological infrastructure and the
taxation and regulatory framework. An economy is under-competitive in cost terms, if the levels of
prices and wages are sufficiently high to generate an increase in the unemployment rate and/or
capital disinvestment’12.
Strong domestic growth in recent years created conditions which led to significant increases in the
costs of doing business in Ireland. Key business inputs such as pay and incomes, rents, utilities and
business services rose sharply for an extended period. Ireland’s national cost competitiveness has
improved since 2008 because of favourable exchange rate movements and downward price
adjustments within the Irish economy.
As illustrated in Figure 1.1, Ireland experienced a 31 percent loss in cost competitiveness (real
Harmonised Consumer Index (HCI)) between February 2002 and April 2008. This represents the peak
of the boom in price levels.
11 Productivity growth is the preferred mechanism to improve competitiveness as it can support cost competitiveness in tandem with high and increasing wage levels. Many firms, however, may have limited opportunities to increase value added significantly in the short term. The more productive the labour force and the capital stock are, the higher the level of wages that is consistent with a state of “price and wage” competitiveness. This illustrates the importance of skills development, innovation, infrastructure, etc. in the longer term. 12 According to Lane, price and wage competitiveness can be defined as ‘a state in which medium term full employment is achieved and the return on capital matches the global risk-adjusted cost of capital”. See Lane, P., Assessing Ireland’s Price and Wage Competitiveness, National Competitiveness Council, Forfás 2004
NCC Costs of Doing Business in Ireland 2011 20 June 2011
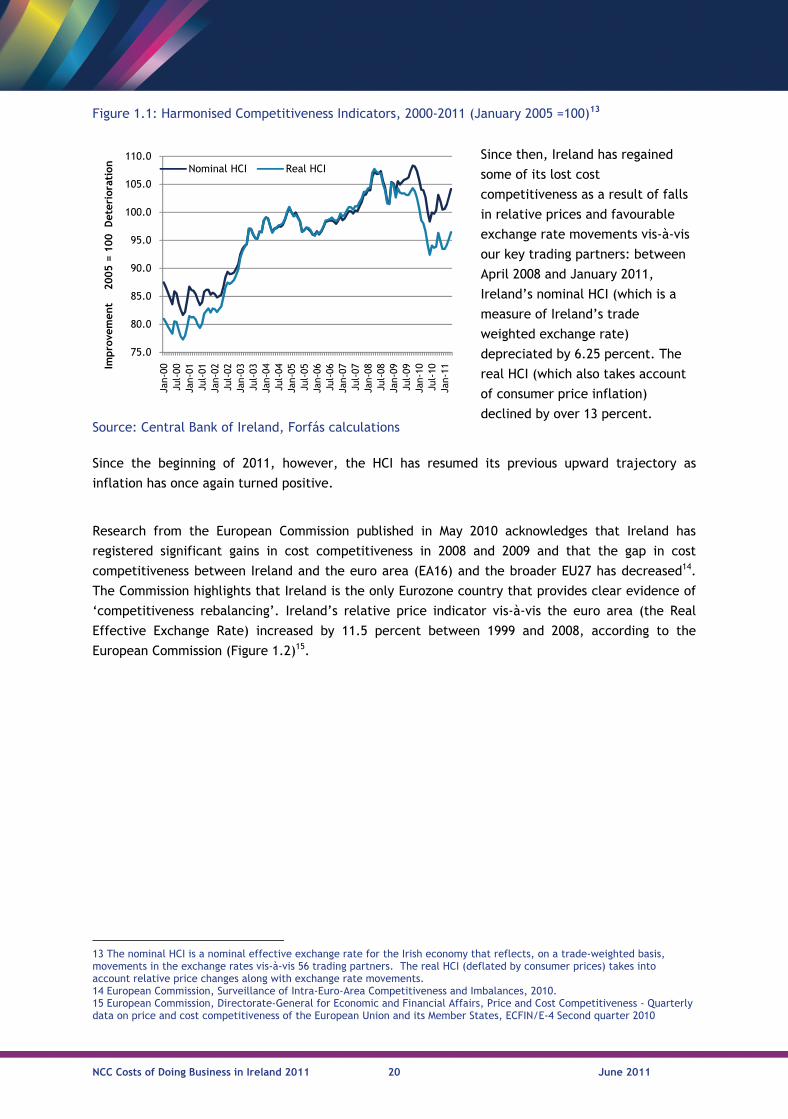
Figure 1.1: Harmonised Competitiveness Indicators, 2000-2011 (January 2005 =100)13
Since the beginning of 2011, however, the HCI has resumed its previous upward trajectory as
inflation has once again turned positive.
Research from the European Commission published in May 2010 acknowledges that Ireland has
registered significant gains in cost competitiveness in 2008 and 2009 and that the gap in cost
competitiveness between Ireland and the euro area (EA16) and the broader EU27 has decreased14.
The Commission highlights that Ireland is the only Eurozone country that provides clear evidence of
‘competitiveness rebalancing’. Ireland’s relative price indicator vis-à-vis the euro area (the Real
Effective Exchange Rate) increased by 11.5 percent between 1999 and 2008, according to the
European Commission (Figure 1.2)15.
13 The nominal HCI is a nominal effective exchange rate for the Irish economy that reflects, on a trade-weighted basis, movements in the exchange rates vis-à-vis 56 trading partners. The real HCI (deflated by consumer prices) takes into account relative price changes along with exchange rate movements. 14 European Commission, Surveillance of Intra-Euro-Area Competitiveness and Imbalances, 2010. 15 European Commission, Directorate-General for Economic and Financial Affairs, Price and Cost Competitiveness - Quarterly data on price and cost competitiveness of the European Union and its Member States, ECFIN/E-4 Second quarter 2010
Source: Central Bank of Ireland, Forfás calculations
Since then, Ireland has regained
some of its lost cost
competitiveness as a result of falls
in relative prices and favourable
exchange rate movements vis-à-vis
our key trading partners: between
April 2008 and January 2011,
Ireland’s nominal HCI (which is a
measure of Ireland’s trade
weighted exchange rate)
depreciated by 6.25 percent. The
real HCI (which also takes account
of consumer price inflation)
declined by over 13 percent.
75.0
80.0
85.0
90.0
95.0
100.0
105.0
110.0Ja
n-00
Jul-
00Ja
n-01
Jul-
01Ja
n-02
Jul-
02Ja
n-03
Jul-
03Ja
n-04
Jul-
04Ja
n-05
Jul-
05Ja
n-06
Jul-
06Ja
n-07
Jul-
07Ja
n-08
Jul-
08Ja
n-09
Jul-
09Ja
n-10
Jul-
10Ja
n-11Im
pro
vem
ent
2
005 =
100
Det
erio
rati
on Nominal HCI Real HCI
NCC Costs of Doing Business in Ireland 2011 21 June 2011
It is important to determine if progress to date is sufficient to restore competitiveness and whether
further adjustments are necessary. European Commission research suggests that the Irish real
effective exchange rate (REER) or HCI remains approximately six percent overvalued or overpriced –
though it highlights that this figure should be treated as approximate16. Similar assessments from
the European Central Bank and the IMF estimate that Ireland’s real exchange rate is overvalued by
between four to fifteen percent17. Therefore, despite significant progress to date, Ireland still has
some way to go to achieve cost competitiveness relative to our key trading partners and to generate
a rapid improvement in employment and investment levels.
Further, recent price falls in Ireland are largely a cyclical response to the Irish and international
recession (e.g. reduced demand, spare capacity, falling interest rates, falling fuel and food prices)
rather than a response to structural changes in the Irish economy. While weak economic growth
continues to moderate inflation in Ireland, structural or policy induced changes are necessary to
ensure that prices do not escalate and erode competitiveness when the Irish economy returns to
growth.
1.2 What Drives Costs?18
As a result of the long economic boom and credit fuelled bubble, costs have overshot. During a
boom, it can be expected that prices and costs will increase. Wealthy countries are generally
expensive countries. The high rate of domestic price inflation in Ireland in recent years partly
relates to convergence in average Irish and European price levels due to faster economic growth in
Ireland. Higher inflation due to this ‘convergence effect’ is not, in itself, a major concern,
16 European Commission, Surveillance of Intra-Euro-Area Competitiveness and Imbalances, 2010. 17 ECB, IMF 2009 Article IV Ireland Consultation and European Commission Quarterly Report on the Euro Area Volume 8, No.1 (2009) 18 This section is largely based on research conducted by Philip Lane, Trinity College Dublin for the National Competitiveness Council in 2004.
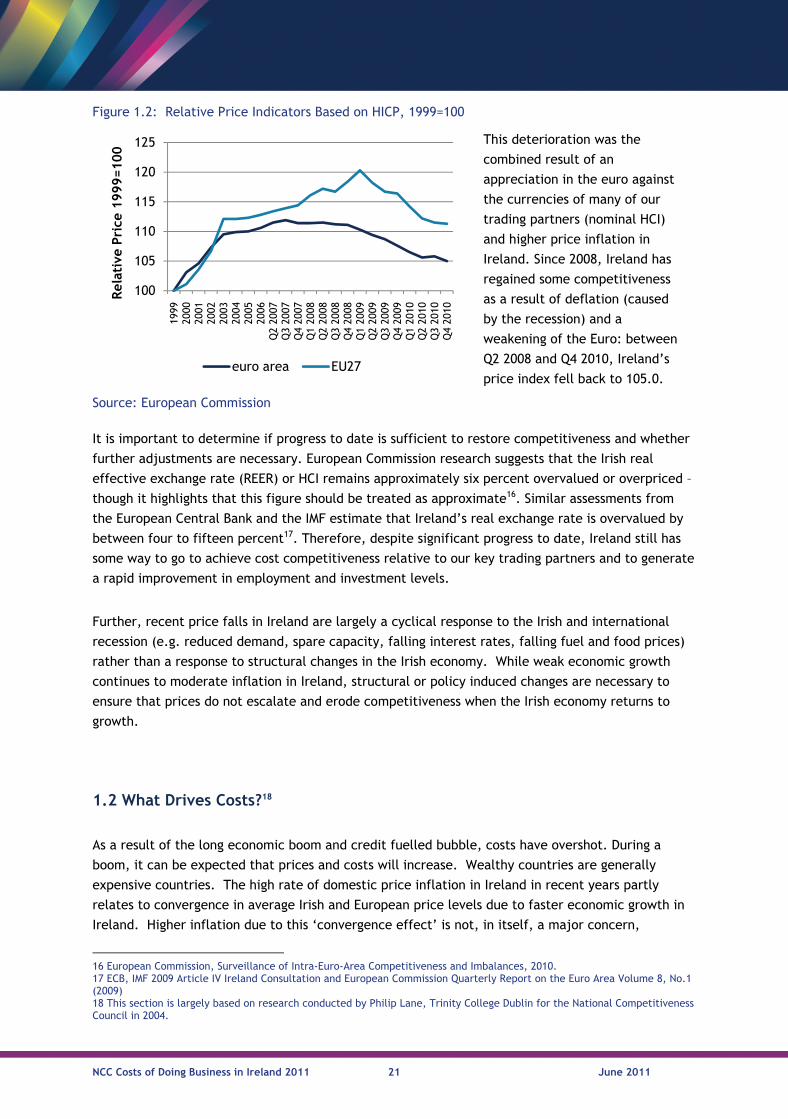
Figure 1.2: Relative Price Indicators Based on HICP, 1999=100
This deterioration was the
combined result of an
appreciation in the euro against
the currencies of many of our
trading partners (nominal HCI)
and higher price inflation in
Ireland. Since 2008, Ireland has
regained some competitiveness
as a result of deflation (caused
by the recession) and a
weakening of the Euro: between
Q2 2008 and Q4 2010, Ireland’s
price index fell back to 105.0.
Source: European Commission
100
105
110
115
120
125
1999
2000
2001
2002
2003
2004
2005
2006
Q2
2007
Q3
2007
Q4
2007
Q1
2008
Q2
2008
Q3
2008
Q4
2008
Q1
2009
Q2
2009
Q3
2009
Q4
2009
Q1
2010
Q2
2010
Q3
2010
Q4
2010
Rel
ativ
e Pri
ce 1
999=100
euro area EU27
NCC Costs of Doing Business in Ireland 2011 22 June 2011
reflecting a natural rise in the cost of domestic services justified by higher incomes and living
standards19. Analysis by the European Commission, however, has found that even allowing for
Ireland’s relatively high level of GDP per capita, the price level in Ireland prior to the current crisis
had been relatively high in comparison with other euro area economies (see Figure 7.1)20. In GNP
per capita terms (where net factor incomes from the rest of the world are excluded), Irish price
levels were even more out of line compared with the benchmarked countries. Factors contributing
to the rise in costs that are of greater concern from a competitiveness perspective are:
Economic overheating caused by pro-cyclical fiscal policy (fast growth in public spending and tax cuts) while euro area interest rates were low;
Rapid credit growth and the unsustainable boom in the construction industry;
The circular impact of rapid house price inflation on wage growth; and
Regulatory and other restrictions to competition as outlined in various Competition Authority reports.
Despite recent falls in the costs of doing business, we are concerned that the readjustment is, in
some cases, occurring too slowly due to a range of barriers.
1.3 High Costs Damage Enterprise Development and Growth
A high cost environment impacts on enterprise development21 across a range of areas:
FDI Enterprise Base: A wide range of factors, including cost competitiveness contribute to our
attractiveness in winning and retaining overseas investment. Despite relatively strong
productivity growth in many sectors and the containment of unit labour costs, the profile of FDI
projects that Ireland has traditionally won has changed (e.g. the labour intensity of investment
projects).
Indigenous Enterprise Base: The performance of our indigenous exports is heavily dependent on
our competitiveness vis-à-vis the UK22. Ireland’s higher cost base and the appreciation of the
euro against sterling in 2009 placed the food and drink sector under extreme pressure both at
home, in the UK and in third markets where Irish produce competes with UK produce. The euro
has since depreciated somewhat against sterling in 2010 and 2011. Looking to the future, the
19 In an economy catching up with its richer neighbours, labour productivity tends to rise faster in sectors producing internationally tradable goods (particularly in capital intensive manufacturing industry) than in those involved in the more labour intensive and generally non-traded service sector. Increases in labour productivity growth in traded manufacturing industries are usually followed by wage growth throughout the economy (both manufacturing and services compete for employees in the same labour market). Thus, a combination of wage growth across both traded and non-traded sectors, but lower labour productivity gains in the services sector, leads to more rapid increases in the cost of services. In this way, services inflation is often higher in those regions of a monetary union enjoying the most rapid growth in productivity and incomes. This is known as the ‘Balassa-Samuelson effect’. 20 Directorate-General for Economic and Financial Affairs, The Economic Adjustment Programme for Ireland, European Economy, Occasional Papers 76, February 2011, pg 14 21 A recent Central Bank article provides a useful assessment of cost competitiveness in Irish manufacturing by developing labour cost competitiveness indicators for four important manufacturing sectors. See O’Brien, D., Assessing the Cost Competitiveness of Irish Manufacturing Sectors, Quarterly Bulletin 02 / April 2011 22 . For example, this is evidenced by a very strong trading relationship with Ireland exporting 44 percent of its estimated €7.12 billion. Bord Bia, Performance and Prospects: Food and Horticulture Export 2009/2010/ 2009 – compiled from preliminary monthly figures from External Trade publication. Includes live animals and excludes beverages and is therefore not a direct comparison with export figure in previous footnote.
NCC Costs of Doing Business in Ireland 2011 23 June 2011
IMF assumptions imply that the sterling/euro exchange rate will average 0.85 in 2010 and 0.83
in 201123.
Sub-Supply Base to Exporters: While internationally trading sectors account for a significant
share of national value added, they represent a much smaller share of national employment.
The more employment intensive locally trading sectors have generally faced significant
increases in a range of costs over recent years. Increases in the broader cost environment
damage the costs competitiveness of exporting firms as they source essential goods and
services. They also reduce the multiplier benefits of export driven growth if internationally
trading firms are driven to source a higher proportion of their raw materials and services
overseas because of high domestic costs24.
At a firm level, high costs encourage companies to minimise the use of expensive resources. This
can make marginal business opportunities unviable which results in lost output and employment. In
cases where high prices are a genuine reflection of market demand and supply (e.g. scarcity), prices
serve an important role in ensuring the best use of scarce resources. However, if prices remain high
(despite the potential availability of resources – labour, property, etc.), enterprise development
and broader economic development are impeded. Unless steps are taken now to address those
factors preventing markets from operating in an optimum manner (i.e. ensuring that prices adjust in
a timely manner to changes in economic conditions), a resumption of economic growth could see
business costs escalate rapidly once again, negating recent cyclical competitiveness gains and
cutting off the recovery.
1.4 Methodology
Chapter 2 uses sectoral cost profiles to assess the importance of various costs to 17 sectors of the
economy. The cost profiles have been developed using KPMG’s Competitive Alternatives 2010
report25. The following cost components are captured:
Labour Costs;
Property (leased facility);
Utilities;
Transport;
Interest and Depreciation;
Total Taxes (net of grants); and
Location Insensitive Costs.
Using the Competitive Alternatives study, the NCC has created indicative cost profiles for a number
of sectors which are of importance to the Irish economy. The profiles provide an indication of the
23 ESRI, Quarterly Economic Commentary, Autumn, 2010 24 This could arise due to Ireland being too expensive or firm levels factors such as the centralisation of procurement and a lack of strong linkages to the local market and/or structural change towards sectors with a lower need for domestic inputs. From 2000-2008, the share of raw material and services purchases by foreign owned manufacturing and international services firms in Ireland has fallen from 36 percent of purchases to 20 percent. See Forfás, Annual Business Survey of Economic Impact (ABSEI), 2008 25 Ireland is not included in the study. The benchmarked locations are Australia, Canada, France, Germany, Italy, Japan, Mexico, Netherlands, the UK and the US.
NCC Costs of Doing Business in Ireland 2011 24 June 2011
varying importance of the different cost components to individual sectors. However, it should be
noted that the costs structures of individual firms are likely to vary significantly within sectors.
For chapters 3 to 6, internationally comparable unit cost data was collected for Ireland and a
number of key trading partners26. Given that the prices of internationally traded business inputs are
set on world markets (e.g. industrial equipment or commodity raw materials), this report
concentrates on the costs that are largely domestically determined such as labour, property,
energy, water, waste, communications and business services. Where comparable data is available,
costs are compared over time. Where possible, Ireland’s cost levels are compared to a relevant peer
group average, the OECD and euro area average or else compared to as wide a group of countries as
possible. The report uses the most up to date internationally comparative cost data. As much of the
data is collected on an annual basis there may be a time lag in capturing more recent changes in
cost levels. Recent changes in Ireland’s cost environment, which are not captured in the
international data, are reflected in the text where applicable. Finally, Chapter 7 considers the
general cost environment – using data from the Consumer Prices Index and the Harmonised Index of
Consumer Prices.
26 Details of the data sources used in the completion of this report are included in the appendix to this report.
NCC Costs of Doing Business in Ireland 2011 25 June 2011
2. Cost Profiles
This chapter assesses the relative importance of key business inputs across the main exporting
sectors. From a competitiveness perspective, it is essential that public policy focuses on reducing
costs that comprise a significant percentage of business costs (as set out in this chapter) and that
are out of line with those in competitor countries (chapter three to six).
2.1 Summary Cost Profiles27
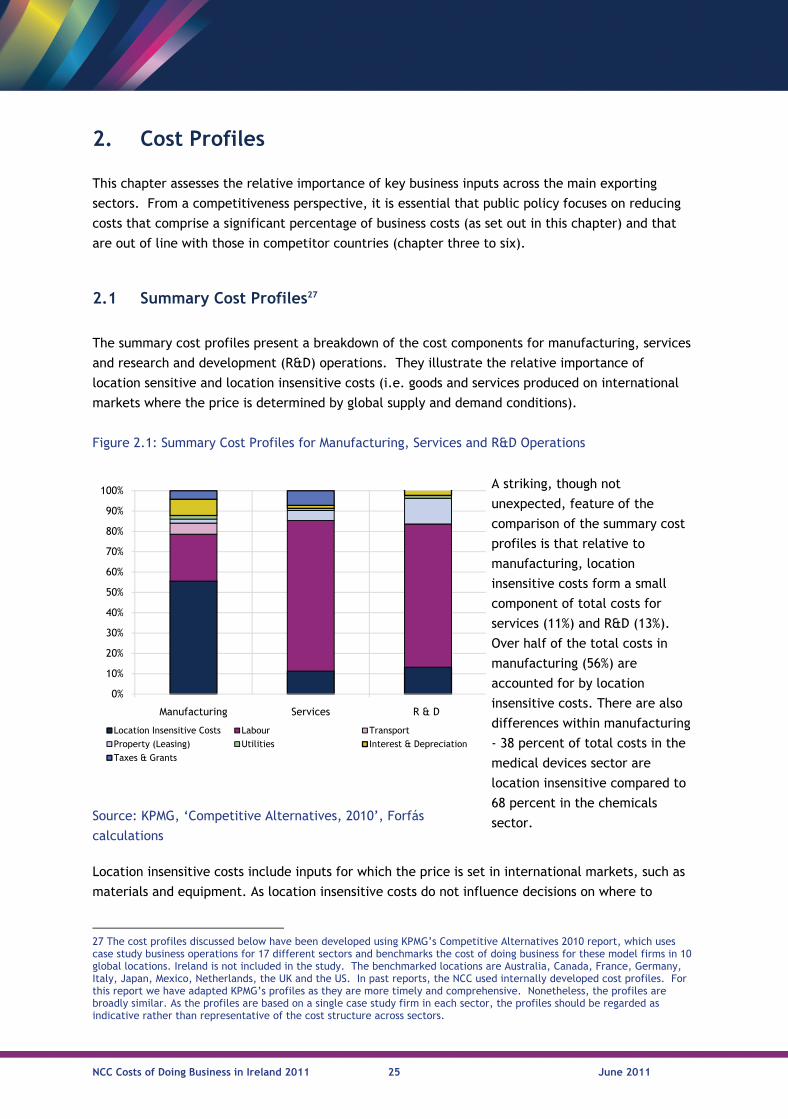
The summary cost profiles present a breakdown of the cost components for manufacturing, services
and research and development (R&D) operations. They illustrate the relative importance of
location sensitive and location insensitive costs (i.e. goods and services produced on international
markets where the price is determined by global supply and demand conditions).
Figure 2.1: Summary Cost Profiles for Manufacturing, Services and R&D Operations
Location insensitive costs include inputs for which the price is set in international markets, such as
materials and equipment. As location insensitive costs do not influence decisions on where to
27 The cost profiles discussed below have been developed using KPMG’s Competitive Alternatives 2010 report, which uses case study business operations for 17 different sectors and benchmarks the cost of doing business for these model firms in 10 global locations. Ireland is not included in the study. The benchmarked locations are Australia, Canada, France, Germany, Italy, Japan, Mexico, Netherlands, the UK and the US. In past reports, the NCC used internally developed cost profiles. For this report we have adapted KPMG’s profiles as they are more timely and comprehensive. Nonetheless, the profiles are broadly similar. As the profiles are based on a single case study firm in each sector, the profiles should be regarded as indicative rather than representative of the cost structure across sectors.
Source: KPMG, ‘Competitive Alternatives, 2010’, Forfás
calculations
A striking, though not
unexpected, feature of the
comparison of the summary cost
profiles is that relative to
manufacturing, location
insensitive costs form a small
component of total costs for
services (11%) and R&D (13%).
Over half of the total costs in
manufacturing (56%) are
accounted for by location
insensitive costs. There are also
differences within manufacturing
- 38 percent of total costs in the
medical devices sector are
location insensitive compared to
68 percent in the chemicals
sector.
0%
10%
20%
30%
40%
50%
60%
70%
80%
90%
100%
Manufacturing Services R & D
Location Insensitive Costs Labour Transport
Property (Leasing) Utilities Interest & Depreciation
Taxes & Grants
NCC Costs of Doing Business in Ireland 2011 26 June 2011
invest, these cost elements have been excluded from the detailed sectoral cost profiles discussed
below28.
2.2 Sectoral Cost Profiles
The following sectoral cost profiles provide an indication of the contribution of various location
sensitive cost components to total costs in a number of key sectors. As the profiles are based on a
single case study firm in each sector, the profiles should be regarded as indicative rather than
representative of the structure of costs across sectors.
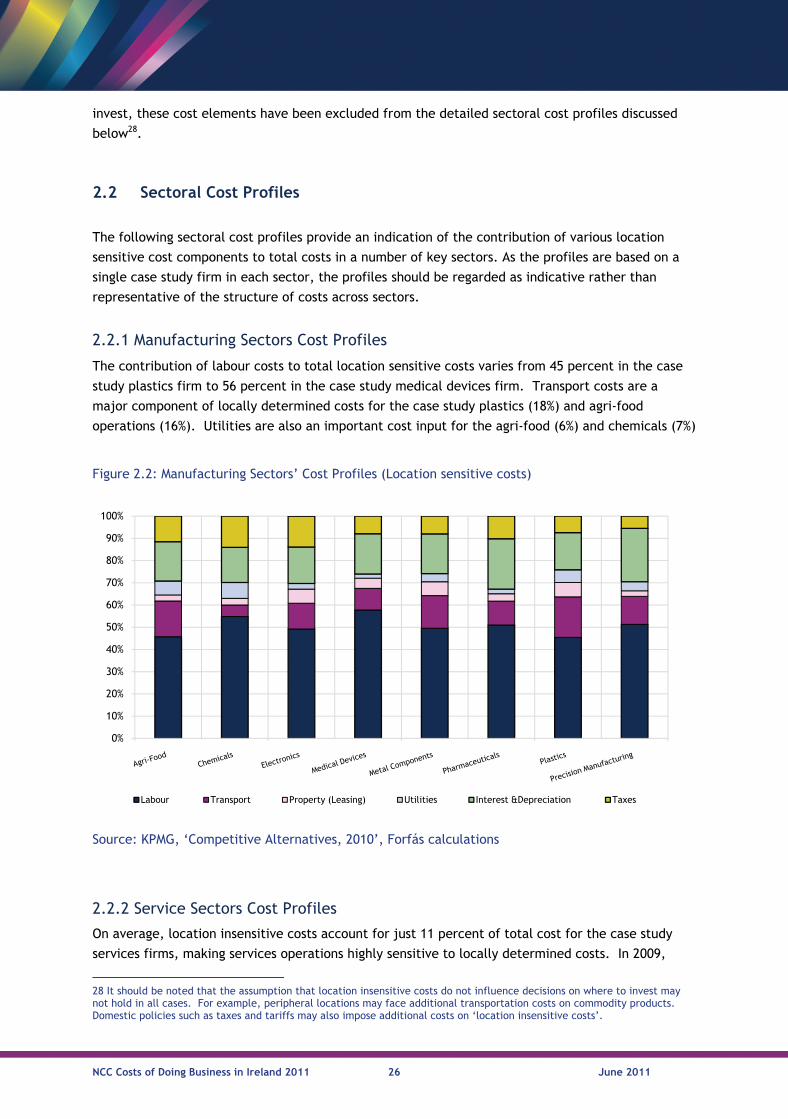
2.2.1 Manufacturing Sectors Cost Profiles
The contribution of labour costs to total location sensitive costs varies from 45 percent in the case
study plastics firm to 56 percent in the case study medical devices firm. Transport costs are a
major component of locally determined costs for the case study plastics (18%) and agri-food
operations (16%). Utilities are also an important cost input for the agri-food (6%) and chemicals (7%)
Figure 2.2: Manufacturing Sectors’ Cost Profiles (Location sensitive costs)
Source: KPMG, ‘Competitive Alternatives, 2010’, Forfás calculations
2.2.2 Service Sectors Cost Profiles
On average, location insensitive costs account for just 11 percent of total cost for the case study
services firms, making services operations highly sensitive to locally determined costs. In 2009,
28 It should be noted that the assumption that location insensitive costs do not influence decisions on where to invest may not hold in all cases. For example, peripheral locations may face additional transportation costs on commodity products. Domestic policies such as taxes and tariffs may also impose additional costs on ‘location insensitive costs’.
0%
10%
20%
30%
40%
50%
60%
70%
80%
90%
100%
Labour Transport Property (Leasing) Utilities Interest &Depreciation Taxes
NCC Costs of Doing Business in Ireland 2011 27 June 2011
services exports accounted for 47 percent of total Irish exports compared to 25 percent in 200129.
Given the increasing importance of services exports to the Irish economy, ensuring Ireland is a cost
competitive environment for firms in the services sector to do business should be a policy priority.
Location insensitive costs have been eliminated from Figure 2.3.
29 CSO Balance of Payment March, 2010
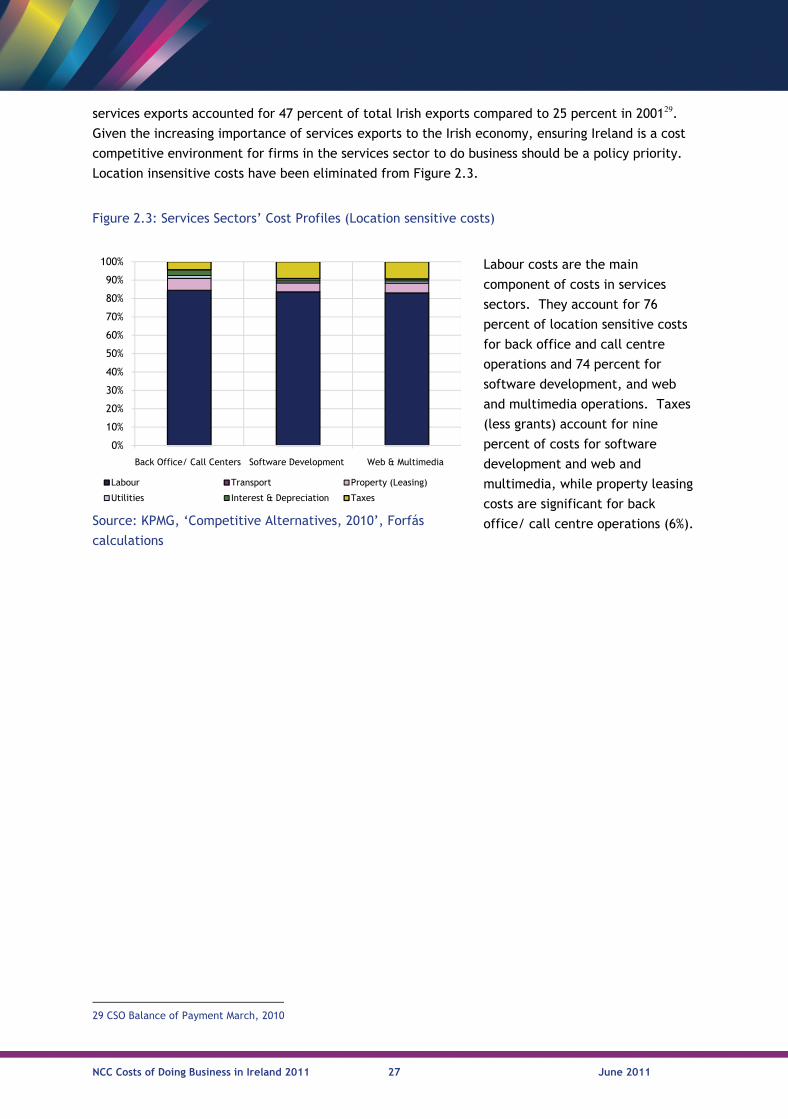
Figure 2.3: Services Sectors’ Cost Profiles (Location sensitive costs)
Source: KPMG, ‘Competitive Alternatives, 2010’, Forfás
calculations
Labour costs are the main
component of costs in services
sectors. They account for 76
percent of location sensitive costs
for back office and call centre
operations and 74 percent for
software development, and web
and multimedia operations. Taxes
(less grants) account for nine
percent of costs for software
development and web and
multimedia, while property leasing
costs are significant for back
office/ call centre operations (6%).
0%
10%
20%
30%
40%
50%
60%
70%
80%
90%
100%
Back Office/ Call Centers Software Development Web & Multimedia
Labour Transport Property (Leasing)
Utilities Interest & Depreciation Taxes
NCC Costs of Doing Business in Ireland 2011 28 June 2011
2.2.3 R&D Sectors Cost Profiles
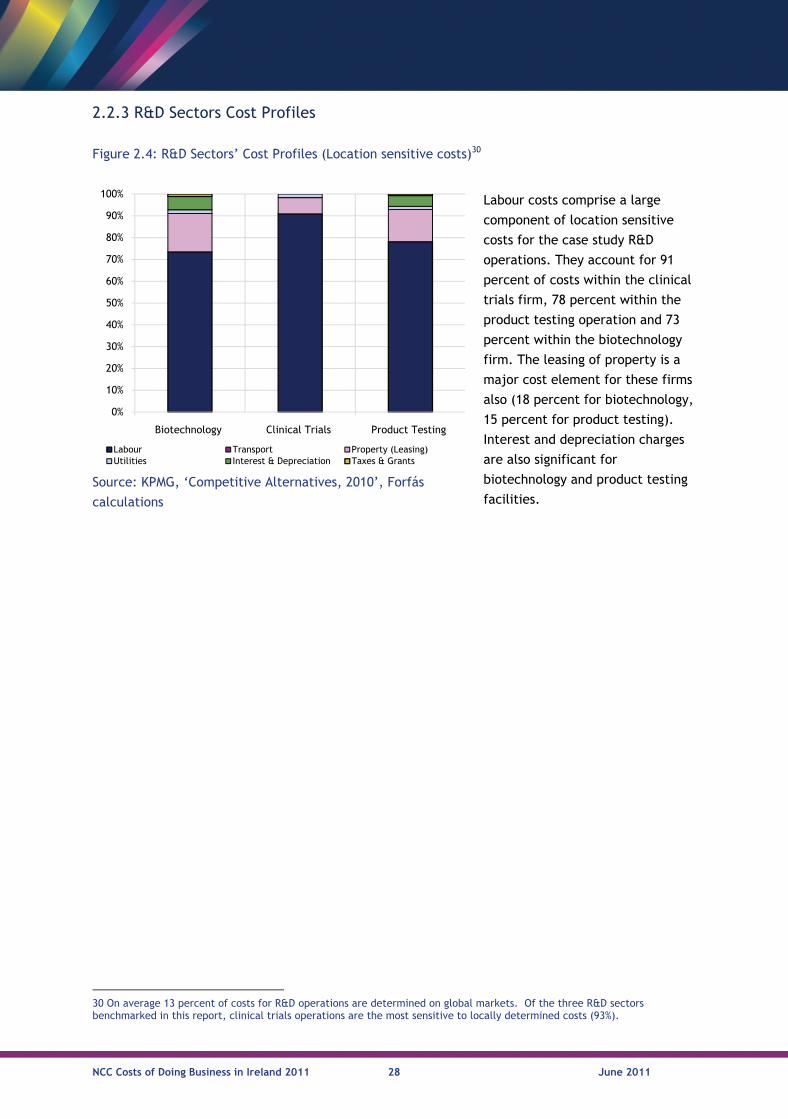
30 On average 13 percent of costs for R&D operations are determined on global markets. Of the three R&D sectors benchmarked in this report, clinical trials operations are the most sensitive to locally determined costs (93%).
Figure 2.4: R&D Sectors’ Cost Profiles (Location sensitive costs)30
Source: KPMG, ‘Competitive Alternatives, 2010’, Forfás
calculations
Labour costs comprise a large
component of location sensitive
costs for the case study R&D
operations. They account for 91
percent of costs within the clinical
trials firm, 78 percent within the
product testing operation and 73
percent within the biotechnology
firm. The leasing of property is a
major cost element for these firms
also (18 percent for biotechnology,
15 percent for product testing).
Interest and depreciation charges
are also significant for
biotechnology and product testing
facilities.
0%
10%
20%
30%
40%
50%
60%
70%
80%
90%
100%
Biotechnology Clinical Trials Product Testing
Labour Transport Property (Leasing)Utilities Interest & Depreciation Taxes & Grants
NCC Costs of Doing Business in Ireland 2011 29 June 2011
3. Labour Costs
3.1 Summary
As discussed in chapter 2, labour costs are the most significant location sensitive cost for all sectors.
The core objective of enhancing competitiveness, however, is to provide Ireland’s people with the
opportunity to improve their living standards and quality of life31. This section examines trends in
relative labour costs, unit wage costs, and tax wedges across a range of countries. Professional fees
also represent a form of remuneration or wages. Given the impact which these fees can have on
competiveness, and considering the fact that in some cases, professional fees have not adjusted as
one might have expected, the issue of professional fees is dealt with in greater detail in Chapter 6.
Labour Cost Growth Rates and Unit Labour Costs Labour cost growth rates show the change in the cost of employing workers over time. Ireland’s
growth rates exceeded the EU-15 average between 2004 and 2007. However, growth rates in Irish
labour costs slowed significantly in 2008 and the first half of 2009 and growth rates were lower than
the EU-27 and euro area-16 average (Figure 3.1).
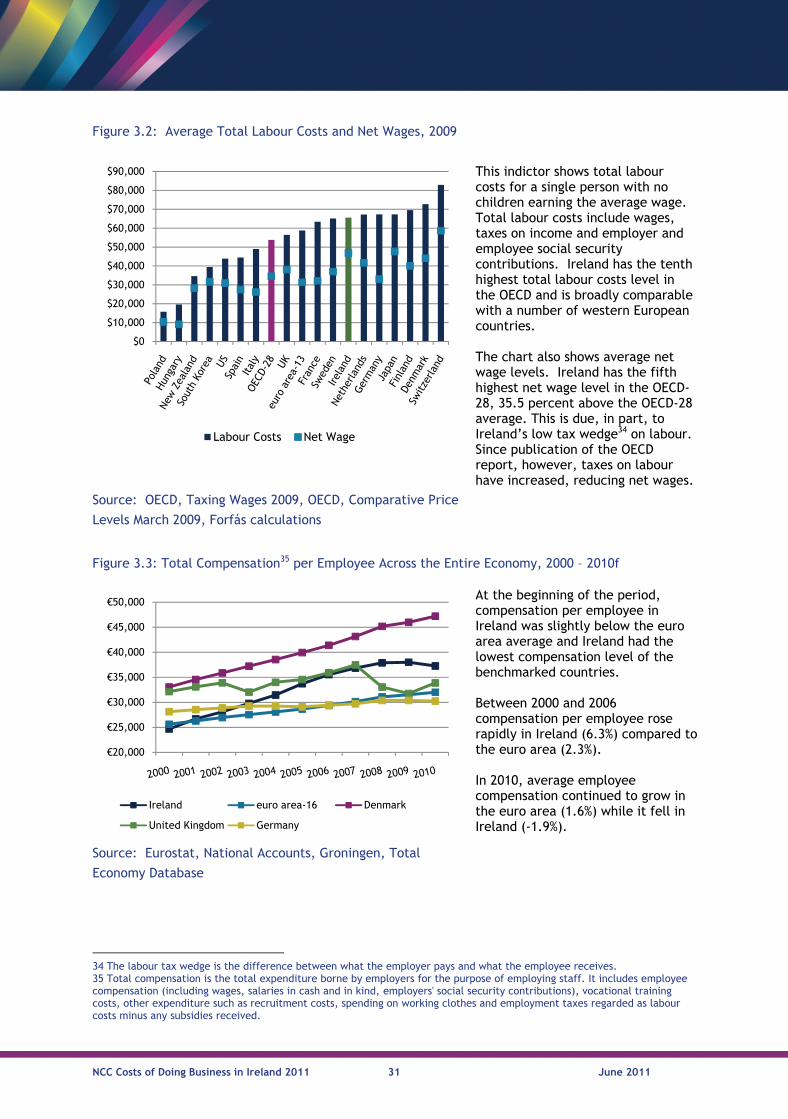
Total labour costs include wages, taxes on income and employer and employee social security
contributions. Ireland has the tenth highest total labour costs level in the OECD (Figure 3.2). Ireland
has the fifth highest net wage level in the OECD-28, 35.5 percent above the OECD-28 average. This
is a result, in part, of Ireland’s lower tax wedge on labour.
Between 2000 and 2006, the average annual increase in total compensation per employee was
significantly higher in Ireland (6.2%) than the euro area (2.3%). However, the rate of increase in
average compensation began to slow in Ireland in 2007 (Figure 3.3). In 2010, average employee
compensation continued to grow in the euro area (1.6%) while it fell in Ireland (-1.9%).
In 2005, Irish unit labour costs (ULCs) grew by 6.15 percent, significantly ahead of both the euro
area and OECD averages (1.9 and 2.09 percent). In 2008, however, Irish ULC growth rates fell below
the euro area and OECD average. During 2010, Ireland experienced a more pronounced decline in
ULCs (-4.4%) relative to the OECD-25 (-0.46%) and the euro area-14 (0.85%), indicating an
improvement in competitiveness (Figure 3.4). At an economy wide level, therefore, Irish labour
wage rates adjusted for productivity are becoming more competitive. It is important to note,
however, that ULCs are heavily influenced by composition effects. Recent improvements in Ireland’s
ULC are a result of a reduction in output from low productivity sectors, an upturn in high value
added export oriented sectors, and a reduction in compensation per employee.
31 For the National Competitiveness Council, the goal of national competitiveness is to provide Ireland’s people with the opportunity to improve their living standards and quality of life. Improving living standards depends on, among other things, raising incomes (and providing employment). To raise incomes, productivity gains are necessary but in an economy with a small domestic market, this requires a healthy exporting sector to achieve economies of scale necessary for productivity gains. For a vibrant exporting sector, Ireland must maintain its national competitiveness.
NCC Costs of Doing Business in Ireland 2011 30 June 2011
Finally, Figure 3.5 measures statutory monthly minimum wages and minimum wage as a percentage
of the average wage. Ireland has the second highest statutory monthly minimum wage (€1,462).
The minimum wage is more prevalent in certain locally traded sectors, notably in hotels and
restaurants, wholesale and retail and other locally traded service industries32.
Social Security Contributions and Labour Taxation There are significant disparities across locations in relation to the levels of social security
contributions and labour taxation. Ireland has one of the lowest levels of employers’ social welfare
contributions (Figure 3.7). The Irish rate (10.8%) is significantly lower than the OECD average
(15.2%) and the euro area average (27%), which reduces the total cost of employing workers in
Ireland.
Ireland’s tax wedge on labour (i.e. the gap between what the employer pays and what the
employee receives) for a married couple (with two children) with a combined salary of 167 percent
of the average wage rose from 14 percent in 2008 to 19.8 percent in 2009 as a result of increases in
income and health levies (Figure 3.8). The tax wedge is significantly higher for higher income
earners – a potential disincentive for highly skilled internationally mobile workers (Fig. 3.9). For a
single worker (with no children) on 167 percent of the average wage, the tax wedge has increased
from 34 percent in 2008 to 39 percent in 2010. The tax wedge is important from a competitiveness
perspective for a number of reasons – it affects the cost of labour for the employer, it partly
determines labour supply, and it can impact on Ireland’s ability to attract high skilled labour.
3.2 Labour Cost Indices and Unit Labour Costs
32 CSO, National Employment Survey, 2007 33 Quarterly data is not available for the EU-27 and euro area 16 group
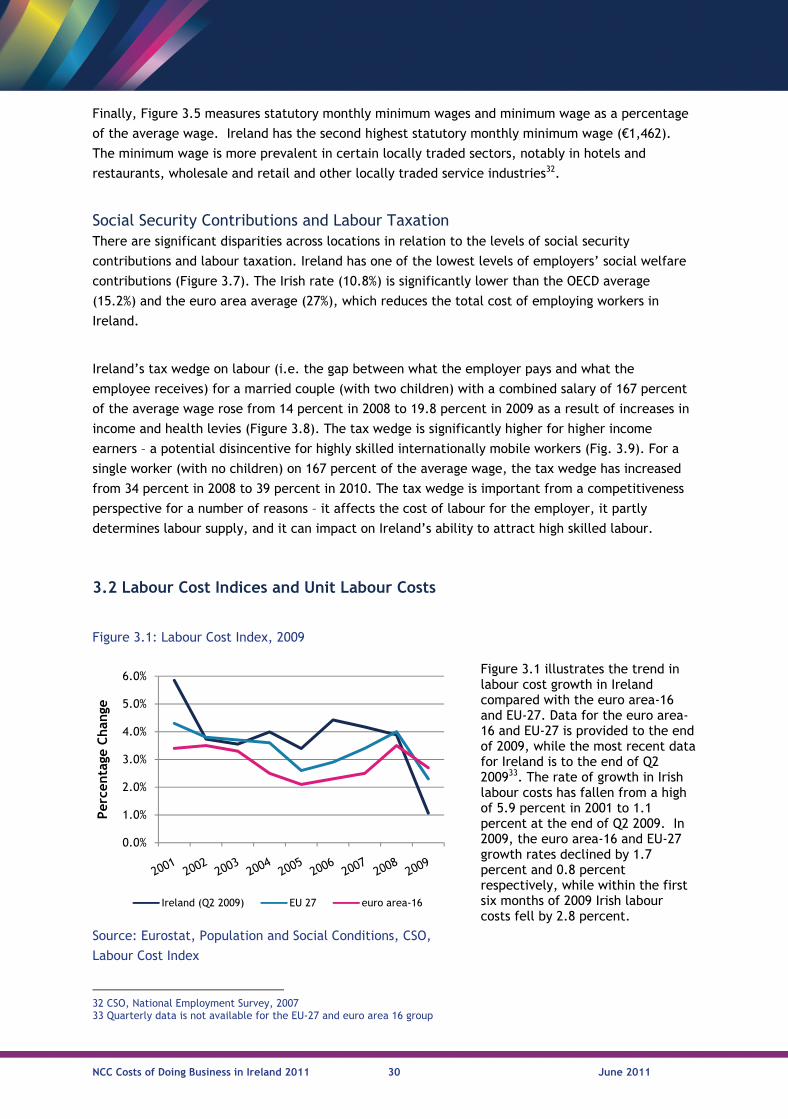
Figure 3.1: Labour Cost Index, 2009
Figure 3.1 illustrates the trend in labour cost growth in Ireland compared with the euro area-16 and EU-27. Data for the euro area-16 and EU-27 is provided to the end of 2009, while the most recent data for Ireland is to the end of Q2 200933. The rate of growth in Irish labour costs has fallen from a high of 5.9 percent in 2001 to 1.1 percent at the end of Q2 2009. In 2009, the euro area-16 and EU-27 growth rates declined by 1.7 percent and 0.8 percent respectively, while within the first six months of 2009 Irish labour costs fell by 2.8 percent.
Source: Eurostat, Population and Social Conditions, CSO,
Labour Cost Index
0.0%
1.0%
2.0%
3.0%
4.0%
5.0%
6.0%
Per
centa
ge C
han
ge
Ireland (Q2 2009) EU 27 euro area-16
NCC Costs of Doing Business in Ireland 2011 31 June 2011
34 The labour tax wedge is the difference between what the employer pays and what the employee receives. 35 Total compensation is the total expenditure borne by employers for the purpose of employing staff. It includes employee compensation (including wages, salaries in cash and in kind, employers' social security contributions), vocational training costs, other expenditure such as recruitment costs, spending on working clothes and employment taxes regarded as labour costs minus any subsidies received.
Figure 3.2: Average Total Labour Costs and Net Wages, 2009
This indictor shows total labour costs for a single person with no children earning the average wage. Total labour costs include wages, taxes on income and employer and employee social security contributions. Ireland has the tenth highest total labour costs level in the OECD and is broadly comparable with a number of western European countries. The chart also shows average net wage levels. Ireland has the fifth highest net wage level in the OECD-28, 35.5 percent above the OECD-28 average. This is due, in part, to Ireland’s low tax wedge34 on labour. Since publication of the OECD report, however, taxes on labour have increased, reducing net wages.
Source: OECD, Taxing Wages 2009, OECD, Comparative Price
Levels March 2009, Forfás calculations
Figure 3.3: Total Compensation35 per Employee Across the Entire Economy, 2000 – 2010f
At the beginning of the period, compensation per employee in Ireland was slightly below the euro area average and Ireland had the lowest compensation level of the benchmarked countries. Between 2000 and 2006 compensation per employee rose rapidly in Ireland (6.3%) compared to the euro area (2.3%). In 2010, average employee compensation continued to grow in the euro area (1.6%) while it fell in Ireland (-1.9%).
Source: Eurostat, National Accounts, Groningen, Total
Economy Database
$0
$10,000
$20,000
$30,000
$40,000
$50,000
$60,000
$70,000
$80,000
$90,000
Labour Costs Net Wage
€20,000
€25,000
€30,000
€35,000
€40,000
€45,000
€50,000
Ireland euro area-16 Denmark
United Kingdom Germany
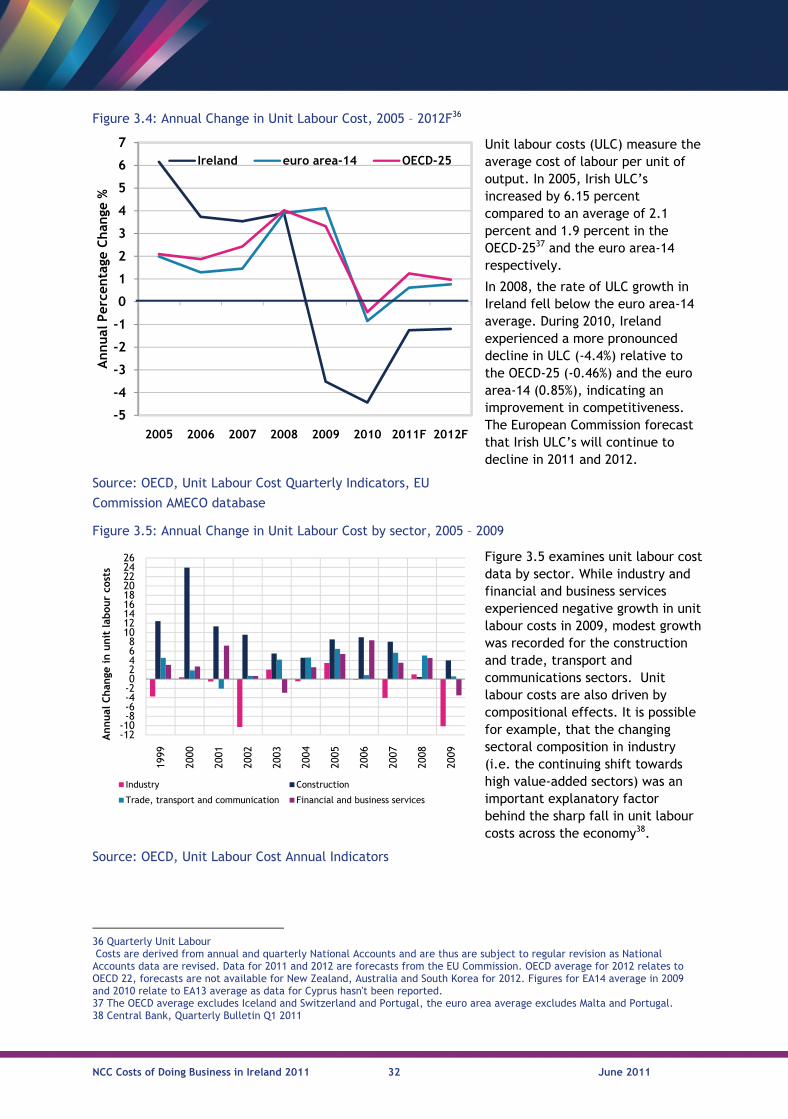
NCC Costs of Doing Business in Ireland 2011 32 June 2011
36 Quarterly Unit Labour Costs are derived from annual and quarterly National Accounts and are thus are subject to regular revision as National Accounts data are revised. Data for 2011 and 2012 are forecasts from the EU Commission. OECD average for 2012 relates to OECD 22, forecasts are not available for New Zealand, Australia and South Korea for 2012. Figures for EA14 average in 2009 and 2010 relate to EA13 average as data for Cyprus hasn't been reported. 37 The OECD average excludes Iceland and Switzerland and Portugal, the euro area average excludes Malta and Portugal. 38 Central Bank, Quarterly Bulletin Q1 2011
Figure 3.4: Annual Change in Unit Labour Cost, 2005 – 2012F36
Unit labour costs (ULC) measure the average cost of labour per unit of output. In 2005, Irish ULC’s increased by 6.15 percent compared to an average of 2.1 percent and 1.9 percent in the OECD-2537 and the euro area-14 respectively.
In 2008, the rate of ULC growth in Ireland fell below the euro area-14 average. During 2010, Ireland experienced a more pronounced decline in ULC (-4.4%) relative to the OECD-25 (-0.46%) and the euro area-14 (0.85%), indicating an improvement in competitiveness. The European Commission forecast that Irish ULC’s will continue to decline in 2011 and 2012.
Source: OECD, Unit Labour Cost Quarterly Indicators, EU
Commission AMECO database
Figure 3.5: Annual Change in Unit Labour Cost by sector, 2005 – 2009
Figure 3.5 examines unit labour cost data by sector. While industry and financial and business services experienced negative growth in unit labour costs in 2009, modest growth was recorded for the construction and trade, transport and communications sectors. Unit labour costs are also driven by compositional effects. It is possible for example, that the changing sectoral composition in industry (i.e. the continuing shift towards high value-added sectors) was an important explanatory factor behind the sharp fall in unit labour costs across the economy38.
Source: OECD, Unit Labour Cost Annual Indicators
-5
-4
-3
-2
-1
0
1
2
3
4
5
6
7
2005 2006 2007 2008 2009 2010 2011F 2012F
Annual
Per
centa
ge C
han
ge %
Ireland euro area-14 OECD-25
-12-10-8-6-4-202468
101214161820222426
1999
2000
2001
2002
2003
2004
2005
2006
2007
2008
2009
Annual
Chan
ge i
n u
nit
lab
our
cost
s
Industry Construction
Trade, transport and communication Financial and business services
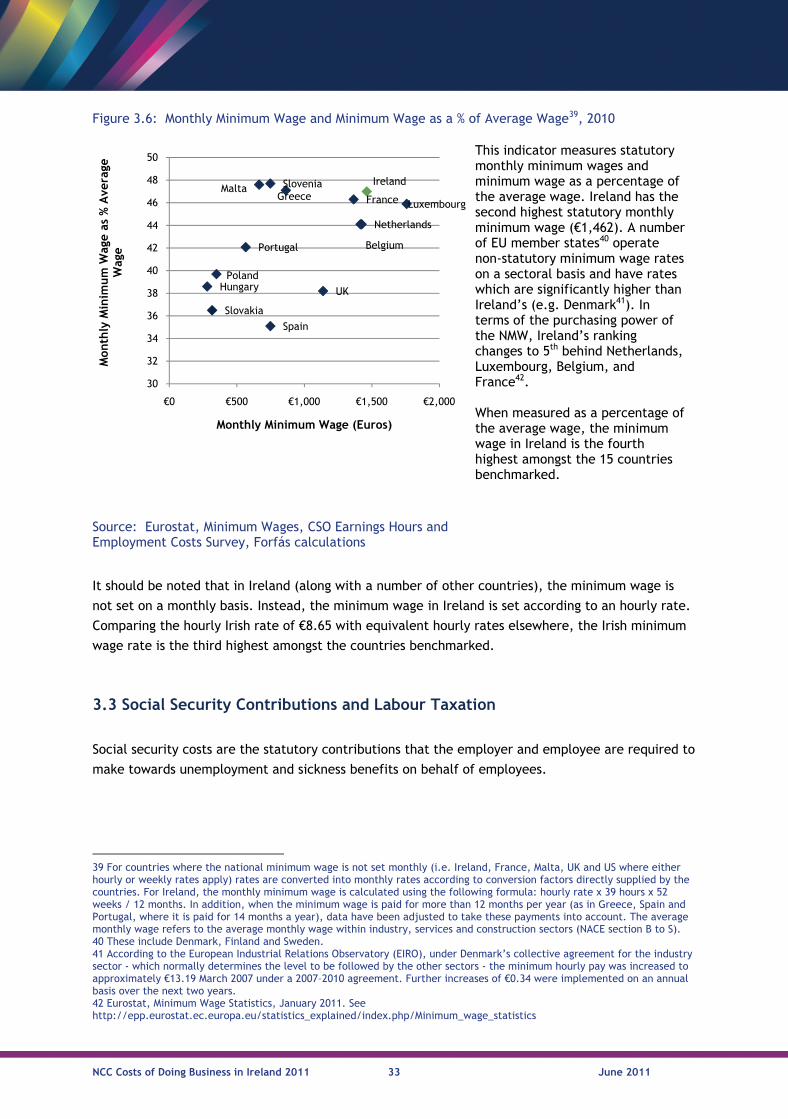
NCC Costs of Doing Business in Ireland 2011 33 June 2011
It should be noted that in Ireland (along with a number of other countries), the minimum wage is
not set on a monthly basis. Instead, the minimum wage in Ireland is set according to an hourly rate.
Comparing the hourly Irish rate of €8.65 with equivalent hourly rates elsewhere, the Irish minimum
wage rate is the third highest amongst the countries benchmarked.
3.3 Social Security Contributions and Labour Taxation
Social security costs are the statutory contributions that the employer and employee are required to
make towards unemployment and sickness benefits on behalf of employees.
39 For countries where the national minimum wage is not set monthly (i.e. Ireland, France, Malta, UK and US where either hourly or weekly rates apply) rates are converted into monthly rates according to conversion factors directly supplied by the countries. For Ireland, the monthly minimum wage is calculated using the following formula: hourly rate x 39 hours x 52 weeks / 12 months. In addition, when the minimum wage is paid for more than 12 months per year (as in Greece, Spain and Portugal, where it is paid for 14 months a year), data have been adjusted to take these payments into account. The average monthly wage refers to the average monthly wage within industry, services and construction sectors (NACE section B to S). 40 These include Denmark, Finland and Sweden. 41 According to the European Industrial Relations Observatory (EIRO), under Denmark’s collective agreement for the industry sector - which normally determines the level to be followed by the other sectors - the minimum hourly pay was increased to approximately €13.19 March 2007 under a 2007–2010 agreement. Further increases of €0.34 were implemented on an annual basis over the next two years. 42 Eurostat, Minimum Wage Statistics, January 2011. See http://epp.eurostat.ec.europa.eu/statistics_explained/index.php/Minimum_wage_statistics
Figure 3.6: Monthly Minimum Wage and Minimum Wage as a % of Average Wage39, 2010
This indicator measures statutory monthly minimum wages and minimum wage as a percentage of the average wage. Ireland has the second highest statutory monthly minimum wage (€1,462). A number of EU member states40 operate non-statutory minimum wage rates on a sectoral basis and have rates which are significantly higher than Ireland’s (e.g. Denmark41). In terms of the purchasing power of the NMW, Ireland’s ranking changes to 5th behind Netherlands, Luxembourg, Belgium, and France42. When measured as a percentage of the average wage, the minimum wage in Ireland is the fourth highest amongst the 15 countries benchmarked.
Source: Eurostat, Minimum Wages, CSO Earnings Hours and Employment Costs Survey, Forfás calculations
Spain
Slovakia
UKHungaryPoland
Portugal Belgium
Netherlands
Luxembourg France
Ireland Malta Slovenia
Greece
30
32
34
36
38
40
42
44
46
48
50
€0 €500 €1,000 €1,500 €2,000
Mon
thly
Min
imum
Wag
e as
% A
vera
ge
Wag
e
Monthly Minimum Wage (Euros)
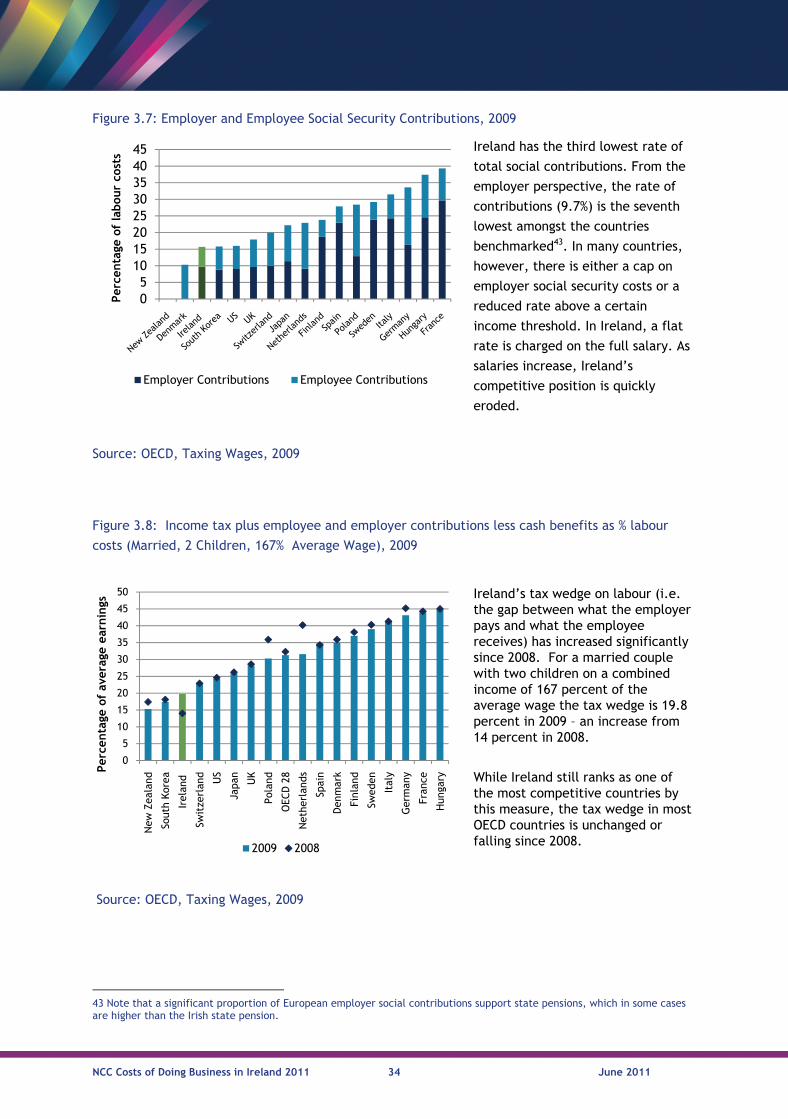
NCC Costs of Doing Business in Ireland 2011 34 June 2011
43 Note that a significant proportion of European employer social contributions support state pensions, which in some cases are higher than the Irish state pension.
Figure 3.7: Employer and Employee Social Security Contributions, 2009
Ireland has the third lowest rate of
total social contributions. From the
employer perspective, the rate of
contributions (9.7%) is the seventh
lowest amongst the countries
benchmarked43. In many countries,
however, there is either a cap on
employer social security costs or a
reduced rate above a certain
income threshold. In Ireland, a flat
rate is charged on the full salary. As
salaries increase, Ireland’s
competitive position is quickly
eroded.
Source: OECD, Taxing Wages, 2009
Figure 3.8: Income tax plus employee and employer contributions less cash benefits as % labour
costs (Married, 2 Children, 167% Average Wage), 2009
Ireland’s tax wedge on labour (i.e. the gap between what the employer pays and what the employee receives) has increased significantly since 2008. For a married couple with two children on a combined income of 167 percent of the average wage the tax wedge is 19.8 percent in 2009 – an increase from 14 percent in 2008.
While Ireland still ranks as one of the most competitive countries by this measure, the tax wedge in most OECD countries is unchanged or falling since 2008.
Source: OECD, Taxing Wages, 2009
05
1015202530354045
Per
centa
ge o
f la
bou
r co
sts
Employer Contributions Employee Contributions
0
5
10
15
20
25
30
35
40
45
50
New
Zea
land
Sout
h Ko
rea
Irel
and
Swit
zerl
and US
Japa
n
UK
Pola
nd
OEC
D 2
8
Net
herl
ands
Spai
n
Den
mar
k
Finl
and
Swed
en
Ital
y
Ger
man
y
Fran
ce
Hun
gary
Per
centa
ge o
f av
erag
e ea
rnin
gs
2009 2008
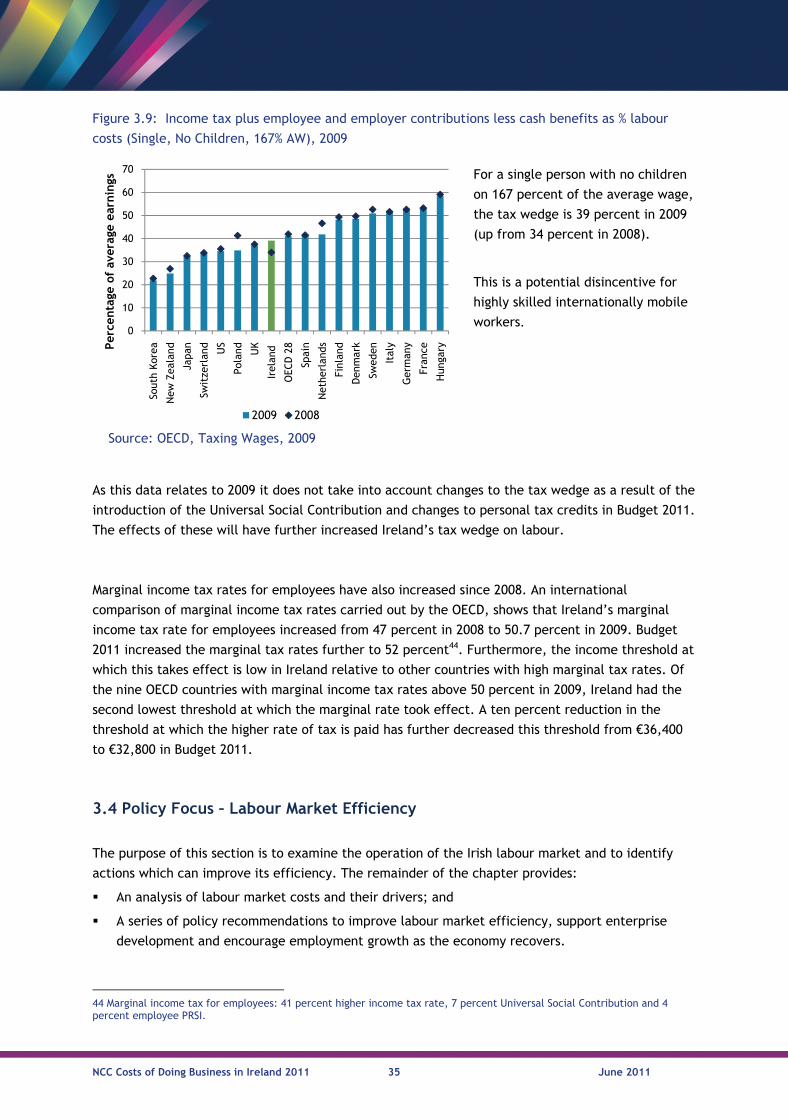
NCC Costs of Doing Business in Ireland 2011 35 June 2011
As this data relates to 2009 it does not take into account changes to the tax wedge as a result of the
introduction of the Universal Social Contribution and changes to personal tax credits in Budget 2011.
The effects of these will have further increased Ireland’s tax wedge on labour.
Marginal income tax rates for employees have also increased since 2008. An international
comparison of marginal income tax rates carried out by the OECD, shows that Ireland’s marginal
income tax rate for employees increased from 47 percent in 2008 to 50.7 percent in 2009. Budget
2011 increased the marginal tax rates further to 52 percent44. Furthermore, the income threshold at
which this takes effect is low in Ireland relative to other countries with high marginal tax rates. Of
the nine OECD countries with marginal income tax rates above 50 percent in 2009, Ireland had the
second lowest threshold at which the marginal rate took effect. A ten percent reduction in the
threshold at which the higher rate of tax is paid has further decreased this threshold from €36,400
to €32,800 in Budget 2011.
3.4 Policy Focus – Labour Market Efficiency
The purpose of this section is to examine the operation of the Irish labour market and to identify
actions which can improve its efficiency. The remainder of the chapter provides:
An analysis of labour market costs and their drivers; and
A series of policy recommendations to improve labour market efficiency, support enterprise
development and encourage employment growth as the economy recovers.
44 Marginal income tax for employees: 41 percent higher income tax rate, 7 percent Universal Social Contribution and 4 percent employee PRSI.
Figure 3.9: Income tax plus employee and employer contributions less cash benefits as % labour
costs (Single, No Children, 167% AW), 2009
For a single person with no children
on 167 percent of the average wage,
the tax wedge is 39 percent in 2009
(up from 34 percent in 2008).
This is a potential disincentive for
highly skilled internationally mobile
workers.
Source: OECD, Taxing Wages, 2009
0
10
20
30
40
50
60
70
Sout
h Ko
rea
New
Zea
land
Japa
n
Swit
zerl
and US
Pola
nd UK
Irel
and
OEC
D 2
8
Spai
n
Net
herl
ands
Finl
and
Den
mar
k
Swed
en
Ital
y
Ger
man
y
Fran
ce
Hun
garyP
erce
nta
ge o
f av
erag
e ea
rnin
gs
2009 2008
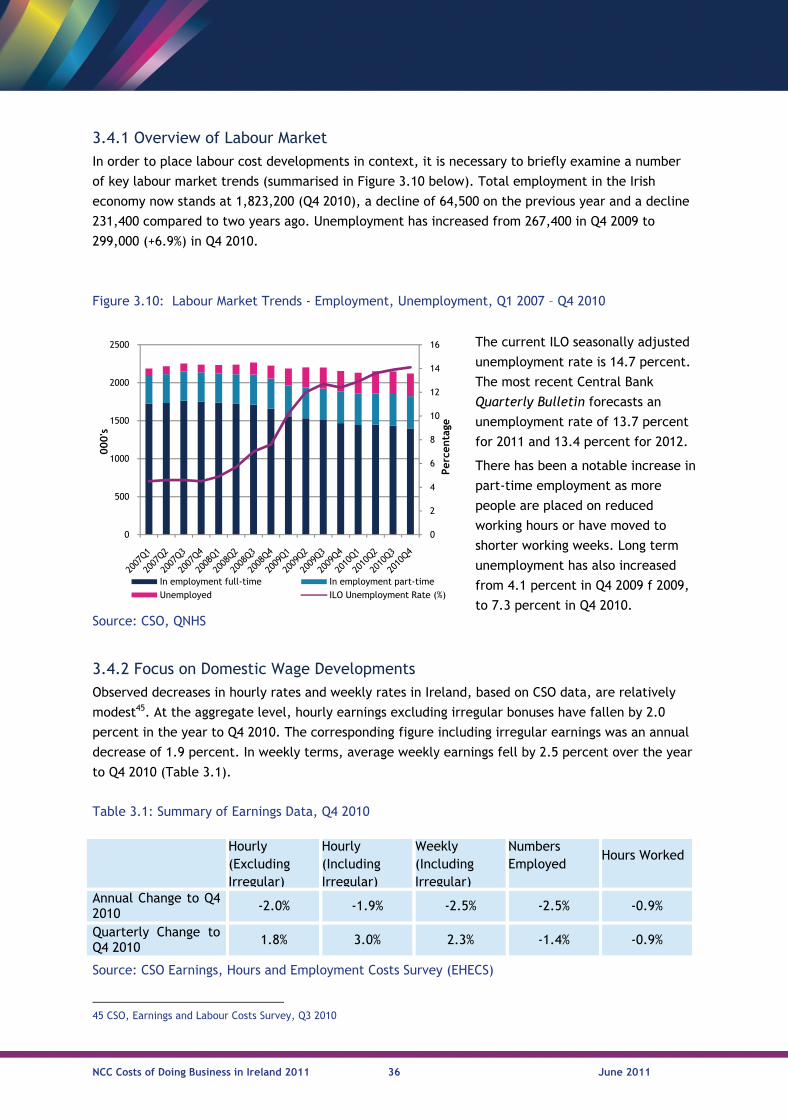
NCC Costs of Doing Business in Ireland 2011 36 June 2011
3.4.1 Overview of Labour Market In order to place labour cost developments in context, it is necessary to briefly examine a number
of key labour market trends (summarised in Figure 3.10 below). Total employment in the Irish
economy now stands at 1,823,200 (Q4 2010), a decline of 64,500 on the previous year and a decline
231,400 compared to two years ago. Unemployment has increased from 267,400 in Q4 2009 to
299,000 (+6.9%) in Q4 2010.
Figure 3.10: Labour Market Trends - Employment, Unemployment, Q1 2007 – Q4 2010
3.4.2 Focus on Domestic Wage Developments Observed decreases in hourly rates and weekly rates in Ireland, based on CSO data, are relatively
modest45. At the aggregate level, hourly earnings excluding irregular bonuses have fallen by 2.0
percent in the year to Q4 2010. The corresponding figure including irregular earnings was an annual
decrease of 1.9 percent. In weekly terms, average weekly earnings fell by 2.5 percent over the year
to Q4 2010 (Table 3.1).
Table 3.1: Summary of Earnings Data, Q4 2010
Hourly (Excluding Irregular)
Hourly (Including Irregular)
Weekly (Including Irregular)
Numbers Employed
Hours Worked
Annual Change to Q4 2010
-2.0% -1.9% -2.5% -2.5% -0.9%
Quarterly Change to Q4 2010 1.8% 3.0% 2.3% -1.4% -0.9%
Source: CSO Earnings, Hours and Employment Costs Survey (EHECS)
45 CSO, Earnings and Labour Costs Survey, Q3 2010
Source: CSO, QNHS
The current ILO seasonally adjusted
unemployment rate is 14.7 percent.
The most recent Central Bank
Quarterly Bulletin forecasts an
unemployment rate of 13.7 percent
for 2011 and 13.4 percent for 2012.
There has been a notable increase in
part-time employment as more
people are placed on reduced
working hours or have moved to
shorter working weeks. Long term
unemployment has also increased
from 4.1 percent in Q4 2009 f 2009,
to 7.3 percent in Q4 2010.
0
2
4
6
8
10
12
14
16
0
500
1000
1500
2000
2500
Per
centa
ge
000's
In employment full-time In employment part-timeUnemployed ILO Unemployment Rate (%)
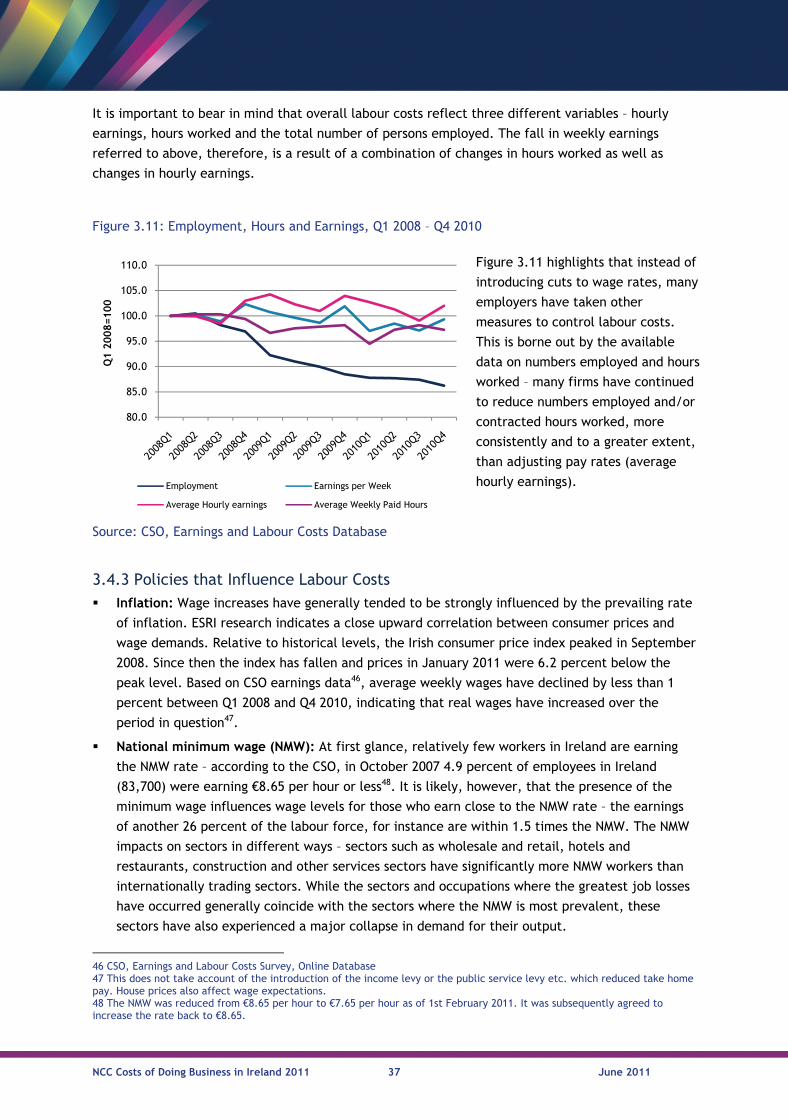
NCC Costs of Doing Business in Ireland 2011 37 June 2011
It is important to bear in mind that overall labour costs reflect three different variables – hourly
earnings, hours worked and the total number of persons employed. The fall in weekly earnings
referred to above, therefore, is a result of a combination of changes in hours worked as well as
changes in hourly earnings.
3.4.3 Policies that Influence Labour Costs Inflation: Wage increases have generally tended to be strongly influenced by the prevailing rate
of inflation. ESRI research indicates a close upward correlation between consumer prices and
wage demands. Relative to historical levels, the Irish consumer price index peaked in September
2008. Since then the index has fallen and prices in January 2011 were 6.2 percent below the
peak level. Based on CSO earnings data46, average weekly wages have declined by less than 1
percent between Q1 2008 and Q4 2010, indicating that real wages have increased over the
period in question47.
National minimum wage (NMW): At first glance, relatively few workers in Ireland are earning
the NMW rate – according to the CSO, in October 2007 4.9 percent of employees in Ireland
(83,700) were earning €8.65 per hour or less48. It is likely, however, that the presence of the
minimum wage influences wage levels for those who earn close to the NMW rate – the earnings
of another 26 percent of the labour force, for instance are within 1.5 times the NMW. The NMW
impacts on sectors in different ways – sectors such as wholesale and retail, hotels and
restaurants, construction and other services sectors have significantly more NMW workers than
internationally trading sectors. While the sectors and occupations where the greatest job losses
have occurred generally coincide with the sectors where the NMW is most prevalent, these
sectors have also experienced a major collapse in demand for their output.
46 CSO, Earnings and Labour Costs Survey, Online Database 47 This does not take account of the introduction of the income levy or the public service levy etc. which reduced take home pay. House prices also affect wage expectations. 48 The NMW was reduced from €8.65 per hour to €7.65 per hour as of 1st February 2011. It was subsequently agreed to increase the rate back to €8.65.
Figure 3.11: Employment, Hours and Earnings, Q1 2008 – Q4 2010
Source: CSO, Earnings and Labour Costs Database
Figure 3.11 highlights that instead of
introducing cuts to wage rates, many
employers have taken other
measures to control labour costs.
This is borne out by the available
data on numbers employed and hours
worked – many firms have continued
to reduce numbers employed and/or
contracted hours worked, more
consistently and to a greater extent,
than adjusting pay rates (average
hourly earnings).
80.0
85.0
90.0
95.0
100.0
105.0
110.0
Q1 2
008=100
Employment Earnings per Week
Average Hourly earnings Average Weekly Paid Hours
NCC Costs of Doing Business in Ireland 2011 38 June 2011
Collective agreements: It is estimated that between 170,000 and 300,000 workers are covered
by either Employment Regulation Orders (ERO’s) or Regulated Employment Agreements (REA’s)
regarding the terms and conditions of their employment49. In many cases, those covered by
ERO’s and REA’s overlap with those earning wage levels within 1.5 times the NMW. An
examination of the hourly rates guaranteed by ERO’s suggests that these agreements are
offering a premium of approximately nine percent over the NMW rate. REAs are predominantly
related to the construction sector and guarantee hourly or weekly rates well in excess of the
NMW. The additional conditions of employment covered by ERO’s and REA’s (such as travel to
work costs, Sunday working rates etc.) can have a significant impact on employment costs.
National policy: The evidence suggests that buoyancy in the broad economy drove labour costs
over the past decade rather than national collective agreements and that the national
agreement did not hinder decisions on wage cuts up to late 2007/early 200850. In the context of
the recession, no national wage agreement is currently in place for private sector workers.
Social welfare and replacement rates: Jobseekers’ Benefit is designed to offer income
maintenance during periods of frictional or cyclical unemployment51. The replacement rate
measures the proportion of out-of-work benefits received when unemployed against take home
pay if in work. As such, it sets a de facto rather than legal minimum wage. In general, if an
individual can receive more than 70 percent of non-work income in benefits, they will demand a
higher wage in the market to retain a monetary incentive to work52. It is estimated that
between 15 and 20 percent of those on the Live Register have replacement rates in excess of 70
percent53. Single workers with no families (who comprise a significant component of the Live
Register) generally have lower replacement rates.
The taxation system: The taxation system is broadly supportive of labour market efficiency but
some issues of concern are emerging. The difference between the employers’ cost of hiring an
individual and the individual’s actual take home pay, due to income and payroll taxes, is known
as the tax wedge. A high tax wedge increases labour costs and has a negative influence on the
employer’s decision to retain or hire individuals. It also lowers take home pay and can affect an
individual’s participation decision as measured by replacement rates. Increases in personal
taxes reduce take home pay for employees without any labour cost savings for the employer. In
Ireland, the labour tax wedge has risen for all income categories assessed by the OECD since
2008 while the tax wedge in most OECD countries is unchanged or falling. A competitive tax
wedge, therefore, is a vital tool to encourage employment growth across all income categories
and to incentivise people to remain in or return to the labour market.
Firm level policies: The available evidence in Ireland and internationally suggests that economy
wide wage levels rarely fall. While it is easier for new enterprises and existing troubled
49 The various agreements on pay and conditions made by Joint Labour Committees (JLCs) are known as Employment Regulation Orders (EROs). Agreements which result from negotiations between trade unions and employers are called Collective Agreements. If a Collective Agreement has been registered with the Labour Court, it is known as a Registered Employment Agreement (REA). 50 Keeney, M., and Lawless, M., Wage Setting and Wage Flexibility in Ireland - Results from a Firm-level Survey, European Central Bank, Working Paper Series No 1181, April 2010 51 Jobseekers’ Allowance (and other assistance payments) may serve as income support on a long-term basis – subject to satisfying scheme conditions. 52 The Department of Finance has noted that while there is no pre-determined level of replacement rate which would influence every individual’s decision to work, a replacement rate greater than 70 percent is considered excessive. See Department of Finance, Replacement Rates and Unemployment, 2009 53 A detailed breakdown of those cohorts with replacement rates above 70 percent can be found in: Forfás, Review of Labour Cost Competitiveness, October 2010
NCC Costs of Doing Business in Ireland 2011 39 June 2011
enterprises to justify lower wage levels to their employees, the majority of businesses are
reluctant to lower hourly wage rates54.
3.4.4 Conclusions and Recommendations Labour market expectations and wage demands are not divorced from happenings elsewhere in the
economy. If employees genuinely believe that the cost of living is falling, this will be reflected in
nominal wage demands. It is important, therefore, that appropriate and credible actions are taken
to address all elements of the cost base in Ireland in order to protect real incomes. A long term
opportunity arises for shifting negotiations on pay away from increases in living costs and focusing
instead on improvements in productivity55.
Over recent months, there have been a number of developments, most of which are related to
Budget 2011, the National Recovery Plan and the joint EU-IMF Programme for Ireland.
Social welfare rates have been reduced;
Changes to both PAYE and the income and health levies have been introduced which have
resulted in lower take home pay for employees;
The national minimum wage was reduced from €8.65 per hour to €7.65 per hour as of 1st
February 2011. It was subsequently agreed to restore the €8.65 rate.
An independent review of Employment Regulation Order (EROs) and Registered Employment
Agreement (REAs) wage setting mechanisms has commenced.
There remain aspects of the broader labour market that require attention. In the latest
Competitiveness Challenge report, the NCC highlighted the need to ensure that the social welfare
system does not create poverty traps and the need to ensure that employed persons do not become
disengaged from the workforce.
Social Welfare As noted above, high replacement rates discourage recipients from entering the labour market. It is
important to remember, however, that a relatively small proportion of social welfare recipients
have replacement rates in excess of 70 percent. Furthermore when discussing replacement rates
one must acknowledge the impact of secondary benefits (e.g. rent allowance, fuel allowance,
medical cards, basic supplementary welfare allowance etc.). Where high replacement rates exist, a
number of options should be considered:
Replacement rates should be revised over time to ensure no replacement rates exceed 100 percent. In the longer term, no replacement rate should exceed 70 percent. Policymakers must also be cognisant about the impact that changes in taxes on employment or social contributions can have on replacement rates.
54 Bewley, Truman F., Why Wages Don't Fall During a Recession, 1999, Harvard University Press 55 Flexibility in wage contracts in response to possible currency fluctuations with major trading partners would also be a desirable feature. Geary and Honohan proposed a mechanism for the sharing of currency risk between employers and employees through such a flexible wage contract – see Geary, P.T. and Honohan, P., Can Better Contracts Help Solve Ireland’s Sterling Dilemma, 1995

NCC Costs of Doing Business in Ireland 2011 40 June 2011
The issue of secondary benefits is quite complex and varies according to individual and household circumstances. However, potential still exists to reform this area, for example:
Department of Social Protection have identified that replacement rates in excess of 70 percent which occur as a result of individuals receiving rent allowance may be addressed through a movement to the rental accommodation scheme;
Potential may exist to allow some secondary benefits to be retained for a period of time after take up of full time employment, depending on income levels – this would reduce the impact from the loss of social welfare entitlements upon taking up employment.
Reform the social welfare system so that benefits decline in line with the length of time a person is out of work – this would be in line with European approaches to social welfare. It is important to note, however, that the European model is predicated on relatively high contributions bestowing a relatively high post-employment income that generally declines over time (but is normally longer than Irish entitlement - the Irish system has low contribution levels and a flat rate payment system that lasts for 9/12 months).
High quality social welfare systems (i.e. generous protection) should be accompanied by high levels of conditionality in order to ensure their sustainability. Conditionality of social welfare needs to be strengthened.
Activation and Upskilling To meet the current challenges of high unemployment there will need to be a focus on the
efficiency, quality and effectiveness of activation programmes for the unemployed to ensure the
best use of the education and training budgets. This will require collaboration and co-ordination
between employment services, training and education providers and enterprise. Working from a
shared view of the future skills needs of the economy, an innovative and integrated approach can
be followed to determine agreed education and training priorities. The Review of Labour Market
Programmes56 recommended that the focus of labour market programmes should be on three main
areas:
Activation – Activation measures aimed at improving the employability of unemployed persons by providing ‘progression pathways’ of relevant job search, training, education and employment opportunities for different target groups. This includes the need to ensure that the responsibilities and mutual obligations of individuals able to take up opportunities are made clear and that any disincentives to participation are minimised.
Participation – Ensuring that the training and education needs of target groups such as young unemployed, those previously employed in sectors most affected by restructuring, long term unemployed, older workers and women returners are provided for through enterprise relevant programmes.
Upskilling – Boosting our human capital by enhancing education and skills levels in line with the National Skills Strategy is essential to meet the needs of the ‘Smart Economy’ and the need to improve productivity. Notwithstanding our current economic difficulties, a recent report from the Expert Group on Future Skills Needs highlights the fact that job vacancies continue to arise57. Vacancies exist for both professional occupations (ICT, engineering (e.g. energy systems), health and finance) and occupations at the lower end of the skills scale (e.g. security guards, catering staff and carers). The jobs on offer generally require candidates with specific
56 Forfás/DETE, Review of Labour Market Programmes, 2010 57 Expert Group on Future Skills Needs, Vacancy Overview 2011, Forfás, March 2011

NCC Costs of Doing Business in Ireland 2011 41 June 2011
profiles that include: experience, specific expertise (e.g. IT, financial), third level qualifications, and language skills. This indicates a need for job seekers to reskill/upskill and, where possible, to avail of work placement programmes and internships in order to gain experience.
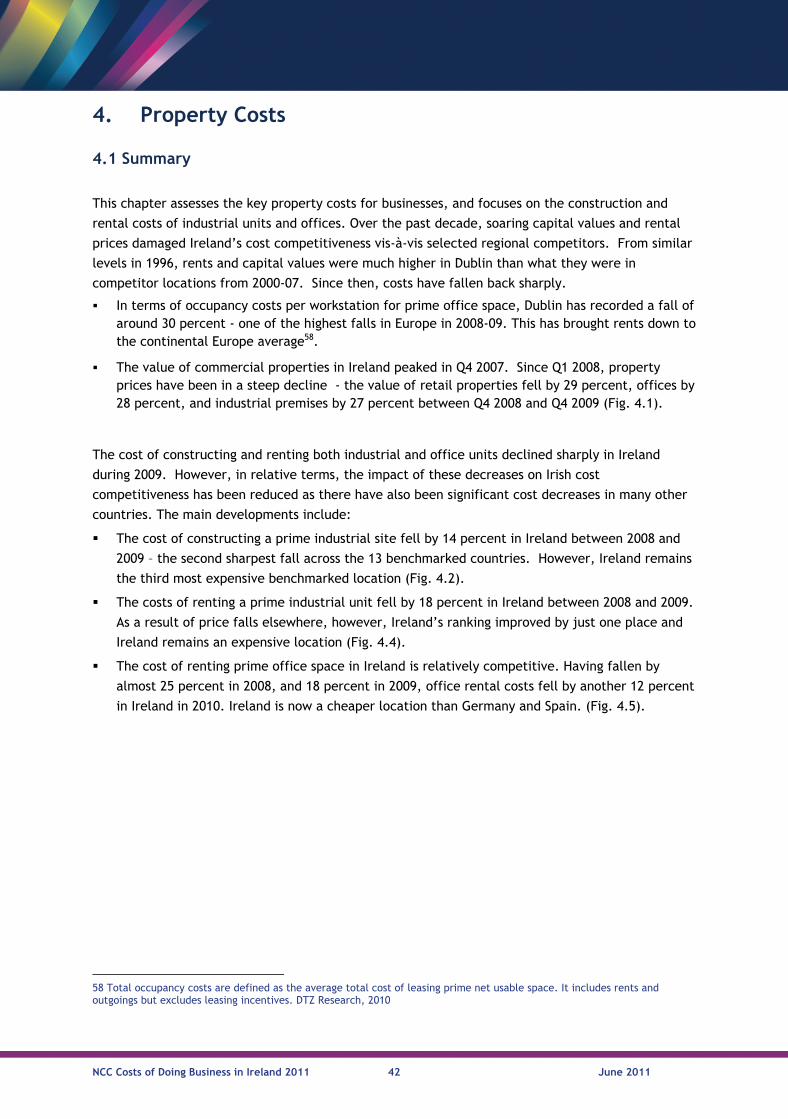
NCC Costs of Doing Business in Ireland 2011 42 June 2011
4. Property Costs
4.1 Summary
This chapter assesses the key property costs for businesses, and focuses on the construction and
rental costs of industrial units and offices. Over the past decade, soaring capital values and rental
prices damaged Ireland’s cost competitiveness vis-à-vis selected regional competitors. From similar
levels in 1996, rents and capital values were much higher in Dublin than what they were in
competitor locations from 2000-07. Since then, costs have fallen back sharply.
In terms of occupancy costs per workstation for prime office space, Dublin has recorded a fall of around 30 percent - one of the highest falls in Europe in 2008-09. This has brought rents down to the continental Europe average58.
The value of commercial properties in Ireland peaked in Q4 2007. Since Q1 2008, property prices have been in a steep decline - the value of retail properties fell by 29 percent, offices by 28 percent, and industrial premises by 27 percent between Q4 2008 and Q4 2009 (Fig. 4.1).
The cost of constructing and renting both industrial and office units declined sharply in Ireland
during 2009. However, in relative terms, the impact of these decreases on Irish cost
competitiveness has been reduced as there have also been significant cost decreases in many other
countries. The main developments include:
The cost of constructing a prime industrial site fell by 14 percent in Ireland between 2008 and
2009 – the second sharpest fall across the 13 benchmarked countries. However, Ireland remains
the third most expensive benchmarked location (Fig. 4.2).
The costs of renting a prime industrial unit fell by 18 percent in Ireland between 2008 and 2009.
As a result of price falls elsewhere, however, Ireland’s ranking improved by just one place and
Ireland remains an expensive location (Fig. 4.4).
The cost of renting prime office space in Ireland is relatively competitive. Having fallen by
almost 25 percent in 2008, and 18 percent in 2009, office rental costs fell by another 12 percent
in Ireland in 2010. Ireland is now a cheaper location than Germany and Spain. (Fig. 4.5).
58 Total occupancy costs are defined as the average total cost of leasing prime net usable space. It includes rents and outgoings but excludes leasing incentives. DTZ Research, 2010
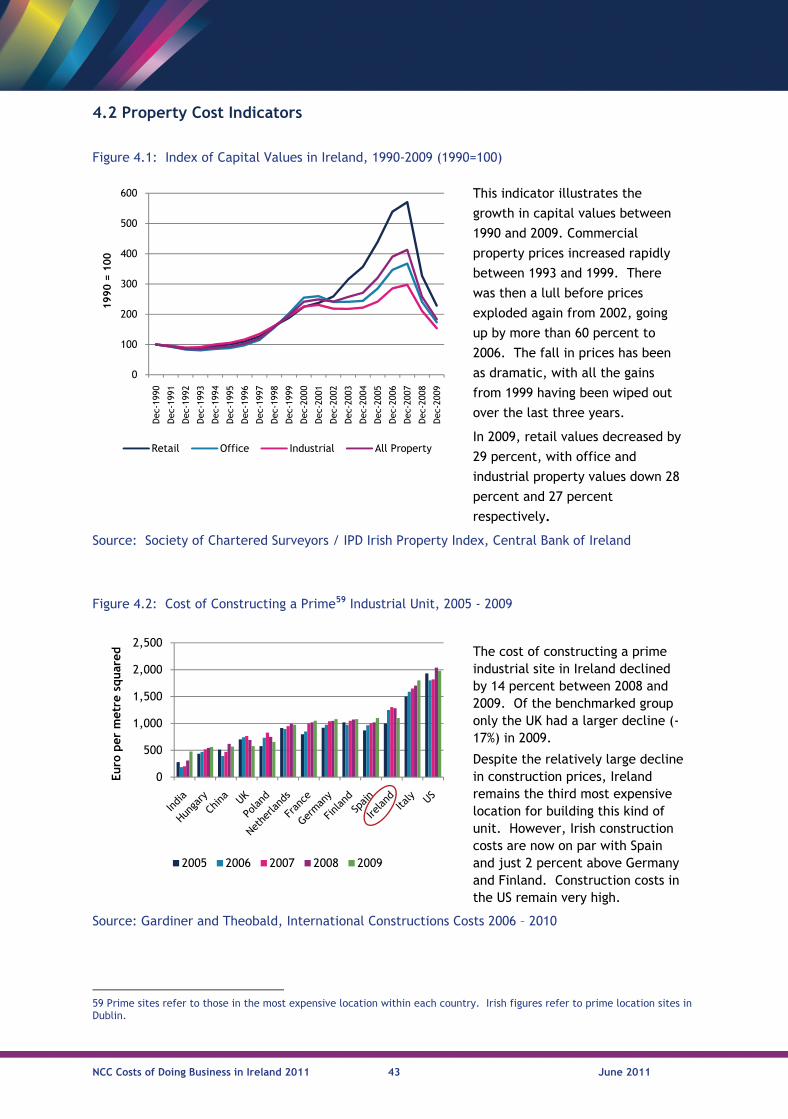
NCC Costs of Doing Business in Ireland 2011 43 June 2011
59 Prime sites refer to those in the most expensive location within each country. Irish figures refer to prime location sites in Dublin.
4.2 Property Cost Indicators
Figure 4.1: Index of Capital Values in Ireland, 1990-2009 (1990=100)
This indicator illustrates the
growth in capital values between
1990 and 2009. Commercial
property prices increased rapidly
between 1993 and 1999. There
was then a lull before prices
exploded again from 2002, going
up by more than 60 percent to
2006. The fall in prices has been
as dramatic, with all the gains
from 1999 having been wiped out
over the last three years.
In 2009, retail values decreased by
29 percent, with office and
industrial property values down 28
percent and 27 percent
respectively.
Source: Society of Chartered Surveyors / IPD Irish Property Index, Central Bank of Ireland
Figure 4.2: Cost of Constructing a Prime59 Industrial Unit, 2005 - 2009
The cost of constructing a prime industrial site in Ireland declined by 14 percent between 2008 and 2009. Of the benchmarked group only the UK had a larger decline (-17%) in 2009.
Despite the relatively large decline in construction prices, Ireland remains the third most expensive location for building this kind of unit. However, Irish construction costs are now on par with Spain and just 2 percent above Germany and Finland. Construction costs in the US remain very high.
Source: Gardiner and Theobald, International Constructions Costs 2006 – 2010
0
100
200
300
400
500
600
Dec
-199
0
Dec
-199
1
Dec
-199
2
Dec
-199
3
Dec
-199
4
Dec
-199
5
Dec
-199
6
Dec
-199
7
Dec
-199
8
Dec
-199
9
Dec
-200
0
Dec
-200
1
Dec
-200
2
Dec
-200
3
Dec
-200
4
Dec
-200
5
Dec
-200
6
Dec
-200
7
Dec
-200
8
Dec
-200
9
1990 =
100
Retail Office Industrial All Property
0
500
1,000
1,500
2,000
2,500
Euro
per
met
re s
quar
ed
2005 2006 2007 2008 2009
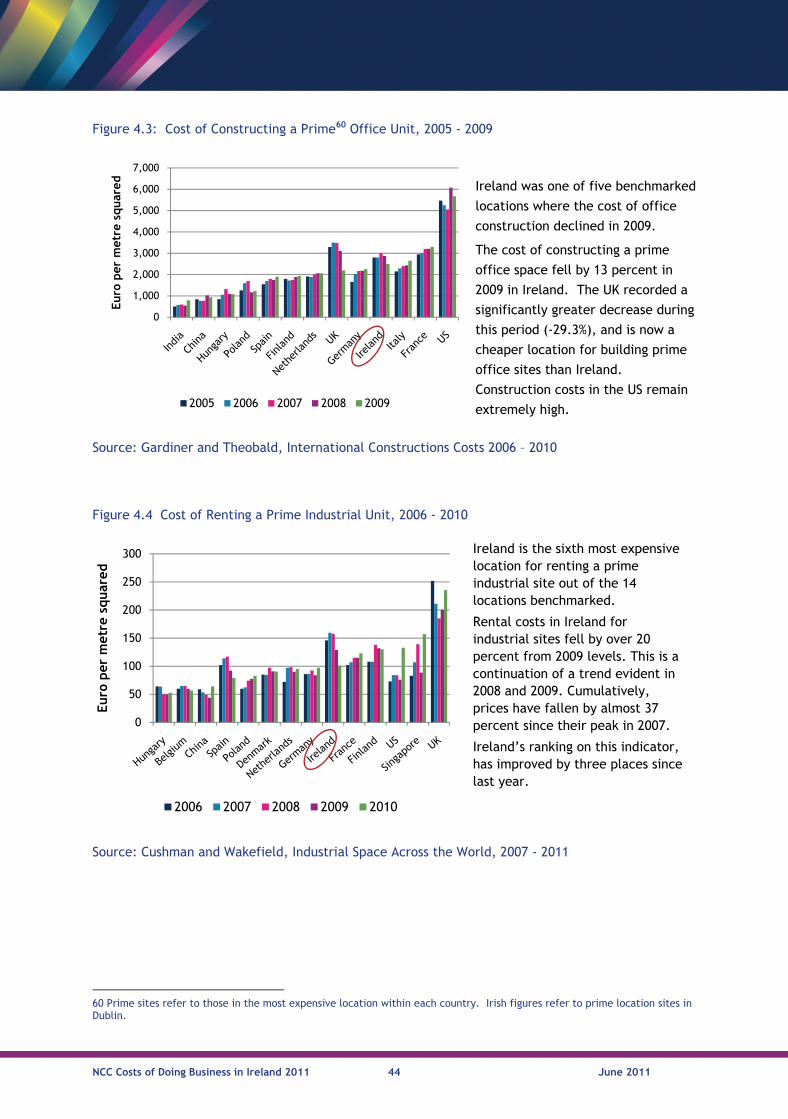
NCC Costs of Doing Business in Ireland 2011 44 June 2011
60 Prime sites refer to those in the most expensive location within each country. Irish figures refer to prime location sites in Dublin.
Figure 4.3: Cost of Constructing a Prime60 Office Unit, 2005 - 2009
Ireland was one of five benchmarked
locations where the cost of office
construction declined in 2009.
The cost of constructing a prime
office space fell by 13 percent in
2009 in Ireland. The UK recorded a
significantly greater decrease during
this period (-29.3%), and is now a
cheaper location for building prime
office sites than Ireland.
Construction costs in the US remain
extremely high.
Source: Gardiner and Theobald, International Constructions Costs 2006 – 2010
Figure 4.4 Cost of Renting a Prime Industrial Unit, 2006 - 2010
Ireland is the sixth most expensive location for renting a prime industrial site out of the 14 locations benchmarked.
Rental costs in Ireland for industrial sites fell by over 20 percent from 2009 levels. This is a continuation of a trend evident in 2008 and 2009. Cumulatively, prices have fallen by almost 37 percent since their peak in 2007.
Ireland’s ranking on this indicator, has improved by three places since last year.
Source: Cushman and Wakefield, Industrial Space Across the World, 2007 - 2011
0
1,000
2,000
3,000
4,000
5,000
6,000
7,000
Euro
per
met
re s
quar
ed
2005 2006 2007 2008 2009
0
50
100
150
200
250
300
Euro
per
met
re s
quar
ed
2006 2007 2008 2009 2010
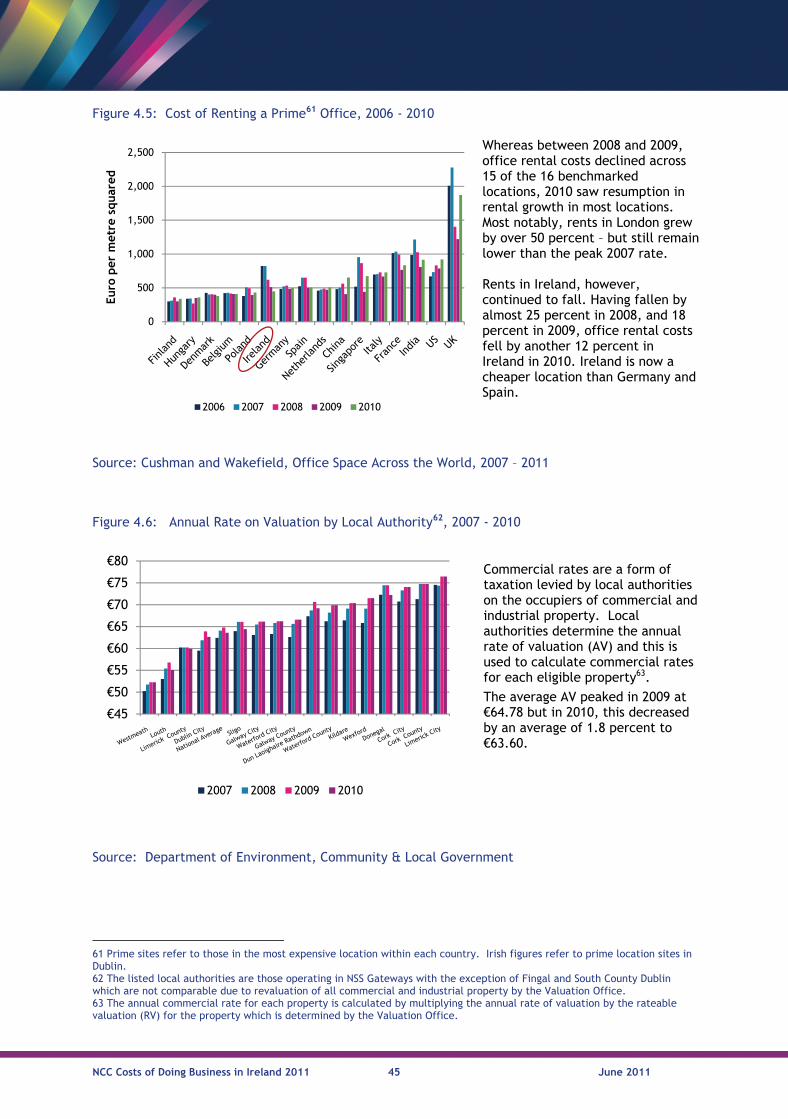
NCC Costs of Doing Business in Ireland 2011 45 June 2011
Source: Department of Environment, Community & Local Government
61 Prime sites refer to those in the most expensive location within each country. Irish figures refer to prime location sites in Dublin. 62 The listed local authorities are those operating in NSS Gateways with the exception of Fingal and South County Dublin which are not comparable due to revaluation of all commercial and industrial property by the Valuation Office. 63 The annual commercial rate for each property is calculated by multiplying the annual rate of valuation by the rateable valuation (RV) for the property which is determined by the Valuation Office.
Figure 4.5: Cost of Renting a Prime61 Office, 2006 - 2010
Whereas between 2008 and 2009, office rental costs declined across 15 of the 16 benchmarked locations, 2010 saw resumption in rental growth in most locations. Most notably, rents in London grew by over 50 percent – but still remain lower than the peak 2007 rate. Rents in Ireland, however, continued to fall. Having fallen by almost 25 percent in 2008, and 18 percent in 2009, office rental costs fell by another 12 percent in Ireland in 2010. Ireland is now a cheaper location than Germany and Spain.
Source: Cushman and Wakefield, Office Space Across the World, 2007 – 2011
Figure 4.6: Annual Rate on Valuation by Local Authority62, 2007 - 2010
Commercial rates are a form of taxation levied by local authorities on the occupiers of commercial and industrial property. Local authorities determine the annual rate of valuation (AV) and this is used to calculate commercial rates for each eligible property63.
The average AV peaked in 2009 at €64.78 but in 2010, this decreased by an average of 1.8 percent to €63.60.
0
500
1,000
1,500
2,000
2,500
Euro
per
met
re s
quar
ed
2006 2007 2008 2009 2010
€45
€50
€55
€60
€65
€70
€75
€80
2007 2008 2009 2010
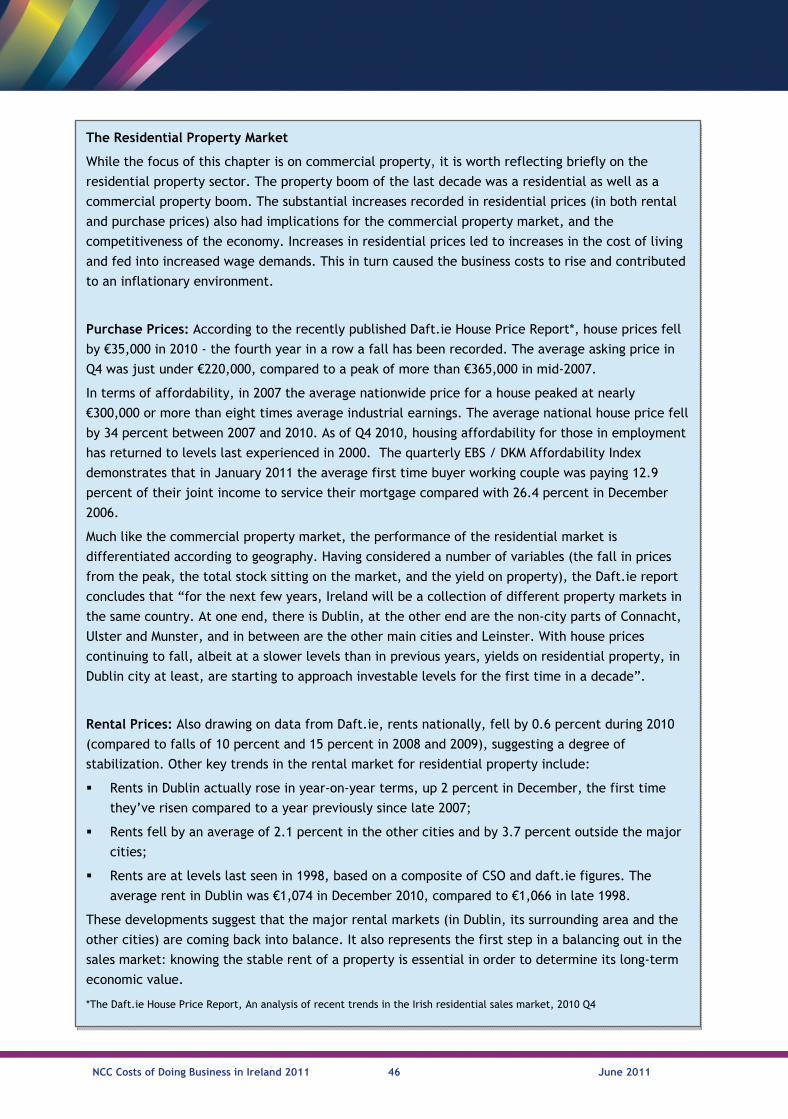
NCC Costs of Doing Business in Ireland 2011 46 June 2011
Source: Department of Environment, Community & Local Government
The Residential Property Market
While the focus of this chapter is on commercial property, it is worth reflecting briefly on the
residential property sector. The property boom of the last decade was a residential as well as a
commercial property boom. The substantial increases recorded in residential prices (in both rental
and purchase prices) also had implications for the commercial property market, and the
competitiveness of the economy. Increases in residential prices led to increases in the cost of living
and fed into increased wage demands. This in turn caused the business costs to rise and contributed
to an inflationary environment.
Purchase Prices: According to the recently published Daft.ie House Price Report*, house prices fell
by €35,000 in 2010 - the fourth year in a row a fall has been recorded. The average asking price in
Q4 was just under €220,000, compared to a peak of more than €365,000 in mid-2007.
In terms of affordability, in 2007 the average nationwide price for a house peaked at nearly
€300,000 or more than eight times average industrial earnings. The average national house price fell
by 34 percent between 2007 and 2010. As of Q4 2010, housing affordability for those in employment
has returned to levels last experienced in 2000. The quarterly EBS / DKM Affordability Index
demonstrates that in January 2011 the average first time buyer working couple was paying 12.9
percent of their joint income to service their mortgage compared with 26.4 percent in December
2006.
Much like the commercial property market, the performance of the residential market is
differentiated according to geography. Having considered a number of variables (the fall in prices
from the peak, the total stock sitting on the market, and the yield on property), the Daft.ie report
concludes that “for the next few years, Ireland will be a collection of different property markets in
the same country. At one end, there is Dublin, at the other end are the non-city parts of Connacht,
Ulster and Munster, and in between are the other main cities and Leinster. With house prices
continuing to fall, albeit at a slower levels than in previous years, yields on residential property, in
Dublin city at least, are starting to approach investable levels for the first time in a decade”.
Rental Prices: Also drawing on data from Daft.ie, rents nationally, fell by 0.6 percent during 2010
(compared to falls of 10 percent and 15 percent in 2008 and 2009), suggesting a degree of
stabilization. Other key trends in the rental market for residential property include:
Rents in Dublin actually rose in year-on-year terms, up 2 percent in December, the first time
they’ve risen compared to a year previously since late 2007;
Rents fell by an average of 2.1 percent in the other cities and by 3.7 percent outside the major
cities;
Rents are at levels last seen in 1998, based on a composite of CSO and daft.ie figures. The
average rent in Dublin was €1,074 in December 2010, compared to €1,066 in late 1998.
These developments suggest that the major rental markets (in Dublin, its surrounding area and the
other cities) are coming back into balance. It also represents the first step in a balancing out in the
sales market: knowing the stable rent of a property is essential in order to determine its long-term
economic value.
*The Daft.ie House Price Report, An analysis of recent trends in the Irish residential sales market, 2010 Q4
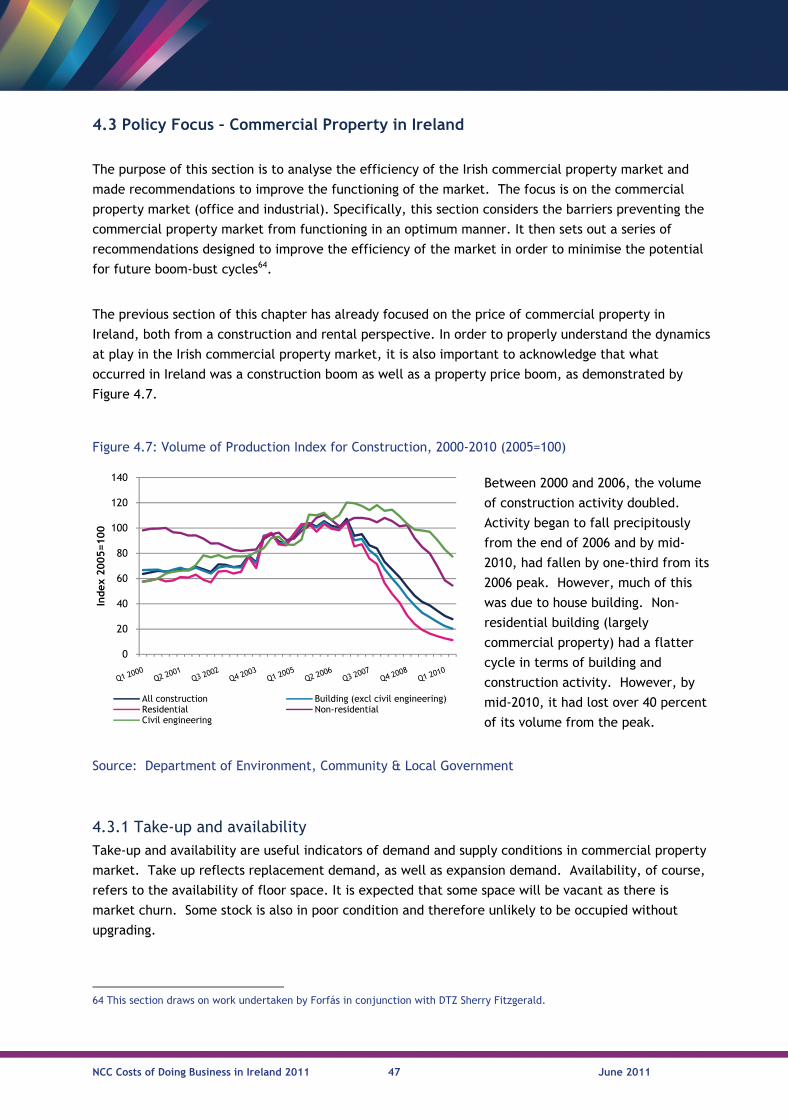
NCC Costs of Doing Business in Ireland 2011 47 June 2011
64 This section draws on work undertaken by Forfás in conjunction with DTZ Sherry Fitzgerald.
4.3 Policy Focus – Commercial Property in Ireland
The purpose of this section is to analyse the efficiency of the Irish commercial property market and
made recommendations to improve the functioning of the market. The focus is on the commercial
property market (office and industrial). Specifically, this section considers the barriers preventing the
commercial property market from functioning in an optimum manner. It then sets out a series of
recommendations designed to improve the efficiency of the market in order to minimise the potential
for future boom-bust cycles64.
The previous section of this chapter has already focused on the price of commercial property in
Ireland, both from a construction and rental perspective. In order to properly understand the dynamics
at play in the Irish commercial property market, it is also important to acknowledge that what
occurred in Ireland was a construction boom as well as a property price boom, as demonstrated by
Figure 4.7.
Figure 4.7: Volume of Production Index for Construction, 2000-2010 (2005=100)
Between 2000 and 2006, the volume
of construction activity doubled.
Activity began to fall precipitously
from the end of 2006 and by mid-
2010, had fallen by one-third from its
2006 peak. However, much of this
was due to house building. Non-
residential building (largely
commercial property) had a flatter
cycle in terms of building and
construction activity. However, by
mid-2010, it had lost over 40 percent
of its volume from the peak.
Source: Department of Environment, Community & Local Government
4.3.1 Take-up and availability Take-up and availability are useful indicators of demand and supply conditions in commercial property
market. Take up reflects replacement demand, as well as expansion demand. Availability, of course,
refers to the availability of floor space. It is expected that some space will be vacant as there is
market churn. Some stock is also in poor condition and therefore unlikely to be occupied without
upgrading.
0
20
40
60
80
100
120
140
Index
2005=100
All construction Building (excl civil engineering)Residential Non-residential Civil engineering
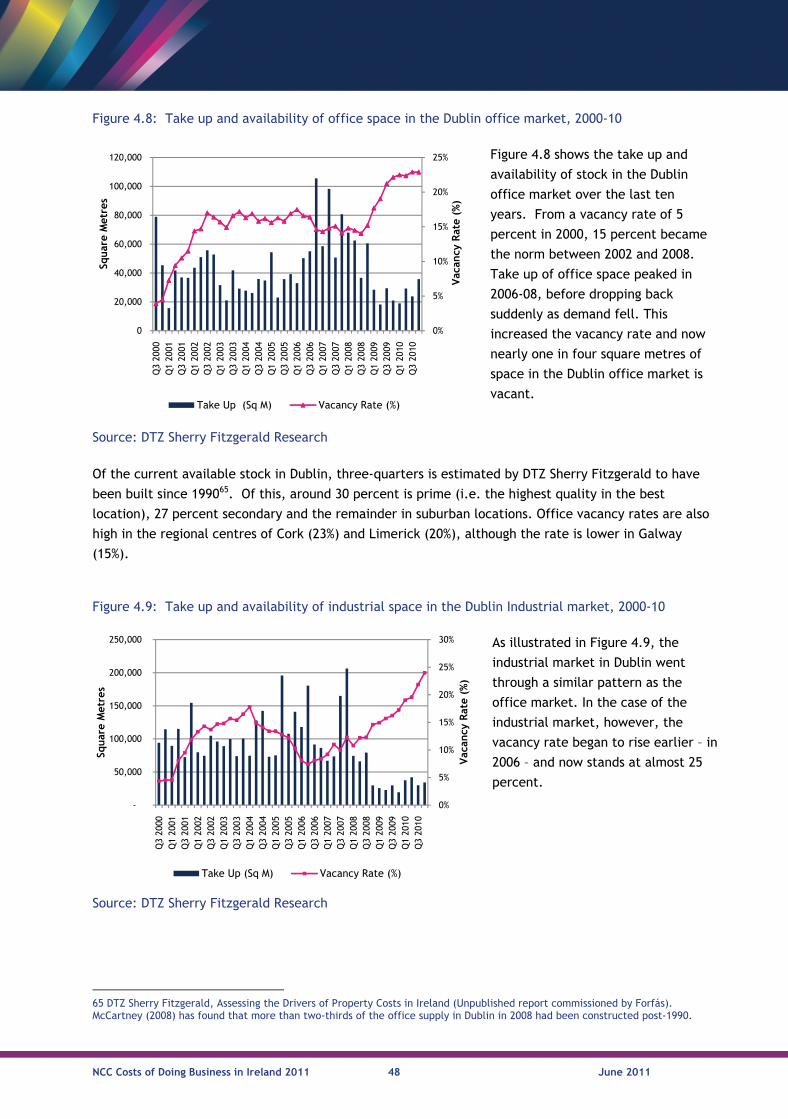
NCC Costs of Doing Business in Ireland 2011 48 June 2011
65 DTZ Sherry Fitzgerald, Assessing the Drivers of Property Costs in Ireland (Unpublished report commissioned by Forfás). McCartney (2008) has found that more than two-thirds of the office supply in Dublin in 2008 had been constructed post-1990.
Figure 4.8: Take up and availability of office space in the Dublin office market, 2000-10
Figure 4.8 shows the take up and
availability of stock in the Dublin
office market over the last ten
years. From a vacancy rate of 5
percent in 2000, 15 percent became
the norm between 2002 and 2008.
Take up of office space peaked in
2006-08, before dropping back
suddenly as demand fell. This
increased the vacancy rate and now
nearly one in four square metres of
space in the Dublin office market is
vacant.
Source: DTZ Sherry Fitzgerald Research
Of the current available stock in Dublin, three-quarters is estimated by DTZ Sherry Fitzgerald to have
been built since 199065. Of this, around 30 percent is prime (i.e. the highest quality in the best
location), 27 percent secondary and the remainder in suburban locations. Office vacancy rates are also
high in the regional centres of Cork (23%) and Limerick (20%), although the rate is lower in Galway
(15%).
Figure 4.9: Take up and availability of industrial space in the Dublin Industrial market, 2000-10
As illustrated in Figure 4.9, the
industrial market in Dublin went
through a similar pattern as the
office market. In the case of the
industrial market, however, the
vacancy rate began to rise earlier – in
2006 – and now stands at almost 25
percent.
Source: DTZ Sherry Fitzgerald Research
0%
5%
10%
15%
20%
25%
0
20,000
40,000
60,000
80,000
100,000
120,000Q
3 20
00Q
1 20
01Q
3 20
01Q
1 20
02Q
3 20
02Q
1 20
03Q
3 20
03Q
1 20
04Q
3 20
04Q
1 20
05Q
3 20
05Q
1 20
06Q
3 20
06Q
1 20
07Q
3 20
07Q
1 20
08Q
3 20
08Q
1 20
09Q
3 20
09Q
1 20
10Q
3 20
10
Vac
ancy
Rat
e (%
)
Squar
e M
etre
s
Take Up (Sq M) Vacancy Rate (%)
0%
5%
10%
15%
20%
25%
30%
-
50,000
100,000
150,000
200,000
250,000
Q3
2000
Q1
2001
Q3
2001
Q1
2002
Q3
2002
Q1
2003
Q3
2003
Q1
2004
Q3
2004
Q1
2005
Q3
2005
Q1
2006
Q3
2006
Q1
2007
Q3
2007
Q1
2008
Q3
2008
Q1
2009
Q3
2009
Q1
2010
Q3
2010
Vac
ancy
Rat
e (%
)
Squar
e M
etre
s
Take Up (Sq M) Vacancy Rate (%)
NCC Costs of Doing Business in Ireland 2011 49 June 2011
66 McCartney, J, Predicting Turning Points in the Rent Cycle using the Natural Vacancy Rate – An Applied Study of the Dublin Office Market, Paper to the Statistical and Social Inquiry Society of Ireland, 2 November 2010 67 McCartney’s estimate is considerably higher than that of local industry practitioners. DTZ Sherry FitzGerald’s and Knight Frank’s view is that the NVR is 7 percent. This is a significant issue for market recovery because the 7 percent figure implies that, based on long term average absorption rates, real office rents in Dublin will continue to fall for about eight years before the market reaches equilibrium, while it may take only half of this if McCartney’s calculation is correct. Net absorption, however, was negative in 2009 and highly subdued in 2010. At the moment, this points towards a longer recovery period. 68 CSO, Database Direct 69 The Economist, Prime numbers: Commercial property has bounced back, but only in the best locations, Published in The Economist, Print Edition 3rd March 2011
McCartney argues that the Natural Vacancy Rate (NVR) in the Dublin office market rose to 15 percent
in 2000-09, up from 5 percent in 1978-9866. The NVR is the rate that corresponds with market
equilibrium and rent stability. Spaces can remain vacant for frictional reasons, or landlords waiting for
better offers. The rate rose due to the construction boom, speculative development and low interest
rates, meaning that landlords could hold on to property for longer. In this context, the drop required
from the current vacancy rate of 23 percent is perhaps not as large as commentators had believed and
Dublin may recover quicker than expected, with this recovery rippling out to the rest of the country in
time67. It is important to note that the NVR varies by location and type of space - it is likely to be
higher in out-of-town areas than prime areas. In particular, the commercial property market in Dublin
differs significantly from the market elsewhere in the country.
Those working in the industry are concerned that the costs of building makes economic returns
unlikely in the current market and, therefore, new commercial buildings will not be developed for
some time. The supply of new stock is, however, drying up quickly. Planning permission for non-
residential construction has fallen from a floor area of 2.75 million square metres in Q3 2007 to just
415,000 square metres by Q3 2010, and to 254,000 square metres in Q4 201068.
This is not a great concern for many places with a surplus of property, but the lack of new Grade A
office space in Dublin may lead to a shortage. Those who we consulted within the sector estimated
that there was only 18-24 months of existing available supply left of such stock and little prospect of it
being replenished in the current environment. It is this space that is in greatest demand and needs to
be available to attract new FDI. Therefore, although, overall, there may be an overhang of property
space for some time, there is likely to be a shortage of new prime space in the short to medium term.
This reflects international experience – according to a recent Economist report, high vacancy rates are
not the same as an excess of high quality office space. It would appear that in many developed
economies, the majority of vacant commercial properties are located in non-prime areas69.
4.4 Drivers of Demand and Supply
Property costs are a reflection of the interaction of demand and supply drivers, so any analysis of
recent property cost trends must consider these drivers and the factors that underpin them. The
demand drivers are those that produce occupier-led demand for space. The supply drivers are the
factors that encourage developers to produce office and industrial, although there is inevitably some
overlap between them.
NCC Costs of Doing Business in Ireland 2011 50 June 2011
70 Note that this figure represents both a flow figure but can also be seen as a driver of demand. 71 CBRE Research, 2009 72 McCartney, J., An Empirical Analysis of Development Cycles in the Dublin Office Market 1976-2007, ESRI Quarterly Economic Commentary, Winter 2008, pg68-92 73 McCartney, J, Predicting Turning Points in the Rent Cycle using the Natural Vacancy Rate – An Applied Study of the Dublin Office Market, Paper to the Statistical and Social Inquiry Society of Ireland, 2 November 2010 74 These cities represent Dublin’s likely regional competitors in commercial property terms – they are largely in the same part of Europe and could be considered in the ‘second tier’ after international global capitals such as London, Paris, etc. CBRE Research, 2009 75 McCartney, J., An Empirical Analysis of Development Cycles in the Dublin Office Market 1976-2007, ESRI Quarterly Economic Commentary, Winter 2008, pg68-92 76 McCartney, J., An Empirical Analysis of Development Cycles in the Dublin Office Market 1976-2007, ESRI Quarterly Economic Commentary, Winter 2008, pg68-92 77 They lend for the purchase of land; for the development of new and existing buildings; to finance construction projects; to non-banks and finance companies that may finance real estate; and to non-financial firms based on real estate collateral.
4.4.1 Demand Drivers A range of factors encouraged demand for office and industrial space. In the main, economic growth
and the expansion of the economy are the primary explanations for increased levels of demand for
commercial property:
The growth of the Irish economy: From the 1990’s onwards, Ireland frequently exhibited growth
rates between 6 and 10 percent, more than three times the European average rate. Initially built
on competitiveness factors, the latter stage of the boom was credit driven.
Success in attracting FDI: In 2000-09, average take up of office space in Dublin city centre was
115,000 square metres, at least 30 percent greater than in its regional competitors70. Half of this
was accounted for by overseas occupiers71. Financial services firms, in particular, were attracted
to the Dublin market with the advent of the International Financial Services Centre. The share of
Dublin office take-up accounted for by financial services firms rose from less than 7 percent in
1999 to 45 percent by 200772.
4.4.2 Supply Drivers There was a rapid increase in new supply in the period 1999-2010, during which Dublin’s total stock of
modern new office space rose by 129 percent73. The size of the Central Business District (CBD) in
Dublin, at 2.1 million square metres, is slightly higher than that of Edinburgh; about one-quarter
greater than other competing cities such as Manchester, Birmingham and Glasgow; and nearly double
that of Belfast and Amsterdam74. McCartney also demonstrates that the Dublin market appears to have
a 10-year cycle of office completions, with peaks in the numbers of offices completed swiftly followed
by dips in 1991-92, 2001-04 and from 200875. Take-ups and rents exhibited similar cyclical patterns.
This type of pattern is also seen in other countries and is not unusual; in fact, it seems the natural
order in commercial property cycles.
As the city centre built up, office development moved to the suburbs (out of town market), which
accounted for more than one-third of the Dublin office market by 200876. The factors that drove
supply included:
Cost and availability of credit: Banks were the most important sources of funding for the
commercial property sector77. At the end of 2003, net indebtedness of Irish banks to the rest of
the world was just 10 percent of GDP, but by early 2008, this had climbed to over 60 percent. The
banks were also attracted by the boom in property. They increased the share of their assets in
NCC Costs of Doing Business in Ireland 2011 51 June 2011
78 Honahan, P., Resolving Ireland’s Banking Crisis, Paper prepared for UCD-Dublin Economic Workshop Conference, ‘Responding to the Crisis’, 12 January 2009 79 DTZ Sherry FitzGerald (2010) estimates that land prices have fallen by 60-95% from mid-2006.
property related lending from under 40 percent pre-2002 to over 60 percent by 200678. A booming
property market raised the capital base of the banks and they, in turn, were able to lend more. In
addition, real interest rates have been very low since Ireland joined the Eurozone.
Construction costs were running at annual rates of around 6 percent during the property boom,
caused by a combination of rising costs of materials as well as labour costs. Increased costs of
construction can increase the cost of buildings. However, it is not clear the extent to which
construction costs were simply an effect of the boom or a key causal factor. The cost of land
undoubtedly rose sharply in Ireland during the boom and there is strong anecdotal evidence that it
has fallen sharply in the bust phase79.
Planning system: Local authorities have an incentive to allow commercial development in order to
raise commercial rates or gain infrastructure improvement through planning gain. This produced
supply led development, where councils competed to attract developers of commercial properties.
In Dublin, the fragmentation of its planning system encouraged suburban local authorities to
compete for rateable developments by zoning increasing amounts of land for commercial use.
Taxation: a range of taxation schemes (e.g. Urban Renewal Scheme, Enterprise Areas, Rural
Renewal Scheme, etc.) were introduced to stimulate development by offering tax advantage (e.g.
accelerated capital allowance for capital expenditure, rent allowances, etc.) for property
development. Mortgage interest relief supported the residential market.
4.5 Conclusions and Recommendations
At the broadest level, the intent of the recommendations set out below is to outline a series of policy
actions to improve the efficiency of the Irish property market in order to reduce the costs of doing
business in Ireland and reduce the potential for future boom-bust cycles by smoothing cycles. The
recommendations are divided into three categories:
(i) Recommendations to provide certainty to all stakeholders about the long term viability of the
commercial property market;
(ii) Recommendations designed to reinvigorate the commercial property market in Ireland in the
short term - despite recent negative experiences, a properly functioning property market is a vital
part of any vibrant economy; and
(iii) Recommendations to support sustainable development over a longer time horizon.
This categorisation is not in any way exclusive – in many cases recommendations, if implemented could
have a positive impact across all segments of the market.
4.5.1 Market Certainty In order for buyers and sellers to engage in activity, and to behave in a rational manner, steps are
required to enhance confidence in the market. There are two major issues at play here – the lack of
available information relating to all elements of commercial property transactions (i.e. price, quality

NCC Costs of Doing Business in Ireland 2011 52 June 2011
80 The Property Services (Regulation) Bill 2009, if enacted, will establish the Authority. It is scheduled to be operational in 2011.
etc.); and the role that NAMA will play in the property market over the coming decade.
Tackling imperfect information Imperfect information restricts the ability of market agents and others to make rational decisions.
Unless businesses and consumers feel that they have adequate information to make informed decisions
(e.g. confident that they have up-to-date and accurate information relating to prevailing and future
market conditions) they will be reluctant to engage with the market. International experience (e.g.
Finland) suggests the provision of detailed relevant and timely data is a key element in ensuring an
efficiently functioning commercial property market. In the case of commercial property, the only
fairly comprehensive and widely available data is on the Dublin office market.
In Ireland, the Property Services (Regulation) Bill, 2009 is currently under consideration by the
Oireachtas. The purpose of the bill is to establish a Property Services Regulatory Authority (PSRA).
Once established, the PSRA will aim to achieve uniformity and transparency in licensing, regulation
and the provision of property information to the public - its role will include providing transactional
information within a property database80. Given the dearth of property related data in Ireland, the
development of the database should be expedited. This database should act as a directory for both
residential and commercial property. It is vital that information on both purchasing and leasing be
captured relating to:
Price
Quantity (e.g. floor space)
Quality (e.g. location, finish).
Role of NAMA While the strategy and role of NAMA is clear, there remains some uncertainty about the potential
impact that NAMA might have and this will need to be resolved before confidence can be injected back
into the commercial property market.
NAMA is likely to be the primary source of working capital for developers for a number of years given
the condition of the banks. If NAMA is too risk averse, all but the safest developments will be denied
access to finance. The developments that it allows to go-ahead and those which it stalls or mothballs
will have a very significant bearing on the market in terms of the product that developers can build
and it’s pricing. More information is required to enable the market to plan effectively. In particular,
there is concern that this uncertainty will reduce the likelihood of investors developing new, high
quality office stock in Dublin – as noted previously, it is estimated that there is only approximately 18-
24 months’ supply of such stock remaining. A lack of stock would push up prices again and would
represent a loss of competitiveness vis-à-vis other locations.
NAMA needs a clear implementation plan which is transparent to all those involved in the commercial
property market. It has significant ability to affect the market and determine prices for commercial
NCC Costs of Doing Business in Ireland 2011 53 June 2011
81 The proposal to abolish mortgage interest tax relief is a step in the right direction as Ireland is the only country in the OECD to give such relief without having a tax on primary residences.
properties in specific areas. While accepting the need to protect commercially sensitive data, more
information is required on:
The loans that it has acquired and how it proposes to deal with unfinished developments, as well
as its criteria for future provision of development finance. This may emerge as NAMA becomes
fully operational.
How NAMA assets will be disposed of - an orderly programme of disposals and interventions that
does not distort the market in either direction is desirable – in essence, this means that properties
should brought to the market on a phased basis over the course of the next few years.
4.5.2 Reinvigorating the Commercial Property Market
At present, Ireland has a stock of commercial property consisting of both occupied and vacant
properties. We also have a large pool of existing enterprises, and a pool of potential
entrepreneurs/enterprise who would consider entering the Irish market if conditions were supportive
of such a move. We must ensure, therefore:
(i) That the property related costs faced by enterprises already operating in Ireland are
internationally competitive;
(ii) That potential new entrants are not dissuaded from establishing in Ireland as a result of
excessive property prices; and
(iii) That those enterprises already in operation here are not placed at a disadvantage compared
with new entrants as a result of legacy issues.
Two main issues requiring redress fall under this heading:
Taxation and rates; and
Rents.
Taxation and Rates Ireland is one of the few developed countries in the OECD which does not raise significant revenues
from a recurring property tax on residential property. The introduction of a property based tax on
residential property to replace transaction taxes would provide a timely boost to the residential
property market and would provide more certainty in relation to Government revenues (i.e. revenue
would not be dependent on the vagaries of market conditions and would not be prone to large
fluctuations year-on-year). Ultimately such taxation would help Ireland to avoid the worst extremes of
property market cycles.
The NCC recommends that a broadly based and equitable valuation based residential property tax
should be introduced as quickly as possible. A recurring property tax can be designed to be progressive
(i.e. those in larger houses and/or living in more expensive areas would pay more). Given the time
required to fully implement a valuation based tax and the necessity to raise additional tax revenues
quickly, interim measures should be devised on a self assessment basis similar to the tax on second
homes81.
NCC Costs of Doing Business in Ireland 2011 54 June 2011
82 While there are tiered rates under this aggregate consideration, there would not be applicable in the majority of commercial transactions. Transfers between intra-company groups are not liable to stamp duty, subject to criteria. 83 Some County Council’s (e.g. Dún Laoghaire-Rathdown) have announced revised annual rates on valuation for 2011. 84 Note that the issue of reforming local government funding has already been considered as part of the work of the Local Government Efficiency Review Group. The recommendations set out by their in the report were designed to yield an estimated €511 million saving - representing 11 percent of 2010 current expenditure. 85 Land and Conveyancing Law Reform Act, 2009
This recommendation would also represent a move away from transaction based property taxes.
Smaller occupiers that are expanding and creating jobs and that, therefore, may have to move every
3-5 years would appear to be punished by having to repeatedly pay stamp duty – the top rate of 6
percent is applied on transfers of commercial property and business assets above an aggregate
consideration of €80,00082. Alternatively for business leasing their properties, stamp duty on rent is 1
percent of the average annual rent where the term does not exceed 35 years or is indefinite.
Companies need to be able to move regularly and cheaply, therefore, stamp duties for these types of
companies could be reduced on a sliding scale each time they move.
The issue of commercial rates is also a key concern for enterprise. Commercial rates are a property-
based source of income that is levied by local authorities on the occupiers of commercial and
industrial properties. Rates are calculated on the basis of the Rateable Valuation (an estimate of the
annual rental value of a property determined by the Commissioner of Valuation and set out in a
Valuation List) multiplied by the Annual Rate on Valuation (which is decided upon by the relevant City
or County Council)83. The revenue raised by commercial rates is used to fund local authority services84.
Rent and Rent Reviews Occupational leases in Ireland have typically been long-term in nature; often up to 25 years. The
duration of such leases has been falling in the UK, to around 10-20 years, and reviewed in the open
market roughly every five years. In places such as Amsterdam, leases are typically for 5-10 years and
reviewed annually in line with inflation.
Legislation has been introduced in Ireland to ensure that all new leases signed from March 2010
contain a provision that rents can be reviewed both upwards and downwards on review85. Previously,
rents could only normally be reviewed on an ‘upwards only’ basis at review under the terms of lease.
Upward only clauses incentivised landlords to hoard property and time lettings at the top of the
market.
While this legislation is welcome, it does nothing for existing enterprises, tied into long term leases at
rates significantly above current market rates. At a time of tightening margins, this is a concern.
Furthermore, in creating a two-tier rental market, the continued existence of otherwise viable
businesses may be threatened – new competitors could potentially be able to offer a good or service at
a lower price due to their lower rental cost base. Existing firms have no recourse to a downward rent
NCC Costs of Doing Business in Ireland 2011 55 June 2011
86 The Attorney General has previously stated that the Government could not enact legislation requiring the removal of upward-only rent review clauses from existing leases because to do so would be unconstitutional. Article 15 of the Constitution restrains the Government’s power to enact retrospective laws. Regulation of existing contractual obligations, however, has previously occurred. The Landlord and Tenant (Amendment) Act 1980 came into effect in respect of both new and existing contracts. Some concern has been expressed about the impact that the abolition of upward only reviews might have on investment – it has been suggested that the removal of the upwards only review will negatively affect liquidity and impact upon investor demand in an already deflated investment market. Similarly, changes in rental agreements could adversely impact upon pension funds. 87 Commission on Taxation, Report 2009
review, and so they may find themselves unable to compete. The NCC recommends, therefore, that
the feasibility86 of introducing legislation to facilitate downward rent adjustments for existing
leaseholders be explored further.
It is also worth noting that the State has another role to play in ensuring that commercial (and
specifically office) rents are competitively priced. The National Recovery Plan 2011-2014 states that
the Office of Public Works will lead a coordinated effort to reduce office rents by up to 15 percent and
review the efficiency of property arrangements across the public sector. These commitments now
need to be progressed.
4.5.3 Sustainable Development Despite the current downturn, and regardless of exactly how much stock remains vacant at present,
Ireland will inevitably require investment in and development of commercial property in the coming
years. It is important, therefore, that policies are put in place now that facilitate this development in
a manner that is sustainable, competitive and supportive of enterprise needs.
Tax Incentives and Development Levies Tax incentives (also called tax expenditures) played an important role in stimulating the property
boom. When used correctly to address specific market failures, taxation can be an effective tool. In
order for taxation to be effective, however, it must be targeted where the market failure is occurring
and on a time-allocated basis. It should be monitored and assessed and removed if the market failure
has been tackled. When enacting such incentives it is important that a deadline is included and that
the administrative process facilitates the collection of the data necessary to conduct evaluation, as
outlined in the Commission on Taxation Report87. This avoids perverse incentives being created
leading to oversupply, and ultimately a loss of value. In Ireland’s case, the existence of attractive tax-
based incentive schemes encouraged investment in property rather than in other productivity-
enhancing activities. While a range of property reliefs have been wound down in recent years, it is
important that the remaining schemes be addressed in the short term.
In terms of local development, the local authorities need to adapt and update the manner in which
they implement levies on developments, employing the legal mechanisms for such levies under the
Planning Act. Firstly, more prioritised and integrated plans based on realistic as opposed to
aspirational estimates of future development requirements should reduce the cost of providing
essential infrastructure. Reductions in construction costs have already reduced these costs. Local
authorities should harness the efficiencies above, and develop more robust and transparent charging
mechanisms for local authority charges that match levies with the economic cost of providing
development. A move to a more coordinated planning system (as well as the downturn in property

NCC Costs of Doing Business in Ireland 2011 56 June 2011
88 Experience in the Netherlands highlights how planning can hinder an effective approach to development, with too many local planning authorities, making it difficult to coordinate a national approach to development and prioritise opportunity areas. 89 DoEHLG, Spatial Planning and National Roads – Consultation Draft, Guidelines for Planning Authorities, June 2010 – these guidelines provide the policy to guide planning authorities in planning where major projects will now be sited at or near major national roads and transport nodes.
values) may mean that development will no longer take place where there is not already a suitable
level of infrastructure, meaning that levies could be reduced. Reductions in levies may also help areas
to attract inward investment. The design and use of development contributions should be re-examined
to ensure that it provides a fair and equitable means of enabling infrastructure to facilitate
development at the right locations and in a manner that does not prohibit inward investment and
commercial activity. The Department of the Environment, Communities and Local Government intends
to develop new guidelines on the operation of the development contribution schemes by the end of
2011.
Planning Reform The strategic and coordinated planning system plays a vital role in facilitating commercial
development and activity, both in planning for adequate supply in the right locations and in
facilitating development through coordinated and enabling infrastructure. The multiplicity of
development plans across 88 planning authorities in Ireland, however, has produced an excess supply
of zoned land which in turn, has tended to facilitate over-provision of commercial property, often with
buildings in the wrong place or of the wrong type for areas and without adequate infrastructure to
serve them (e.g. public transport, sewage, etc.)88. The challenges of planning commercial
development through local authority based planning is hindered by the lack of nationally and
regionally authenticated demand forecast data in Ireland which might be used to inform the planning
process. This is an area where the various enterprise agencies need to work proactively with the
Department, regional and local authorities in addressing the need for and methodologies in providing
information.
Some progress is being made. A more coordinated approach to planning is being realised (e.g. the
Department of Environment, Community & Local Government core strategy and related provisions
outlined in the 2010 Planning (Amendment) Act which provide for more coherent planning between
national, regional and local levels and guidelines on spatial planning and national roads89). Efforts are
underway by the Department of the Environment to map local authority development plans onto a
national, multi-layered GIS system will also greatly help to inform the existing commercial zonings.
Coordination at a regional level is also improving – new regional planning guidelines (RPGs) and
regional competitiveness agendas (targeted at EI and IDA Ireland), and local initiatives, for example,
in Cork, where both Cork City and County Councils are working together to agree on development
plans, within the framework of the non-statutory Cork Area Strategic Plan (CASP).
Inevitably, to have a more strategic and coordinated approach, will require a greater role for central
Government, regional, and local authorities agreeing to work together to coordinate their
development plans. In particular, developments of regional or national importance should be dealt

NCC Costs of Doing Business in Ireland 2011 57 June 2011
90 This is not a straight-forward exercise - there is a substantial difference between being able to estimate population growth and zone accordingly for residential development and being able to forecast more unpredictable commercial demand. If, however, satisfactory evidence can be identified to help inform zoning and infrastructure decisions, then the planning system will be better geared to predict and cater for new commercial development. 91 Department of the Environment, Heritage and Local Government, Guidelines for Planning Authorities on Sustainable Residential Development in Urban Areas (Cities, Towns & Villages), May 2009 92 Chambers Ireland have recently published a research paper, Strategic Infrastructure Planning: Making it Better, which sets out a series of recommendations designed to improve the efficiency of the planning system, to reduce the costs of planning and to ensure decisions are taken in a timely fashion. Chambers Ireland have noted that, on average, An Bord Pleanála took 31 weeks to process a major infrastructure appeal 2008 and 26 weeks in 2009, compared with an 18 week statutory guideline target.
with at a regional/national level (e.g. development of sufficient size or strategic importance for the
region/country). This may mean a more active and coordinated role for the Department of
Environment, Community & Local Government in guiding commercial development to appropriate
locations, in addition to its current focus on residential property (e.g. in setting stronger guidance and
advising on commercial development and in developing a framework to assess the demand for
commercial floor space, much as it does for residential development through population and
household projections)90.
This guidance may involve helping local authorities to form development plans and ascertaining the
impact of specific commercial proposals on development plans. It may also more clearly set out the
rationale for zoning land for commercial purposes. Currently, the primary rationale in many parts of
the country is to attempt to attract employment. However, a demand led, planned approach is a
prerequisite for sustainable development. In all cases, a demand assessment should undertaken to
inform development plans and zoning (i.e. evaluating demand and supply drivers, the prospects for
growth, incentives and barriers to development, analysis of other developments and benchmarking
with other similar areas of the country).
Other changes to planning in Ireland should also be considered:
Increasing the density of Irish cities could lower land, construction and infrastructure costs, and
offers the possibility of increasing the supply of both commercial and residential property in a
more cost effective and environmentally sustainable manner – this has been recognised in the
Department of the Environment’s residential planning guidelines which recognises the importance
of placing high density housing proximate to existing or due to be improved public transport
corridors91.
Minimising delays in planning can have beneficial implications for the costs of infrastructure
delivery. Greater certainty is required in relation to the time it takes for decisions to be reached
by the planning authorities, particularly in relation to major planning applications. It is also
important to ensure that the costs of the submitting an application for planning for a strategic
infrastructure project do not deter potential investors92;
In this regard, the Council notes the work currently underway to modernise the foreshore consent
process and integrate it within the wider planning system, and the short-term administrative
improvements that have already taken place. Given the urgent need for reform of the foreshore
consent process to support economic recovery and jobs, the Department of the Environment,
Heritage and Local Government has commenced work on the development of the General Scheme
of a Bill. Specifically, the Bill will seek to:
Integrate the foreshore and offshore consent processes for major strategic infrastructure

NCC Costs of Doing Business in Ireland 2011 58 June 2011
93 ePlanning is designed to provide a consistent level of service across Scotland and to make the Planning System simpler, faster and more accessible. It is intended that ePlanning will deliver a range of online and workplace tools, allowing the public and professionals to access policy documents, apply for planning permission, track progress, make comments, understand decisions, and appeal against decisions. ePlanning is also intended to improve the quality and availability of local development plans and planning information online. See ePlanning.scotland.gov.uk 94 This is a role undertaken by regional development agencies in the UK in instances of market failure. In Ireland, IDA Ireland also plays a significant role in this regard.
projects within the strategic consent process operated by An Bord Pleanála;
Integrate the foreshore consent process for non strategic infrastructure projects within the
wider planning system operated by the local authorities; and
Provide for a plan-led approach to the foreshores through the development of coastal zone
management objectives in the forward planning hierarchy, and in the medium term the
development of a marine spatial planning framework.
The proposed approach to integrating the foreshore consent process within the planning system is
also focused on streamlining parallel consent processes, reducing unnecessary regulatory burden
and costs, both for the State and the applicant.
In order to improve the efficiency of the planning process, the Council supports the rollout of
ePlanning which is currently being undertaken by the Department of the Environment, Heritage
and Local Government, as has successfully been introduced recently in Scotland93.
Coordinating the Provision of Infrastructure While there do not appear to be strong market failure grounds to justify public sector intervention in
the direct provision of commercial buildings, the public sector can facilitate commercial development
through the provision of key enabling infrastructure (e.g. transport, energy, telecommunications,
environmental)94. Ireland has made significant progress in terms of improving our physical
infrastructure in recent years. It is essential to continue to prioritise investment to ensure Ireland’s
physical infrastructure can support economic recovery. Investment in infrastructure is essential to
ensure that a sufficient supply of serviceable development land is available and to ensure that the
commercial sector can maximise the use of existing properties. However, it is equally important (in
relation to the user pays principle) that proportionate costs should also be borne by the developers
who will be benefitting substantially from State investment.
As a result of cuts in departmental budgets, with the consequential impact on capital allocations for
infrastructure, there is a need to prioritise the rollout of projects. Prioritisation should be based on
the extent of each project’s contribution to the following strategic outcomes:
It is industry demand led;
It tackles thematic issues of national or regional importance - given the central role that Dublin
and our other cities play in driving national competitiveness, prioritisation should focus resources
on their development.;
It has impact within the enterprise sector and the wider economy;
Its impact could not be achieved with a different approach or with greater efficiency of
government investment;
It generates value for money, leverage and commercial return;
There is consideration of the risks involved, especially the dependency on others to deliver; and
NCC Costs of Doing Business in Ireland 2011 59 June 2011
95 Eurostat, Statistics in Focus: Comparative Price Levels for Construction in 33 European Countries for 2005, 108/2007 96 Eurostat online data base. 97 Serviced land refers to land that has “the necessary water, sewerage, transport and other services required to bring the land into development and sufficient for planning permission to be granted and construction to commence” 98 The Kenny report, which was published in 1973, was prepared by the Committee on the Price of Building Land which was chaired by Mr. Justice Kenny, Its key objective was to identify measures to control the price of land required for housing and other development.
The project could not be delivered by another body.
We also need to deliver future infrastructure investment more efficiently. A more integrated
approach to infrastructure planning is required to promote improved efficiency, effectiveness and
competitiveness. Coordinating the rollout of different infrastructure services (e.g. roads, telecoms,
water, energy) also has the potential to deliver significant cost savings particularly where projects are
undertaken simultaneously. To ensure that infrastructure is delivered efficiently in Ireland may
require institutional change to promote improved coordination of infrastructure planning and delivery.
Construction costs Ireland is an expensive country in terms of costs of construction – according to Eurostat data,
construction prices in Ireland were amongst the highest in Europe in 2005. Based on a comparative
price indicator, overall construction prices in Ireland were 40 percent above EU average price levels;
in terms of residential buildings, Irish prices were 52 percent above EU27 prices, while for non-
residential buildings, Irish prices were 33 percent above the EU average95. Construction costs have
fallen since the height of the boom as measured by a variety of construction price indices – by 2009
residential construction costs and non-residential building costs in Ireland were equivalent to 101
percent and 97 percent of the EU27 average respectively96. However, these falls do not appear
sufficient to encourage a resumption of construction activity – thus contributing to fears over a deficit
of Grade A office space in Dublin in the next two years.
In the short run, property prices drive land prices. In the medium to long run, a greater supply of
zoned and serviced land97 will reduce house prices, other things being equal. While land costs have
fallen dramatically, this is a cyclical response to the recession rather than a result of structural
change. Without structural change, we could expect a return to excessive property price inflation
when the economy returns to growth. We must ensure that we never again have a rampant property
bubble. In the 2010 Competitiveness Challenge report, the NCC noted that in the early 1970s, the
Kenny report identified measures to control the price of development land but its recommendations
were never implemented98. Given the serious consequences of the recent property boom and
subsequent collapse, the NCC recommends the establishment of a high level independent review group
mandated to put forward policy recommendations to ensure that we never again have a sustained
property bubble.
NCC Costs of Doing Business in Ireland 2011 60 June 2011
5. Utility Costs
5.1 Summary
This section examines the main utility costs for business – energy, waste treatment, water services
and telecommunications.
The cost of industrial electricity for large energy users in Ireland decreased significantly (-27%) in
2010. Ireland is now the fifth cheapest of the 14 benchmarked countries and costs are lower than
the euro area average (Figure 5.1). Despite reductions also being recorded for electricity costs for
SMEs in 2010, Ireland remains the fourth most expensive location benchmarked, although the gap
with the euro area average continued to narrow (Figure 5.2). While these recent price falls are
welcome, they are unlikely to be sustained as they are largely due to the steep decline in global
fuel prices (gas and coal) and temporary subsidies which are to be phased out by the end of 2012.
Recent increases in international fuel costs will lead to higher energy costs for business since Ireland
is heavily dependent on imported fossil fuels for power generation.
Ireland is relatively competitive in terms of industrial gas prices (Figure 5.3) and Irish industrial gas
prices are 12 percent below the euro area average. This is a significant improvement for Ireland
which ranked as the seventh least expensive benchmarked location for industrial gas in 2008.
Looking at Ireland’s cost performance for environmental utilities (which include water and waste
water services and waste treatment services), the average cost of treated water services in Ireland
increased by 0.8 percent between 2010 and 2011. Based on 2009 data – the most up to date
available that is internationally comparable - Ireland is competitive with our main trading partners
on this measure (Figure 5.4). However, there was a more significant increase in the cost of waste
water services of 4.1 percent in Ireland between 2010 and 2011. No internationally comparable data
is available for waste water costs.
In terms of waste costs, the Irish landfill gate fee is often lower than the advertised fee as the gate
charge can be negotiated based on a number of factors (e.g. the volumes of waste offered, the
source of the waste etc.). Based on 2010 survey data, the average price that could be negotiated in
the Irish market ranged from €86 to €111 per tonne (including the levy). Singapore and New Zealand
are the cheapest location for landfill (Figure 5.5). Massachusetts is the cheapest location for
thermal treatment at a cost of €46 per tonne - Flanders the most expensive of the benchmarked
locations at €110 per tonne (Figure 5.6). Currently, there are no commercial thermal treatment
plants in operation in Ireland99.
With regard to telecommunications, Ireland ranks as the eighth most expensive location of the 13
countries benchmarked for a basket of business calls (excluding VAT) , and is almost 5 percent
99 200,000 tonnes of capacity is to come on stream in mid 2011, with a further 600,000 tonnes planned for 2014. A number of mechanical biological treatment facilities have also been developed with others in planning. Such developments will help provide a more diverse and competitive range of waste treatments.
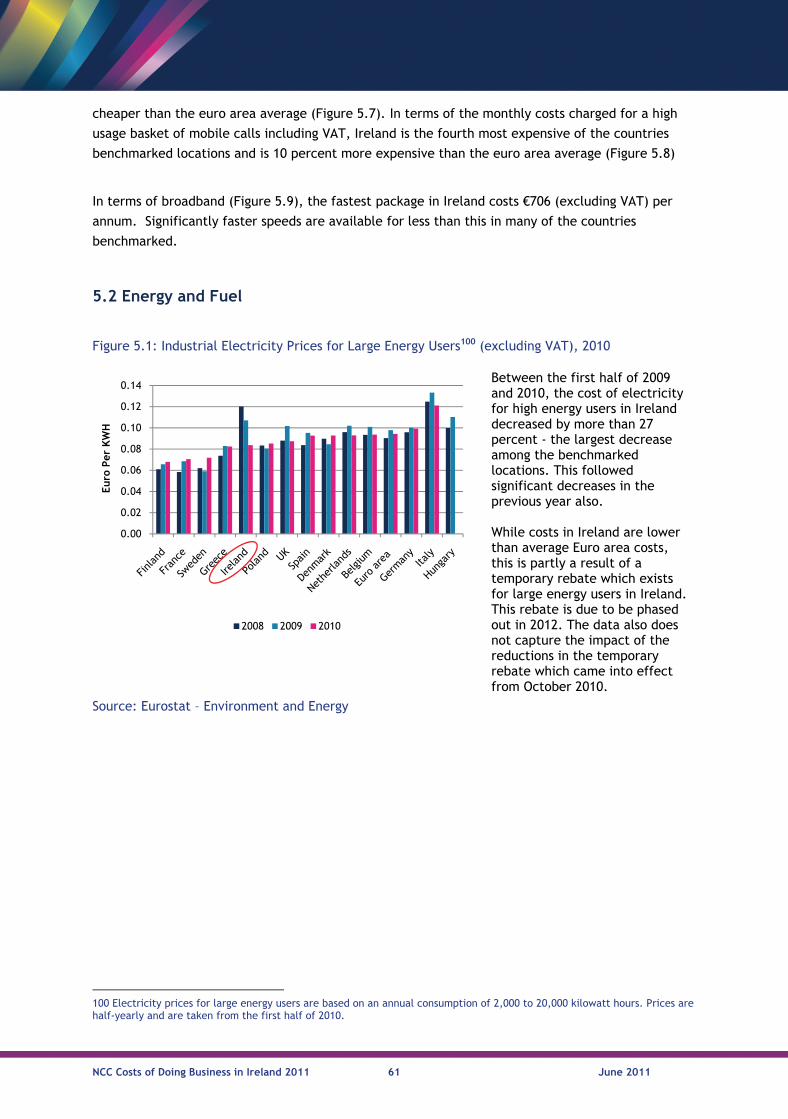
NCC Costs of Doing Business in Ireland 2011 61 June 2011
cheaper than the euro area average (Figure 5.7). In terms of the monthly costs charged for a high
usage basket of mobile calls including VAT, Ireland is the fourth most expensive of the countries
benchmarked locations and is 10 percent more expensive than the euro area average (Figure 5.8)
In terms of broadband (Figure 5.9), the fastest package in Ireland costs €706 (excluding VAT) per
annum. Significantly faster speeds are available for less than this in many of the countries
benchmarked.
5.2 Energy and Fuel
100 Electricity prices for large energy users are based on an annual consumption of 2,000 to 20,000 kilowatt hours. Prices are half-yearly and are taken from the first half of 2010.
Figure 5.1: Industrial Electricity Prices for Large Energy Users100 (excluding VAT), 2010
Between the first half of 2009 and 2010, the cost of electricity for high energy users in Ireland decreased by more than 27 percent - the largest decrease among the benchmarked locations. This followed significant decreases in the previous year also. While costs in Ireland are lower than average Euro area costs, this is partly a result of a temporary rebate which exists for large energy users in Ireland. This rebate is due to be phased out in 2012. The data also does not capture the impact of the reductions in the temporary rebate which came into effect from October 2010.
Source: Eurostat – Environment and Energy
0.00
0.02
0.04
0.06
0.08
0.10
0.12
0.14
Euro
Per
KW
H
2008 2009 2010
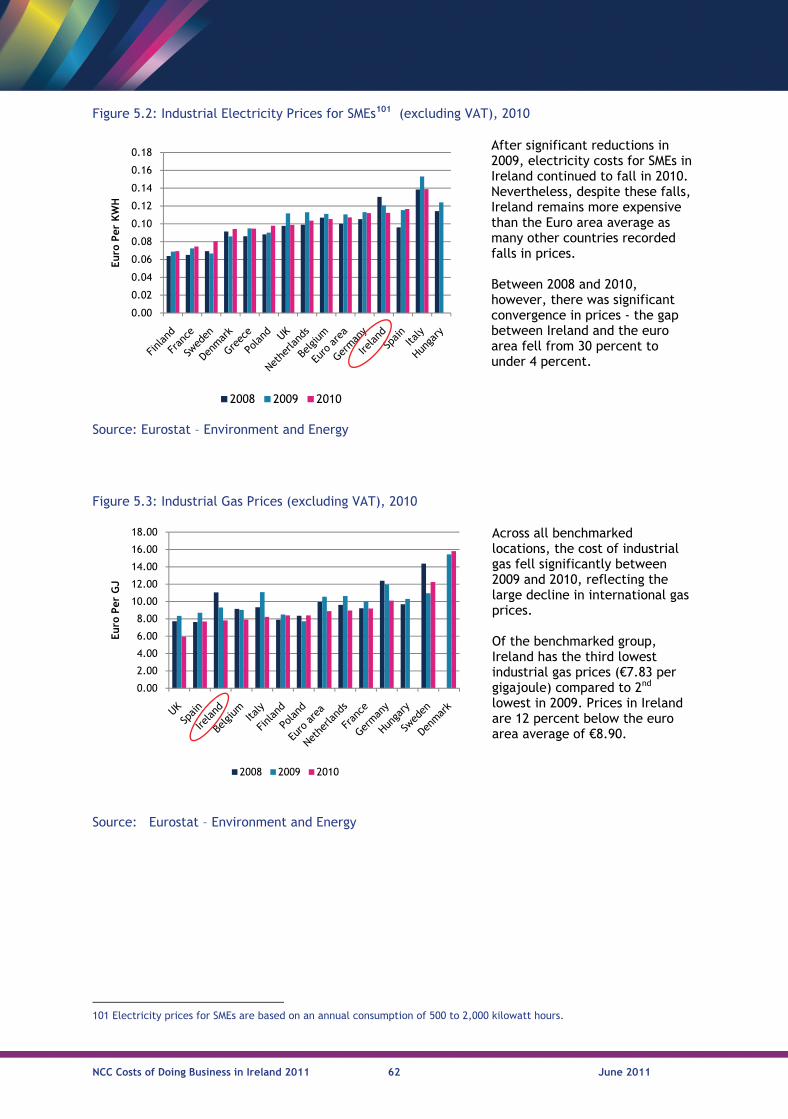
NCC Costs of Doing Business in Ireland 2011 62 June 2011
101 Electricity prices for SMEs are based on an annual consumption of 500 to 2,000 kilowatt hours.
Figure 5.2: Industrial Electricity Prices for SMEs101 (excluding VAT), 2010
After significant reductions in 2009, electricity costs for SMEs in Ireland continued to fall in 2010. Nevertheless, despite these falls, Ireland remains more expensive than the Euro area average as many other countries recorded falls in prices. Between 2008 and 2010, however, there was significant convergence in prices - the gap between Ireland and the euro area fell from 30 percent to under 4 percent.
Source: Eurostat – Environment and Energy
Figure 5.3: Industrial Gas Prices (excluding VAT), 2010
Across all benchmarked locations, the cost of industrial gas fell significantly between 2009 and 2010, reflecting the large decline in international gas prices. Of the benchmarked group, Ireland has the third lowest industrial gas prices (€7.83 per gigajoule) compared to 2nd lowest in 2009. Prices in Ireland are 12 percent below the euro area average of €8.90.
Source: Eurostat – Environment and Energy
0.00
0.02
0.04
0.06
0.08
0.10
0.12
0.14
0.16
0.18
Euro
Per
KW
H
2008 2009 2010
0.00
2.00
4.00
6.00
8.00
10.00
12.00
14.00
16.00
18.00
Euro
Per
GJ
2008 2009 2010
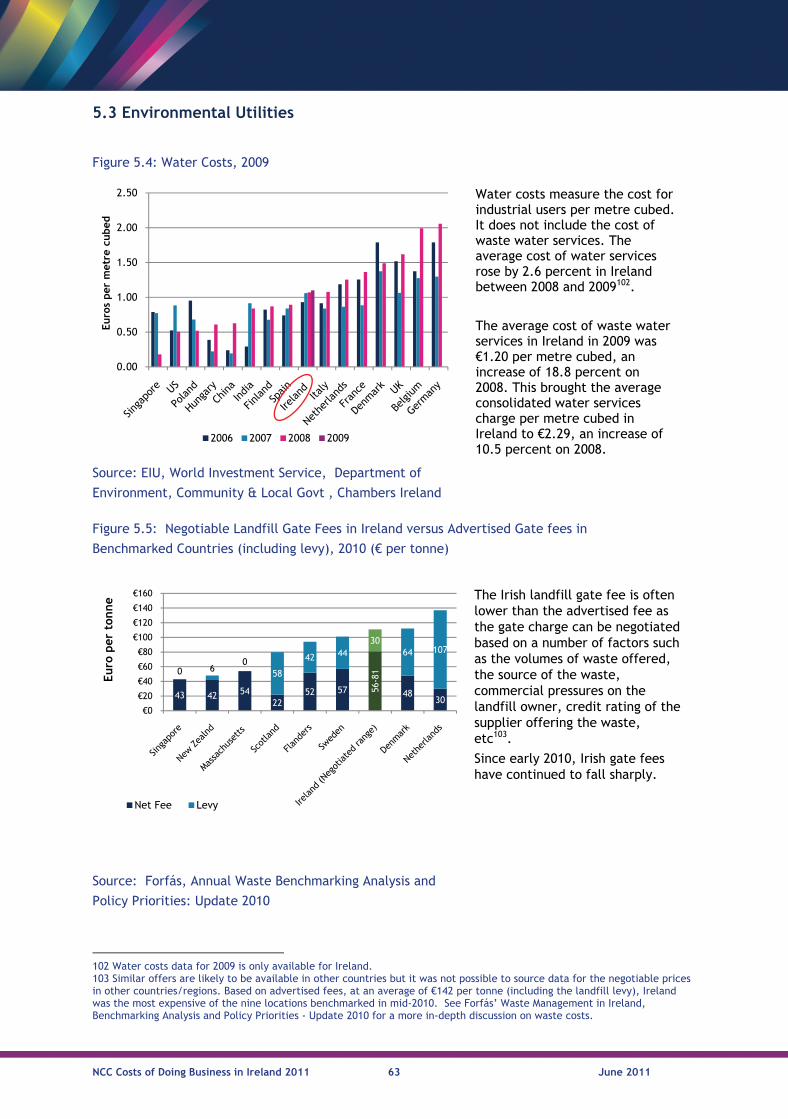
NCC Costs of Doing Business in Ireland 2011 63 June 2011
5.3 Environmental Utilities
102 Water costs data for 2009 is only available for Ireland. 103 Similar offers are likely to be available in other countries but it was not possible to source data for the negotiable prices in other countries/regions. Based on advertised fees, at an average of €142 per tonne (including the landfill levy), Ireland was the most expensive of the nine locations benchmarked in mid-2010. See Forfás’ Waste Management in Ireland, Benchmarking Analysis and Policy Priorities - Update 2010 for a more in-depth discussion on waste costs.
Figure 5.4: Water Costs, 2009
Water costs measure the cost for industrial users per metre cubed. It does not include the cost of waste water services. The average cost of water services rose by 2.6 percent in Ireland between 2008 and 2009102.
The average cost of waste water services in Ireland in 2009 was €1.20 per metre cubed, an increase of 18.8 percent on 2008. This brought the average consolidated water services charge per metre cubed in Ireland to €2.29, an increase of 10.5 percent on 2008.
Source: EIU, World Investment Service, Department of
Environment, Community & Local Govt , Chambers Ireland
Figure 5.5: Negotiable Landfill Gate Fees in Ireland versus Advertised Gate fees in
Benchmarked Countries (including levy), 2010 (€ per tonne)
The Irish landfill gate fee is often lower than the advertised fee as the gate charge can be negotiated based on a number of factors such as the volumes of waste offered, the source of the waste, commercial pressures on the landfill owner, credit rating of the supplier offering the waste, etc103.
Since early 2010, Irish gate fees have continued to fall sharply.
Source: Forfás, Annual Waste Benchmarking Analysis and
Policy Priorities: Update 2010
0.00
0.50
1.00
1.50
2.00
2.50
Euro
s per
met
re c
ubed
2006 2007 2008 2009
43 42 5422
52 57 56-8
1
4830
0 60
58
42 4430
64 107
€0
€20
€40
€60
€80
€100
€120
€140
€160
Euro
per
ton
ne
Net Fee Levy
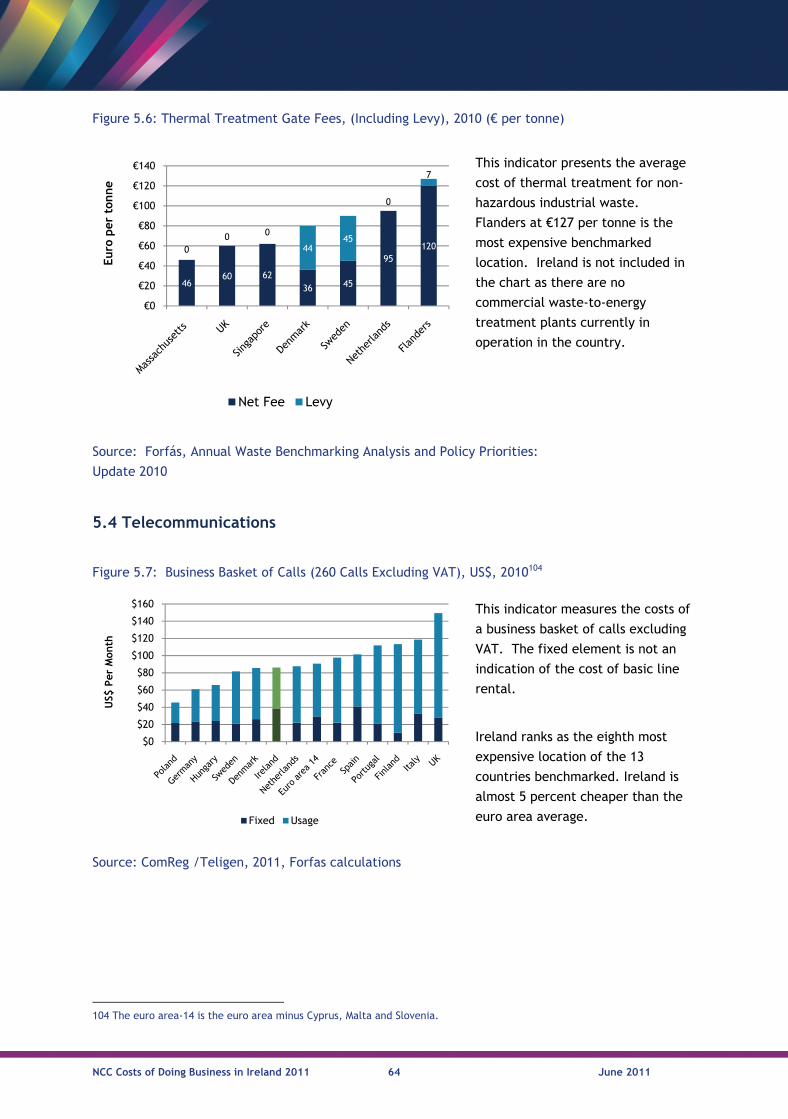
NCC Costs of Doing Business in Ireland 2011 64 June 2011
5.4 Telecommunications
104 The euro area-14 is the euro area minus Cyprus, Malta and Slovenia.
Figure 5.6: Thermal Treatment Gate Fees, (Including Levy), 2010 (€ per tonne)
This indicator presents the average
cost of thermal treatment for non-
hazardous industrial waste.
Flanders at €127 per tonne is the
most expensive benchmarked
location. Ireland is not included in
the chart as there are no
commercial waste-to-energy
treatment plants currently in
operation in the country.
Source: Forfás, Annual Waste Benchmarking Analysis and Policy Priorities:
Update 2010
Figure 5.7: Business Basket of Calls (260 Calls Excluding VAT), US$, 2010104
This indicator measures the costs of
a business basket of calls excluding
VAT. The fixed element is not an
indication of the cost of basic line
rental.
Ireland ranks as the eighth most
expensive location of the 13
countries benchmarked. Ireland is
almost 5 percent cheaper than the
euro area average.
Source: ComReg /Teligen, 2011, Forfas calculations
4660 62
36 45
951200
0 0
4445
0
7
€0
€20
€40
€60
€80
€100
€120
€140
Euro
per
ton
ne
Net Fee Levy
$0
$20
$40
$60
$80
$100
$120
$140
$160
US$
Per
Mon
th
Fixed Usage
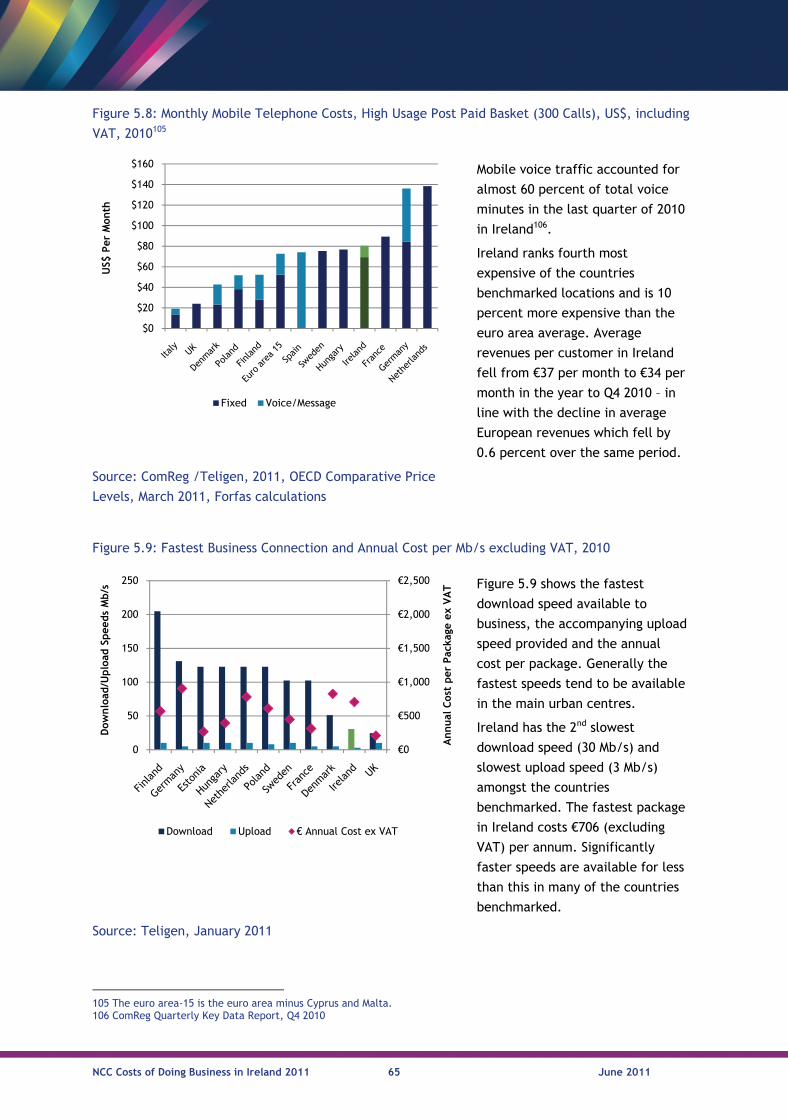
NCC Costs of Doing Business in Ireland 2011 65 June 2011
Figure 5.8: Monthly Mobile Telephone Costs, High Usage Post Paid Basket (300 Calls), US$, including
VAT, 2010105
Mobile voice traffic accounted for
almost 60 percent of total voice
minutes in the last quarter of 2010
in Ireland106.
Ireland ranks fourth most
expensive of the countries
benchmarked locations and is 10
percent more expensive than the
euro area average. Average
revenues per customer in Ireland
fell from €37 per month to €34 per
month in the year to Q4 2010 – in
line with the decline in average
European revenues which fell by
0.6 percent over the same period.
Source: ComReg /Teligen, 2011, OECD Comparative Price
Levels, March 2011, Forfas calculations
Figure 5.9: Fastest Business Connection and Annual Cost per Mb/s excluding VAT, 2010
Figure 5.9 shows the fastest
download speed available to
business, the accompanying upload
speed provided and the annual
cost per package. Generally the
fastest speeds tend to be available
in the main urban centres.
Ireland has the 2nd slowest
download speed (30 Mb/s) and
slowest upload speed (3 Mb/s)
amongst the countries
benchmarked. The fastest package
in Ireland costs €706 (excluding
VAT) per annum. Significantly
faster speeds are available for less
than this in many of the countries
benchmarked.
Source: Teligen, January 2011
105 The euro area-15 is the euro area minus Cyprus and Malta. 106 ComReg Quarterly Key Data Report, Q4 2010
$0
$20
$40
$60
$80
$100
$120
$140
$160
US$
Per
Mon
th
Fixed Voice/Message
€0
€500
€1,000
€1,500
€2,000
€2,500
0
50
100
150
200
250
Annual
Cos
t per
Pac
kage
ex
VA
T
Dow
nlo
ad/U
plo
ad S
pee
ds M
b/s
Download Upload € Annual Cost ex VAT
NCC Costs of Doing Business in Ireland 2011 66 June 2011
5.5 Policy Focus – Energy and Waste Recommendations
This policy discussion concentrates on two areas of primary concern – energy costs and waste costs.
In relation to the other two utilities examined:
Water costs: The NCC supports the introduction of user charges for consumers (e.g. water
charges for households) which broaden the tax base. The introduction of domestic water
charges will be accompanied by a programme of metering as well as structural reform in the
water services sector, including the establishment of a new semi-state water utility, Irish
Water, as well as the establishment of a regulator for the water sector.
Telecoms: The primary issue in the telecoms sphere relates to availability of key services (i.e.
access to high quality broadband in key regional centres) rather than to cost.
5.5.1 Energy Policy A reliable and competitively priced supply of energy is vital for business and its ability to compete
successfully in international markets. From a national competitiveness perspective, the challenge
facing Ireland is to reduce energy costs while delivering on our security of supply and environmental
sustainability objectives. The NCC welcomes recent measures to improve energy cost
competitiveness such as the efficiency improvements in the operating, maintenance and capital
costs of electricity networks and the legislation to recover the carbon windfall gains from electricity
generators107.
Driven by a steep fall in global fuel prices (gas, oil and coal), Irish industrial users enjoyed
reductions in energy prices over the last few years. In spite of recent declines in industrial
electricity costs, however, Ireland remains an expensive location for SMEs. As gas prices are likely to
increase in the future it is crucial that structural measures are progressed as a matter of urgency to
ensure a long term improvement in energy cost competitiveness. The phasing out of the current
temporary rebate for large energy users will further exacerbate the situation - this rebate was
introduced in 2009 for large energy users and has been reduced by 42 percent from 1st October
2010 and will be phased out completely by the end of 2012.
Looking at those aspects of energy pricing that can be influenced domestically, the issue of the
public service obligation (PSO) levy is a primary concern for enterprise. The PSO levy is added to
each electricity customer’s bill to cover the costs of the price supports to peat and renewable
energy – these supports are designed to underpin the Government’s strategy of promoting
renewable energy while at the same time ensuring security of energy supply. While the PSO levy
was zero in 2009/2010, it is estimated that the 2010/2011 levy will add about five percent to all
bills108. The total PSO cost for 2010/2011 is €157 million. The direct subsidy to peat accounts for
half of this and supports for renewable energy generation cost €43 million.
107 Every five years the regulator reviews the non-fuel costs allowable for electricity networks, in line with Government legislation. In summer 2010, the CER carried out a comprehensive review of the network charges to apply for the period 2011-2016. As a result of the recent review, the networks cost component of the electricity bill will be 45 percent cheaper for large energy users from the 1st October 2010. The Carbon Revenue Levy Act was enacted in June 2010 to recover the windfall gains accruing to electricity generators until the end of 2012. 108 CER, Information Note on the bill impacts of LEU customer credits (CER/10/155), September 2010
NCC Costs of Doing Business in Ireland 2011 67 June 2011
Subsidies for peat generated electricity should be phased out due to the cost implications for
electricity customers and the impact on the environment. Price supports for renewable energy play
an important role in incentivising investment in renewable generation to meet the EU 2020 target
but, as highlighted by the NCC in its 2009 Statement on Energy109, given that the market and
technologies are maturing, we need to review future subsidies to ensure that they do not adversely
affect our long term cost competitiveness110.
Standard guaranteed price supports (such as those operating in Ireland), which are isolated and
protected from the risks and competition in the rest of the energy sector, are not economically
sustainable as a support scheme in the medium to long-term when renewable energy reaches very
large-scale deployment. The International Energy Agency has argued that a premium on the
wholesale price is a more efficient mechanism for supporting renewable technologies than
guaranteed price supports as it forces energy producers to track market development and manage
costs while guaranteeing a high level of investor certainty111.
The NCC recommend that the existing Renewable Energy Feed-In Tariff (REFIT) scheme should be
revised so that the price supports are transitional as they are for other technologies, with
decreasing support levels over time to address cost competitiveness concerns. In addition, the price
support should be changed from a fixed guaranteed price to a premium on the wholesale price.
Providing a premium over the wholesale price can support the development of a more sustainable
renewable energy market over the long term. However, the premium should be subject to a cap to
protect customers in the event of high fossil fuel prices.
Finally, significant investment in Ireland’s energy transmission and distribution infrastructure is
planned over the period to 2025 which will be financed through future increases in electricity
prices. This investment is essential to enable renewable technologies to connect to the grid and to
ensure that key regional centres can support energy intensive investment projects. Given reduced
levels of economic activity, the NCC believes that potential exists to extend delivery over a longer
period of time and delay projects which are no longer justified by projected demand growth.
5.5.2 Waste Policy Following many years of high relative prices, Ireland’s cost competitiveness in terms of waste
treatment costs has improved dramatically. However, work published by Forfás has also shown that
Irish enterprises have more limited waste management infrastructure options than international
competitors, although this is improving with the opening of a number of mechanical-biological
treatment (MBT) and waste to energy facilities.112.
The Programme for Government commits the Government to developing a national waste policy
that adheres to the EU waste hierarchy and favours a coherent approach to waste management that
109 http://www.competitiveness.ie/media/ncc091006_statement_energy.pdf 110 Note that while the wind energy sector in Ireland is relatively mature, other renewable energy sources such as biomass remain underdeveloped. 111 International Energy Agency, Deploying Renewables: Principles for Effective Policies, 2008. 112 Forfás, Waste Management in Ireland, Benchmarking Analysis and Policy Priorities: Update 2010
NCC Costs of Doing Business in Ireland 2011 68 June 2011
minimises waste going to landfill and that maximises the resources that can be recovered from it.
The NCC recommends that:
Waste charges to business should reflect the need to deliver cost competitive solutions and
optimal environmental performance, while extracting economic value from waste as a resource.
Applying much higher - or new - waste levies will increase the costs of doing business further,
particularly for those in manufacturing (in key sectors such as food and pharmaceuticals).
Increases in the landfill levy should reflect the pricing of externalities (i.e. putting a price on
environmental and other damage caused by landfill)113.
Due to the need to develop a competitive waste-to-energy market in Ireland as a waste
management option for Irish enterprise and to avoid potential damage to Ireland’s reputation as
a destination for foreign direct investment, the NCC recommends that a waste-to-energy levy
should not be considered until a waste-to-energy market is established here.
A volumetric levy on incineration levels should not be introduced as it stands to inhibit
economies of scale which are essential to bring Irish waste costs more into line with our
competitors. Such a cap would also run counter to the internationally accepted waste
management hierarchy.
113 The ESRI recommends a €44.50-55.10 levy for landfills with no flaring or gas capture and reduced rates for landfills with appropriate methane management. Enterprise can avoid or minimise such increases through greater use of segregated collection, recycling and waste prevention measures, as such charges only apply to residual waste going for disposal.
NCC Costs of Doing Business in Ireland 2011 69 June 2011
6. Business and Professional Services Costs
6.1 Summary
This chapter looks at the cost of key professional services to business such as computer
programming and consultancy, accountancy and legal services. As discussed in Chapter 2, business
and professional services, on average, account for a relatively low proportion of the enterprise cost
base – certainly compared with labour costs, and property costs. This reflects experiences
elsewhere – for instance, the Italian Antitrust Authority has estimated that in Italy an average of 6
percent of exporting firms’ total costs are accounted for by professional services114.
Nevertheless as an input to almost every enterprise in the country, the competitiveness of
professional and business services has a direct impact on the competitiveness of the entire Irish
economy. This has been recognised in the EU/IMF Programme of Financial Support for Ireland, which
accords significant attention to the promotion of competition in the professional services sector115.
In a recent update to the stability programme, the Department of Finance, using a European
Commission model, have estimated the potential impact of the proposed structural reforms (i.e. the
removal of restrictions to trade and competition in sheltered sectors, such as the legal, medical and
pharmaceutical professions) on the overall level of GDP116. They have found that a one percent
reduction of the price mark-up in the final goods sector (a broader categorisation than just the
sheltered sectors) increases GDP by 0.37 percent in the medium term, 0.66 percent in the long run
and 0.79 percent in the very long run.
Until recently, there were no official statistics on professional services costs. However, over the
past number of years, the CSO has, in tandem with other national statistical organisations,
developed an experimental Services Producer Price Index (SPPI) to measure changes in business
services costs117. The data illustrates that the costs of services in Ireland are now 0.7 percent above
2006 levels (Figure 6.1). This contrasts with the experience in other EU states examined, where the
costs of these services have increased relative to 2006 prices - the UK (+10.1%), Netherlands
(+6.6%), Finland (+13.2%) and Sweden (+7.8%). This represents a substantial competitive gain for the
Irish economy. There is limited data available, however, relating to price levels.
While the SSPI is limited in coverage, it indicates that over the course of the economic downturn,
four of the five business and professional sectors covered by the SPPI and examined herein have
shown substantial corrections in prices. However, the SSPI indicates that the cost of legal services
(which increased by 12 percent since 2006) has proven to be an exception (Figure 6.3).
114 European Commission, Communication from the Commission: Report on Competition in Professional Services, COM(2004) 83 final, 2004 115 EU Commission/IMF, EU/IMF Programme for Financial Support for Ireland- Programme Documents, 2010 116 Department of Finance, Ireland - Stability Programme Update, April 2011 117 The Services Producer Price Index (SPPI) is an experimental survey by the CSO which measures changes in the average prices charged by domestic service producers to other businesses for a selected range of services. In most cases these services are provided to business customers only and so individual price indices should not be considered indicative of more general price trends in the economy. The index covers transaction costs from business to business and excludes consumers who are covered in the Consumer Price Index (CPI). The CSO note that ‘the SPPI is experimental, under development and may be subject to methodological improvement’.
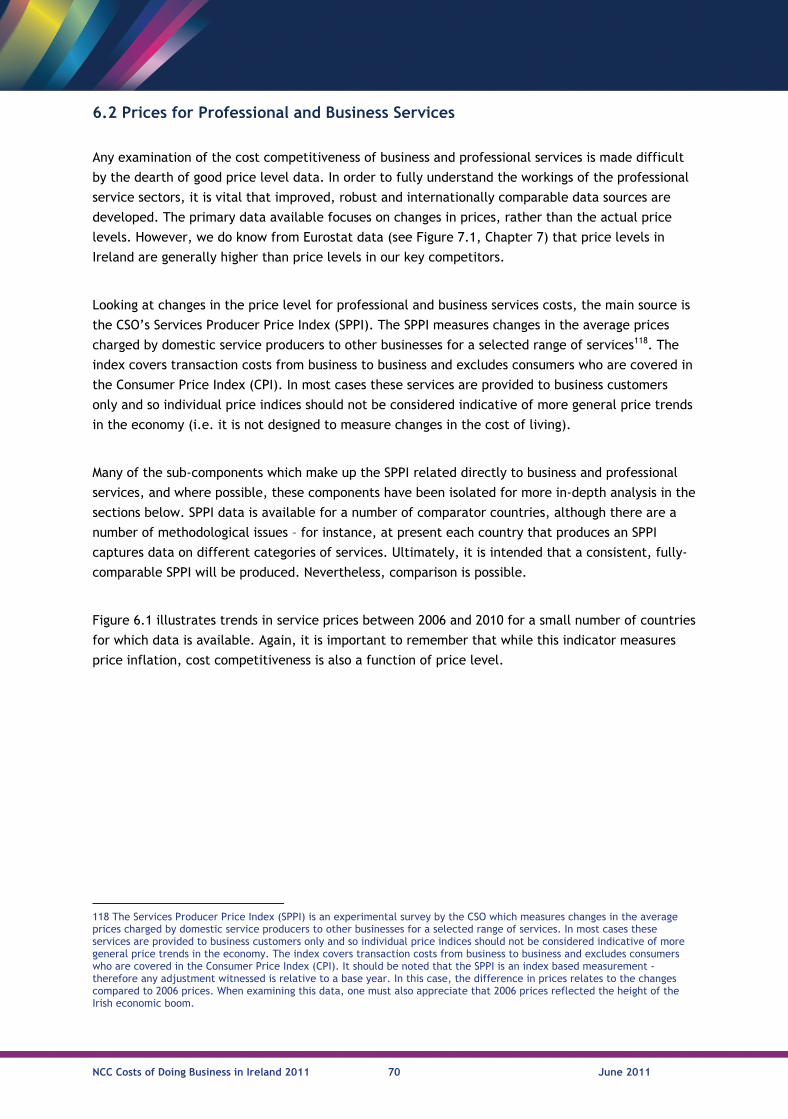
NCC Costs of Doing Business in Ireland 2011 70 June 2011
6.2 Prices for Professional and Business Services
Any examination of the cost competitiveness of business and professional services is made difficult
by the dearth of good price level data. In order to fully understand the workings of the professional
service sectors, it is vital that improved, robust and internationally comparable data sources are
developed. The primary data available focuses on changes in prices, rather than the actual price
levels. However, we do know from Eurostat data (see Figure 7.1, Chapter 7) that price levels in
Ireland are generally higher than price levels in our key competitors.
Looking at changes in the price level for professional and business services costs, the main source is
the CSO’s Services Producer Price Index (SPPI). The SPPI measures changes in the average prices
charged by domestic service producers to other businesses for a selected range of services118. The
index covers transaction costs from business to business and excludes consumers who are covered in
the Consumer Price Index (CPI). In most cases these services are provided to business customers
only and so individual price indices should not be considered indicative of more general price trends
in the economy (i.e. it is not designed to measure changes in the cost of living).
Many of the sub-components which make up the SPPI related directly to business and professional
services, and where possible, these components have been isolated for more in-depth analysis in the
sections below. SPPI data is available for a number of comparator countries, although there are a
number of methodological issues – for instance, at present each country that produces an SPPI
captures data on different categories of services. Ultimately, it is intended that a consistent, fully-
comparable SPPI will be produced. Nevertheless, comparison is possible.
Figure 6.1 illustrates trends in service prices between 2006 and 2010 for a small number of countries
for which data is available. Again, it is important to remember that while this indicator measures
price inflation, cost competitiveness is also a function of price level.
118 The Services Producer Price Index (SPPI) is an experimental survey by the CSO which measures changes in the average prices charged by domestic service producers to other businesses for a selected range of services. In most cases these services are provided to business customers only and so individual price indices should not be considered indicative of more general price trends in the economy. The index covers transaction costs from business to business and excludes consumers who are covered in the Consumer Price Index (CPI). It should be noted that the SPPI is an index based measurement - therefore any adjustment witnessed is relative to a base year. In this case, the difference in prices relates to the changes compared to 2006 prices. When examining this data, one must also appreciate that 2006 prices reflected the height of the Irish economic boom.
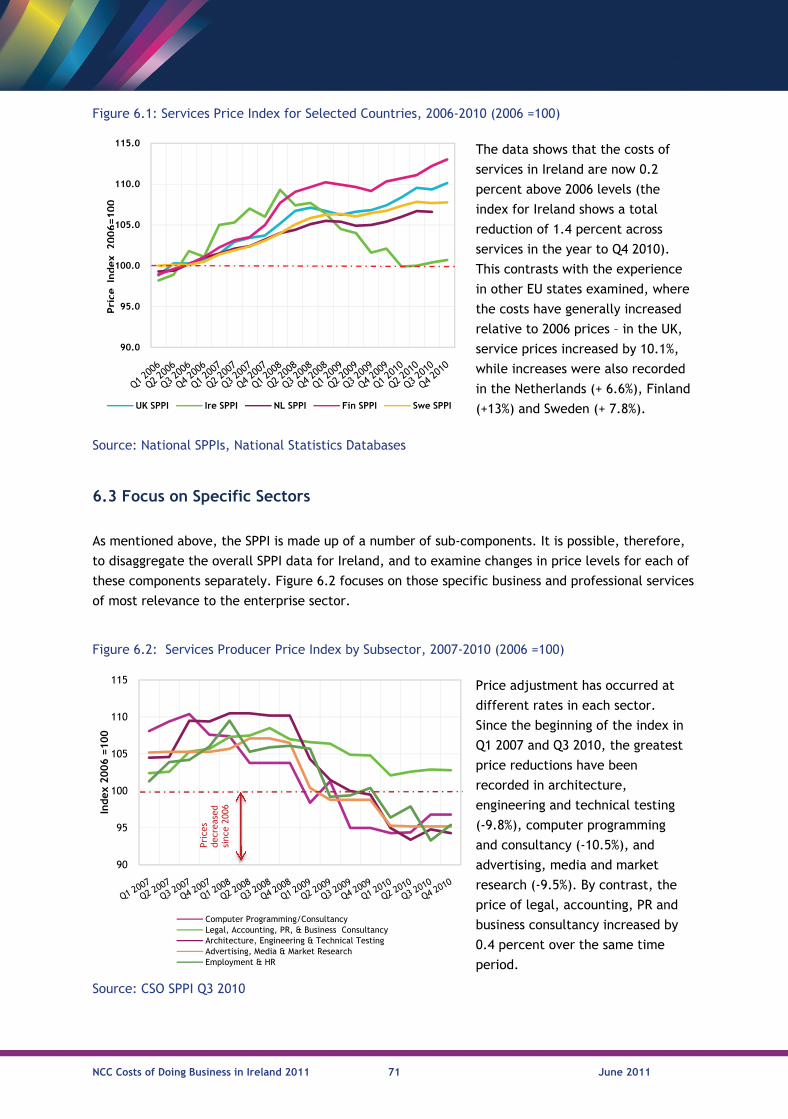
NCC Costs of Doing Business in Ireland 2011 71 June 2011
6.3 Focus on Specific Sectors
As mentioned above, the SPPI is made up of a number of sub-components. It is possible, therefore,
to disaggregate the overall SPPI data for Ireland, and to examine changes in price levels for each of
these components separately. Figure 6.2 focuses on those specific business and professional services
of most relevance to the enterprise sector.
Figure 6.1: Services Price Index for Selected Countries, 2006-2010 (2006 =100)
The data shows that the costs of
services in Ireland are now 0.2
percent above 2006 levels (the
index for Ireland shows a total
reduction of 1.4 percent across
services in the year to Q4 2010).
This contrasts with the experience
in other EU states examined, where
the costs have generally increased
relative to 2006 prices – in the UK,
service prices increased by 10.1%,
while increases were also recorded
in the Netherlands (+ 6.6%), Finland
(+13%) and Sweden (+ 7.8%).
Source: National SPPIs, National Statistics Databases
Figure 6.2: Services Producer Price Index by Subsector, 2007-2010 (2006 =100)
Price adjustment has occurred at
different rates in each sector.
Since the beginning of the index in
Q1 2007 and Q3 2010, the greatest
price reductions have been
recorded in architecture,
engineering and technical testing
(-9.8%), computer programming
and consultancy (-10.5%), and
advertising, media and market
research (-9.5%). By contrast, the
price of legal, accounting, PR and
business consultancy increased by
0.4 percent over the same time
period.
Source: CSO SPPI Q3 2010
90.0
95.0
100.0
105.0
110.0
115.0
UK SPPI Ire SPPI NL SPPI Fin SPPI Swe SPPI
Pri
ceIn
dex
2006=100
90
95
100
105
110
115
Index
2006 =
100
Computer Programming/ConsultancyLegal, Accounting, PR, & Business ConsultancyArchitecture, Engineering & Technical TestingAdvertising, Media & Market ResearchEmployment & HR
Pric
esde
crea
sed
sinc
e 20
06
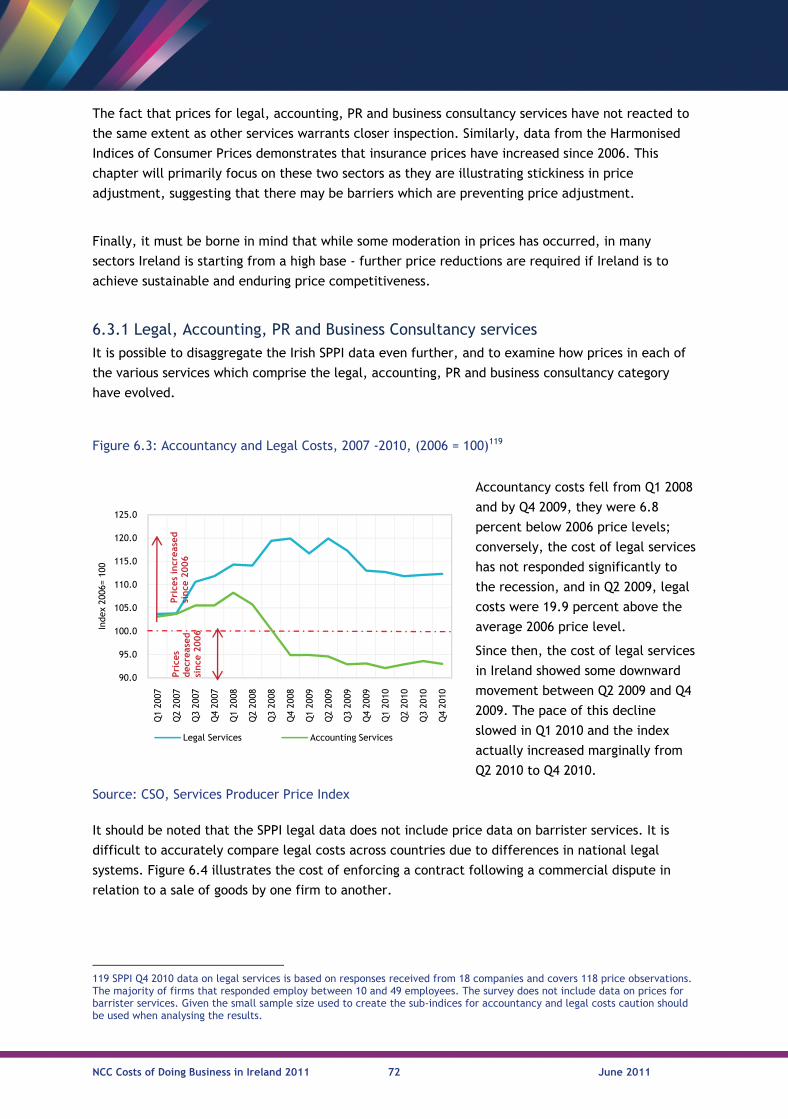
NCC Costs of Doing Business in Ireland 2011 72 June 2011
The fact that prices for legal, accounting, PR and business consultancy services have not reacted to
the same extent as other services warrants closer inspection. Similarly, data from the Harmonised
Indices of Consumer Prices demonstrates that insurance prices have increased since 2006. This
chapter will primarily focus on these two sectors as they are illustrating stickiness in price
adjustment, suggesting that there may be barriers which are preventing price adjustment.
Finally, it must be borne in mind that while some moderation in prices has occurred, in many
sectors Ireland is starting from a high base - further price reductions are required if Ireland is to
achieve sustainable and enduring price competitiveness.
6.3.1 Legal, Accounting, PR and Business Consultancy services It is possible to disaggregate the Irish SPPI data even further, and to examine how prices in each of
the various services which comprise the legal, accounting, PR and business consultancy category
have evolved.
It should be noted that the SPPI legal data does not include price data on barrister services. It is
difficult to accurately compare legal costs across countries due to differences in national legal
systems. Figure 6.4 illustrates the cost of enforcing a contract following a commercial dispute in
relation to a sale of goods by one firm to another.
119 SPPI Q4 2010 data on legal services is based on responses received from 18 companies and covers 118 price observations. The majority of firms that responded employ between 10 and 49 employees. The survey does not include data on prices for barrister services. Given the small sample size used to create the sub-indices for accountancy and legal costs caution should be used when analysing the results.
Figure 6.3: Accountancy and Legal Costs, 2007 -2010, (2006 = 100)119
Accountancy costs fell from Q1 2008
and by Q4 2009, they were 6.8
percent below 2006 price levels;
conversely, the cost of legal services
has not responded significantly to
the recession, and in Q2 2009, legal
costs were 19.9 percent above the
average 2006 price level.
Since then, the cost of legal services
in Ireland showed some downward
movement between Q2 2009 and Q4
2009. The pace of this decline
slowed in Q1 2010 and the index
actually increased marginally from
Q2 2010 to Q4 2010.
Source: CSO, Services Producer Price Index
90.0
95.0
100.0
105.0
110.0
115.0
120.0
125.0
Q1
2007
Q2
2007
Q3
2007
Q4
2007
Q1
2008
Q2
2008
Q3
2008
Q4
2008
Q1
2009
Q2
2009
Q3
2009
Q4
2009
Q1
2010
Q2
2010
Q3
2010
Q4
2010
Inde
x 20
06=
100
Legal Services Accounting Services
Pri
ces
incr
ease
d
since
2006
Pri
ces
dec
reas
ed
since
2006
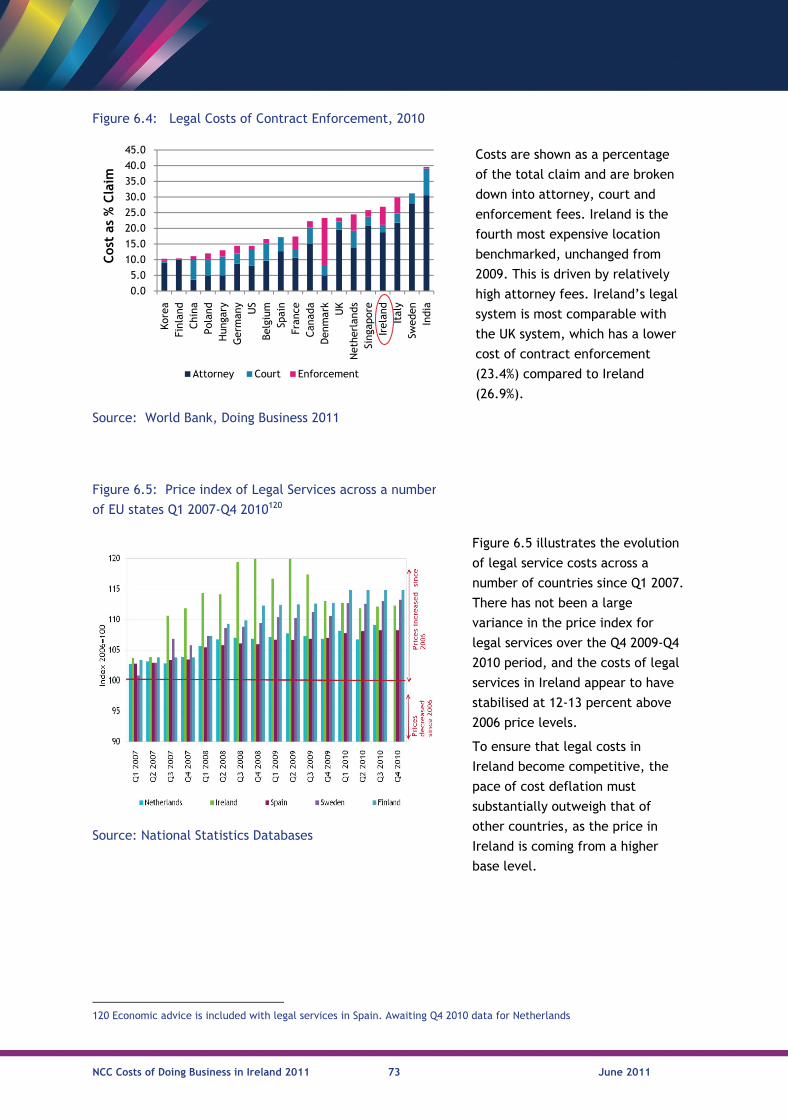
NCC Costs of Doing Business in Ireland 2011 73 June 2011
120 Economic advice is included with legal services in Spain. Awaiting Q4 2010 data for Netherlands
Figure 6.4: Legal Costs of Contract Enforcement, 2010
Costs are shown as a percentage
of the total claim and are broken
down into attorney, court and
enforcement fees. Ireland is the
fourth most expensive location
benchmarked, unchanged from
2009. This is driven by relatively
high attorney fees. Ireland’s legal
system is most comparable with
the UK system, which has a lower
cost of contract enforcement
(23.4%) compared to Ireland
(26.9%).
Source: World Bank, Doing Business 2011
Figure 6.5: Price index of Legal Services across a number
of EU states Q1 2007-Q4 2010120
Source: National Statistics Databases
0.0
5.0
10.0
15.0
20.0
25.0
30.0
35.0
40.0
45.0Ko
rea
Finl
and
Chi
naPo
land
Hun
gary
Ger
man
yU
SBe
lgiu
mSp
ain
Fran
ceCan
ada
Den
mar
kU
KN
ethe
rlan
dsSi
ngap
ore
Irel
and
Ital
ySw
eden
Indi
a
Cos
t as
% C
laim
Attorney Court Enforcement
Figure 6.5 illustrates the evolution
of legal service costs across a
number of countries since Q1 2007.
There has not been a large
variance in the price index for
legal services over the Q4 2009-Q4
2010 period, and the costs of legal
services in Ireland appear to have
stabilised at 12-13 percent above
2006 price levels.
To ensure that legal costs in
Ireland become competitive, the
pace of cost deflation must
substantially outweigh that of
other countries, as the price in
Ireland is coming from a higher
base level.
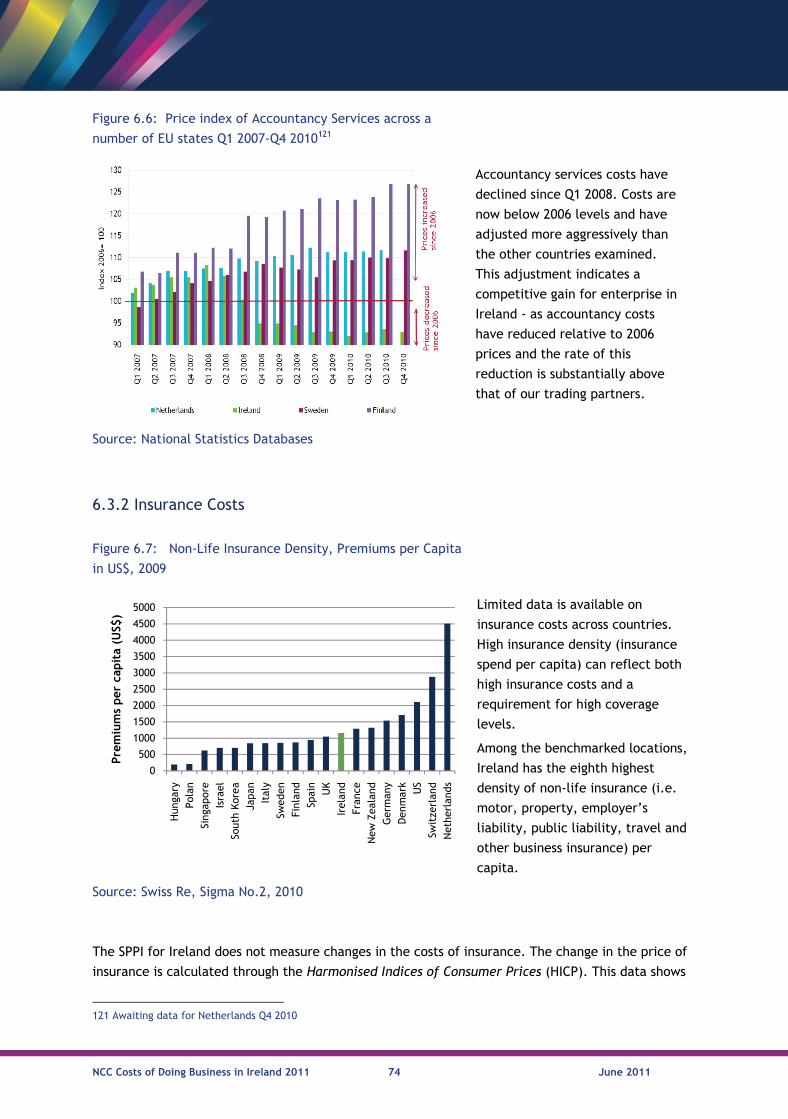
NCC Costs of Doing Business in Ireland 2011 74 June 2011
6.3.2 Insurance Costs
The SPPI for Ireland does not measure changes in the costs of insurance. The change in the price of
insurance is calculated through the Harmonised Indices of Consumer Prices (HICP). This data shows
121 Awaiting data for Netherlands Q4 2010
Figure 6.6: Price index of Accountancy Services across a
number of EU states Q1 2007-Q4 2010121
Accountancy services costs have
declined since Q1 2008. Costs are
now below 2006 levels and have
adjusted more aggressively than
the other countries examined.
This adjustment indicates a
competitive gain for enterprise in
Ireland - as accountancy costs
have reduced relative to 2006
prices and the rate of this
reduction is substantially above
that of our trading partners.
Source: National Statistics Databases
Figure 6.7: Non-Life Insurance Density, Premiums per Capita
in US$, 2009
Limited data is available on
insurance costs across countries.
High insurance density (insurance
spend per capita) can reflect both
high insurance costs and a
requirement for high coverage
levels.
Among the benchmarked locations,
Ireland has the eighth highest
density of non-life insurance (i.e.
motor, property, employer’s
liability, public liability, travel and
other business insurance) per
capita.
Source: Swiss Re, Sigma No.2, 2010
0
500
1000
1500
2000
2500
3000
3500
4000
4500
5000
Hun
gary
Pola
nSi
ngap
ore
Isra
elSo
uth
Kore
aJa
pan
Ital
ySw
eden
Finl
and
Spai
nU
KIr
elan
dFr
ance
New
Zea
land
Ger
man
yD
enm
ark
US
Swit
zerl
and
Net
herl
ands
Pre
miu
ms
per
cap
ita
(US$
)
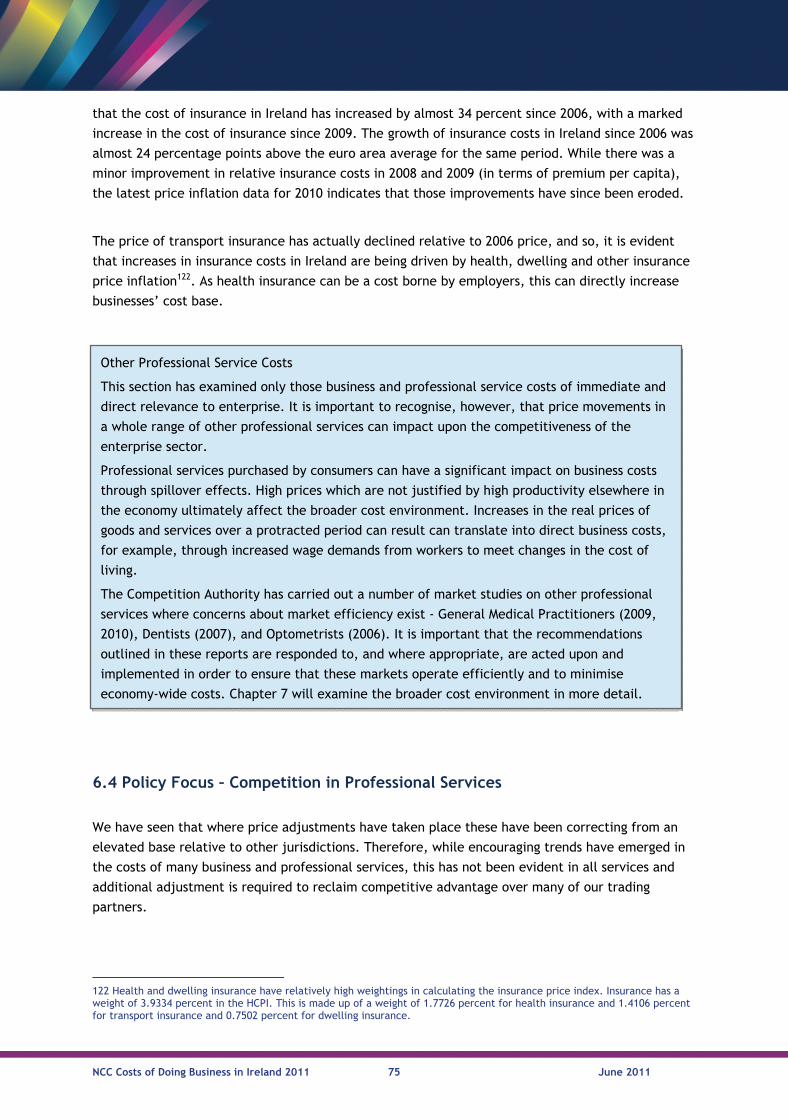
NCC Costs of Doing Business in Ireland 2011 75 June 2011
that the cost of insurance in Ireland has increased by almost 34 percent since 2006, with a marked
increase in the cost of insurance since 2009. The growth of insurance costs in Ireland since 2006 was
almost 24 percentage points above the euro area average for the same period. While there was a
minor improvement in relative insurance costs in 2008 and 2009 (in terms of premium per capita),
the latest price inflation data for 2010 indicates that those improvements have since been eroded.
The price of transport insurance has actually declined relative to 2006 price, and so, it is evident
that increases in insurance costs in Ireland are being driven by health, dwelling and other insurance
price inflation122. As health insurance can be a cost borne by employers, this can directly increase
businesses’ cost base.
6.4 Policy Focus – Competition in Professional Services
We have seen that where price adjustments have taken place these have been correcting from an
elevated base relative to other jurisdictions. Therefore, while encouraging trends have emerged in
the costs of many business and professional services, this has not been evident in all services and
additional adjustment is required to reclaim competitive advantage over many of our trading
partners.
122 Health and dwelling insurance have relatively high weightings in calculating the insurance price index. Insurance has a weight of 3.9334 percent in the HCPI. This is made up of a weight of 1.7726 percent for health insurance and 1.4106 percent for transport insurance and 0.7502 percent for dwelling insurance.
Other Professional Service Costs
This section has examined only those business and professional service costs of immediate and
direct relevance to enterprise. It is important to recognise, however, that price movements in
a whole range of other professional services can impact upon the competitiveness of the
enterprise sector.
Professional services purchased by consumers can have a significant impact on business costs
through spillover effects. High prices which are not justified by high productivity elsewhere in
the economy ultimately affect the broader cost environment. Increases in the real prices of
goods and services over a protracted period can result can translate into direct business costs,
for example, through increased wage demands from workers to meet changes in the cost of
living.
The Competition Authority has carried out a number of market studies on other professional
services where concerns about market efficiency exist - General Medical Practitioners (2009,
2010), Dentists (2007), and Optometrists (2006). It is important that the recommendations
outlined in these reports are responded to, and where appropriate, are acted upon and
implemented in order to ensure that these markets operate efficiently and to minimise
economy-wide costs. Chapter 7 will examine the broader cost environment in more detail.
NCC Costs of Doing Business in Ireland 2011 76 June 2011
There are a number of factors which determine the price of goods and services - these include
supply (e.g. barriers to entry), demand (price of substitutes, income of consumers, consumer tastes,
quality, expectations about the future and lack of information), input costs, competition,
productivity and government intervention. High prices, however, do not necessarily indicate a lack
of competition and can often be justified in sectors with high levels of productivity and/or skills. By
targeting and isolating the drivers that are keeping the costs of business and professional services
artificially high, we can make details specific actions that would initiate a price adjustment in these
sheltered sectors.
Two service sectors in particular warrant further discussion – both legal and insurance services have
experienced an increase in costs since 2006. The primary focus for the policy discussion below is on
professional legal services since price developments here represent a clear outlier from the other
business and professional sectors examined. In terms of insurance, a brief discussion is accorded to
the issue of transport insurance costs.
Before we delve in detail into sector specific recommendations, however, a number of broad,
horizontal themes of relevance to all business and professional services are explored.
6.4.1 Regulation The NCC recommends that:
No professional body should be allowed to restrict the number of entrants into that profession;
Independent regulation is generally preferable to self-regulation for key professional and
business services. This would not preclude members of professional bodies from being
represented on any regulatory body as a minority;
Where possible, a variety of pro-competitive mechanisms should be used instead of traditional
restrictive rules123. Noting the need to protect consumers, for example, European Commission
recommends improving the availability and quality of information about professional services in
order to empower consumers to make more informed purchasing decisions. Such a mechanism is
less restrictive than imposing top-down legislative standards. For example historical or survey-
based price information made available to consumers would be a less restrictive mechanism
rather than regulatory price controls.
6.4.2 Competition Policy The Competition Authority has produced an extensive series of reports on the professions over
recent years. The NCC believes that a pro-competition policy environment is a pre-requisite for a
competitive economy. If Ireland is to build upon recent competitiveness gains which have arisen as a
result of cyclical economic factors, more permanent structural reform of markets is required.
Considered, standardised, efficient and timely execution is crucial to achieving successful policy
change. Competition policy relates to a number of government departments, bodies and agencies.
123 European Commission, Communication from the Commission: Report on Competition in Professional Services, COM(2004) 83 final, 2004
NCC Costs of Doing Business in Ireland 2011 77 June 2011
The Competition Authority is an independent statutory body responsible for promoting and enforcing
Irish and European competition law in Ireland. Overall competition policy is the responsibility of the
Minister for Enterprise, Jobs and Innovation. Specific policy and legislative responses to competition
issues and recommendations are a matter for the relevant Ministers within whose policy area the
issues and recommendations lie.
Government departments often need to balance a number of competing policy priorities within their
portfolio. In many instances, competition policy may not be a primary concern. At other times,
there may be conflicts of interest as Departments attempt to pursue a number of objectives in
parallel. There is a need, however, to ensure that competition policy remains a key national policy
priority.
Of the approximately 165 recommendations made to date by the Authority, 68 have been
implemented. With respect to the other outstanding recommendations, analysis by the Authority
has found that 29 recommendations are ‘under consideration’, 18 are no longer relevant as they
have been overtaken by other events, just one has been rejected, while the status of the remaining
recommendations is unclear. While there may be well-founded explanations for not implementing
some recommendations (e.g. they may contradict other valid public policy goals), implementation
of outstanding agreed recommendations should be expedited.
In this context, Government Departments should be formally required to consider and respond to
recommendations of the Competition Authority in a timely manner, with specific timelines set down
for such consideration and implementation of such recommendations, as appropriate. The
Department of Enterprise, Jobs and Innovation should co-ordinate a report to Government on each
Department’s response to recommendations of the Competition Authority. That report should
include, from each Department, specific timelines for the implementation of the recommendations
by them, as appropriate, timelines for consideration of outstanding recommendations and the
rationale for decisions by those Departments not to implement specific recommendations.
6.4.3 Promoting Competition in Specific Professions
Legal, Accounting, PR and Business Consultancy Services In general, accounting, PR and business consultancy services appear to be operating without any
major competition barriers. The legal profession, however, is a distinct outlier in this regard.
Relative to the other professions examined, prices for legal services have proven extremely sticky
and have not adjusted downwards to the degree that might have been expected given current
economic circumstances.
The legal profession has already been subject to several studies. Despite several positive recent
developments (such as the Bar Council reforming the restrictions it imposes on newly qualified
barristers), the profession remains characterised by a range of restrictions on competition. Arising
from the existing studies, the NCC has identified a series of recommendations which, if
implemented, would contribute to the delivery of more cost-efficient legal services. These
recommendations relate to:
NCC Costs of Doing Business in Ireland 2011 78 June 2011
(i) The regulation of the legal profession;
(ii) The manner in which legal services are costed;
(iii) The need for competitive tendering for State contracts;
(iv) The need for structural reform of the legal profession;
(v) Empowerment of consumers; and
(vi) Procedural reform.
(i) Regulation of the Legal Profession
As noted in the section relating to principles governing regulation, the NCC believe independent
regulation is generally preferable to self-regulation. With specific reference to the legal profession,
barristers are self-regulated via the Bar Council, and solicitors are largely self-regulated via the Law
Society, with limited independent oversight in some areas (e.g. solicitor advertising is regulated by
statute). The Bar Council and the Law Society are also the representative bodies for their members.
There is potential for conflict of interest when an entity is tasked as both a representative and
regulatory body. Most other professions exhibit separation of powers in terms representation and
regulation, e.g. the Medical Council regulates doctors and the IMO represents doctors. It is also at
odds with developments in the regulation of the legal profession internationally, in particular in
other common-law jurisdictions such as England and Wales and Australia.
The NCC recommends the establishment of an independent regulator for the legal profession – a
Legal Services Commission124. This recommendation has also featured in the EU/IMF Programme of
Financial Support for Ireland and in the Programme for Government. The NCC believes that new
body should incorporate the regulation of training for solicitors and barristers, and would be tasked
with approving those institutions who wish to provide such training.
In addition to the creation of an independent regulator, consideration should also be given to
extending the powers of the Legal Services Ombudsman (which has not yet been established). Under
current legislation, the legal services ombudsman – unlike other ombudsmen – has no power of
redress.
(ii) Legal Service Costs
The report of the Legal Costs Working Group has already proposed significant changes to the manner
in which legal services are charged. At present, the Taxing Master is the officer responsible for
assessment and measurement of legal costs. The NCC recommends that a Legal Costs Assessment
Office be established to replace the Taxing Master’s Office, as recommended by the Legal Costs
Working Group. In striking a balance between assessing the costs involved and the level of service
provided, the Legal Costs Assessment Office must also ensure that the interests of the consumer are
upheld and promoted. In this regard:
The Legal Costs Assessment Office should have a remit to cover costs arising from all courts, not
just the High and Supreme Courts as is the case currently for the Taxing Master;
124 This recommendation echoes previous recommendations by the Competition Authority.
NCC Costs of Doing Business in Ireland 2011 79 June 2011
Legal costs should be assessed on the basis of work done, rather than on the size of awards; and
The general practice of allowing junior counsel’s fees at two-thirds that of senior counsel has
been recognised as anti-competitive (e.g. by the Competition Authority). In many instances,
however, the practice continues. Parties with responsibility for overseeing legal costs should
ensure that the practice is no longer tolerated.
(iii) Competitive Tendering
As a major consumer the Government has a certain amount of market power which it should utilise
to ensure that the cost of legal services to the state is minimised – the Dáil Committee of Public
Accounts has estimated that the State spends an estimated €500 million per annum on procurement
of legal services125. The impact of the State on the cost of legal services can be assumed to impact
upon legal costs throughout the entire economy. As currently defined, however, legal services are
considered non-priority services and so are not subject to the full scope of the EU procurement
directives (i.e. legal services are categorised as an “Annex IIB service”).
The Committee of Public Accounts have found that while the costs of other professional services to
the State have declined significantly in recent years, there have only been marginal reductions in
the costs of legal services, despite difficult economic conditions. The Committee concluded that the
listing of legal services in Annex IIB is not a sufficient reason to excuse Government departments
and public bodies from tendering for solicitors’ and barristers’ legal services - other EU member
states already tender for legal services with the goal of improving value for money. The absence of
a competitive tendering process for legal services means that the State cannot be sure that it is
paying a fair price for such services. The Committee has stated that “While it has been mentioned
to the Committee on many occasions that the State generally pays less than the market rate for
the legal services it purchases, the Committee has a great difficulty in understanding how one can
determine what the market rate for legal services is. The essential problem lies in the fact that
the market rate cannot be deemed the benchmark given that it is determined outside of any form
of competition”126.
Further, the Committee has found that the State has been reluctant to challenge the legal
profession in relation to cost “From the exorbitant figures charged and paid to members of the
legal professions by the State Claims Agency, HSE, local authorities and public bodies, at the
Tribunals and Commissions of Inquiry, during the bank stabilisation process and the provisions
being made in NAMA for legal costs, it seems the legal profession is treated very much with a kid-
glove approach on the part of the State”127.
The NCC recommends that where practicable legal services to be provided to the State by solicitors
and barristers in private practice should be procured in accordance with the guidelines set out by
National Public Procurement Policy Unit (NPPPU), requiring prospective legal service providers to
125 Committee of Public Accounts, Third Interim Report on the Procurement of Legal Services by Public Bodies, Dáil Éireann January 2011 126 Committee of Public Accounts, Third Interim Report on the Procurement of Legal Services by Public Bodies, Dáil Éireann January 2011, Page 29 127 Committee of Public Accounts, Third Interim Report on the Procurement of Legal Services by Public Bodies, Dáil Éireann January 2011, Page 36
NCC Costs of Doing Business in Ireland 2011 80 June 2011
compete with one another on the basis of cost and quality. This ensures that contracts are awarded
in accordance with EU Treaty principles of transparency (this implies appropriate advertising), non –
discrimination on the grounds of nationality, freedom to provide services, freedom of
establishment. There may be instances where certain types of contracts cannot be procured in this
fashion (e.g. where issues of confidentiality etc. exist).
(iv) Structural Reform of the Legal Profession
At present, the Irish legal system comprises a two-tier structure made up of junior and senior
counsel. Such a structure allows for higher fees to be charged but does not offer a definitive guide
as to the quality of the barrister in question. This is an obvious additional cost which must be borne
by enterprise and individual consumers alike. The NCC recommends that the present manner in
which Senior Counsel are appointed be reformed so that the title becomes a useful quality signal
facilitating competition in legal services. Further, consideration should be given to the creation of a
single tier counsel system - the removal of the distinction would promote meritocracy and would,
for example, lessen the requirement for the State and other clients to engage senior counsels for
High Court and Supreme Court cases where the complexity does not necessarily require a senior. A
number of reports have already suggested that a range of reforms be considered in relation to
Junior and Senior Counsel, but in most cases, these have not yet been acted upon128.
At present, solicitors are prohibited from being the lead advocate where a legal team of both
barristers and solicitors is representing a client. The NCC recommends that this restriction be
removed and that solicitors be permitted to act as lead counsel when advocating in court with a
barrister in order to promote enhanced competition in legal services.
The legal profession plays an important role in the property market, specifically through their
conveyancing role. Previous studies have found that the cost of conveyancing in Ireland is
significantly higher than other countries with similar legal systems. Notwithstanding the current
collapse in demand for conveyancing, the NCC, therefore, recommends that suitably qualified
professionals, in addition to solicitors, be allowed to provide conveyancing services. The NCC
supports the Competition Authority’s recommendation that a specialist conveyancer profession be
developed in Ireland, with appropriate regulations and standards. This profession could then
compete with solicitors for conveyancing business. This occurred in the UK in 1987 with the creation
of licensed conveyancers, allowing conveyancing to be done by non-solicitors. Subsequent
evaluations have found that the creation of this profession had a positive effect on price
competition129. In Australia, the removal of lawyers’ reserved rights to provide conveyancing
services and the barristers’ monopoly in courtroom work contributed to a 12 percent drop in overall
legal costs130.
128 See Competition in Professional Services- Solicitors and Barristers by the Competition Authority (2006), The Report of the Special Group on Public Service Numbers and Expenditures Programmes Volume 1 (2009), and the Report of Study into Restrictive Practices in the Legal Profession by the Trade Commission (1990) 129 Zerp et al , COMP/2006/D3/003 (2007), “Summary of the comparative legal and economic study into the EU conveyancing services market” available at URL: http://ec.europa.eu/competition/sectors/professional_services/studies/csm_standalone_en.pdf 130 EU Commission, (2004), “Report on Competition in Professional Services” available at URL: http://eur-lex.europa.eu/LexUriServ/LexUriServ.do?uri=COM:2004:0083:FIN:EN:PDF
NCC Costs of Doing Business in Ireland 2011 81 June 2011
(v) Empowering the Consumer
There a number of actions which could be used to empower the consumer and thus address
inefficiencies in the market and allow prices to adjust in response to wider economic conditions and
price movements elsewhere.
The current restrictions which prevent consumers from switching solicitors should be abolished.
For instance solicitors have the right to withhold a client’s file if payment is outstanding or
disputed. However, full payment may not be possible to achieve in a short space of time and in
the interim the client may be disadvantaged with possibly serious consequences;
Individual consumers and enterprises should be allowed to directly access legal advice from
barristers – access to such advice is currently restricted by the Bar Council; and
Both solicitors and barristers should be required to issue detailed and meaningful fee and/or fee
estimate letters to prospective clients.
(vi) Procedural Reform
Other actions could be undertaken to reduce legal service costs by eliminating practises which
generate costs unnecessarily or operate as an impediment to containing costs. In this regard the
Legal Cost Working Group recommended a number of procedural measures to the operation of the
legal system. For instance, the group recommended that the rules of the court should include a
specific order facilitating supervision by the court of the pace of litigation and this should also
contain measures to sanction delay.
Non-Life Insurance Significant reform of the insurance market occurred in Ireland in the mid 2000’s with, for example,
the establishment of the Personal Injuries Assessment Board (now known as InjuriesBoard.ie) in
2003131. Despite such interventions, concerns over insurance costs have re-emerged. Given the
widespread incidence of insurance on the enterprise base, any actions which can positively impact
on cost could have a potentially significant effect on competitiveness.
In 2005, the Competition Authority published a study focusing on motor insurance, employer’s
liability insurance and public liability insurance132. This study found that the persistence of high
profits among insurance companies, combined with slow rates of entry and low levels of cost
reduction, suggested that competition was not as vigorous as would be expected in a truly
competitive market. The Authority made 47 recommendations, focusing on three areas:
Barriers to Entry: Implementation of some of the Authorities recommendations has increased the availability of information on costs and claims statistics. Accurate, timely and easily accessible information on claims helps insurers, including potential new insurers, to assess the insurance market.
Ease of Switching: It was recommended that companies providing liability insurance must issue a renewal notice at least 15 working days prior to the expiration of the insurance policy. This gives businesses time to shop around for lower quotes from rival insurers.
131 InjuriesBoard.ie is a statutory body which provides independent assessment of personal injury compensation for victims of Workplace, Motor and Public Liability accidents. This assessment is provided without the need for the majority of current litigation costs, such as Solicitors, Barristers and Experts' fees, associated with such claims. 132 Competition Authority, Competition Issues in the (Non-Life) Insurance Market, 2005
NCC Costs of Doing Business in Ireland 2011 82 June 2011
Transparency: As a result of this report’s recommendations, greater transparency in relation to the role played by intermediaries in the insurance market.
While a substantial number of Competition Authority recommendations have been accepted by
Government, a small number of recommendations relating to the collection and publication of
insurance related data (targeted at the Financial Regulator) remain outstanding. Elsewhere, the
status of a small number of recommendations relating to motor insurance and the Motor Insurers’
Bureau of Ireland (MIBI)133 require clarification.
It is interesting to note that the ability of many professions examined herein to conduct business is
partially determined by developments in other professional services. For instance, the high cost of
professional indemnity insurance for solicitors has been cited as a major issue for many legal firms.
Solicitors cannot get a renewal of their practising certificates if they do not have professional
indemnity insurance, yet the rise in some premia over recent years has made it more difficult to
acquire such insurance.
133 The MIBI was set up in 1955 by an Agreement between the Government and the Companies underwriting motor insurance in Ireland for the purpose of compensating victims of road traffic accidents caused by uninsured and unidentified vehicles.
NCC Costs of Doing Business in Ireland 2011 83 June 2011
7. Indirect Business Costs
The previous four chapters examined direct enterprise costs. Enterprise, however, does not operate
in a vacuum, separate from the rest of the economy. The price of all goods and services contributes
to the overall price level in the economy and ultimately impacts upon a county’s international
competitiveness.
Consumer prices, measured by the Consumer Price Index (CPI), can be viewed as indirect costs for
business. Outside of work, employees purchase goods and services. Movements in these prices
impact upon wage demands, and so the impact of price changes in consumer markets spill over into
the cost base of the enterprise sector. For instance, the correlation between rapidly escalating
house prices and increases in average wage levels is widely recognised.
This chapter, therefore, focuses on the overall cost environment for consumers and changes in the
price levels for goods and service. The analysis draws primarily from the CSO’s Consumer Price
Index.
7.1 Summary
Figure 7.1 draws on Eurostat price data to illustrate that price levels in Ireland are higher than
might be expected, even factoring in Ireland’s relatively high GNP per capita. Using an alternative
data source, Figure 7.2 illustrates that Ireland (or at least Dublin) has regained some
competitiveness over recent years. A comparison of consumer costs between major international
cities indicates that Dublin’s cost competitiveness improved between 2009 and 2010 as the city
moved from sixth most expensive to ninth most expensive out of 18 cities.
Following a period of significant increase, the consumer price index peaked in 2008 when prices
were 28 percent above 2001 prices. Since then the index has fallen and prices in March 2011 were
4.5 percent below the peak level. However, the pace of decline in the consumer price index slowed
towards the end of 2010 and increased in February and March 2011. Furthermore price levels remain
significantly above their 2001 levels (Figure 7.3). Between February 2010 and February 2011, Ireland
experienced a 0.9 percent increase in the harmonised index of consumer prices (HICP), the smallest
increase in the European Union. During the same period the euro area HICP increased by 2.4 percent
(Figure 7.4).
Ireland is an expensive location for purchasing groceries. For a comparable basket of food and non-
alcoholic beverages, Ireland ranks as the second most expensive European country, 19.4 percent
above the euro area-16 average (Figure 7.6).
The cost of public and administered services affects the competitiveness environment for firms.
This section looks at some indicative measures of the cost competitiveness of public and
administered services in Ireland. The cost of health and education services continues to rise rapidly,
(Figure 7.7).
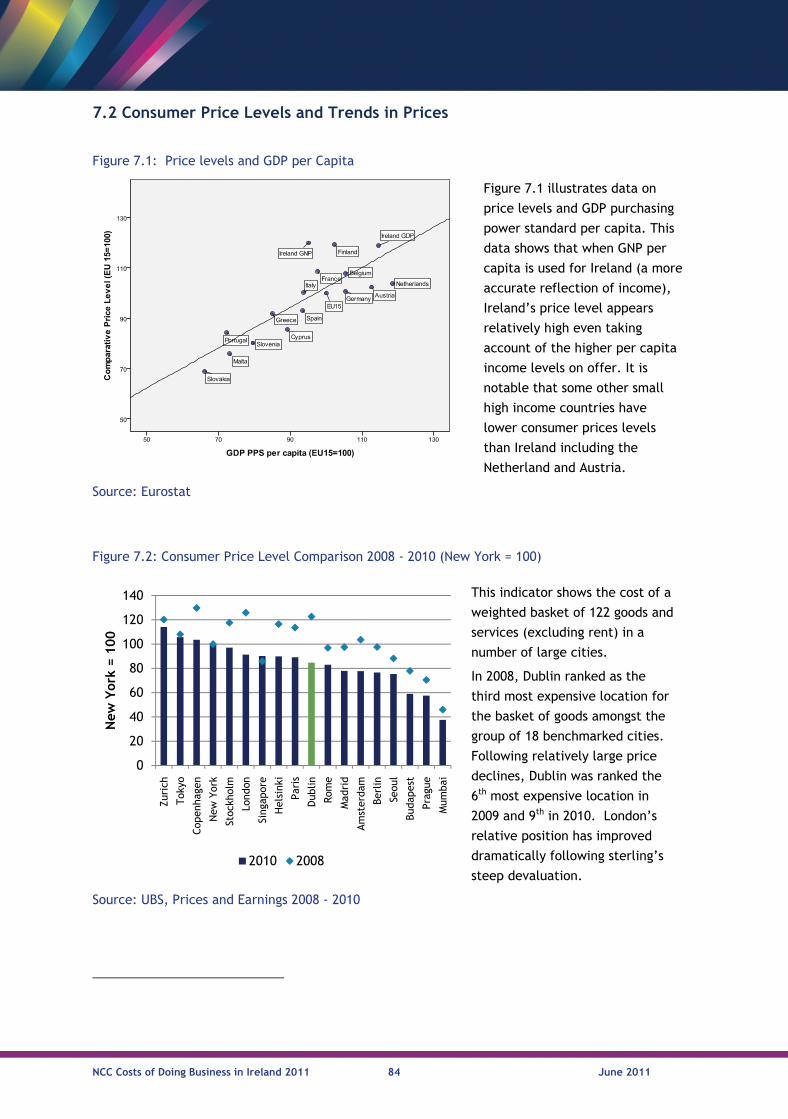
NCC Costs of Doing Business in Ireland 2011 84 June 2011
7.2 Consumer Price Levels and Trends in Prices
Figure 7.1: Price levels and GDP per Capita
Figure 7.1 illustrates data on
price levels and GDP purchasing
power standard per capita. This
data shows that when GNP per
capita is used for Ireland (a more
accurate reflection of income),
Ireland’s price level appears
relatively high even taking
account of the higher per capita
income levels on offer. It is
notable that some other small
high income countries have
lower consumer prices levels
than Ireland including the
Netherland and Austria.
Source: Eurostat
Figure 7.2: Consumer Price Level Comparison 2008 - 2010 (New York = 100)
This indicator shows the cost of a
weighted basket of 122 goods and
services (excluding rent) in a
number of large cities.
In 2008, Dublin ranked as the
third most expensive location for
the basket of goods amongst the
group of 18 benchmarked cities.
Following relatively large price
declines, Dublin was ranked the
6th most expensive location in
2009 and 9th in 2010. London’s
relative position has improved
dramatically following sterling’s
steep devaluation.
Source: UBS, Prices and Earnings 2008 - 2010
0
20
40
60
80
100
120
140
Zuri
ch
Tok
yo
Cop
enha
gen
New
Yor
k
Stoc
khol
m
Lond
on
Sing
apor
e
Hel
sink
i
Pari
s
Dub
lin
Rom
e
Mad
rid
Am
ster
dam
Berl
in
Seou
l
Buda
pest
Prag
ue
Mum
bai
New
Yor
k = 1
00
2010 2008
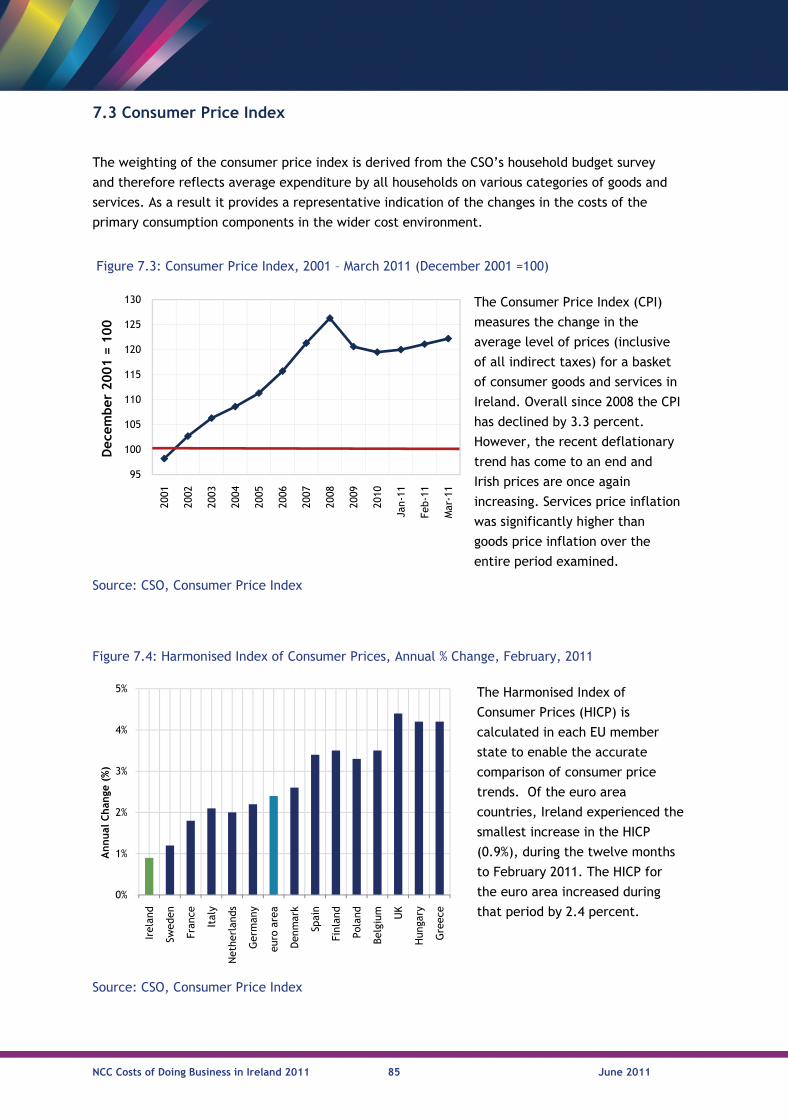
NCC Costs of Doing Business in Ireland 2011 85 June 2011
7.3 Consumer Price Index
The weighting of the consumer price index is derived from the CSO’s household budget survey
and therefore reflects average expenditure by all households on various categories of goods and
services. As a result it provides a representative indication of the changes in the costs of the
primary consumption components in the wider cost environment.
Figure 7.3: Consumer Price Index, 2001 – March 2011 (December 2001 =100)
The Consumer Price Index (CPI)
measures the change in the
average level of prices (inclusive
of all indirect taxes) for a basket
of consumer goods and services in
Ireland. Overall since 2008 the CPI
has declined by 3.3 percent.
However, the recent deflationary
trend has come to an end and
Irish prices are once again
increasing. Services price inflation
was significantly higher than
goods price inflation over the
entire period examined.
Source: CSO, Consumer Price Index
Figure 7.4: Harmonised Index of Consumer Prices, Annual % Change, February, 2011
The Harmonised Index of
Consumer Prices (HICP) is
calculated in each EU member
state to enable the accurate
comparison of consumer price
trends. Of the euro area
countries, Ireland experienced the
smallest increase in the HICP
(0.9%), during the twelve months
to February 2011. The HICP for
the euro area increased during
that period by 2.4 percent.
Source: CSO, Consumer Price Index
95
100
105
110
115
120
125
130
2001
2002
2003
2004
2005
2006
2007
2008
2009
2010
Jan-
11
Feb-
11
Mar
-11
Dec
ember
2001 =
100
0%
1%
2%
3%
4%
5%
Irel
and
Swed
en
Fran
ce
Ital
y
Net
herl
ands
Ger
man
y
euro
are
a
Den
mar
k
Spai
n
Finl
and
Pola
nd
Belg
ium UK
Hun
gary
Gre
ece
Annual
Chan
ge (
%)
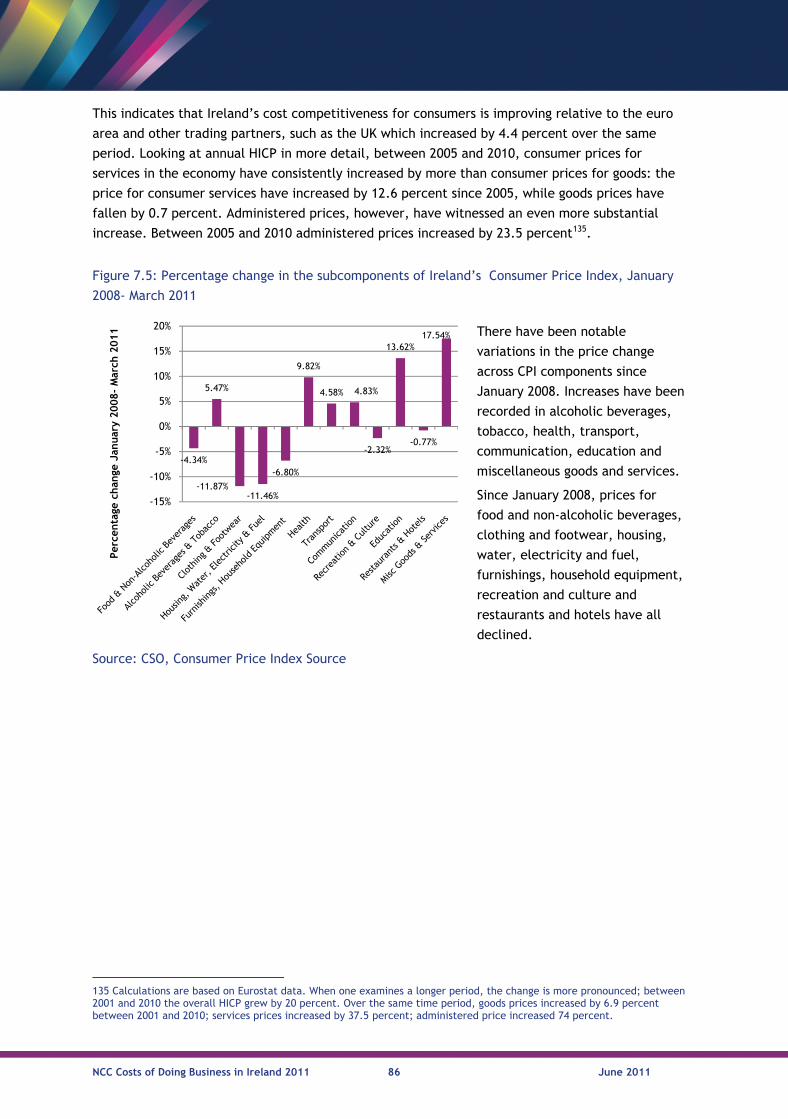
NCC Costs of Doing Business in Ireland 2011 86 June 2011
Source: CSO, Consumer Price Index Source
135 Calculations are based on Eurostat data. When one examines a longer period, the change is more pronounced; between 2001 and 2010 the overall HICP grew by 20 percent. Over the same time period, goods prices increased by 6.9 percent between 2001 and 2010; services prices increased by 37.5 percent; administered price increased 74 percent.
This indicates that Ireland’s cost competitiveness for consumers is improving relative to the euro
area and other trading partners, such as the UK which increased by 4.4 percent over the same
period. Looking at annual HICP in more detail, between 2005 and 2010, consumer prices for
services in the economy have consistently increased by more than consumer prices for goods: the
price for consumer services have increased by 12.6 percent since 2005, while goods prices have
fallen by 0.7 percent. Administered prices, however, have witnessed an even more substantial
increase. Between 2005 and 2010 administered prices increased by 23.5 percent135.
Figure 7.5: Percentage change in the subcomponents of Ireland’s Consumer Price Index, January
2008- March 2011
There have been notable
variations in the price change
across CPI components since
January 2008. Increases have been
recorded in alcoholic beverages,
tobacco, health, transport,
communication, education and
miscellaneous goods and services.
Since January 2008, prices for
food and non-alcoholic beverages,
clothing and footwear, housing,
water, electricity and fuel,
furnishings, household equipment,
recreation and culture and
restaurants and hotels have all
declined.
-4.34%
5.47%
-11.87%-11.46%
-6.80%
9.82%
4.58% 4.83%
-2.32%
13.62%
-0.77%
17.54%
-15%
-10%
-5%
0%
5%
10%
15%
20%
Per
centa
ge c
han
ge J
anuar
y 2008-
Mar
ch 2
011
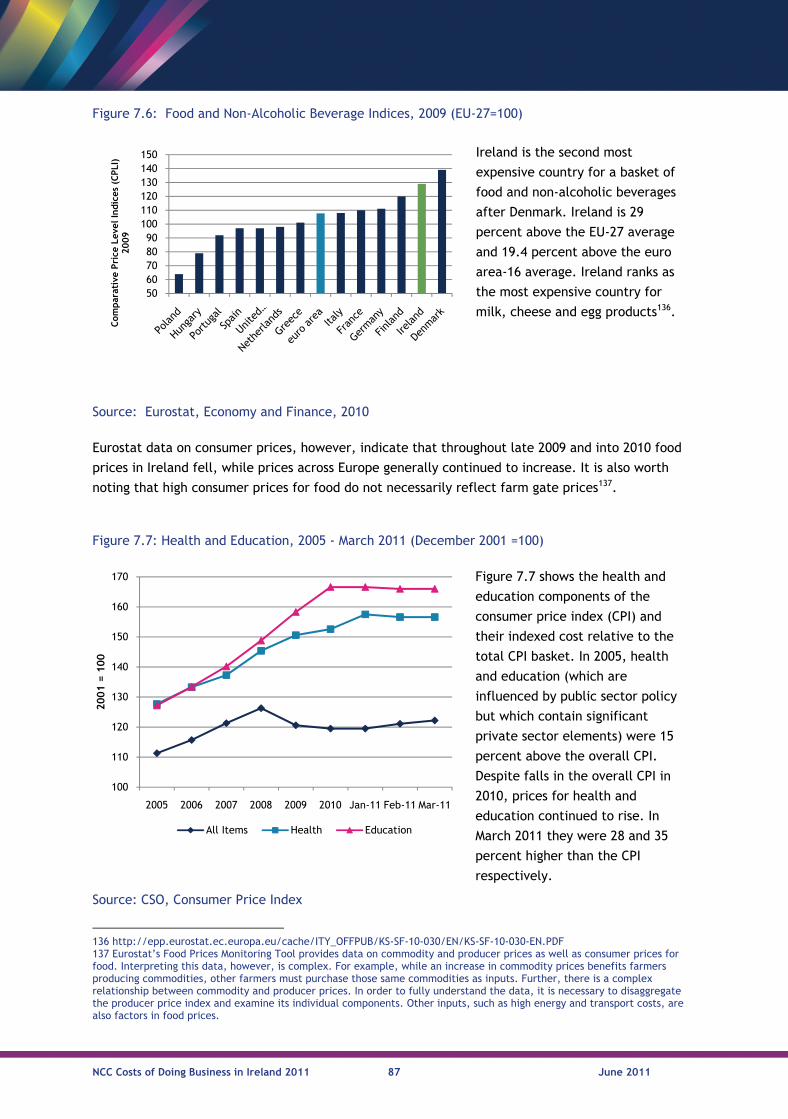
NCC Costs of Doing Business in Ireland 2011 87 June 2011
Eurostat data on consumer prices, however, indicate that throughout late 2009 and into 2010 food
prices in Ireland fell, while prices across Europe generally continued to increase. It is also worth
noting that high consumer prices for food do not necessarily reflect farm gate prices137.
136 http://epp.eurostat.ec.europa.eu/cache/ITY_OFFPUB/KS-SF-10-030/EN/KS-SF-10-030-EN.PDF 137 Eurostat’s Food Prices Monitoring Tool provides data on commodity and producer prices as well as consumer prices for food. Interpreting this data, however, is complex. For example, while an increase in commodity prices benefits farmers producing commodities, other farmers must purchase those same commodities as inputs. Further, there is a complex relationship between commodity and producer prices. In order to fully understand the data, it is necessary to disaggregate the producer price index and examine its individual components. Other inputs, such as high energy and transport costs, are also factors in food prices.
Figure 7.6: Food and Non-Alcoholic Beverage Indices, 2009 (EU-27=100)
Ireland is the second most
expensive country for a basket of
food and non-alcoholic beverages
after Denmark. Ireland is 29
percent above the EU-27 average
and 19.4 percent above the euro
area-16 average. Ireland ranks as
the most expensive country for
milk, cheese and egg products136.
Source: Eurostat, Economy and Finance, 2010
Figure 7.7: Health and Education, 2005 - March 2011 (December 2001 =100)
Figure 7.7 shows the health and
education components of the
consumer price index (CPI) and
their indexed cost relative to the
total CPI basket. In 2005, health
and education (which are
influenced by public sector policy
but which contain significant
private sector elements) were 15
percent above the overall CPI.
Despite falls in the overall CPI in
2010, prices for health and
education continued to rise. In
March 2011 they were 28 and 35
percent higher than the CPI
respectively.
Source: CSO, Consumer Price Index
5060708090
100110120130140150
Com
par
ativ
e Pri
ce L
evel
Indic
es (
CPLI
) 2009
100
110
120
130
140
150
160
170
2005 2006 2007 2008 2009 2010 Jan-11 Feb-11 Mar-11
2001 =
100
All Items Health Education

NCC Costs of Doing Business in Ireland 2011 88 June 2011
Health and education services are assigned a small weighting in the CPI138 (reflecting the small
proportion of total average household expenditure which they account for). Notwithstanding this,
given that these costs have risen despite a decrease in overall costs, there is scope for the
government to use its influence to reduce these prices.
7.4 Policy Discussion
While Ireland has already regained some cost competitiveness, further progress is required if Ireland
is to return to strong economic and employment growth. To achieve a greater restoration in cost
competitiveness, further price adjustment is required relative to our main competitors. It is,
however, relative prices that matter from a competitiveness perspective. So long as Irish prices
grow at a slower rate than prices in our competitor economies, Ireland will continue to achieve
competitiveness gains.
There are risks, however. Given the large debt burden which has arisen as a result of the property
bust, economic recession, and bank bailout, it is inevitable that taxes will rise further. The required
increases in taxation are likely to have a further impact on domestic demand which has already
been adversely affected by recent policy changes. The proportion of employment supported by the
domestic activity has fallen from 50 percent in 2007 to 40 percent in 2011, largely as a result of the
collapse in consumption139. In addressing the fiscal and labour market challenges which confront us,
the Government must be cognisant of the impact of its actions on domestic demand. The key is to
ensure that additional taxation measures are designed to protect job creation and facilitate a
recovery in consumer demand.
As noted, the period of deflation in Ireland appears to have come to an end and prices are rising
again. A combination of domestic price increases (many in regulated or government influence
sectors) allied to external factors such as oil prices threaten to undermine recent competitiveness
gains.
It is difficult for small open economies, particularly those that share a currency with larger regions,
to control their rate of price inflation, as this is, to a significant degree, determined by events
outside domestic control. Nonetheless, as noted throughout this report, there are a number of
policy levers available to Government which can be used to restore Ireland’s cost competitiveness.
Continued reductions in costs for labour, property, utilities and professional services would exert
downward pressure on overall costs and prices across the economy. Implementation of these
recommendations would represent a major step in ensuring Ireland’s future competitiveness and
prosperity.
138 Health has a weighting of 3.1536 and Education 2.0429. This compares to the weighting of 11.7423 for Food and non-alcoholic beverages. 139 CSO, Quarterly National Household Survey; Forfás Annual Employment Survey; Forfás calculations

NCC Costs of Doing Business in Ireland 2011 89 June 2011
Appendix - Summary of Specialist Databases Where possible the OECD, Eurostat and the CSO are used as the data sources for the indicators in
this report. In a number of cases, other databases are used to provide comparable data in specialist
areas. These are listed and detailed below.
1. KPMG – Competitive Alternatives Report, 2010
KPMG’s Competitive Alternatives Report was used to develop the sectoral cost profiles in Chapter 2.
Competitive Alternatives 2010 is an expansion and update of previous KPMG publications, and
measures the combined impact of 26 significant business cost components that are most likely to
vary by location. The study examines 17 industry operations in ten countries: Australia, Canada,
France, Germany, Italy, Japan, Mexico, the Netherlands, the United Kingdom, and the United
States. The basis for comparison is the after-tax cost of start-up and operations over 10 years.
2. Cushman and Wakefield – Global Research Reports Cushman and Wakefield is the world’s largest privately owned real estate solutions firm with offices
in 52 countries. The firm performs proprietary research and data-driven analysis using a web-based
system, tracks over 10 billion square feet of office and industrial real estate. The annual Cushman
and Wakefield “Office Space across the World” and “Industrial Space across the World” reports
provide a detailed analysis of prime office and industrial property rental performance and
occupancy costs across the globe in the previous year.
3. Gardner and Theobald – International Construction Costs Survey
Gardner and Theobald is a worldwide construction consultancy providing services in the areas of
project, cost, construction, dispute management, management consultancy and planning. The
annual “International Construction Costs Survey” contains data on building cost information (across
a variety of unit types), labour rates, material costs and inflation statistics.
5. The Economist Intelligence Unit (EIU) – World Investment Service The Economist Intelligence Unit’s World Investment Service provides a detailed database containing
business costs, flows of investment by country and industry and overseas mergers and acquisitions.
The service covers the world's 60 largest economies and provides analysis on political and economic
background, business environment, foreign investment regulations and trends in foreign investment.
6. World Bank - Doing Business 2011
The World Bank publishes the results of its Doing Business survey annually. It measures the
regulations applying to small and medium-size companies through their life cycle. The report covers
ten indicators sets and covers 181 different countries and aims to provide an objective basis for
understanding and improving the regulatory environment for business.
7. UBS - Prices and Earnings, 2009 edition - Update August 2010
UBS is a financial services firm that offers wealth management, asset management and investment
banking services. The study uses a standardised survey to provide a detailed look at the prices of
goods and services, wages working hours for 14 professions in 73 cities. The data for the 2009
report was collected in March 2009. All amounts were converted into a single currency (US$) to
ensure that the surveyed prices and earnings could be compared. To compensate for daily exchange
rate fluctuations, the average exchange rate over the data collection period was applied.

NCC Costs of Doing Business in Ireland 2011 90 June 2011
Notes

NCC Costs of Doing Business in Ireland 2011 91 June 2011

NCC Costs of Doing Business in Ireland 2011 92 June 2011

Wilton Park House, Wilton Place, Dublin 2, Ireland
Tel +353 1 607 3000 Fax +353 1 607 3030
www.competitiveness.ie
Top Related