


Languages
Pages
Legal

CONFIDENTIAL – DO NOT DISTRIBUTE
1
Navios Maritime Partners L.P. (NYSE:NMM)
Third Quarter 2021
Earnings Presentation
November 10, 2021

DRAFT
2
Forward-Looking Statements
This presentation contains and will contain forward-looking statements (as defined in Section 27A of the Securities Act of 1933, as amended, and
Section 21E of the Securities Exchange Act of 1934, as amended) concerning future events, including TCE rates and Navios Partners’ expected cash
flow generation, future contracted revenues, future distributions and its ability to make distributions going forward, Navios Partners’ ability to realize
the projected advantages of the Merger with Navios Acquisition, opportunities to reinvest cash accretively in a fleet renewal program or otherwise,
potential capital gains, its ability to take advantage of dislocation in the market and Navios Partners’ growth strategy and measures to implement such
strategy, including expected vessel acquisitions and entering into further time charters and Navios Partners’ ability to refinance its debt on attractive
terms, or at all. Words such as “may,” “expects,” “intends,” “plans,” “believes,” “anticipates,” “hopes,” “estimates,” and variations of such words and
similar expressions are intended to identify forward-looking statements.
These forward-looking statements are based on the information available to, and the expectations and assumptions deemed reasonable by Navios
Partners at the time these statements were made. Although Navios Partners believes that the expectations reflected in such forward-looking
statements are reasonable, no assurance can be given that such expectations will prove to have been correct. These statements involve risks and are
based upon a number of assumptions and estimates that are inherently subject to significant uncertainties and contingencies, many of which are
beyond the control of Navios Partners. Actual results may differ materially from those expressed or implied by such forward-looking statements.
Factors that could cause actual results to differ materially include, but are not limited to, risks relating to: global and regional economic and political
conditions including the impact of the COVID-19 pandemic and efforts throughout the world to contain its spread, including effects on global economic
activity, demand for seaborne transportation of the products we ship, the ability and willingness of charterers to fulfill their obligations to us and
prevailing charter rates, the economic condition of the markets in which we operate, shipyards performing scrubber installations, construction of
newbuilding vessels, drydocking and repairs, changing vessel crews and availability of financing; potential disruption of shipping routes due to
accidents, diseases, pandemics, political events, piracy or acts by terrorists; uncertainty relating to global trade, including prices of seaborne
commodities and continuing issues related to seaborne volume and ton miles, our continued ability to enter into long-term time charters, our ability to
maximize the use of our vessels, expected demand in the dry and liquid cargo shipping sectors in general and the demand for our Panamax,
Capesize, Ultra-Handymax, Containerships and Tanker vessels in particular, fluctuations in charter rates for dry bulk vessels, containerships and
tanker vessels, the aging of our fleet and resultant increases in operations costs, the loss of any customer or charter or vessel, the financial condition
of our customers, changes in the availability and costs of funding due to conditions in the bank market, capital markets and other factors, increases in
costs and expenses, including but not limited to: crew, insurance, provisions, port expenses, lube oil, bunkers, repairs, maintenance and general and
administrative expenses, the expected cost of, and our ability to comply with, governmental regulations and maritime self-regulatory organization
standards, as well as standard regulations imposed by our charterers applicable to our business, general domestic and international political
conditions, competitive factors in the market in which Navios Partners operates; risks associated with operations outside the United States; and other
factors listed from time to time in Navios Partners’ filings with the Securities and Exchange Commission, including its Form 20-Fs and Form 6-Ks.
Navios Partners expressly disclaims any obligations or undertaking to release publicly any updates or revisions to any forward-looking statements
contained herein to reflect any change in Navios Partners’ expectations with respect thereto or any change in events, conditions or circumstances on
which any statement is based. Navios Partners makes no prediction or statement about the performance of its common units.

DRAFT
3
EBITDA represents net income/ (loss) attributable to Navios Partners’ unitholders before interest and finance costs, depreciation and amortization
(including intangible accelerated amortization) and income taxes. Adjusted EBITDA represents EBITDA excluding certain items, as described
under “Earnings Highlights”. Navios Partners uses Adjusted EBITDA as a liquidity measure and reconciles EBITDA and Adjusted EBITDA to net
cash provided by operating activities, the most comparable U.S. GAAP liquidity measure. EBITDA in this document is calculated as follows: net
cash provided by operating activities adding back, when applicable and as the case may be, the effect of: (i) net increase/(decrease) in operating
assets; (ii) net (increase)/ decrease in operating liabilities; (iii) net interest cost; (iv) amortization and write-off of deferred financing cost; (v) equity
in net earnings/ (loss) of affiliated companies; (vi) impairment charges; (vii) non-cash accrued interest income and amortization of deferred
revenue; (viii) stock-based compensation expense; (ix) non-cash accrued interest income from receivable from affiliated companies; (x)
amortization of operating lease right-of-use asset; (xi) gain/(loss) on sale of assets and bargain purchase gain; and (xii) net income attributable to
noncontrolling interest. Navios Partners believes that EBITDA and Adjusted EBITDA are each the basis upon which liquidity can be assessed and
presents useful information to investors regarding Navios Partners’ ability to service and/or incur indebtedness, pay capital expenditures, meet
working capital requirements and make cash distributions. Navios Partners also believes that EBITDA and Adjusted EBITDA are used: (i) by
potential lenders to evaluate potential transactions; (ii) to evaluate and price potential acquisition candidates; and (iii) by securities analysts,
investors and other interested parties in the evaluation of companies in our industry.
Each of EBITDA and Adjusted EBITDA have limitations as an analytical tool, and should not be considered in isolation or as a substitute for the
analysis of Navios Partners’ results as reported under U.S. GAAP. Some of these limitations are: (i) EBITDA and Adjusted EBITDA do not reflect
changes in, or cash requirements for, working capital needs; and (ii) although depreciation and amortization are non-cash charges, the assets
being depreciated and amortized may have to be replaced in the future. EBITDA and Adjusted EBITDA do not reflect any cash requirements for
such capital expenditures. Because of these limitations, EBITDA and Adjusted EBITDA should not be considered as a principal indicator of Navios
Partners’ performance. Furthermore, our calculation of EBITDA and Adjusted EBITDA may not be comparable to that reported by other companies
due to differences in methods of calculation.
We present Adjusted Net Income / (Loss) attributable to Navios Partners’ unitholders by excluding items that we do not believe are indicative of our
core operating performance. Our presentation of Adjusted Net Income / (Loss) attributable to Navios Partners’ unitholders adjusts net income for
the items described above under “Earnings Highlights”. The definition of Adjusted Net Income / (Loss) attributable to Navios Partners’ unitholders
used here may not be comparable to that used by other companies due to differences in methods of calculation. Adjusted Basic Earnings/(Loss)
attributable to Navios Partners’ unitholders per Common Unit is defined as Adjusted Net Income / (Loss) attributable to Navios Partners’
unitholders divided by the weighted average number of common units outstanding for each of the periods presented, basic and diluted.
Our fleet data include: (i) five bareboat-in vessels of which four Capesize are expected to be delivered in H2 2022 and one Capesize is expected to
be delivered in H1 2023; (ii) two newbuilding Kamsarmax vessels expected to be delivered in H2 2022 and H1 2023; (iii) one VLCC vessel
expected to be delivered in H2 2022; and (iv) six newbuilding containerships agreed to be acquired and expected to be delivered in H2 2023 and in
2024.
Definitions

DRAFT
4
Leading US Publicly Listed Shipping Company
43 Containerships
215,222 TEU
Average age: 11.5 years
vs. industry average: 13.5 years
2 Vessels
10,000 TEU
2 Vessels
8,204 TEU
5 Vessels
6,800 TEU
6 Vessels
5,300 TEU
21 Vessels
4,250-4,730 TEU
3 Vessels
3,450 TEU
4 Vessels
2,000-3,400 TEU
20,000 TEU 16,408 TEU 34,000 TEU 31,800 TEU 91,813 TEU 10,350 TEU 10,851 TEU
54 Dry Bulk Vessels
6.6 million dwt
Average age: 9.5 years
vs. industry average: 10.8 years
24 Capesize Vessels 26 Panamax Vessels 4 Ultra-Handymax Vessels
4.3 million dwt 2.1 million dwt 0.2 million dwt
45 Tanker Vessels
5.4 million dwt
Average age: 8.7 years
vs. industry average: 11.6 years
12 Crude Tankers 31 Product Tankers 2 Chemical Tankers
VLCC tankers
280,000 – 320,000 dwt
10 LR1
60,000 – 85,000 dwt
18 MR2
47,000 – 52,000 dwt
3 MR1
35,000 – 45,000 dwt
Chemical Tankers
25,000 dwt
Note: Average age based on a dwt basis, basis fully delivered fleet.
DRAFT
Tankers
5
4454
10
43
45
Vessels 12/31/2020 Current Fleet
Number of Vessels
Dry Bulk Vessels
Containerships
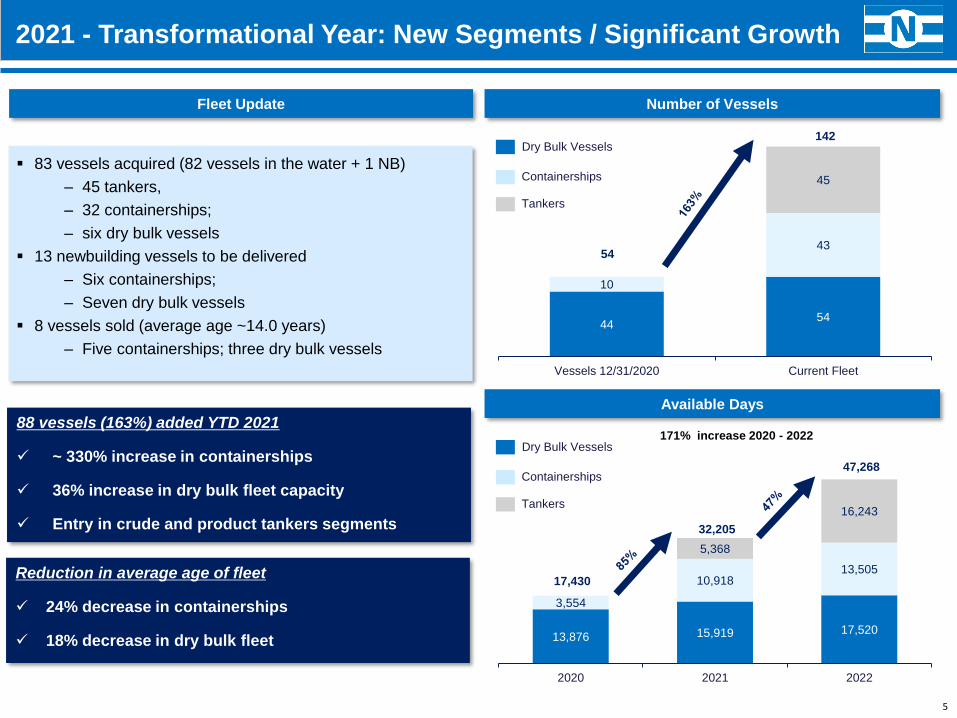
88 vessels (163%) added YTD 2021
✓ ~ 330% increase in containerships
✓ 36% increase in dry bulk fleet capacity
✓ Entry in crude and product tankers segments
Reduction in average age of fleet
✓ 24% decrease in containerships
✓ 18% decrease in dry bulk fleet
▪ 83 vessels acquired (82 vessels in the water + 1 NB)
‒ 45 tankers,
‒ 32 containerships;
‒ six dry bulk vessels
▪ 13 newbuilding vessels to be delivered
‒ Six containerships;
‒ Seven dry bulk vessels
▪ 8 vessels sold (average age ~14.0 years)
‒ Five containerships; three dry bulk vessels
Fleet Update
142
2021 - Transformational Year: New Segments / Significant Growth
54
Tankers
13,876 15,919 17,520
3,554
10,91813,505
5,368
16,243
2020 2021 2022
Available Days
Dry Bulk Vessels
Containerships47,268
32,205
17,430
171% increase 2020 - 2022
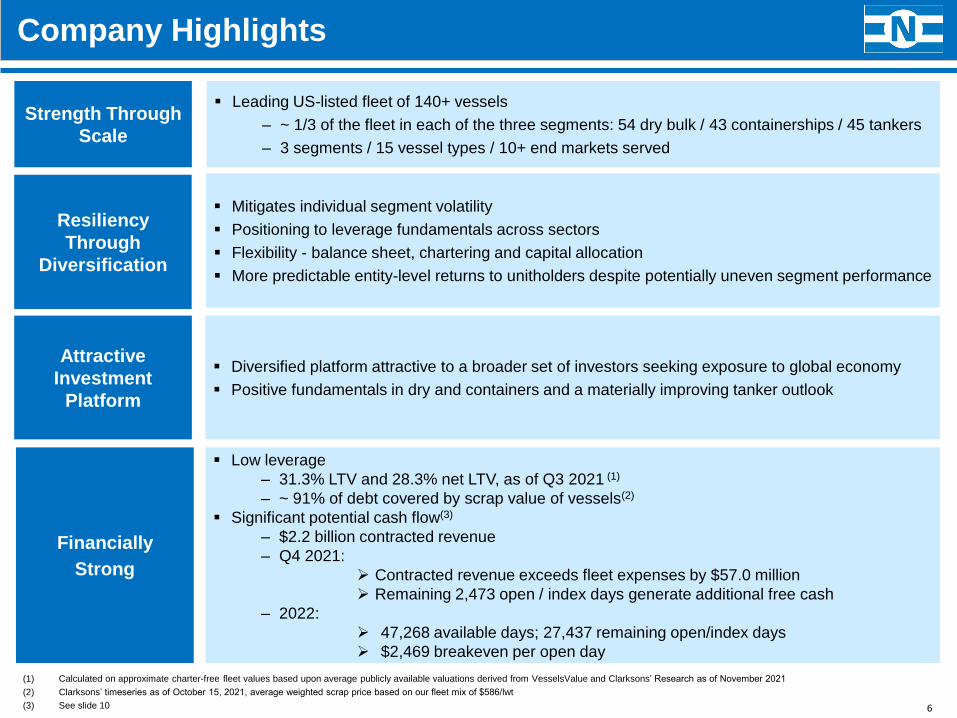
DRAFTCompany Highlights
(1) Calculated on approximate charter-free fleet values based upon average publicly available valuations derived from VesselsValue and Clarksons’ Research as of November 2021
(2) Clarksons’ timeseries as of October 15, 2021, average weighted scrap price based on our fleet mix of $586/lwt
(3) See slide 10
▪ Mitigates individual segment volatility
▪ Positioning to leverage fundamentals across sectors
▪ Flexibility - balance sheet, chartering and capital allocation
▪ More predictable entity-level returns to unitholders despite potentially uneven segment performance
Resiliency
Through
Diversification
Financially
Strong
▪ Diversified platform attractive to a broader set of investors seeking exposure to global economy
▪ Positive fundamentals in dry and containers and a materially improving tanker outlook
Attractive
Investment
Platform
▪ Low leverage
‒ 31.3% LTV and 28.3% net LTV, as of Q3 2021 (1)
‒ ~ 91% of debt covered by scrap value of vessels(2)
▪ Significant potential cash flow(3)
‒ $2.2 billion contracted revenue
‒ Q4 2021:
➢ Contracted revenue exceeds fleet expenses by $57.0 million
➢ Remaining 2,473 open / index days generate additional free cash
‒ 2022:
➢ 47,268 available days; 27,437 remaining open/index days
➢ $2,469 breakeven per open day
Strength Through
Scale
▪ Leading US-listed fleet of 140+ vessels
‒ ~ 1/3 of the fleet in each of the three segments: 54 dry bulk / 43 containerships / 45 tankers
‒ 3 segments / 15 vessel types / 10+ end markets served
6
DRAFTRecent Developments
7
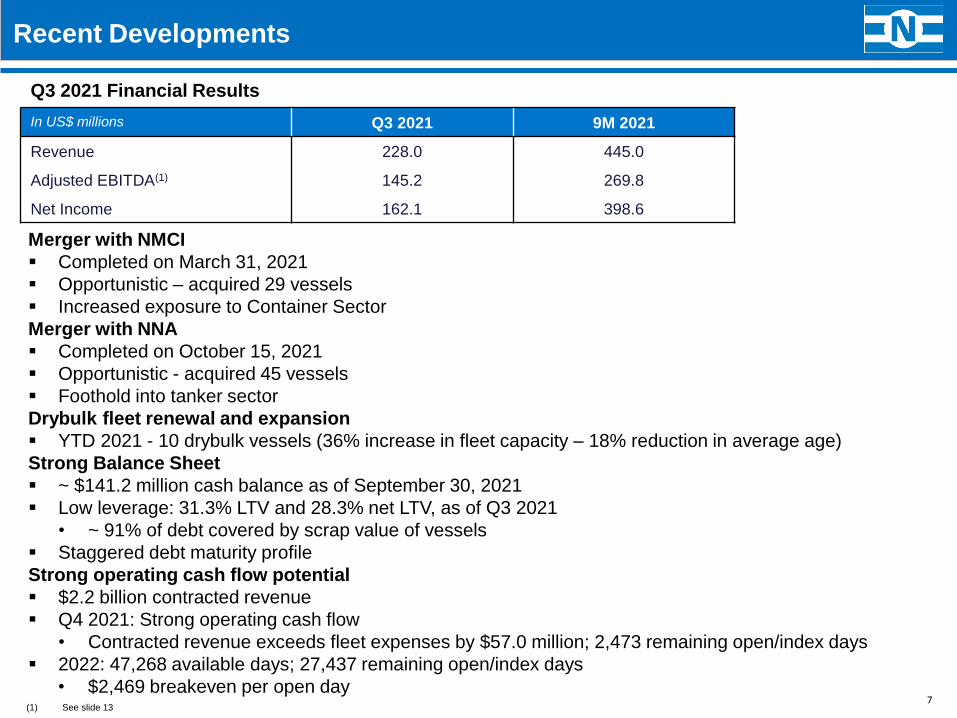
Merger with NMCI
▪ Completed on March 31, 2021
▪ Opportunistic – acquired 29 vessels
▪ Increased exposure to Container Sector
Merger with NNA
▪ Completed on October 15, 2021
▪ Opportunistic - acquired 45 vessels
▪ Foothold into tanker sector
Drybulk fleet renewal and expansion
▪ YTD 2021 - 10 drybulk vessels (36% increase in fleet capacity – 18% reduction in average age)
Strong Balance Sheet
▪ ~ $141.2 million cash balance as of September 30, 2021
▪ Low leverage: 31.3% LTV and 28.3% net LTV, as of Q3 2021
• ~ 91% of debt covered by scrap value of vessels
▪ Staggered debt maturity profile
Strong operating cash flow potential
▪ $2.2 billion contracted revenue
▪ Q4 2021: Strong operating cash flow
• Contracted revenue exceeds fleet expenses by $57.0 million; 2,473 remaining open/index days
▪ 2022: 47,268 available days; 27,437 remaining open/index days
• $2,469 breakeven per open day
Q3 2021 Financial Results
In US$ millions Q3 2021 9M 2021
Revenue 228.0 445.0
Adjusted EBITDA(1) 145.2 269.8
Net Income 162.1 398.6
(1) See slide 13

DRAFT
13.1%
86.9% 88.1%
11.9%
34.8%
65.2%
42.0%58.0%
8
Diversification Delivers Broad Exposure to Global Economy
Differentiated by industry leading scale and diversified sector exposure
NMM delivers broad exposure to the global economy
7%
73%
20%
Dry Bulk
Containership
Tanker
~$2.2 billion pipeline of contracted revenueAnalysis of contracted days by segment FY 2022
Fixed Open/
IndexFixed Open/
IndexFixed Open/
IndexFixed Open/
Index
Dry Bulk Vessels Containerships Tankers Total Fleet
▪ Balanced exposure in shipping segments mitigates normal industry cyclicality
▪ Flexible chartering and capital allocation leverages fundamentals across sectors
▪ Containerships
• Leveraging the strength of containership segment which is at multi-year highs
• $1.6 billion total contracted revenue on charters extending to 2030 – 88.1% fixed for 2022
▪ Dry bulk
• Benefiting from strong spot market
– Majority of days with market exposure – positioned for attractive period charters when available
▪ Tankers
• Long term contracts provide protection from market weakness
• Majority of forward days open – beginning recovery as oil demand rebounds
DRAFT
9
Drybulk
Fleet
Container
ships Tankers Total
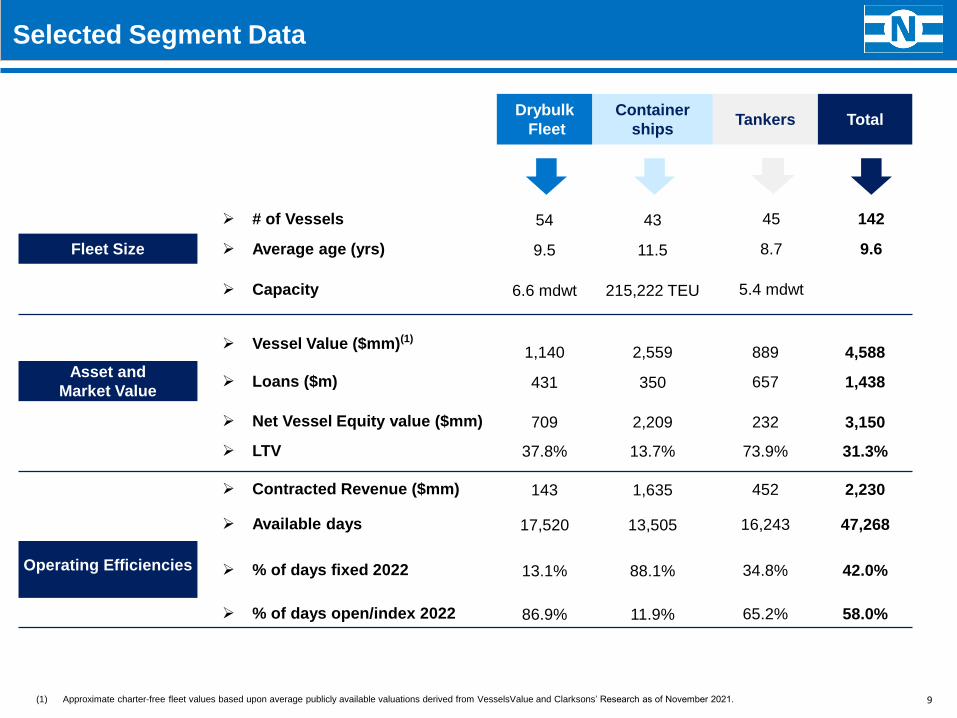
➢ # of Vessels 54 43 45 142
Fleet Size ➢ Average age (yrs) 9.5 11.5 8.7 9.6
➢ Capacity 6.6 mdwt 215,222 TEU 5.4 mdwt
➢ Vessel Value ($mm)(1)
1,140 2,559 889 4,588
Asset and
Market Value➢ Loans ($m) 431 350 657 1,438
➢ Net Vessel Equity value ($mm) 709 2,209 232 3,150
➢ LTV 37.8% 13.7% 73.9% 31.3%
➢ Contracted Revenue ($mm) 143 1,635 452 2,230
➢ Available days 17,520 13,505 16,243 47,268
Operating Efficiencies➢ % of days fixed 2022 13.1% 88.1% 34.8% 42.0%
➢ % of days open/index 2022 86.9% 11.9% 65.2% 58.0%
Selected Segment Data
(1) Approximate charter-free fleet values based upon average publicly available valuations derived from VesselsValue and Clarksons’ Research as of November 2021.

DRAFT
Vessel TypeAvailable
Days
Open / Index
Days
Current
Rates
Capesize7,208 5,739 27,199
Kamsarmax /
Panamax 8,852 8,059 27,641
Ultramax /
Handymax 1,460 1,430 26,580
10,000 TEU730 - 147,000
8,200 TEU730 117 130,000
6,800 TEU1,825 - 115,000
4,250 TEU7,665 529 97,500
3,500 TEU1,095 526 92,000
2,750 TEU1,460 441 77,000
VLCC4,198 1,982 20,000
LR13,650 3,294 13,500
MR26,570 3,762 12,750
MR11,095 828 11,000
Chemical730 730 12,750
Total 47,268 27,437 26,114
2022 Illustrative Operating Free Cash
Fleet Assumptions
Note: Drybulk rates: Current rate BDI Spot rates as of November 5, 2021. Containerships: Current rate = Clarksons’ 6-12 months TC rate as of November 5,2021. Tanker rates: Clarksons’ 1 YR. TC rates as of November 5,2021.
Note: Cash flow generation assumes normal operational performance. Total expenses include opex, G&As, interest expenses and loan repayments. Excludes payment of dividends and capex
Operating Free Cash Potential
10
Breakeven per open day Q4 2021 2022
Total Contracted Revenue 215,423 582,039
Total Fully Loaded Cost (158,430) (649,794)
Excess/(Shortage) 56,993 (67,755)
Open/Index days 2,473 27,437
Excess/(Shortage) per open day - (2,469)
Significant cash flow potential
▪ Q4 2021 – 78.8% fixed
• Contracted revenue exceeds total expenses
by $57.0 million
▪ 2022 – 42.0% fixed
• $2,469 breakeven per open day
$29,350$26,114
Average contracted daily
TCE
42.0% Fixed
Breakeven per open day
Current market
rates(1)
Weighted average
on open/index
days
$2,469
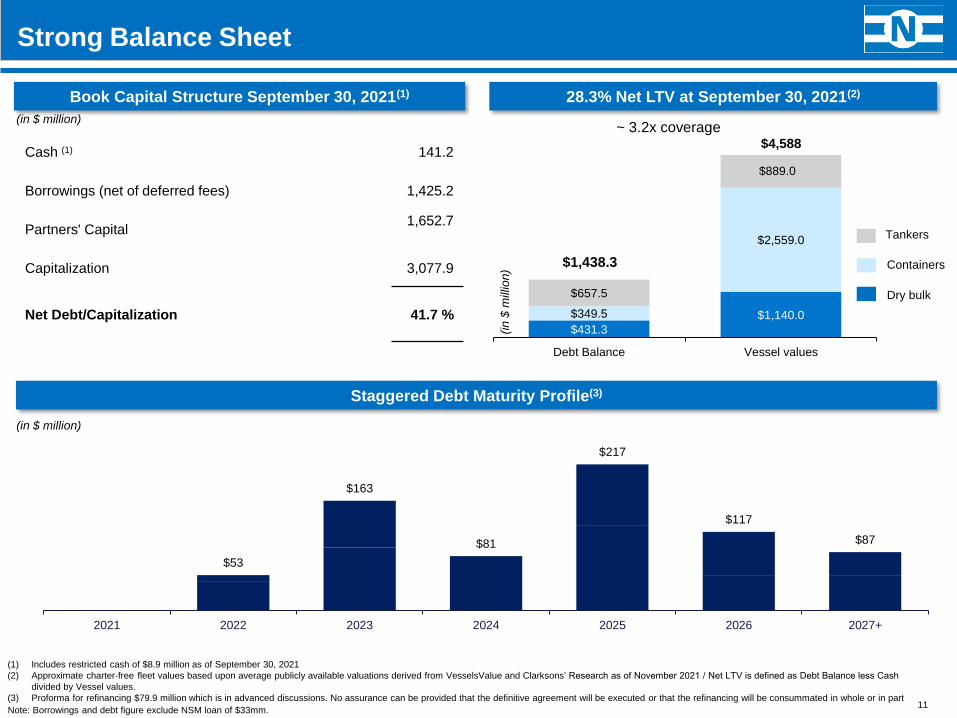
DRAFTStrong Balance Sheet
28.3% Net LTV at September 30, 2021(2)
(1) Includes restricted cash of $8.9 million as of September 30, 2021
(2) Approximate charter-free fleet values based upon average publicly available valuations derived from VesselsValue and Clarksons’ Research as of November 2021 / Net LTV is defined as Debt Balance less Cash
divided by Vessel values.
(3) Proforma for refinancing $79.9 million which is in advanced discussions. No assurance can be provided that the definitive agreement will be executed or that the refinancing will be consummated in whole or in part
(in $ million)
(in
$ m
illio
n)
$4,588Cash (1) 141.2
Borrowings (net of deferred fees) 1,425.2
Partners' Capital 1,652.7
Capitalization 3,077.9
Net Debt/Capitalization 41.7 %
$0
$53
$163
$81
$217
$117
$87
2021 2022 2023 2024 2025 2026 2027+
Staggered Debt Maturity Profile(3)
Book Capital Structure September 30, 2021(1)
~ 3.2x coverage
11
$431.3
$1,140.0$349.5
$2,559.0
$657.5
$889.0
Debt Balance Vessel values
$1,438.3
Dry bulk
Containers
Tankers
(in $ million)
Note: Borrowings and debt figure exclude NSM loan of $33mm.
DRAFT
12
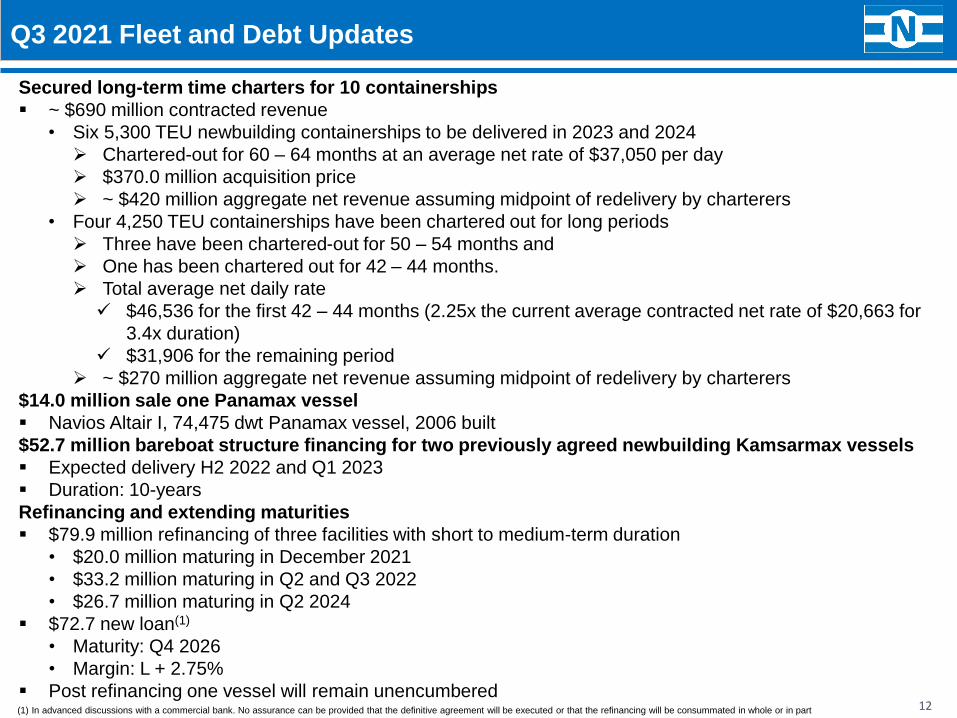
Q3 2021 Fleet and Debt Updates
Secured long-term time charters for 10 containerships
▪ ~ $690 million contracted revenue
• Six 5,300 TEU newbuilding containerships to be delivered in 2023 and 2024
➢ Chartered-out for 60 – 64 months at an average net rate of $37,050 per day
➢ $370.0 million acquisition price
➢ ~ $420 million aggregate net revenue assuming midpoint of redelivery by charterers
• Four 4,250 TEU containerships have been chartered out for long periods
➢ Three have been chartered-out for 50 – 54 months and
➢ One has been chartered out for 42 – 44 months.
➢ Total average net daily rate
✓ $46,536 for the first 42 – 44 months (2.25x the current average contracted net rate of $20,663 for
3.4x duration)
✓ $31,906 for the remaining period
➢ ~ $270 million aggregate net revenue assuming midpoint of redelivery by charterers
$14.0 million sale one Panamax vessel
▪ Navios Altair I, 74,475 dwt Panamax vessel, 2006 built
$52.7 million bareboat structure financing for two previously agreed newbuilding Kamsarmax vessels
▪ Expected delivery H2 2022 and Q1 2023
▪ Duration: 10-years
Refinancing and extending maturities
▪ $79.9 million refinancing of three facilities with short to medium-term duration
• $20.0 million maturing in December 2021
• $33.2 million maturing in Q2 and Q3 2022
• $26.7 million maturing in Q2 2024
▪ $72.7 new loan(1)
• Maturity: Q4 2026
• Margin: L + 2.75%
▪ Post refinancing one vessel will remain unencumbered(1) In advanced discussions with a commercial bank. No assurance can be provided that the definitive agreement will be executed or that the refinancing will be consummated in whole or in part
DRAFT
13
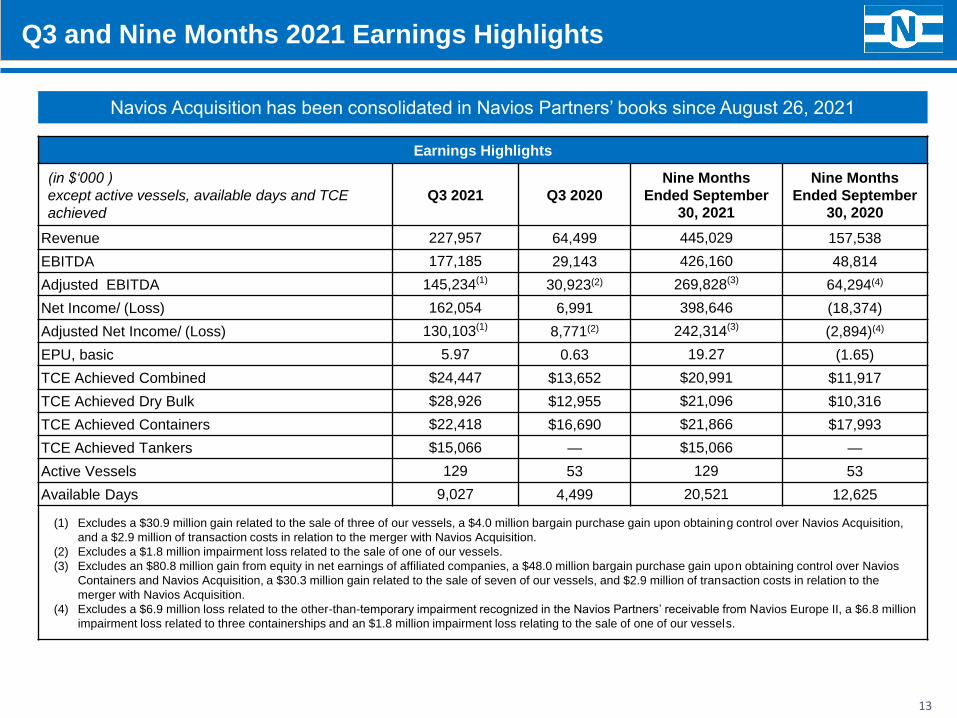
Q3 and Nine Months 2021 Earnings Highlights
Navios Acquisition has been consolidated in Navios Partners’ books since August 26, 2021
Earnings Highlights
(in $‘000 )
except active vessels, available days and TCE
achieved
Q3 2021 Q3 2020
Nine Months
Ended September
30, 2021
Nine Months
Ended September
30, 2020
Revenue 227,957 64,499 445,029 157,538
EBITDA 177,185 29,143 426,160 48,814
Adjusted EBITDA 145,234(1) 30,923(2) 269,828(3) 64,294(4)
Net Income/ (Loss) 162,054 6,991 398,646 (18,374)
Adjusted Net Income/ (Loss) 130,103(1) 8,771(2) 242,314(3) (2,894)(4)
EPU, basic 5.97 0.63 19.27 (1.65)
TCE Achieved Combined $24,447 $13,652 $20,991 $11,917
TCE Achieved Dry Bulk $28,926 $12,955 $21,096 $10,316
TCE Achieved Containers $22,418 $16,690 $21,866 $17,993
TCE Achieved Tankers $15,066 — $15,066 —
Active Vessels 129 53 129 53
Available Days 9,027 4,499 20,521 12,625
(1) Excludes a $30.9 million gain related to the sale of three of our vessels, a $4.0 million bargain purchase gain upon obtaining control over Navios Acquisition,
and a $2.9 million of transaction costs in relation to the merger with Navios Acquisition.
(2) Excludes a $1.8 million impairment loss related to the sale of one of our vessels.
(3) Excludes an $80.8 million gain from equity in net earnings of affiliated companies, a $48.0 million bargain purchase gain upon obtaining control over Navios
Containers and Navios Acquisition, a $30.3 million gain related to the sale of seven of our vessels, and $2.9 million of transaction costs in relation to the
merger with Navios Acquisition.
(4) Excludes a $6.9 million loss related to the other-than-temporary impairment recognized in the Navios Partners’ receivable from Navios Europe II, a $6.8 million
impairment loss related to three containerships and an $1.8 million impairment loss relating to the sale of one of our vessels.
DRAFT
14
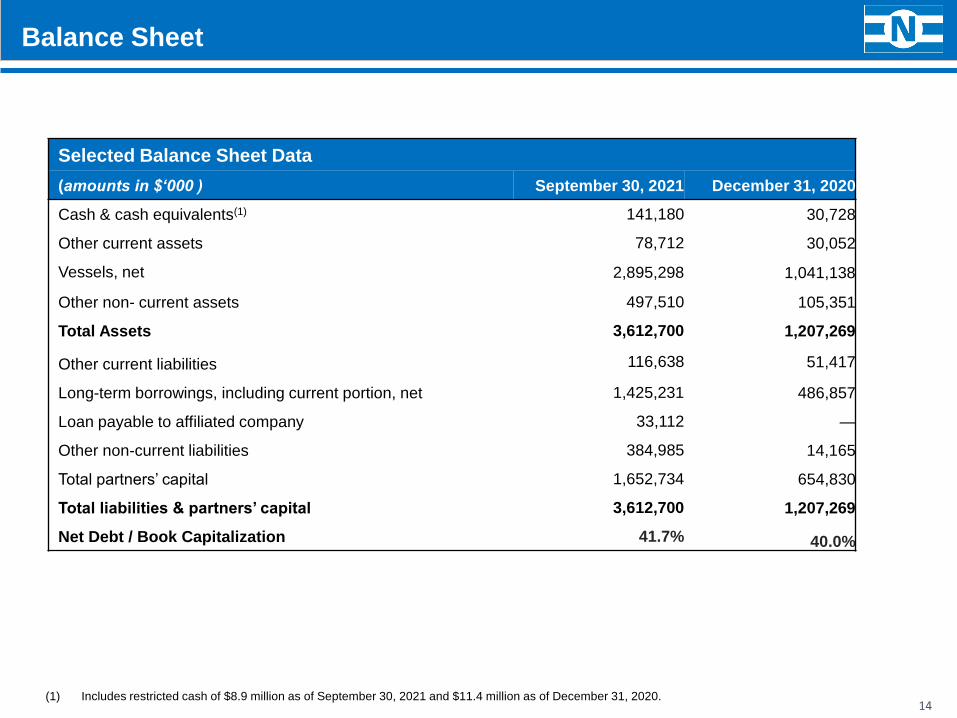
Balance Sheet
(1) Includes restricted cash of $8.9 million as of September 30, 2021 and $11.4 million as of December 31, 2020.
Selected Balance Sheet Data
(amounts in $‘000 ) September 30, 2021 December 31, 2020
Cash & cash equivalents(1) 141,180 30,728
Other current assets 78,712 30,052
Vessels, net 2,895,298 1,041,138
Other non- current assets 497,510 105,351
Total Assets 3,612,700 1,207,269
Other current liabilities 116,638 51,417
Long-term borrowings, including current portion, net 1,425,231 486,857
Loan payable to affiliated company 33,112 —
Other non-current liabilities 384,985 14,165
Total partners’ capital 1,652,734 654,830
Total liabilities & partners’ capital 3,612,700 1,207,269
Net Debt / Book Capitalization 41.7% 40.0%
DRAFT
15
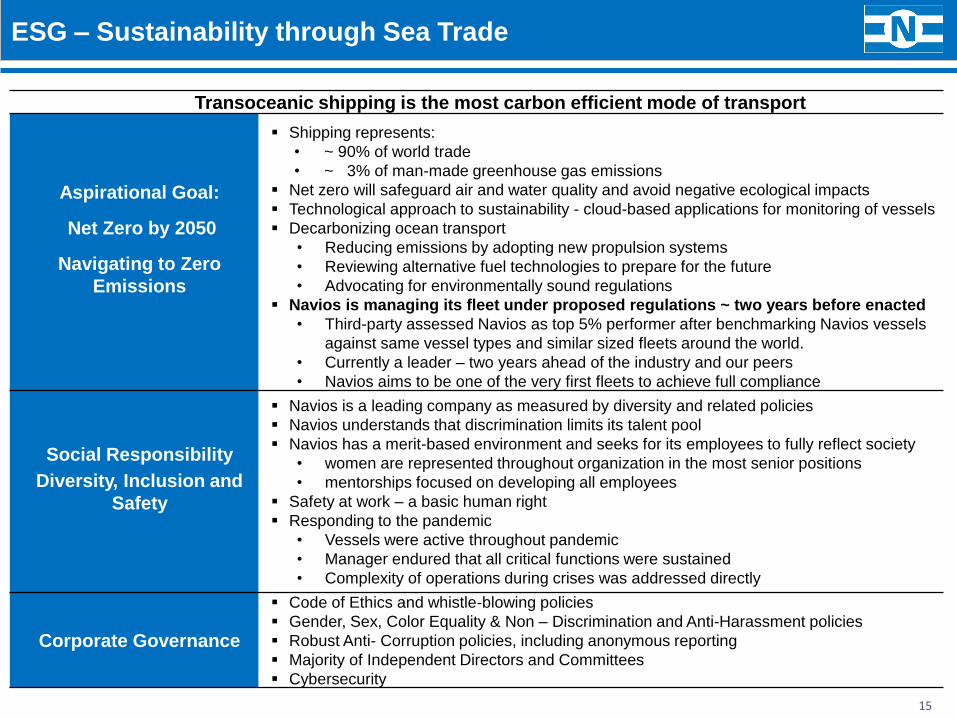
Transoceanic shipping is the most carbon efficient mode of transport
Aspirational Goal:
Net Zero by 2050
Navigating to Zero
Emissions
▪ Shipping represents:
• ~ 90% of world trade
• ~ 3% of man-made greenhouse gas emissions
▪ Net zero will safeguard air and water quality and avoid negative ecological impacts
▪ Technological approach to sustainability - cloud-based applications for monitoring of vessels
▪ Decarbonizing ocean transport
• Reducing emissions by adopting new propulsion systems
• Reviewing alternative fuel technologies to prepare for the future
• Advocating for environmentally sound regulations
▪ Navios is managing its fleet under proposed regulations ~ two years before enacted
• Third-party assessed Navios as top 5% performer after benchmarking Navios vessels
against same vessel types and similar sized fleets around the world.
• Currently a leader – two years ahead of the industry and our peers
• Navios aims to be one of the very first fleets to achieve full compliance
Social Responsibility
Diversity, Inclusion and
Safety
▪ Navios is a leading company as measured by diversity and related policies
▪ Navios understands that discrimination limits its talent pool
▪ Navios has a merit-based environment and seeks for its employees to fully reflect society
• women are represented throughout organization in the most senior positions
• mentorships focused on developing all employees
▪ Safety at work – a basic human right
▪ Responding to the pandemic
• Vessels were active throughout pandemic
• Manager endured that all critical functions were sustained
• Complexity of operations during crises was addressed directly
Corporate Governance
▪ Code of Ethics and whistle-blowing policies
▪ Gender, Sex, Color Equality & Non – Discrimination and Anti-Harassment policies
▪ Robust Anti- Corruption policies, including anonymous reporting
▪ Majority of Independent Directors and Committees
▪ Cybersecurity
ESG – Sustainability through Sea Trade

DRAFT
Industry Overview
DRAFT
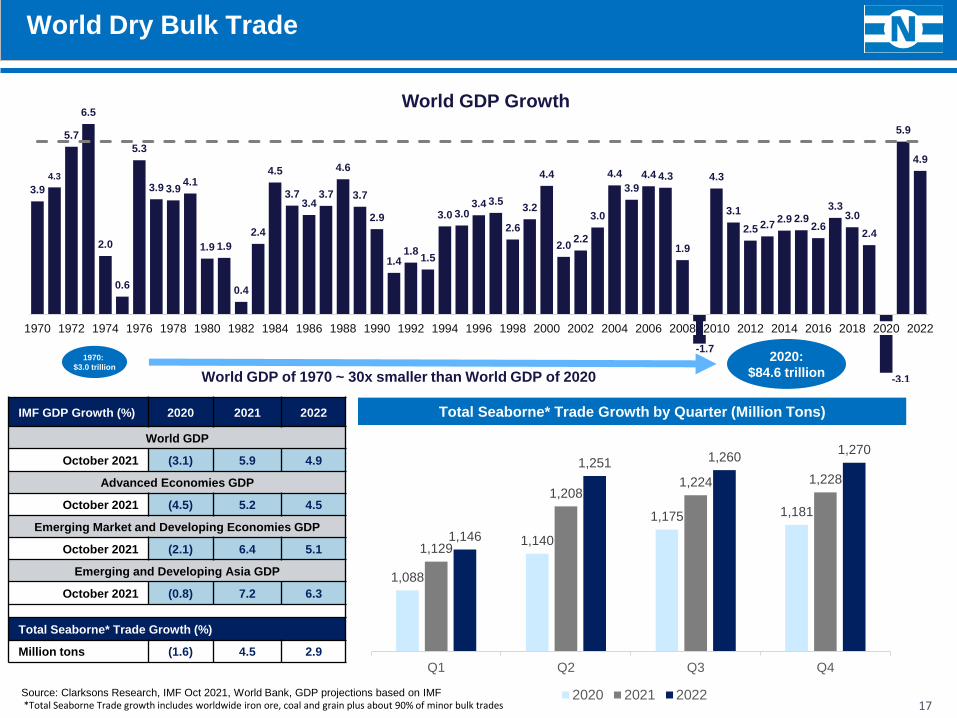
17Source: Clarksons Research, IMF Oct 2021, World Bank, GDP projections based on IMF *Total Seaborne Trade growth includes worldwide iron ore, coal and grain plus about 90% of minor bulk trades
IMF GDP Growth (%) 2020 2021 2022
World GDP
October 2021 (3.1) 5.9 4.9
Advanced Economies GDP
October 2021 (4.5) 5.2 4.5
Emerging Market and Developing Economies GDP
October 2021 (2.1) 6.4 5.1
Emerging and Developing Asia GDP
October 2021 (0.8) 7.2 6.3
Total Seaborne* Trade Growth (%)
Million tons (1.6) 4.5 2.9
World Dry Bulk Trade
1,088
1,140
1,175 1,181
1,129
1,2081,224 1,228
1,146
1,251 1,2601,270
Q1 Q2 Q3 Q4
2020 2021 2022
Total Seaborne* Trade Growth by Quarter (Million Tons)
3.9
4.3
5.7
6.5
2.0
0.6
5.3
3.9 3.94.1
1.9 1.9
0.4
2.4
4.5
3.73.4
3.7
4.6
3.7
2.9
1.41.8
1.5
3.0 3.03.4 3.5
2.6
3.2
4.4
2.02.2
3.0
4.4
3.9
4.4 4.3
1.9
-1.7
4.3
3.1
2.5 2.72.9 2.9
2.6
3.33.0
2.4
-3.1
5.9
4.9
1970 1972 1974 1976 1978 1980 1982 1984 1986 1988 1990 1992 1994 1996 1998 2000 2002 2004 2006 2008 2010 2012 2014 2016 2018 2020 2022
World GDP Growth
1970:
$3.0 trillion2020:
$84.6 trillionWorld GDP of 1970 ~ 30x smaller than World GDP of 2020

DRAFT
18
Major Commodities: Continued Strong Growth in Seaborne Trade
Source: Clarksons including DBTO Oct 2021, Clarksons Research;
(1) Asian Coal include imports to China, India, Japan, South Korea, Taiwan, Vietnam, Malaysia, Thailand, the Philippines, Indonesia ,Pakistan, Hong Kong, Sri Lanka and other minor importers
18
GrainsIron Ore
Post pandemic growth fueled by Iron Ore
◼ World seaborne iron ore trade is expected
to increase by 3.4% in 2021 driven mainly
by a 8.7% expected increase in Brazilian
iron ore exports. For 2022 iron ore demand
is expected to increase by 2.4%.
◼ Forecasts are also for growth in iron ore
imports around the world as the effects of
the pandemic recede: Europe’s imports are
expected to grow by 18% and Asia,
excluding China, is expected to import 12%
more iron ore in 2021 than in 2020.
◼ Additional availability of Atlantic exports to
China and the Far East are expected to
increase as steel mills replenish stockpiles,
increasing ton-miles and driving demand
for capesize vessels.
1,590
1,645
1,684
1,180
1,260
1,295
Coal
535
547
565
2020 2021 20222020 2021 20222020 2021 2022
Mil.
tons
Mil.
tons
Mil.
tons
Continued Growth on Asian Coal Imports
◼ Asian coal(1) imports are expected to grow by
4.8% in 2021 followed by a growth of 1.6% in
2022
◼ China will increase coal imports by 9.1% this
year due to high gas prices. China
experiencing coal supply shortages due to
weather and mine closures leaving inventories
at very low levels
◼ India is forecast to increase coal imports by
3.9% in 2021 and 4.9% in 2022. India’s
economic growth in 2H21 used 14.3% more
power Nov YTD causing coal inventories to
drop 69% since Jan 2021
◼ Gas prices have exceeded coal prices since
August and the trend is expected to continue
◼ In spite of stated goals of carbon neutrality, the
gas price surge has driven power plants to
switch back to coal-fired power generation
Food Security Drives Demand for Grain
◼ Seaborne grain trade to increase by
2.4% in 2021 followed by 3.3% in 2022
◼ World grain production the 2021/22
Marketing Year (MY) will reach a record
according to International Grains Council
and USDA while USDA forecasts record
Brazilian soybean crop of 145 million
tons (up from 137 mt) with US coarse
grain and soybean exports at record
levels for MY 2021/22
◼ Overall Asian grain imports increased by
15.5% to 253.0 million tons in 2020 and
will increase a further 11.2% to 281.4
million tons in 2021
◼ Chinese soybean and coarse grain
imports for 2021 are forecasted to be
about 26.1 (19.8%) million tons more
than 2020 after a 29.4 (28.8%) million ton
gain in 2020
DRAFT
19
48.938.8
15.9 1.1
6.7
0
10
20
30
40
50
60
70
On 1/1/2021
Non-deliveries
12%
Before non-delivery
Orderbook (by year of delivery) as of Jan 1, 2021
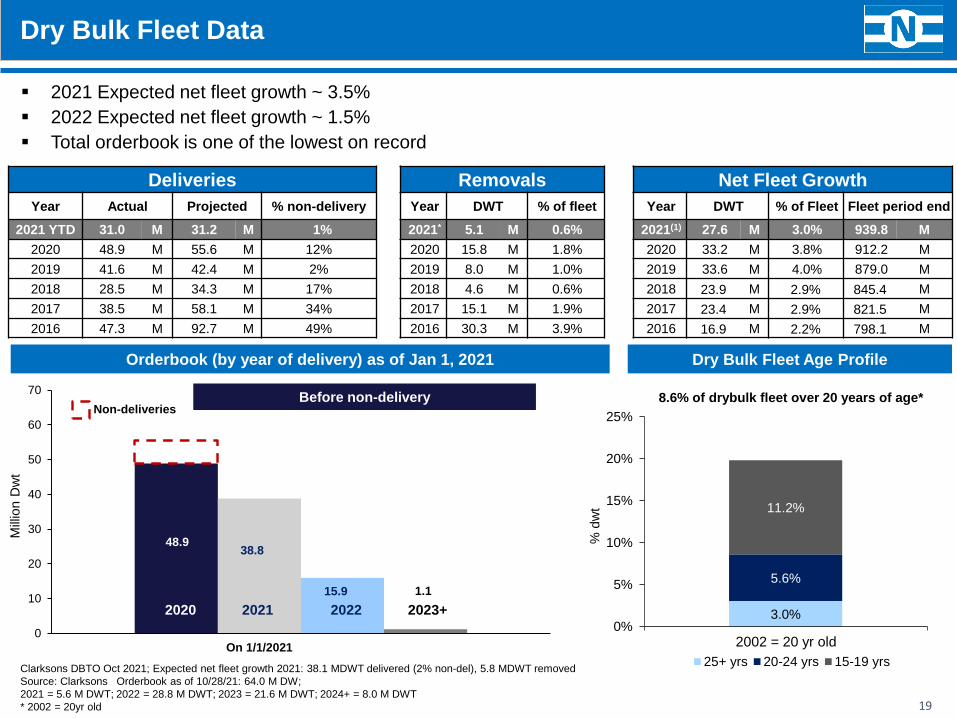
Dry Bulk Fleet Data
2020 2021 2022 2023+
Clarksons DBTO Oct 2021; Expected net fleet growth 2021: 38.1 MDWT delivered (2% non-del), 5.8 MDWT removed
Source: Clarksons Orderbook as of 10/28/21: 64.0 M DW;
2021 = 5.6 M DWT; 2022 = 28.8 M DWT; 2023 = 21.6 M DWT; 2024+ = 8.0 M DWT
* 2002 = 20yr old
3.0%
5.6%
11.2%
0%
5%
10%
15%
20%
25%
25+ yrs 20-24 yrs 15-19 yrs
2002 = 20 yr old
▪ 2021 Expected net fleet growth ~ 3.5%
▪ 2022 Expected net fleet growth ~ 1.5%
▪ Total orderbook is one of the lowest on record
Dry Bulk Fleet Age Profile
% d
wt
Deliveries Removals Net Fleet Growth
Year Actual Projected % non-delivery Year DWT % of fleet Year DWT % of Fleet Fleet period end
2021 YTD 31.0 M 31.2 M 1% 2021* 5.1 M 0.6% 2021(1) 27.6 M 3.0% 939.8 M
2020 48.9 M 55.6 M 12% 2020 15.8 M 1.8% 2020 33.2 M 3.8% 912.2 M
2019 41.6 M 42.4 M 2% 2019 8.0 M 1.0% 2019 33.6 M 4.0% 879.0 M
2018 28.5 M 34.3 M 17% 2018 4.6 M 0.6% 2018 23.9 M 2.9% 845.4 M
2017 38.5 M 58.1 M 34% 2017 15.1 M 1.9% 2017 23.4 M 2.9% 821.5 M
2016 47.3 M 92.7 M 49% 2016 30.3 M 3.9% 2016 16.9 M 2.2% 798.1 M
8.6% of drybulk fleet over 20 years of age*
Mill
ion D
wt
DRAFT
Container Industry Overview
DRAFT
21
-9.6%
13.7%
7.4%
3.3%
4.9%
5.0%
2.0%
4.5%5.6% 4.3%
2.0%
-1.2%
6.3%
3.9%
-15%
-10%
-5%
0%
5%
10%
15%
0
20
40
60
80
100
120
140
160
180
200
220
19
96
19
97
19
98
19
99
20
00
20
01
20
02
20
03
20
04
20
05
20
06
20
07
20
08
20
09
20
10
20
11
20
12
20
13
20
14
20
15
20
16
20
17
20
18
20
19
20
20 P
20
21 F
20
22 F
growthm TEU
World Trade Trade Growth % World GDP Growth % (RHS)
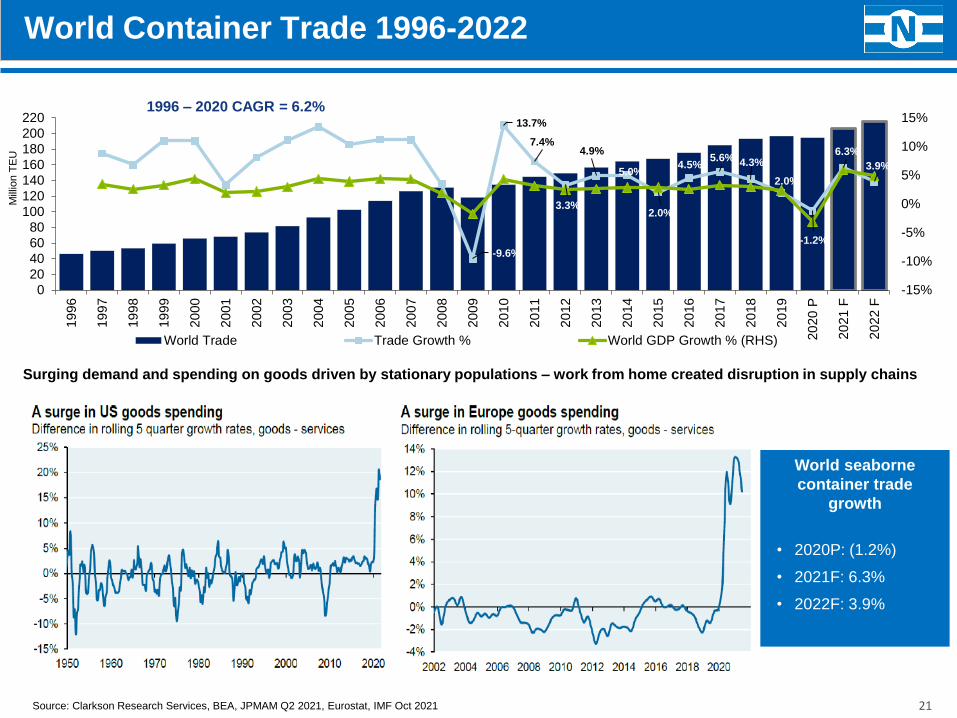
1996 – 2020 CAGR = 6.2%
Source: Clarkson Research Services, BEA, JPMAM Q2 2021, Eurostat, IMF Oct 2021
World Container Trade 1996-2022
Surging demand and spending on goods driven by stationary populations – work from home created disruption in supply chains
World seaborne
container trade
growth
• 2020P: (1.2%)
• 2021F: 6.3%
• 2022F: 3.9%
Mill
ion T
EU
DRAFT
22
2.9%
7.5%
19.3%
0%
5%
10%
15%
20%
25%
30%
35%
Container Fleet Age Profile (% TEU)
25+ yrs 20-24 yrs 15-19 yrs
Deliveries Removals Net fleet growth
Year Actual Projected% Non-
DeliveryYear TEU
% of
FleetYear TEU % of Fleet
Fleet Period
End
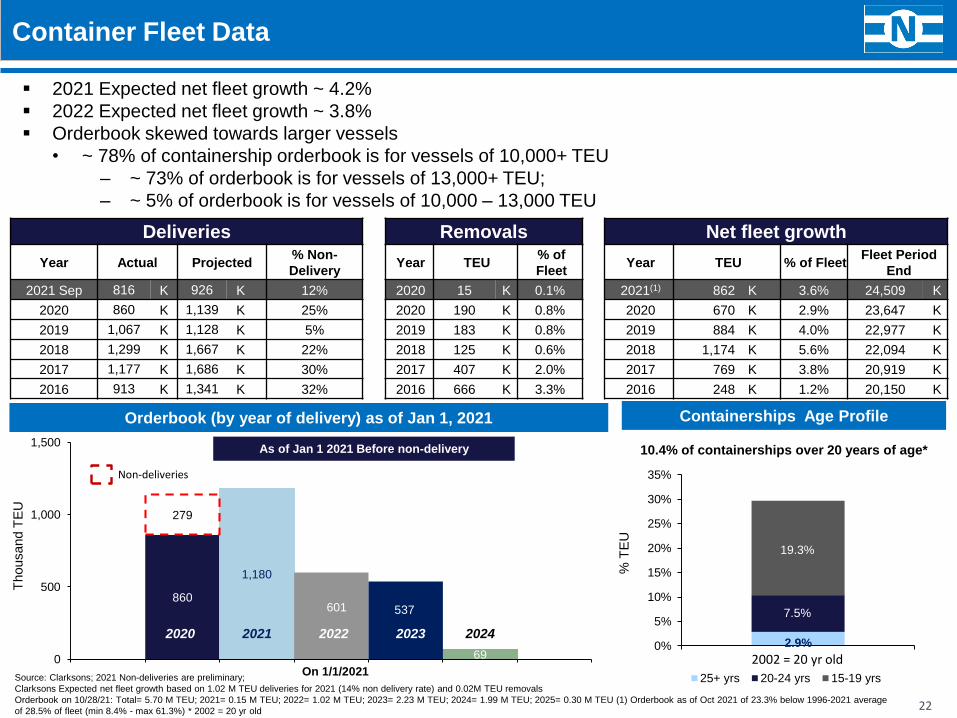
2021 Sep 816 K 926 K 12% 2020 15 K 0.1% 2021(1) 862 K 3.6% 24,509 K
2020 860 K 1,139 K 25% 2020 190 K 0.8% 2020 670 K 2.9% 23,647 K
2019 1,067 K 1,128 K 5% 2019 183 K 0.8% 2019 884 K 4.0% 22,977 K
2018 1,299 K 1,667 K 22% 2018 125 K 0.6% 2018 1,174 K 5.6% 22,094 K
2017 1,177 K 1,686 K 30% 2017 407 K 2.0% 2017 769 K 3.8% 20,919 K
2016 913 K 1,341 K 32% 2016 666 K 3.3% 2016 248 K 1.2% 20,150 K
Container Fleet Data
860
1,180
601 537
69
279
0
500
1,000
1,500
On 1/1/2021
As of Jan 1 2021 Before non-delivery
Non-deliveries
25%
Orderbook (by year of delivery) as of Jan 1, 2021
2020 2021 2022 2023 2024
Containerships Age Profile
10.4% of containerships over 20 years of age*
▪ 2021 Expected net fleet growth ~ 4.2%
▪ 2022 Expected net fleet growth ~ 3.8%
▪ Orderbook skewed towards larger vessels
• ~ 78% of containership orderbook is for vessels of 10,000+ TEU
– ~ 73% of orderbook is for vessels of 13,000+ TEU;
– ~ 5% of orderbook is for vessels of 10,000 – 13,000 TEU
Source: Clarksons; 2021 Non-deliveries are preliminary;
Clarksons Expected net fleet growth based on 1.02 M TEU deliveries for 2021 (14% non delivery rate) and 0.02M TEU removals
Orderbook on 10/28/21: Total= 5.70 M TEU; 2021= 0.15 M TEU; 2022= 1.02 M TEU; 2023= 2.23 M TEU; 2024= 1.99 M TEU; 2025= 0.30 M TEU (1) Orderbook as of Oct 2021 of 23.3% below 1996-2021 average
of 28.5% of fleet (min 8.4% - max 61.3%) * 2002 = 20 yr old
Thousand T
EU
% T
EU
2002 = 20 yr old
DRAFT
Tanker Industry Overview
DRAFT
24
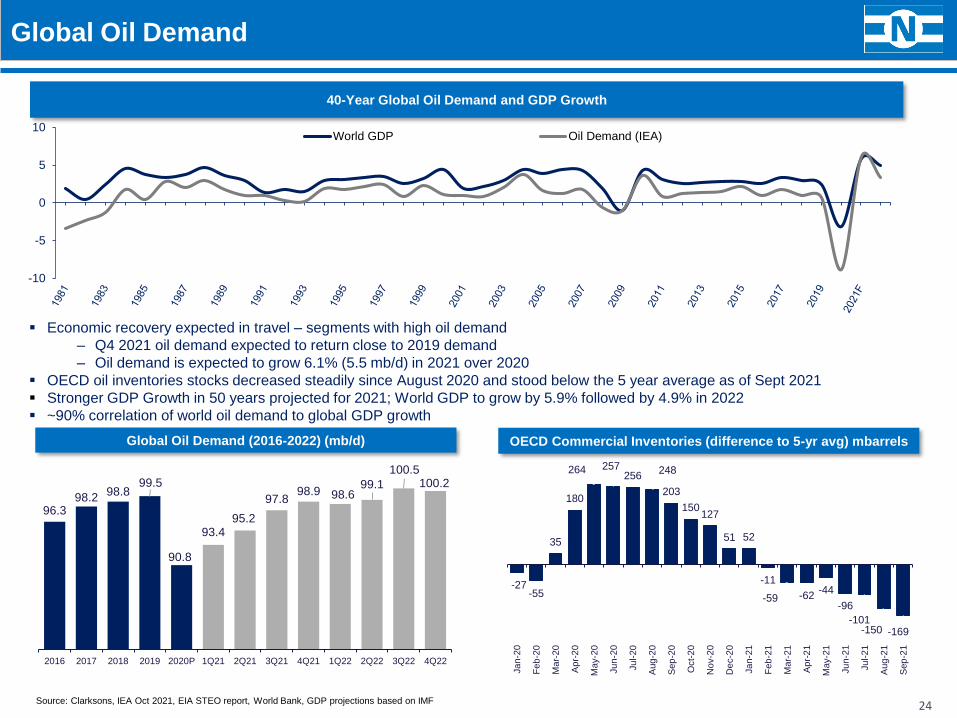
Global Oil Demand
Source: Clarksons, IEA Oct 2021, EIA STEO report, World Bank, GDP projections based on IMF
20+ years
VLCCs in
2022
96.398.2
98.899.5
90.8
93.495.2
97.898.9 98.6
99.1
100.5100.2
2016 2017 2018 2019 2020P 1Q21 2Q21 3Q21 4Q21 1Q22 2Q22 3Q22 4Q22
Global Oil Demand (2016-2022) (mb/d)
40-Year Global Oil Demand and GDP Growth
-10
-5
0
5
10World GDP Oil Demand (IEA)
▪ Economic recovery expected in travel – segments with high oil demand
‒ Q4 2021 oil demand expected to return close to 2019 demand
‒ Oil demand is expected to grow 6.1% (5.5 mb/d) in 2021 over 2020
▪ OECD oil inventories stocks decreased steadily since August 2020 and stood below the 5 year average as of Sept 2021
▪ Stronger GDP Growth in 50 years projected for 2021; World GDP to grow by 5.9% followed by 4.9% in 2022
▪ ~90% correlation of world oil demand to global GDP growth
OECD Commercial Inventories (difference to 5-yr avg) mbarrels
-27-55
35
180
264 257256
248
203
150127
51 52
-11
-59 -62-44
-96
-101-150 -169
Ja
n-2
0
Feb
-20
Mar-
20
Apr-
20
May-2
0
Ju
n-2
0
Ju
l-20
Aug
-20
Sep
-20
Oct-
20
No
v-2
0
De
c-2
0
Ja
n-2
1
Feb
-21
Mar-
21
Apr-
21
May-2
1
Ju
n-2
1
Ju
l-21
Aug
-21
Sep
-21
DRAFT
2525
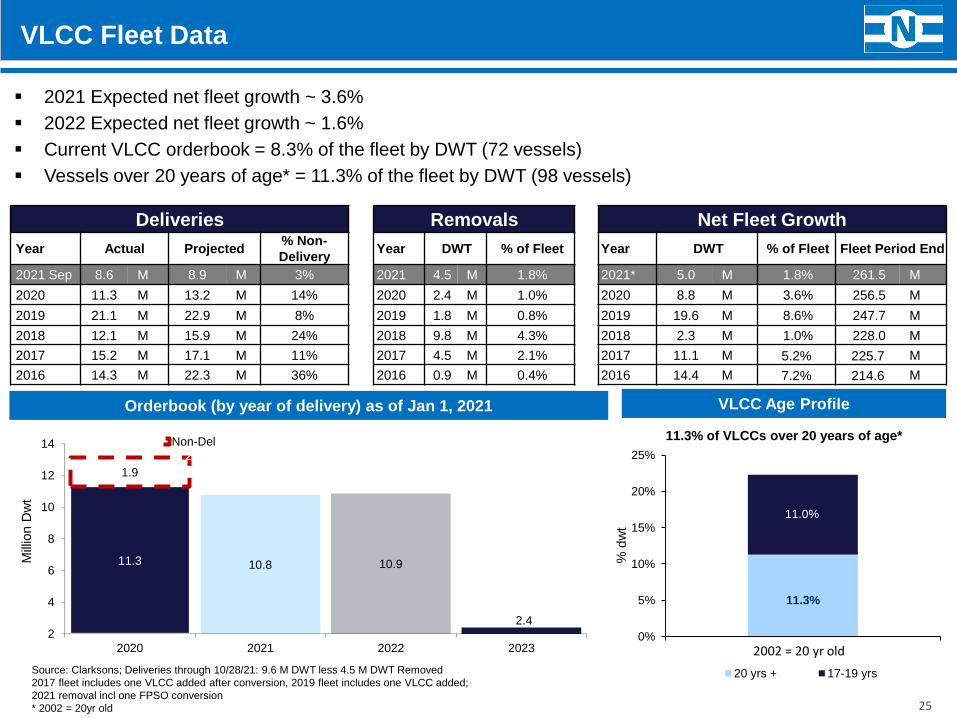
VLCC Fleet Data
Deliveries Removals Net Fleet Growth
Year Actual Projected% Non-
DeliveryYear DWT % of Fleet Year DWT % of Fleet Fleet Period End
2021 Sep 8.6 M 8.9 M 3% 2021 4.5 M 1.8% 2021* 5.0 M 1.8% 261.5 M
2020 11.3 M 13.2 M 14% 2020 2.4 M 1.0% 2020 8.8 M 3.6% 256.5 M
2019 21.1 M 22.9 M 8% 2019 1.8 M 0.8% 2019 19.6 M 8.6% 247.7 M
2018 12.1 M 15.9 M 24% 2018 9.8 M 4.3% 2018 2.3 M 1.0% 228.0 M
2017 15.2 M 17.1 M 11% 2017 4.5 M 2.1% 2017 11.1 M 5.2% 225.7 M
2016 14.3 M 22.3 M 36% 2016 0.9 M 0.4% 2016 14.4 M 7.2% 214.6 M
Source: Clarksons; Deliveries through 10/28/21: 9.6 M DWT less 4.5 M DWT Removed
2017 fleet includes one VLCC added after conversion, 2019 fleet includes one VLCC added;
2021 removal incl one FPSO conversion
* 2002 = 20yr old
11.3
1.9
10.8 10.9
2.42
4
6
8
10
12
14
2020 2021 2022 2023
Non-Del
22.322.9
Orderbook (by year of delivery) as of Jan 1, 2021
11.3%
11.0%
0%
5%
10%
15%
20%
25%
VLCC Fleet Age Profile (% DWT)
20 yrs + 17-19 yrs
VLCC Age Profile
11.3% of VLCCs over 20 years of age*
▪ 2021 Expected net fleet growth ~ 3.6%
▪ 2022 Expected net fleet growth ~ 1.6%
▪ Current VLCC orderbook = 8.3% of the fleet by DWT (72 vessels)
▪ Vessels over 20 years of age* = 11.3% of the fleet by DWT (98 vessels)
% d
wt
Mill
ion D
wt
2002 = 20 yr old
DRAFT
26
5.3
3.1
1.4 1.2
2.3
0.2
0.1 -
3.9
1.1
0.1
0.5
0
1
2
3
4
5
6
7
8
9
2020 2021 2022 2023+
7.7
12.9
10.5
2.51.2
13.9
26
Deliveries Removals Net Fleet Growth
Year Actual Projected% non-
deliveryYear DWT % of fleet Year DWT % of Fleet
Fleet period
end
2021 Sep 5.4 M 6.2 M 14% 2021* 2.5 M 1.5% 2021* 2.8 M 1.7% 174.3 M
2020 5.3 M 7.7 M 30% 2020 1.0 M 0.6% 2020 4.1 M 2.4% 171.5 M
2019 8.4 M 10.5 M 21% 2019 1.0 M 0.6% 2019 7.3 M 4.6% 167.4 M
2018 5.2 M 7.5 M 31% 2018 3.1 M 2.0% 2018 2.0 M 1.3% 160.0 M
2017 8.2 M 11.4 M 28% 2017 2.2 M 1.4% 2017 6.0 M 3.9% 158.0 M
2016 9.6 M 12.9 M 25% 2016 0.8 M 0.5% 2016 8.9 M 6.2% 152.0 M
Source: Clarksons – YTD through Sep 2021
Product tankers defined as all coated tankers above 25k dwt plus uncoated 25-85k dwt tankers
including IMO 2/3 with avg tank size > 3k cbm, excluding stainless steel and specialized tankers
* 2002 = 20 yr old
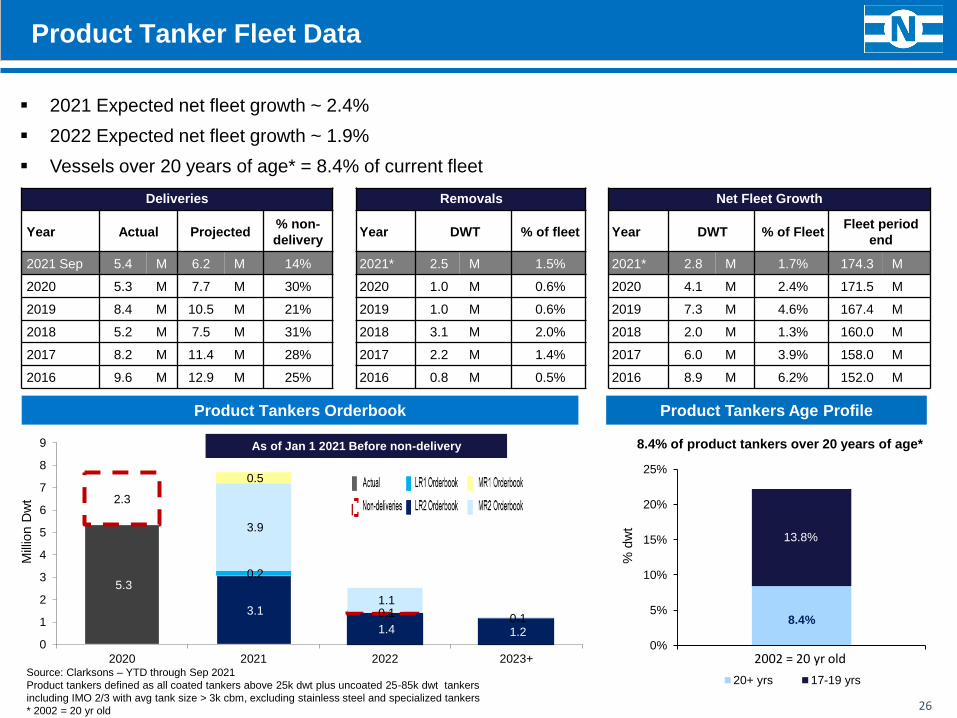
Product Tanker Fleet Data
Product Tankers Orderbook
As of Jan 1 2021 Before non-delivery
Product Tankers Age Profile
8.4%
13.8%
0%
5%
10%
15%
20%
25%
VLCC Fleet Age Profile (% DWT)
20+ yrs 17-19 yrs
8.4% of product tankers over 20 years of age*
▪ 2021 Expected net fleet growth ~ 2.4%
▪ 2022 Expected net fleet growth ~ 1.9%
▪ Vessels over 20 years of age* = 8.4% of current fleet
% d
wt
Mill
ion D
wt
2002 = 20 yr old
Navios Maritime Containers L.P.
www.navios-mlp.com
20
27
Top Related