


Languages
Pages
Legal

2015
A National Poll of Americans
Saint Leo University Polling Institute
December 2015
National Politics, Terrorism, and Florida Politics (Release Set 1 of 2)
Saint Leo University Polling Institute Page 2
Statement of Confidentiality and Ownership
All of the analyses, findings and recommendations contained within this report are the exclusive property of the Saint Leo University Polling Institute.
As required by the Code of Ethics of the National Council on Public Polls and the United States Privacy Act of 1974, the Saint Leo University Polling Institute maintains the anonymity of respondents to surveys the Institute conducts. No information will be released that might, in any way, reveal the identity of the respondent.
Moreover, no information regarding these findings will be released without the written consent of an authorized representative of the Saint Leo University Polling Institute.
Saint Leo University Polling Institute Page 3
1 2
3
4
5
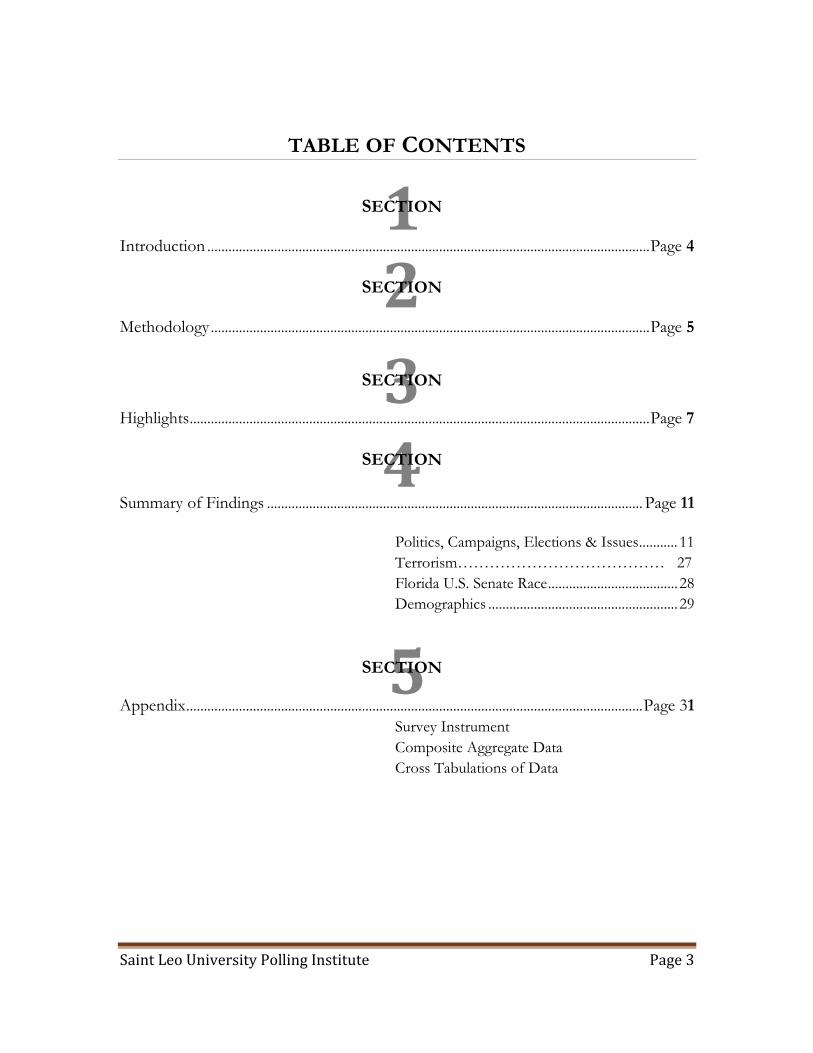
TABLE OF CONTENTS
SECTION
Introduction .............................................................................................................................. Page 4
SECTION
Methodology ............................................................................................................................. Page 5
SECTION
Highlights ................................................................................................................................... Page 7
SECTION
Summary of Findings ........................................................................................................... Page 11
Politics, Campaigns, Elections & Issues ........... 11
Terrorism………………………………… 27
Florida U.S. Senate Race ..................................... 28
Demographics ...................................................... 29
SECTION
Appendix .................................................................................................................................. Page 31
Survey Instrument
Composite Aggregate Data
Cross Tabulations of Data
Saint Leo University Polling Institute Page 4
1
INTRODUCTION The Saint Leo University Polling Institute is pleased to present the results of a national poll of Americans. The poll was designed to assess public views regarding the 2016 presidential election, issues of concern, impressions of Pope Francis, views and opinions on terrorism, awareness of and views or interest in unmanned aerial mechanisms (drones). The research study included survey responses from 1007 respondents nationally and 531 within Florida approximately proportional to state population contribution. The poll was conducted November 29 – December 3, 2015. A pre-test occurred on November 28, 2105. The national poll included the following areas for investigation:
Job approval rating for President Obama;
Current issues of importance to Americans;
Favorable ratings of presidential candidates;
Presidential preferences for 2016;
Views / opinions on terrorism;
Awareness of unmanned aerial mechanisms/drones( in Release 2);
Concerns about, and interest, in owning drones (in Release 2);
Charitable giving (in Release 2);
Spending level for pets on holiday gifts (in Release 2);
Impact of Pope Francis on giving (in Release 2);
Degree religion influences everyday decision making (in Release 2); and,
Demographics. Section II of this report discusses the Methodology used in the study, while Section III includes Highlights derived from an analysis of the quantitative research. Section IV is a Summary of Findings from the online survey. Section V is an Appendix to the report containing the composite aggregate data, cross tabulations and the survey instrument employed.
Saint Leo University Polling Institute Page 5
2 METHODOLOGY Using a quantitative research design, the Saint Leo University Polling Institute completed 1007 online surveys nationally and 531 among Florida residents. Survey design input was provided by the membership of the Polling Institute Committee. Survey design is a careful, deliberative process to ensure fair, objective and balanced surveys. Staff members, with years of survey design experience, edit out any bias. Further, all scales used by the Institute (either numeric, such as one through ten, or wording such as strongly agree, somewhat agree, somewhat disagree, or strongly agree) are balanced evenly. Additionally, placement of questions is carefully accomplished so that order has minimal impact. This survey was conducted November 29 – December 3, 2015. Respondents qualified for the survey if they were a resident of the United States and 18 years of age or older. Responses were approximately proportional to each state’s population. All facets of the study were completed by the Polling Institute’s senior staff and researchers. These aspects include: survey design, pre-test, computer programming, fielding, coding, editing, verification, validation and logic checks, computer analysis, analysis, and report writing. Statistically, a sample of 1007 completed surveys has an associated margin for error of +/- 3.0% at a 95% confidence level. A sample of 531 Florida respondents has an associated margin for error of 4.5% at a 95% confidence level. Results throughout this report are presented for composite results – all 1007 cases. Throughout, composite results are presented side-by-side with Florida specific results. On political candidate preferences and on current issues, columns of data also hold results of just likely voters – those indicating they vote either all the time or most of the time in elections.
Saint Leo University Polling Institute Page 6
Readers of this report should note that any survey is analogous to a snapshot in time and results are only reflective of the time period in which the survey was undertaken. Should concerted public relations or information campaigns be undertaken during or shortly after the fielding of the survey, the results contained herein may be expected to change and should be, therefore, carefully interpreted and extrapolated. Furthermore, it is important to note that all surveys contain some component of “sampling error”. Error that is attributable to systematic bias has been significantly reduced by utilizing strict random probability procedures. This sample was strictly random in that selection of each potential respondent was an independent event based on known probabilities. Each qualified online panel member within the United States had an equal chance for participating in the study. Statistical random error, however, can never be eliminated but may be significantly reduced by increasing sample size.
Saint Leo University Polling Institute Page 7
3 HIGHLIGHTS
ON POLITICS, CAMPAIGNS, ELECTIONS AND ISSUES…
President Barack Obama’s job approval rating moved down slightly to 48.2% in the current polling from 50.0% in October 2015 and up slightly from 47.0% in June, 2015. Disapproval increased to 48.0% from 46.8% in October. Jobs and the economy remained the single most important issue named by poll respondents (25.8%). Other issues of importance, in declining order, included: terrorism (16.9%), homeland security and anti-terror policy (15.1%), healthcare (9.2%) and government spending and the federal deficit (6.5%). Importantly, terrorism overall has become the nation’s leading issue (32.0%) when “terrorism” at 16.9% is combined with those naming “homeland security and anti-terror policy” at 15.1%. This combined percentage more than tripled from 10.1% just two months ago. Other issues mentioned less frequently included: immigration, education, global climate change, gun violence, and declining U.S. status worldwide. Leading Republican candidates Donald Trump, Marco Rubio, Jeb Bush, and Ted Cruz have gained support among likely voters since the October Saint Leo University Poll. Ben Carson’s support has declined. Current leaders are: Trump (29.1%), Ben Carson (13.6%), Marco Rubio (11.4%), Jeb Bush (10.5%) and Ted Cruz (9.1%). Among Democratic likely voters nationwide, the current leading candidates are: Hillary Clinton (58.9% - up from 54.8% in October 2015), Bernie Sanders (23.7% - up from 12.0% in October 2015) and Martin O’Malley (8.1% - up from 6.9% in October 2015). The October poll included Vice President Joe Biden who garnered 15.8%.
Saint Leo University Polling Institute Page 8
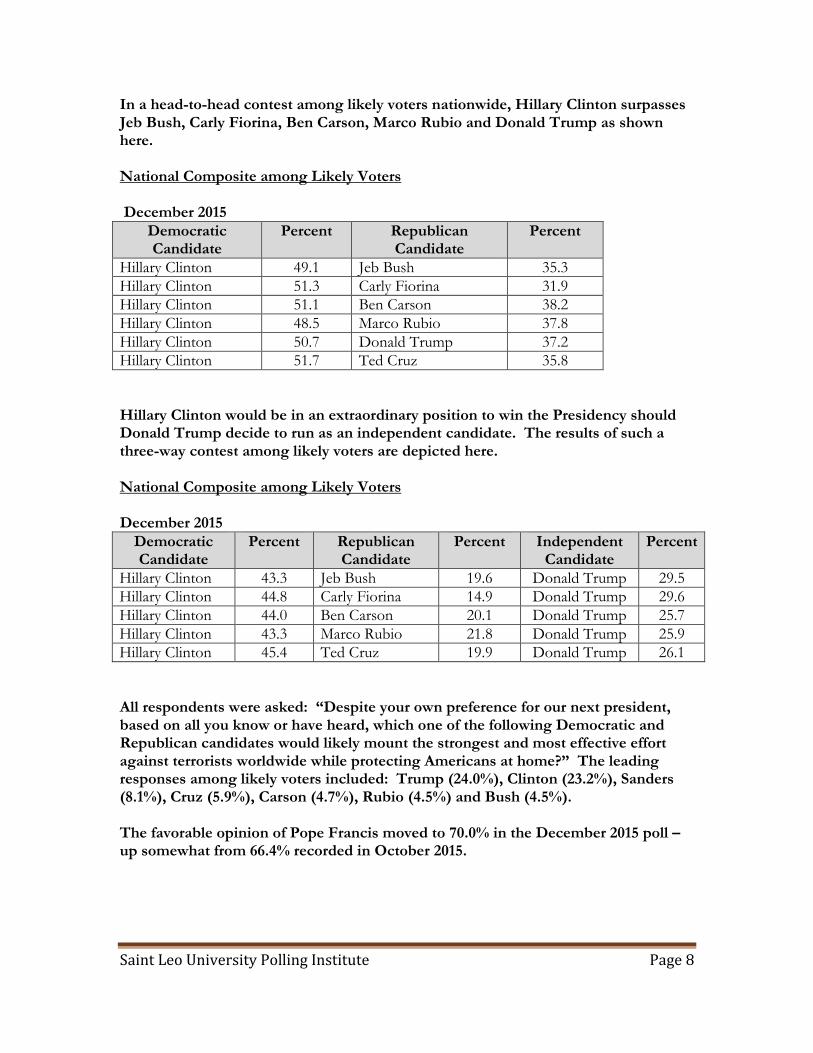
In a head-to-head contest among likely voters nationwide, Hillary Clinton surpasses Jeb Bush, Carly Fiorina, Ben Carson, Marco Rubio and Donald Trump as shown here. National Composite among Likely Voters December 2015
Democratic Candidate
Percent Republican Candidate
Percent
Hillary Clinton 49.1 Jeb Bush 35.3
Hillary Clinton 51.3 Carly Fiorina 31.9
Hillary Clinton 51.1 Ben Carson 38.2
Hillary Clinton 48.5 Marco Rubio 37.8
Hillary Clinton 50.7 Donald Trump 37.2
Hillary Clinton 51.7 Ted Cruz 35.8
Hillary Clinton would be in an extraordinary position to win the Presidency should Donald Trump decide to run as an independent candidate. The results of such a three-way contest among likely voters are depicted here. National Composite among Likely Voters December 2015
Democratic Candidate
Percent Republican Candidate
Percent Independent Candidate
Percent
Hillary Clinton 43.3 Jeb Bush 19.6 Donald Trump 29.5
Hillary Clinton 44.8 Carly Fiorina 14.9 Donald Trump 29.6
Hillary Clinton 44.0 Ben Carson 20.1 Donald Trump 25.7
Hillary Clinton 43.3 Marco Rubio 21.8 Donald Trump 25.9
Hillary Clinton 45.4 Ted Cruz 19.9 Donald Trump 26.1
All respondents were asked: “Despite your own preference for our next president, based on all you know or have heard, which one of the following Democratic and Republican candidates would likely mount the strongest and most effective effort against terrorists worldwide while protecting Americans at home?” The leading responses among likely voters included: Trump (24.0%), Clinton (23.2%), Sanders (8.1%), Cruz (5.9%), Carson (4.7%), Rubio (4.5%) and Bush (4.5%). The favorable opinion of Pope Francis moved to 70.0% in the December 2015 poll – up somewhat from 66.4% recorded in October 2015.
Saint Leo University Polling Institute Page 9
ON TERRORISM…
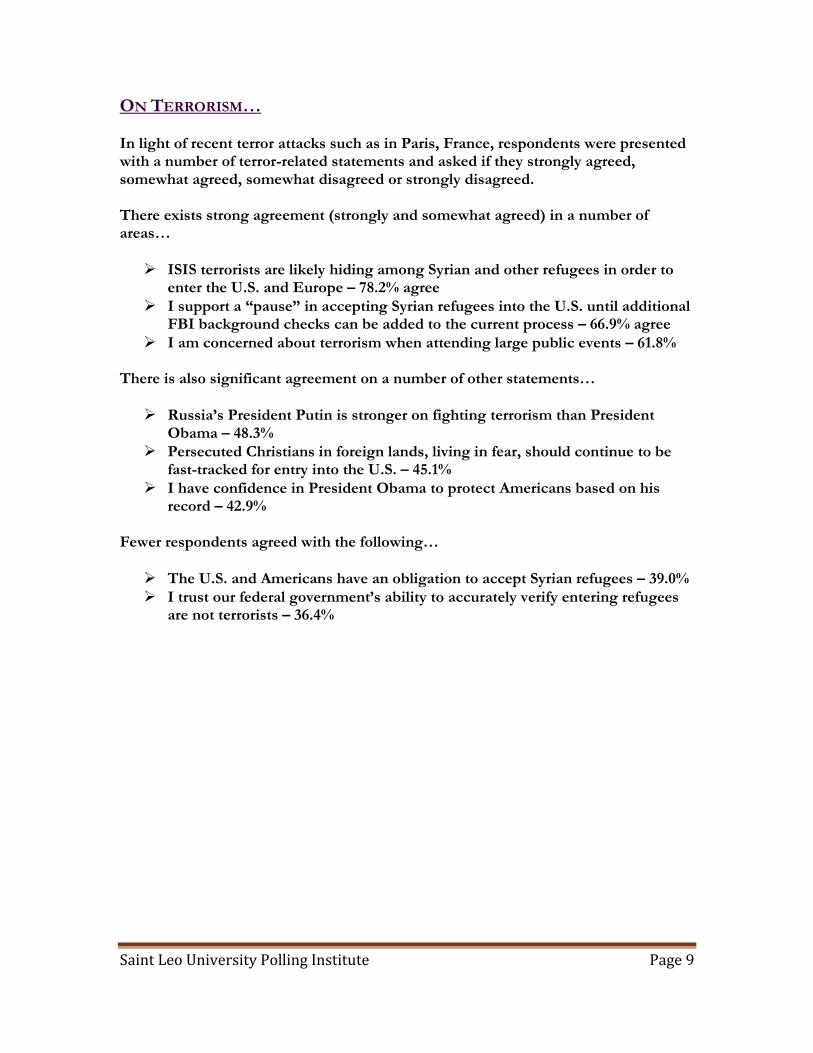
In light of recent terror attacks such as in Paris, France, respondents were presented with a number of terror-related statements and asked if they strongly agreed, somewhat agreed, somewhat disagreed or strongly disagreed. There exists strong agreement (strongly and somewhat agreed) in a number of areas…
ISIS terrorists are likely hiding among Syrian and other refugees in order to enter the U.S. and Europe – 78.2% agree
I support a “pause” in accepting Syrian refugees into the U.S. until additional FBI background checks can be added to the current process – 66.9% agree
I am concerned about terrorism when attending large public events – 61.8% There is also significant agreement on a number of other statements…
Russia’s President Putin is stronger on fighting terrorism than President Obama – 48.3%
Persecuted Christians in foreign lands, living in fear, should continue to be fast-tracked for entry into the U.S. – 45.1%
I have confidence in President Obama to protect Americans based on his record – 42.9%
Fewer respondents agreed with the following…
The U.S. and Americans have an obligation to accept Syrian refugees – 39.0%
I trust our federal government’s ability to accurately verify entering refugees are not terrorists – 36.4%
Saint Leo University Polling Institute Page 10
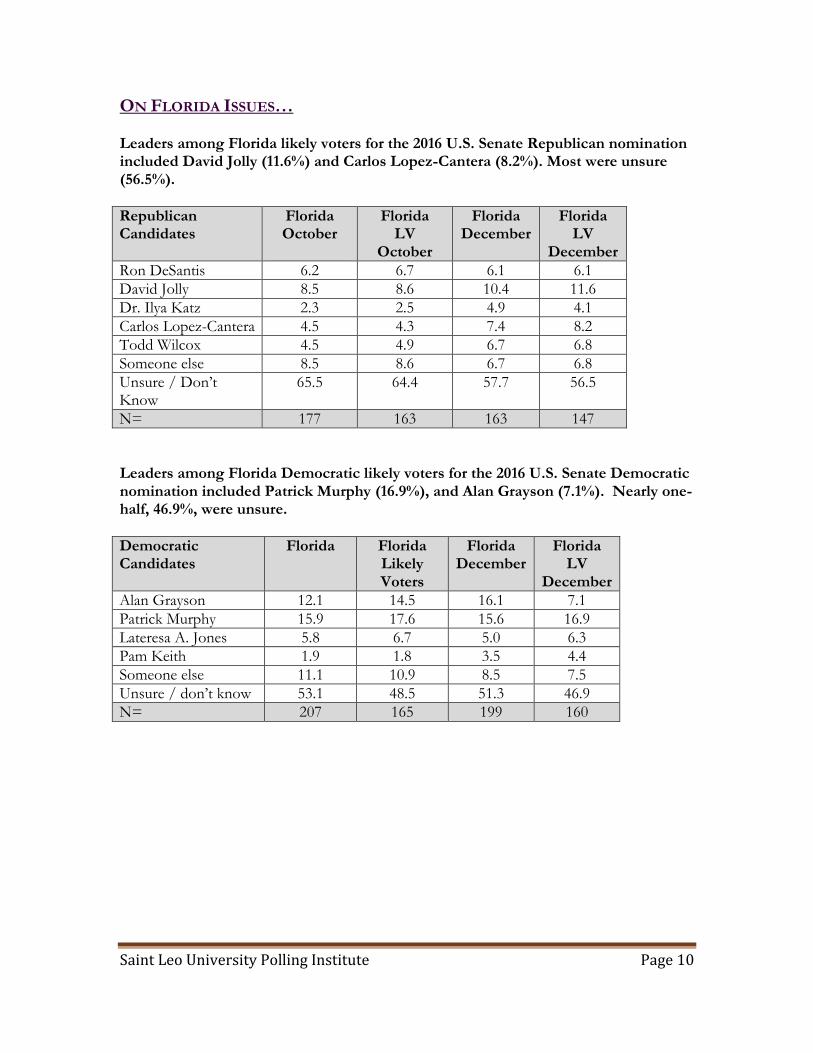
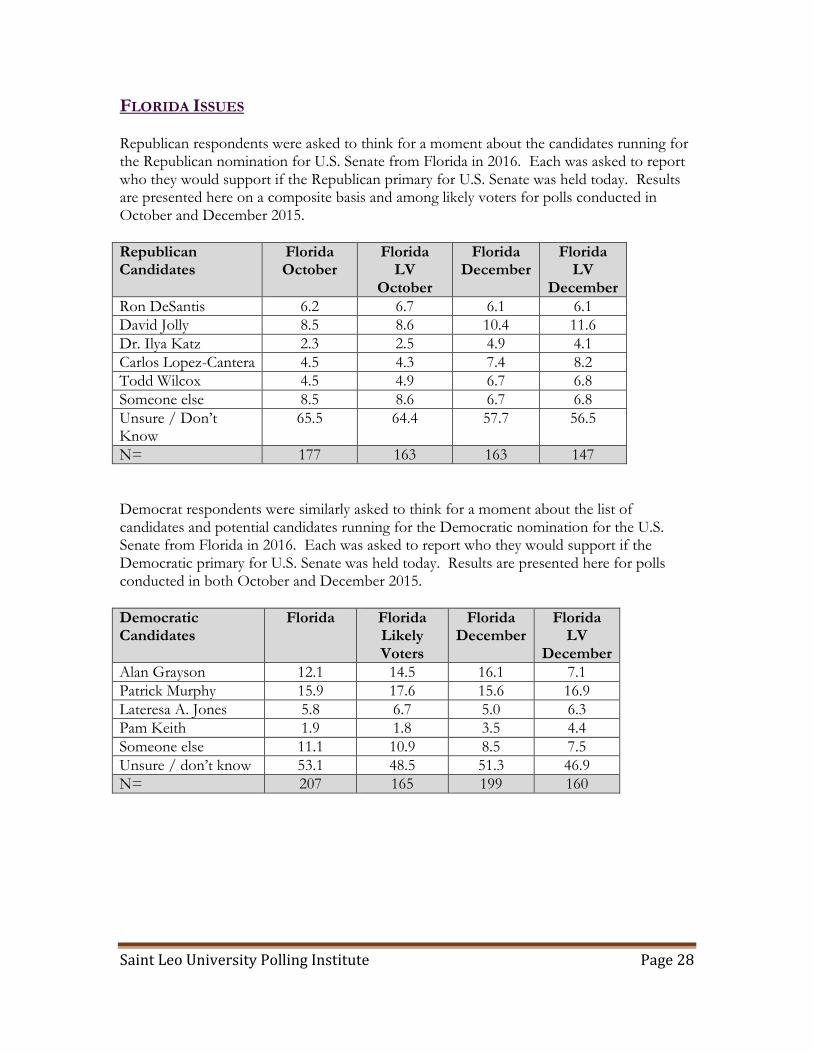
ON FLORIDA ISSUES… Leaders among Florida likely voters for the 2016 U.S. Senate Republican nomination included David Jolly (11.6%) and Carlos Lopez-Cantera (8.2%). Most were unsure (56.5%).
Republican Candidates
Florida October
Florida LV
October
Florida December
Florida LV
December
Ron DeSantis 6.2 6.7 6.1 6.1
David Jolly 8.5 8.6 10.4 11.6
Dr. Ilya Katz 2.3 2.5 4.9 4.1
Carlos Lopez-Cantera 4.5 4.3 7.4 8.2
Todd Wilcox 4.5 4.9 6.7 6.8
Someone else 8.5 8.6 6.7 6.8
Unsure / Don’t Know
65.5 64.4 57.7 56.5
N= 177 163 163 147
Leaders among Florida Democratic likely voters for the 2016 U.S. Senate Democratic nomination included Patrick Murphy (16.9%), and Alan Grayson (7.1%). Nearly one-half, 46.9%, were unsure.
Democratic Candidates
Florida Florida Likely Voters
Florida December
Florida LV
December
Alan Grayson 12.1 14.5 16.1 7.1
Patrick Murphy 15.9 17.6 15.6 16.9
Lateresa A. Jones 5.8 6.7 5.0 6.3
Pam Keith 1.9 1.8 3.5 4.4
Someone else 11.1 10.9 8.5 7.5
Unsure / don’t know 53.1 48.5 51.3 46.9
N= 207 165 199 160
Saint Leo University Polling Institute Page 11
4
SUMMARY OF FINDINGS
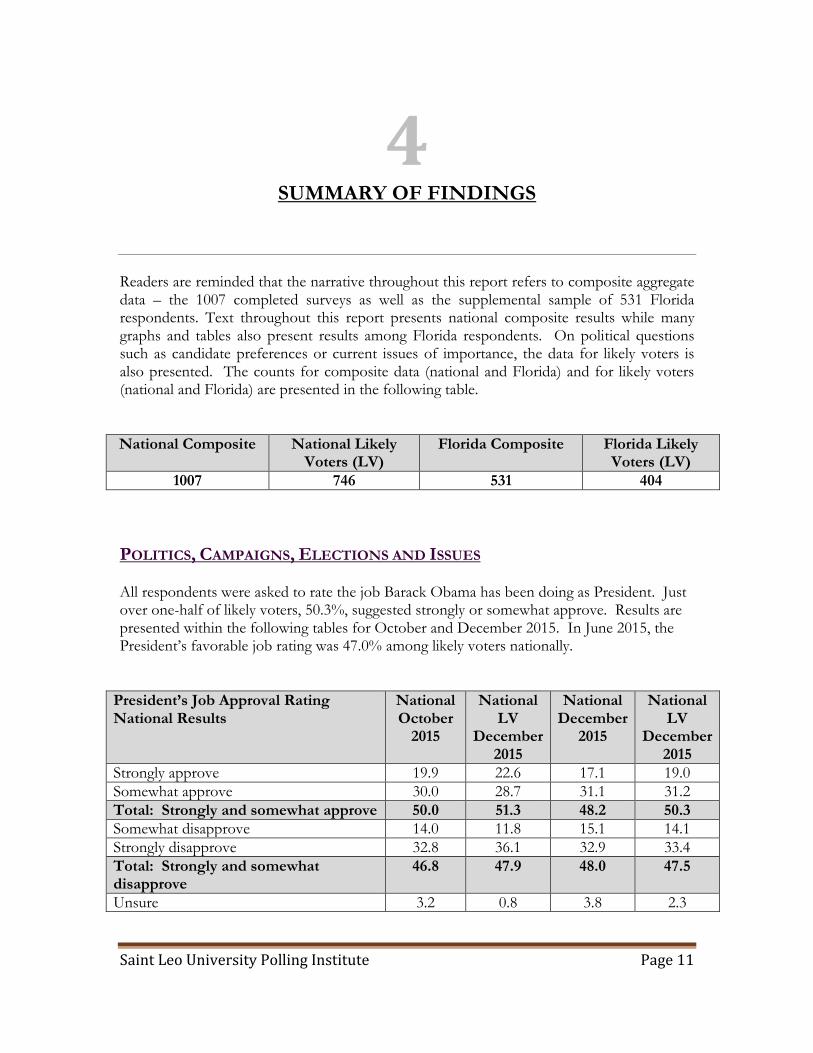
Readers are reminded that the narrative throughout this report refers to composite aggregate data – the 1007 completed surveys as well as the supplemental sample of 531 Florida respondents. Text throughout this report presents national composite results while many graphs and tables also present results among Florida respondents. On political questions such as candidate preferences or current issues of importance, the data for likely voters is also presented. The counts for composite data (national and Florida) and for likely voters (national and Florida) are presented in the following table.
National Composite National Likely Voters (LV)
Florida Composite Florida Likely Voters (LV)
1007 746 531 404
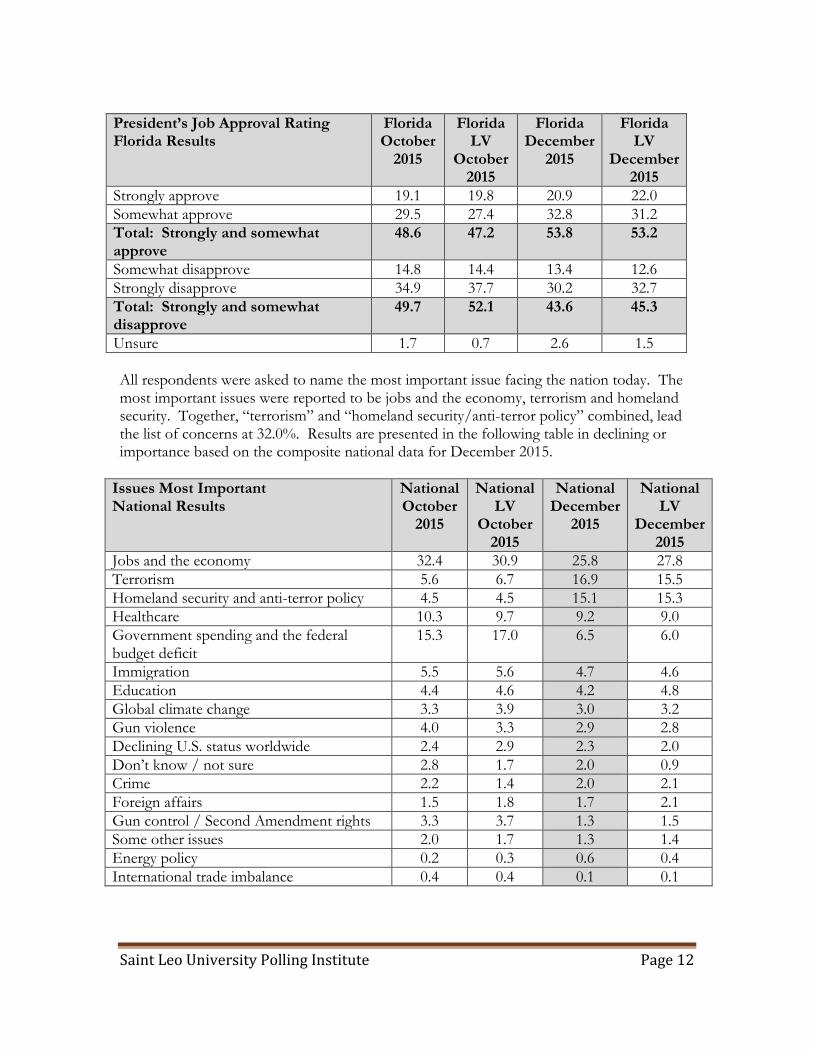
POLITICS, CAMPAIGNS, ELECTIONS AND ISSUES All respondents were asked to rate the job Barack Obama has been doing as President. Just over one-half of likely voters, 50.3%, suggested strongly or somewhat approve. Results are presented within the following tables for October and December 2015. In June 2015, the President’s favorable job rating was 47.0% among likely voters nationally.
President’s Job Approval Rating National Results
National October
2015
National LV
December 2015
National December
2015
National LV
December 2015
Strongly approve 19.9 22.6 17.1 19.0
Somewhat approve 30.0 28.7 31.1 31.2
Total: Strongly and somewhat approve 50.0 51.3 48.2 50.3
Somewhat disapprove 14.0 11.8 15.1 14.1
Strongly disapprove 32.8 36.1 32.9 33.4
Total: Strongly and somewhat disapprove
46.8 47.9 48.0 47.5
Unsure 3.2 0.8 3.8 2.3
Saint Leo University Polling Institute Page 12
President’s Job Approval Rating Florida Results
Florida October
2015
Florida LV
October 2015
Florida December
2015
Florida LV
December 2015
Strongly approve 19.1 19.8 20.9 22.0
Somewhat approve 29.5 27.4 32.8 31.2
Total: Strongly and somewhat approve
48.6 47.2 53.8 53.2
Somewhat disapprove 14.8 14.4 13.4 12.6
Strongly disapprove 34.9 37.7 30.2 32.7
Total: Strongly and somewhat disapprove
49.7 52.1 43.6 45.3
Unsure 1.7 0.7 2.6 1.5
All respondents were asked to name the most important issue facing the nation today. The most important issues were reported to be jobs and the economy, terrorism and homeland security. Together, “terrorism” and “homeland security/anti-terror policy” combined, lead the list of concerns at 32.0%. Results are presented in the following table in declining or importance based on the composite national data for December 2015.
Issues Most Important National Results
National October
2015
National LV
October 2015
National December
2015
National LV
December 2015
Jobs and the economy 32.4 30.9 25.8 27.8
Terrorism 5.6 6.7 16.9 15.5
Homeland security and anti-terror policy 4.5 4.5 15.1 15.3
Healthcare 10.3 9.7 9.2 9.0
Government spending and the federal budget deficit
15.3 17.0 6.5 6.0
Immigration 5.5 5.6 4.7 4.6
Education 4.4 4.6 4.2 4.8
Global climate change 3.3 3.9 3.0 3.2
Gun violence 4.0 3.3 2.9 2.8
Declining U.S. status worldwide 2.4 2.9 2.3 2.0
Don’t know / not sure 2.8 1.7 2.0 0.9
Crime 2.2 1.4 2.0 2.1
Foreign affairs 1.5 1.8 1.7 2.1
Gun control / Second Amendment rights 3.3 3.7 1.3 1.5
Some other issues 2.0 1.7 1.3 1.4
Energy policy 0.2 0.3 0.6 0.4
International trade imbalance 0.4 0.4 0.1 0.1
Saint Leo University Polling Institute Page 13
Issues Most Important Florida Results
Florida October
2015
Florida LV
October 2015
Florida December
2015
Florida LV
December 2015
Jobs and the economy 30.9 27.4 24.0 24.5
Terrorism 3.7 3.9 16.0 16.0
Homeland security and anti-terror policy 6.9 8.1 13.8 15.6
Healthcare 12.1 11.7 10.6 10.6
Government spending and the federal budget deficit
12.3 13.4 7.5 8.2
Immigration 7.5 8.6 5.1 5.9
Education 3.8 4.2 5.1 4.7
Gun violence 5.4 5.1 2.8 2.2
Global climate change 3.3 3.7 2.8 3.2
Crime 2.5 1.5 2.3 1.5
Some other issues 2.1 2.4 2.1 1.0
Don’t know / not sure 1.7 1.2 1.9 0.7
Declining U.S. status worldwide 4.4 5.1 1.9 1.7
Foreign affairs 0.6 0.7 1.9 2.0
Gun control / Second Amendment rights 2.9 2.9 1.5 1.2
Energy policy 0.2 0.0 0.4 0.5
International trade imbalance 0.0 0.0 0.0 0.0
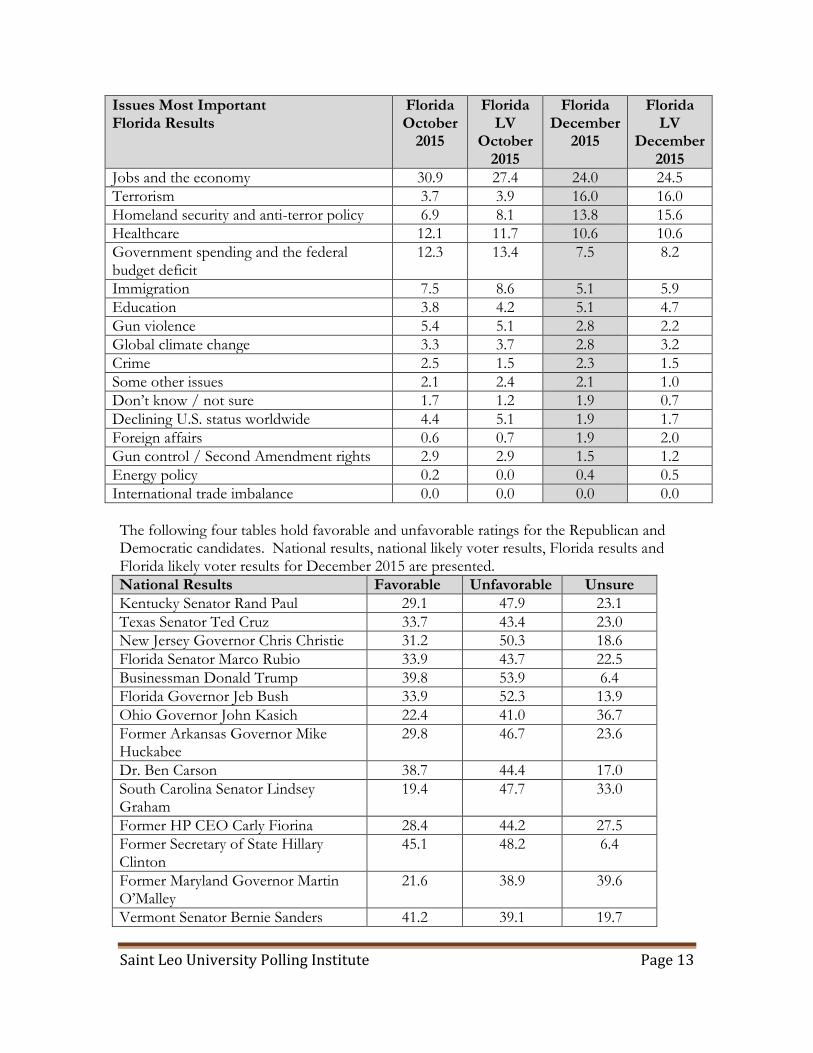
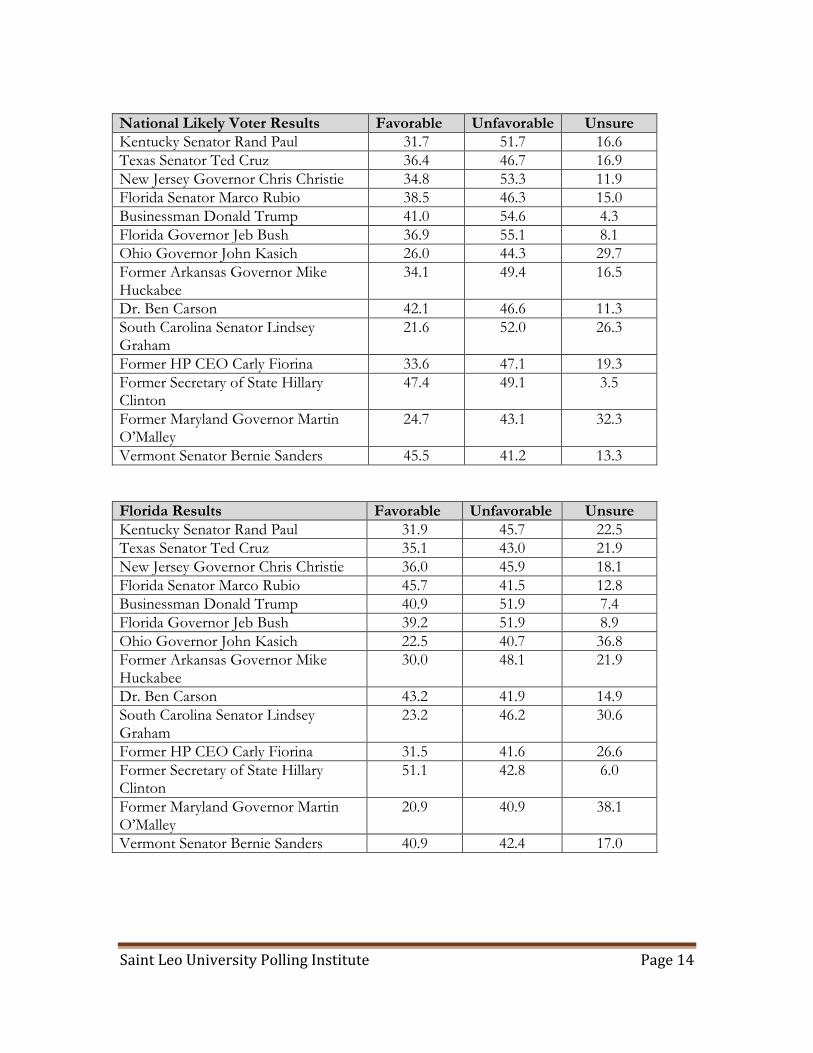
The following four tables hold favorable and unfavorable ratings for the Republican and Democratic candidates. National results, national likely voter results, Florida results and Florida likely voter results for December 2015 are presented.
National Results Favorable Unfavorable Unsure
Kentucky Senator Rand Paul 29.1 47.9 23.1
Texas Senator Ted Cruz 33.7 43.4 23.0
New Jersey Governor Chris Christie 31.2 50.3 18.6
Florida Senator Marco Rubio 33.9 43.7 22.5
Businessman Donald Trump 39.8 53.9 6.4
Florida Governor Jeb Bush 33.9 52.3 13.9
Ohio Governor John Kasich 22.4 41.0 36.7
Former Arkansas Governor Mike Huckabee
29.8 46.7 23.6
Dr. Ben Carson 38.7 44.4 17.0
South Carolina Senator Lindsey Graham
19.4 47.7 33.0
Former HP CEO Carly Fiorina 28.4 44.2 27.5
Former Secretary of State Hillary Clinton
45.1 48.2 6.4
Former Maryland Governor Martin O’Malley
21.6 38.9 39.6
Vermont Senator Bernie Sanders 41.2 39.1 19.7
Saint Leo University Polling Institute Page 14
National Likely Voter Results Favorable Unfavorable Unsure
Kentucky Senator Rand Paul 31.7 51.7 16.6
Texas Senator Ted Cruz 36.4 46.7 16.9
New Jersey Governor Chris Christie 34.8 53.3 11.9
Florida Senator Marco Rubio 38.5 46.3 15.0
Businessman Donald Trump 41.0 54.6 4.3
Florida Governor Jeb Bush 36.9 55.1 8.1
Ohio Governor John Kasich 26.0 44.3 29.7
Former Arkansas Governor Mike Huckabee
34.1 49.4 16.5
Dr. Ben Carson 42.1 46.6 11.3
South Carolina Senator Lindsey Graham
21.6 52.0 26.3
Former HP CEO Carly Fiorina 33.6 47.1 19.3
Former Secretary of State Hillary Clinton
47.4 49.1 3.5
Former Maryland Governor Martin O’Malley
24.7 43.1 32.3
Vermont Senator Bernie Sanders 45.5 41.2 13.3
Florida Results Favorable Unfavorable Unsure
Kentucky Senator Rand Paul 31.9 45.7 22.5
Texas Senator Ted Cruz 35.1 43.0 21.9
New Jersey Governor Chris Christie 36.0 45.9 18.1
Florida Senator Marco Rubio 45.7 41.5 12.8
Businessman Donald Trump 40.9 51.9 7.4
Florida Governor Jeb Bush 39.2 51.9 8.9
Ohio Governor John Kasich 22.5 40.7 36.8
Former Arkansas Governor Mike Huckabee
30.0 48.1 21.9
Dr. Ben Carson 43.2 41.9 14.9
South Carolina Senator Lindsey Graham
23.2 46.2 30.6
Former HP CEO Carly Fiorina 31.5 41.6 26.6
Former Secretary of State Hillary Clinton
51.1 42.8 6.0
Former Maryland Governor Martin O’Malley
20.9 40.9 38.1
Vermont Senator Bernie Sanders 40.9 42.4 17.0
Saint Leo University Polling Institute Page 15
Florida Likely Voter Results Favorable Unfavorable Unsure
Kentucky Senator Rand Paul 36.4 48.6 15.1
Texas Senator Ted Cruz 38.6 45.3 16.1
New Jersey Governor Chris Christie 39.9 49.3 10.9
Florida Senator Marco Rubio 50.7 44.6 4.7
Businessman Donald Trump 45.5 52.0 2.5
Florida Governor Jeb Bush 44.3 52.5 3.2
Ohio Governor John Kasich 25.2 45.3 29.5
Former Arkansas Governor Mike Huckabee
34.4 51.7 14.1
Dr. Ben Carson 46.0 44.6 9.4
South Carolina Senator Lindsey Graham
25.2 50.3 24.5
Former HP CEO Carly Fiorina 34.9 44.1 21.0
Former Secretary of State Hillary Clinton
53.2 45.0 1.7
Former Maryland Governor Martin O’Malley
23.8 44.3 31.9
Vermont Senator Bernie Sanders 42.8 45.8 11.4
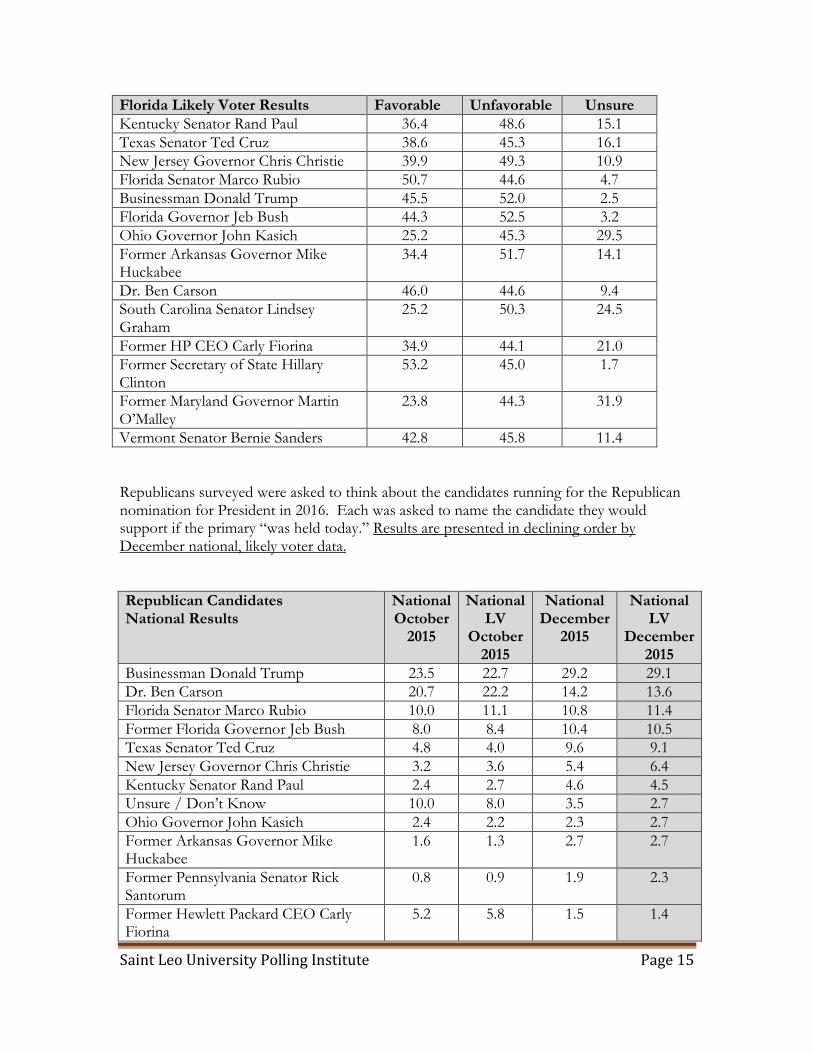
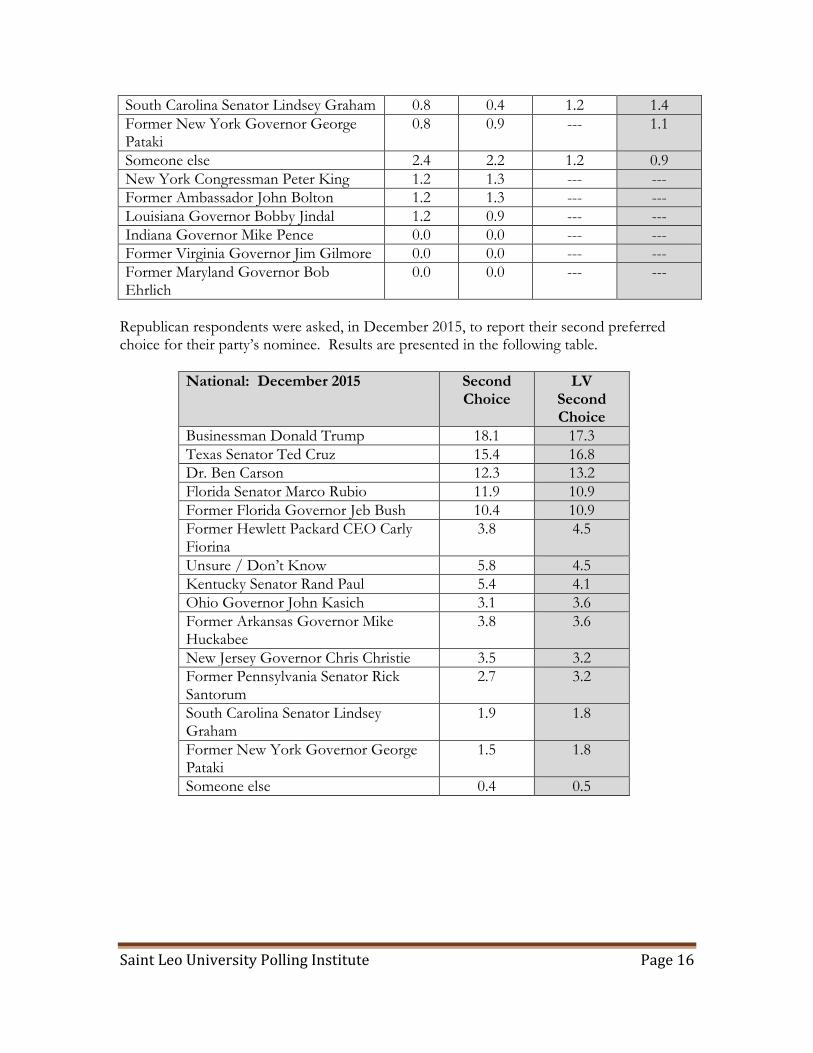
Republicans surveyed were asked to think about the candidates running for the Republican nomination for President in 2016. Each was asked to name the candidate they would support if the primary “was held today.” Results are presented in declining order by December national, likely voter data.
Republican Candidates National Results
National October
2015
National LV
October 2015
National December
2015
National LV
December 2015
Businessman Donald Trump 23.5 22.7 29.2 29.1
Dr. Ben Carson 20.7 22.2 14.2 13.6
Florida Senator Marco Rubio 10.0 11.1 10.8 11.4
Former Florida Governor Jeb Bush 8.0 8.4 10.4 10.5
Texas Senator Ted Cruz 4.8 4.0 9.6 9.1
New Jersey Governor Chris Christie 3.2 3.6 5.4 6.4
Kentucky Senator Rand Paul 2.4 2.7 4.6 4.5
Unsure / Don’t Know 10.0 8.0 3.5 2.7
Ohio Governor John Kasich 2.4 2.2 2.3 2.7
Former Arkansas Governor Mike Huckabee
1.6 1.3 2.7 2.7
Former Pennsylvania Senator Rick Santorum
0.8 0.9 1.9 2.3
Former Hewlett Packard CEO Carly Fiorina
5.2 5.8 1.5 1.4
Saint Leo University Polling Institute Page 16
South Carolina Senator Lindsey Graham 0.8 0.4 1.2 1.4
Former New York Governor George Pataki
0.8 0.9 --- 1.1
Someone else 2.4 2.2 1.2 0.9
New York Congressman Peter King 1.2 1.3 --- ---
Former Ambassador John Bolton 1.2 1.3 --- ---
Louisiana Governor Bobby Jindal 1.2 0.9 --- ---
Indiana Governor Mike Pence 0.0 0.0 --- ---
Former Virginia Governor Jim Gilmore 0.0 0.0 --- ---
Former Maryland Governor Bob Ehrlich
0.0 0.0 --- ---
Republican respondents were asked, in December 2015, to report their second preferred choice for their party’s nominee. Results are presented in the following table.
National: December 2015 Second Choice
LV Second Choice
Businessman Donald Trump 18.1 17.3
Texas Senator Ted Cruz 15.4 16.8
Dr. Ben Carson 12.3 13.2
Florida Senator Marco Rubio 11.9 10.9
Former Florida Governor Jeb Bush 10.4 10.9
Former Hewlett Packard CEO Carly Fiorina
3.8 4.5
Unsure / Don’t Know 5.8 4.5
Kentucky Senator Rand Paul 5.4 4.1
Ohio Governor John Kasich 3.1 3.6
Former Arkansas Governor Mike Huckabee
3.8 3.6
New Jersey Governor Chris Christie 3.5 3.2
Former Pennsylvania Senator Rick Santorum
2.7 3.2
South Carolina Senator Lindsey Graham
1.9 1.8
Former New York Governor George Pataki
1.5 1.8
Someone else 0.4 0.5
Saint Leo University Polling Institute Page 17
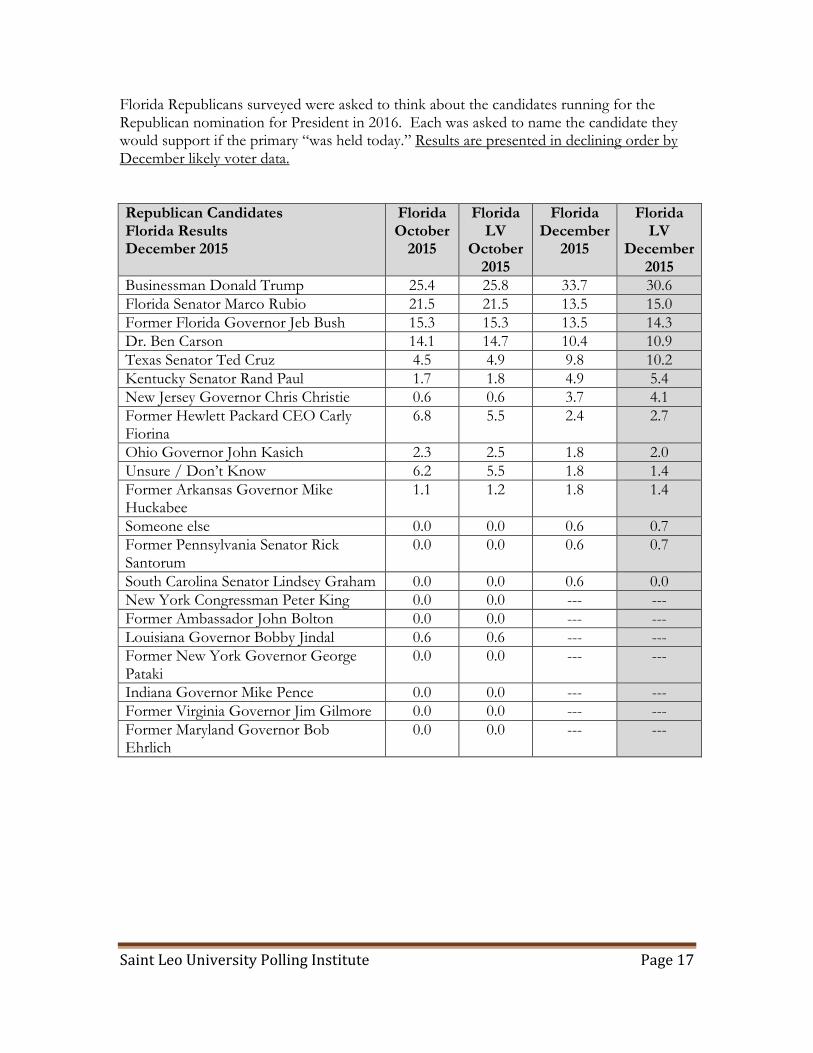
Florida Republicans surveyed were asked to think about the candidates running for the Republican nomination for President in 2016. Each was asked to name the candidate they would support if the primary “was held today.” Results are presented in declining order by December likely voter data.
Republican Candidates Florida Results December 2015
Florida October
2015
Florida LV
October 2015
Florida December
2015
Florida LV
December 2015
Businessman Donald Trump 25.4 25.8 33.7 30.6
Florida Senator Marco Rubio 21.5 21.5 13.5 15.0
Former Florida Governor Jeb Bush 15.3 15.3 13.5 14.3
Dr. Ben Carson 14.1 14.7 10.4 10.9
Texas Senator Ted Cruz 4.5 4.9 9.8 10.2
Kentucky Senator Rand Paul 1.7 1.8 4.9 5.4
New Jersey Governor Chris Christie 0.6 0.6 3.7 4.1
Former Hewlett Packard CEO Carly Fiorina
6.8 5.5 2.4 2.7
Ohio Governor John Kasich 2.3 2.5 1.8 2.0
Unsure / Don’t Know 6.2 5.5 1.8 1.4
Former Arkansas Governor Mike Huckabee
1.1 1.2 1.8 1.4
Someone else 0.0 0.0 0.6 0.7
Former Pennsylvania Senator Rick Santorum
0.0 0.0 0.6 0.7
South Carolina Senator Lindsey Graham 0.0 0.0 0.6 0.0
New York Congressman Peter King 0.0 0.0 --- ---
Former Ambassador John Bolton 0.0 0.0 --- ---
Louisiana Governor Bobby Jindal 0.6 0.6 --- ---
Former New York Governor George Pataki
0.0 0.0 --- ---
Indiana Governor Mike Pence 0.0 0.0 --- ---
Former Virginia Governor Jim Gilmore 0.0 0.0 --- ---
Former Maryland Governor Bob Ehrlich
0.0 0.0 --- ---
Saint Leo University Polling Institute Page 18
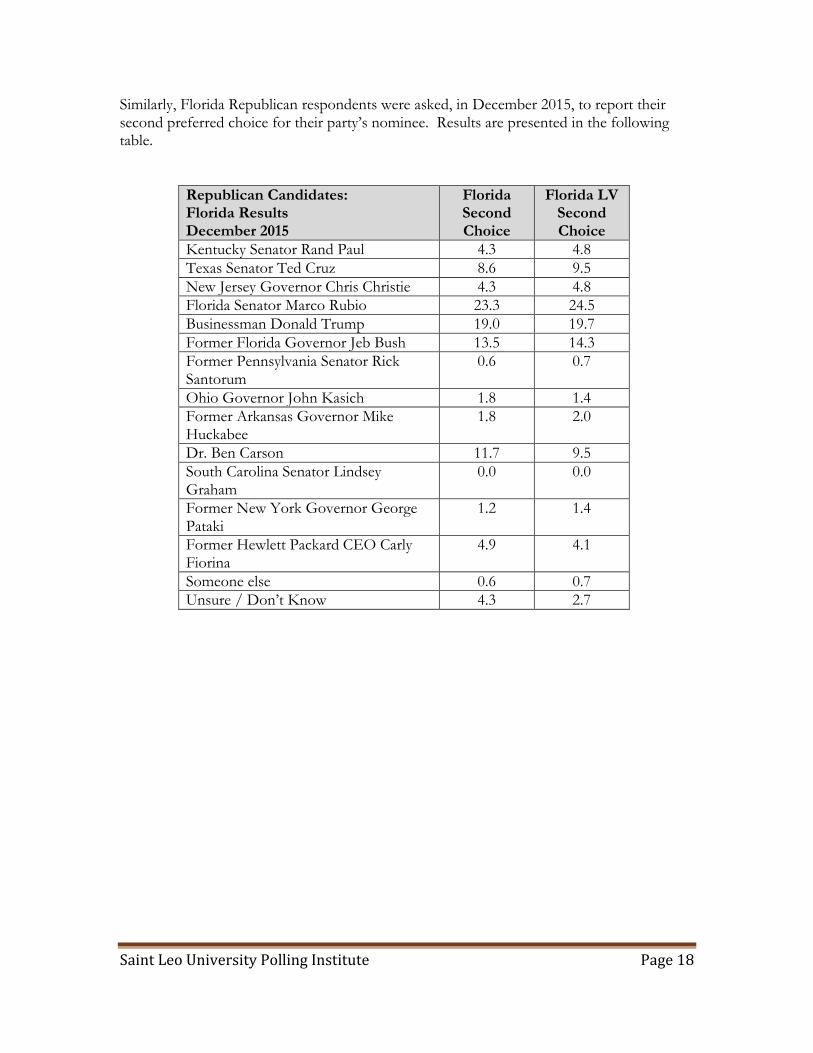
Similarly, Florida Republican respondents were asked, in December 2015, to report their second preferred choice for their party’s nominee. Results are presented in the following table.
Republican Candidates: Florida Results December 2015
Florida Second Choice
Florida LV Second Choice
Kentucky Senator Rand Paul 4.3 4.8
Texas Senator Ted Cruz 8.6 9.5
New Jersey Governor Chris Christie 4.3 4.8
Florida Senator Marco Rubio 23.3 24.5
Businessman Donald Trump 19.0 19.7
Former Florida Governor Jeb Bush 13.5 14.3
Former Pennsylvania Senator Rick Santorum
0.6 0.7
Ohio Governor John Kasich 1.8 1.4
Former Arkansas Governor Mike Huckabee
1.8 2.0
Dr. Ben Carson 11.7 9.5
South Carolina Senator Lindsey Graham
0.0 0.0
Former New York Governor George Pataki
1.2 1.4
Former Hewlett Packard CEO Carly Fiorina
4.9 4.1
Someone else 0.6 0.7
Unsure / Don’t Know 4.3 2.7
Saint Leo University Polling Institute Page 19
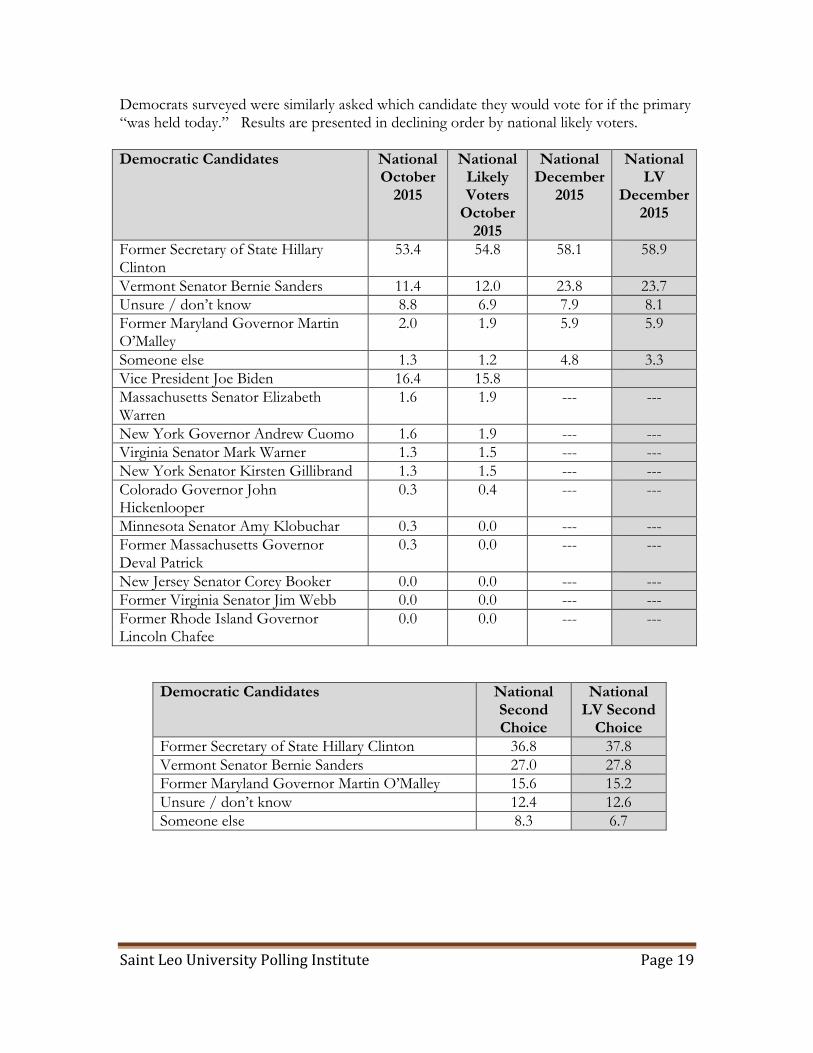
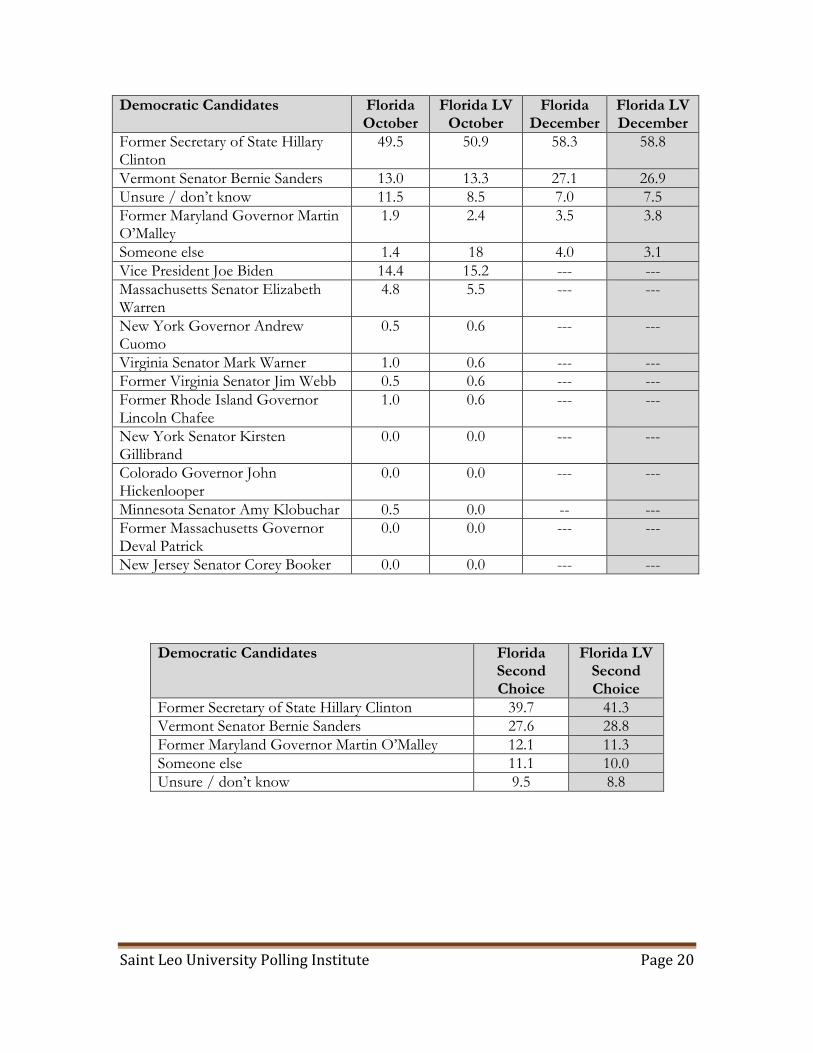
Democrats surveyed were similarly asked which candidate they would vote for if the primary “was held today.” Results are presented in declining order by national likely voters.
Democratic Candidates National October
2015
National Likely Voters
October 2015
National December
2015
National LV
December 2015
Former Secretary of State Hillary Clinton
53.4 54.8 58.1 58.9
Vermont Senator Bernie Sanders 11.4 12.0 23.8 23.7
Unsure / don’t know 8.8 6.9 7.9 8.1
Former Maryland Governor Martin O’Malley
2.0 1.9 5.9 5.9
Someone else 1.3 1.2 4.8 3.3
Vice President Joe Biden 16.4 15.8
Massachusetts Senator Elizabeth Warren
1.6 1.9 --- ---
New York Governor Andrew Cuomo 1.6 1.9 --- ---
Virginia Senator Mark Warner 1.3 1.5 --- ---
New York Senator Kirsten Gillibrand 1.3 1.5 --- ---
Colorado Governor John Hickenlooper
0.3 0.4 --- ---
Minnesota Senator Amy Klobuchar 0.3 0.0 --- ---
Former Massachusetts Governor Deval Patrick
0.3 0.0 --- ---
New Jersey Senator Corey Booker 0.0 0.0 --- ---
Former Virginia Senator Jim Webb 0.0 0.0 --- ---
Former Rhode Island Governor Lincoln Chafee
0.0 0.0 --- ---
Democratic Candidates National Second Choice
National LV Second
Choice
Former Secretary of State Hillary Clinton 36.8 37.8
Vermont Senator Bernie Sanders 27.0 27.8
Former Maryland Governor Martin O’Malley 15.6 15.2
Unsure / don’t know 12.4 12.6
Someone else 8.3 6.7
Saint Leo University Polling Institute Page 20
Democratic Candidates Florida October
Florida LV October
Florida December
Florida LV December
Former Secretary of State Hillary Clinton
49.5 50.9 58.3 58.8
Vermont Senator Bernie Sanders 13.0 13.3 27.1 26.9
Unsure / don’t know 11.5 8.5 7.0 7.5
Former Maryland Governor Martin O’Malley
1.9 2.4 3.5 3.8
Someone else 1.4 18 4.0 3.1
Vice President Joe Biden 14.4 15.2 --- ---
Massachusetts Senator Elizabeth Warren
4.8 5.5 --- ---
New York Governor Andrew Cuomo
0.5 0.6 --- ---
Virginia Senator Mark Warner 1.0 0.6 --- ---
Former Virginia Senator Jim Webb 0.5 0.6 --- ---
Former Rhode Island Governor Lincoln Chafee
1.0 0.6 --- ---
New York Senator Kirsten Gillibrand
0.0 0.0 --- ---
Colorado Governor John Hickenlooper
0.0 0.0 --- ---
Minnesota Senator Amy Klobuchar 0.5 0.0 -- ---
Former Massachusetts Governor Deval Patrick
0.0 0.0 --- ---
New Jersey Senator Corey Booker 0.0 0.0 --- ---
Democratic Candidates Florida Second Choice
Florida LV Second Choice
Former Secretary of State Hillary Clinton 39.7 41.3
Vermont Senator Bernie Sanders 27.6 28.8
Former Maryland Governor Martin O’Malley 12.1 11.3
Someone else 11.1 10.0
Unsure / don’t know 9.5 8.8
Saint Leo University Polling Institute Page 21
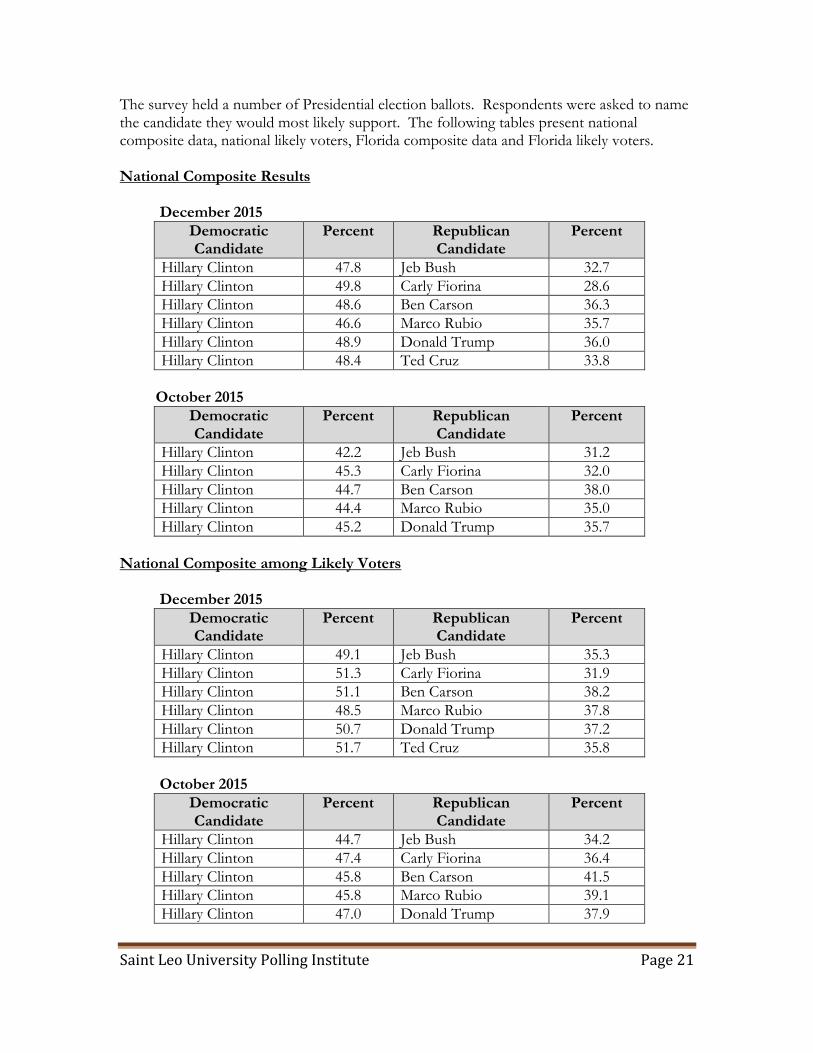
The survey held a number of Presidential election ballots. Respondents were asked to name the candidate they would most likely support. The following tables present national composite data, national likely voters, Florida composite data and Florida likely voters. National Composite Results December 2015
Democratic Candidate
Percent Republican Candidate
Percent
Hillary Clinton 47.8 Jeb Bush 32.7
Hillary Clinton 49.8 Carly Fiorina 28.6
Hillary Clinton 48.6 Ben Carson 36.3
Hillary Clinton 46.6 Marco Rubio 35.7
Hillary Clinton 48.9 Donald Trump 36.0
Hillary Clinton 48.4 Ted Cruz 33.8
October 2015
Democratic Candidate
Percent Republican Candidate
Percent
Hillary Clinton 42.2 Jeb Bush 31.2
Hillary Clinton 45.3 Carly Fiorina 32.0
Hillary Clinton 44.7 Ben Carson 38.0
Hillary Clinton 44.4 Marco Rubio 35.0
Hillary Clinton 45.2 Donald Trump 35.7
National Composite among Likely Voters December 2015
Democratic Candidate
Percent Republican Candidate
Percent
Hillary Clinton 49.1 Jeb Bush 35.3
Hillary Clinton 51.3 Carly Fiorina 31.9
Hillary Clinton 51.1 Ben Carson 38.2
Hillary Clinton 48.5 Marco Rubio 37.8
Hillary Clinton 50.7 Donald Trump 37.2
Hillary Clinton 51.7 Ted Cruz 35.8
October 2015
Democratic Candidate
Percent Republican Candidate
Percent
Hillary Clinton 44.7 Jeb Bush 34.2
Hillary Clinton 47.4 Carly Fiorina 36.4
Hillary Clinton 45.8 Ben Carson 41.5
Hillary Clinton 45.8 Marco Rubio 39.1
Hillary Clinton 47.0 Donald Trump 37.9
Saint Leo University Polling Institute Page 22
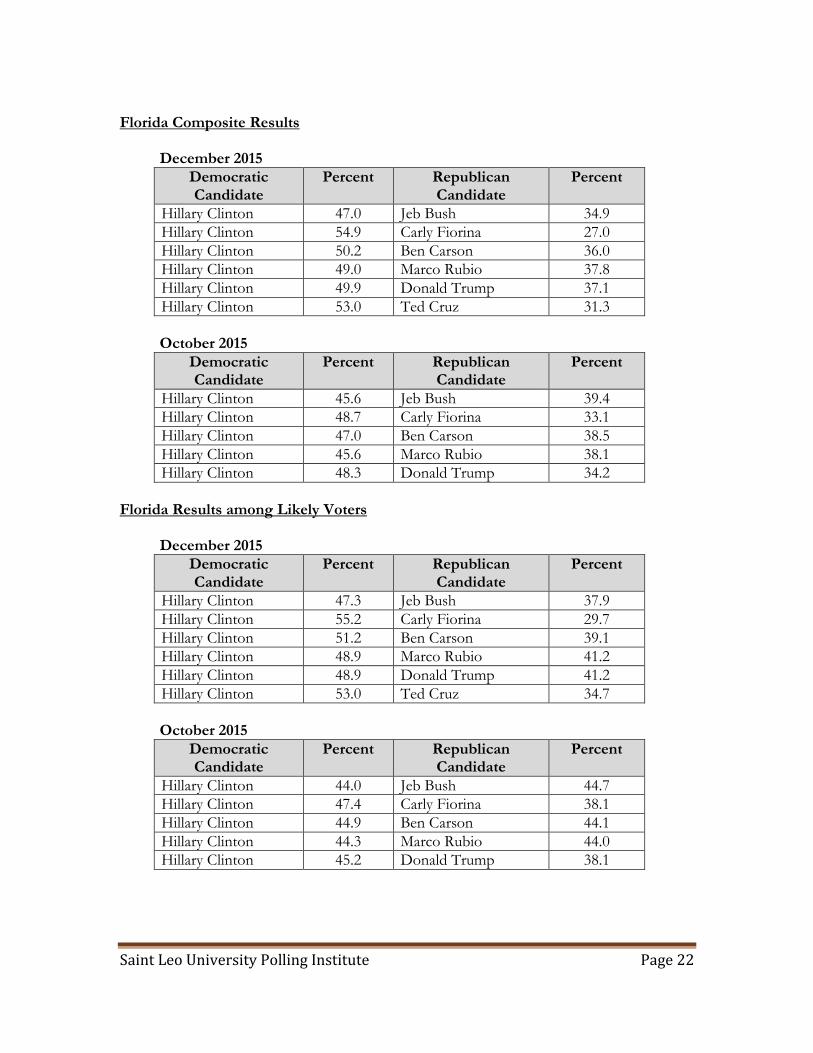
Florida Composite Results December 2015
Democratic Candidate
Percent Republican Candidate
Percent
Hillary Clinton 47.0 Jeb Bush 34.9
Hillary Clinton 54.9 Carly Fiorina 27.0
Hillary Clinton 50.2 Ben Carson 36.0
Hillary Clinton 49.0 Marco Rubio 37.8
Hillary Clinton 49.9 Donald Trump 37.1
Hillary Clinton 53.0 Ted Cruz 31.3
October 2015
Democratic Candidate
Percent Republican Candidate
Percent
Hillary Clinton 45.6 Jeb Bush 39.4
Hillary Clinton 48.7 Carly Fiorina 33.1
Hillary Clinton 47.0 Ben Carson 38.5
Hillary Clinton 45.6 Marco Rubio 38.1
Hillary Clinton 48.3 Donald Trump 34.2
Florida Results among Likely Voters December 2015
Democratic Candidate
Percent Republican Candidate
Percent
Hillary Clinton 47.3 Jeb Bush 37.9
Hillary Clinton 55.2 Carly Fiorina 29.7
Hillary Clinton 51.2 Ben Carson 39.1
Hillary Clinton 48.9 Marco Rubio 41.2
Hillary Clinton 48.9 Donald Trump 41.2
Hillary Clinton 53.0 Ted Cruz 34.7
October 2015
Democratic Candidate
Percent Republican Candidate
Percent
Hillary Clinton 44.0 Jeb Bush 44.7
Hillary Clinton 47.4 Carly Fiorina 38.1
Hillary Clinton 44.9 Ben Carson 44.1
Hillary Clinton 44.3 Marco Rubio 44.0
Hillary Clinton 45.2 Donald Trump 38.1
Saint Leo University Polling Institute Page 23
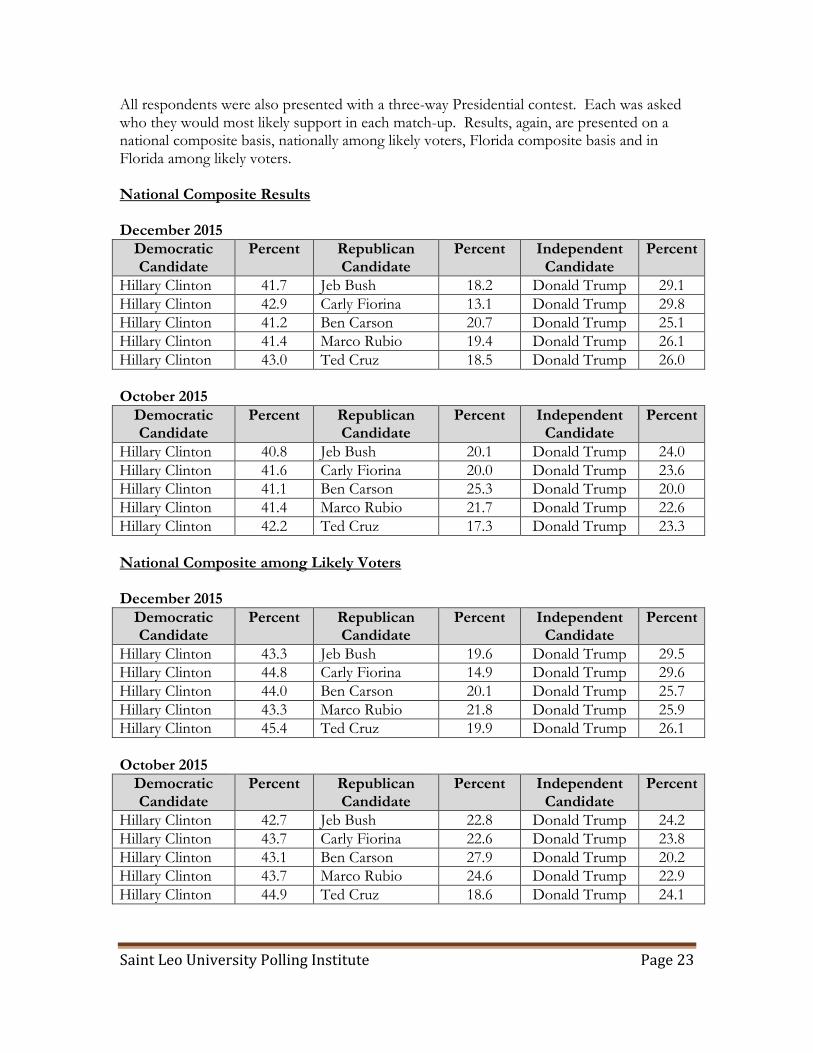
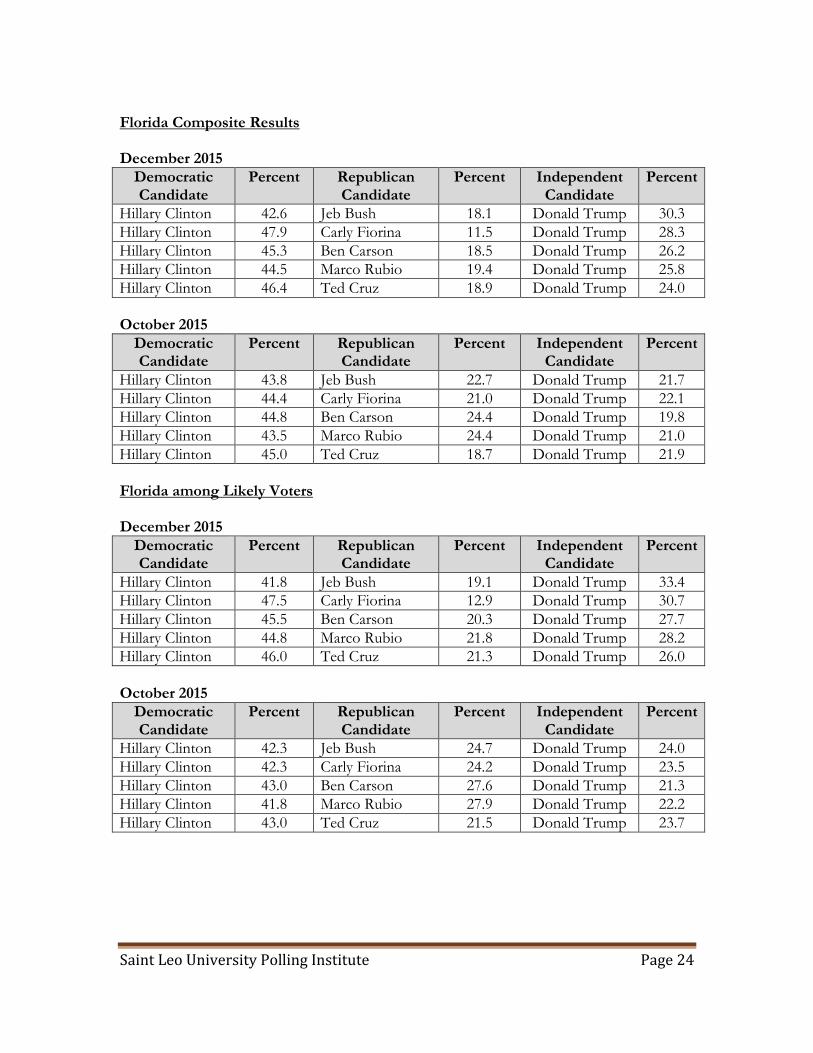
All respondents were also presented with a three-way Presidential contest. Each was asked who they would most likely support in each match-up. Results, again, are presented on a national composite basis, nationally among likely voters, Florida composite basis and in Florida among likely voters. National Composite Results December 2015
Democratic Candidate
Percent Republican Candidate
Percent Independent Candidate
Percent
Hillary Clinton 41.7 Jeb Bush 18.2 Donald Trump 29.1
Hillary Clinton 42.9 Carly Fiorina 13.1 Donald Trump 29.8
Hillary Clinton 41.2 Ben Carson 20.7 Donald Trump 25.1
Hillary Clinton 41.4 Marco Rubio 19.4 Donald Trump 26.1
Hillary Clinton 43.0 Ted Cruz 18.5 Donald Trump 26.0
October 2015
Democratic Candidate
Percent Republican Candidate
Percent Independent Candidate
Percent
Hillary Clinton 40.8 Jeb Bush 20.1 Donald Trump 24.0
Hillary Clinton 41.6 Carly Fiorina 20.0 Donald Trump 23.6
Hillary Clinton 41.1 Ben Carson 25.3 Donald Trump 20.0
Hillary Clinton 41.4 Marco Rubio 21.7 Donald Trump 22.6
Hillary Clinton 42.2 Ted Cruz 17.3 Donald Trump 23.3
National Composite among Likely Voters December 2015
Democratic Candidate
Percent Republican Candidate
Percent Independent Candidate
Percent
Hillary Clinton 43.3 Jeb Bush 19.6 Donald Trump 29.5
Hillary Clinton 44.8 Carly Fiorina 14.9 Donald Trump 29.6
Hillary Clinton 44.0 Ben Carson 20.1 Donald Trump 25.7
Hillary Clinton 43.3 Marco Rubio 21.8 Donald Trump 25.9
Hillary Clinton 45.4 Ted Cruz 19.9 Donald Trump 26.1
October 2015
Democratic Candidate
Percent Republican Candidate
Percent Independent Candidate
Percent
Hillary Clinton 42.7 Jeb Bush 22.8 Donald Trump 24.2
Hillary Clinton 43.7 Carly Fiorina 22.6 Donald Trump 23.8
Hillary Clinton 43.1 Ben Carson 27.9 Donald Trump 20.2
Hillary Clinton 43.7 Marco Rubio 24.6 Donald Trump 22.9
Hillary Clinton 44.9 Ted Cruz 18.6 Donald Trump 24.1
Saint Leo University Polling Institute Page 24
Florida Composite Results December 2015
Democratic Candidate
Percent Republican Candidate
Percent Independent Candidate
Percent
Hillary Clinton 42.6 Jeb Bush 18.1 Donald Trump 30.3
Hillary Clinton 47.9 Carly Fiorina 11.5 Donald Trump 28.3
Hillary Clinton 45.3 Ben Carson 18.5 Donald Trump 26.2
Hillary Clinton 44.5 Marco Rubio 19.4 Donald Trump 25.8
Hillary Clinton 46.4 Ted Cruz 18.9 Donald Trump 24.0
October 2015
Democratic Candidate
Percent Republican Candidate
Percent Independent Candidate
Percent
Hillary Clinton 43.8 Jeb Bush 22.7 Donald Trump 21.7
Hillary Clinton 44.4 Carly Fiorina 21.0 Donald Trump 22.1
Hillary Clinton 44.8 Ben Carson 24.4 Donald Trump 19.8
Hillary Clinton 43.5 Marco Rubio 24.4 Donald Trump 21.0
Hillary Clinton 45.0 Ted Cruz 18.7 Donald Trump 21.9
Florida among Likely Voters December 2015
Democratic Candidate
Percent Republican Candidate
Percent Independent Candidate
Percent
Hillary Clinton 41.8 Jeb Bush 19.1 Donald Trump 33.4
Hillary Clinton 47.5 Carly Fiorina 12.9 Donald Trump 30.7
Hillary Clinton 45.5 Ben Carson 20.3 Donald Trump 27.7
Hillary Clinton 44.8 Marco Rubio 21.8 Donald Trump 28.2
Hillary Clinton 46.0 Ted Cruz 21.3 Donald Trump 26.0
October 2015
Democratic Candidate
Percent Republican Candidate
Percent Independent Candidate
Percent
Hillary Clinton 42.3 Jeb Bush 24.7 Donald Trump 24.0
Hillary Clinton 42.3 Carly Fiorina 24.2 Donald Trump 23.5
Hillary Clinton 43.0 Ben Carson 27.6 Donald Trump 21.3
Hillary Clinton 41.8 Marco Rubio 27.9 Donald Trump 22.2
Hillary Clinton 43.0 Ted Cruz 21.5 Donald Trump 23.7
Saint Leo University Polling Institute Page 25
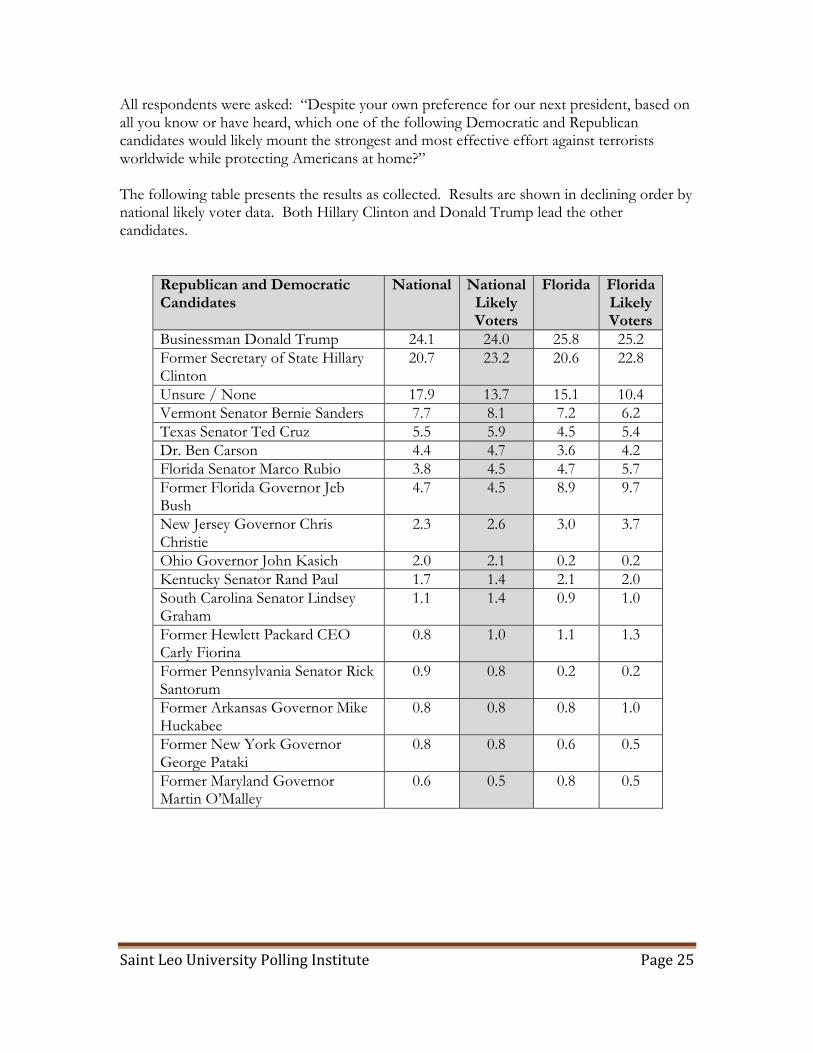
All respondents were asked: “Despite your own preference for our next president, based on all you know or have heard, which one of the following Democratic and Republican candidates would likely mount the strongest and most effective effort against terrorists worldwide while protecting Americans at home?” The following table presents the results as collected. Results are shown in declining order by national likely voter data. Both Hillary Clinton and Donald Trump lead the other candidates.
Republican and Democratic Candidates
National National Likely Voters
Florida Florida Likely Voters
Businessman Donald Trump 24.1 24.0 25.8 25.2
Former Secretary of State Hillary Clinton
20.7 23.2 20.6 22.8
Unsure / None 17.9 13.7 15.1 10.4
Vermont Senator Bernie Sanders 7.7 8.1 7.2 6.2
Texas Senator Ted Cruz 5.5 5.9 4.5 5.4
Dr. Ben Carson 4.4 4.7 3.6 4.2
Florida Senator Marco Rubio 3.8 4.5 4.7 5.7
Former Florida Governor Jeb Bush
4.7 4.5 8.9 9.7
New Jersey Governor Chris Christie
2.3 2.6 3.0 3.7
Ohio Governor John Kasich 2.0 2.1 0.2 0.2
Kentucky Senator Rand Paul 1.7 1.4 2.1 2.0
South Carolina Senator Lindsey Graham
1.1 1.4 0.9 1.0
Former Hewlett Packard CEO Carly Fiorina
0.8 1.0 1.1 1.3
Former Pennsylvania Senator Rick Santorum
0.9 0.8 0.2 0.2
Former Arkansas Governor Mike Huckabee
0.8 0.8 0.8 1.0
Former New York Governor George Pataki
0.8 0.8 0.6 0.5
Former Maryland Governor Martin O’Malley
0.6 0.5 0.8 0.5
Saint Leo University Polling Institute Page 26
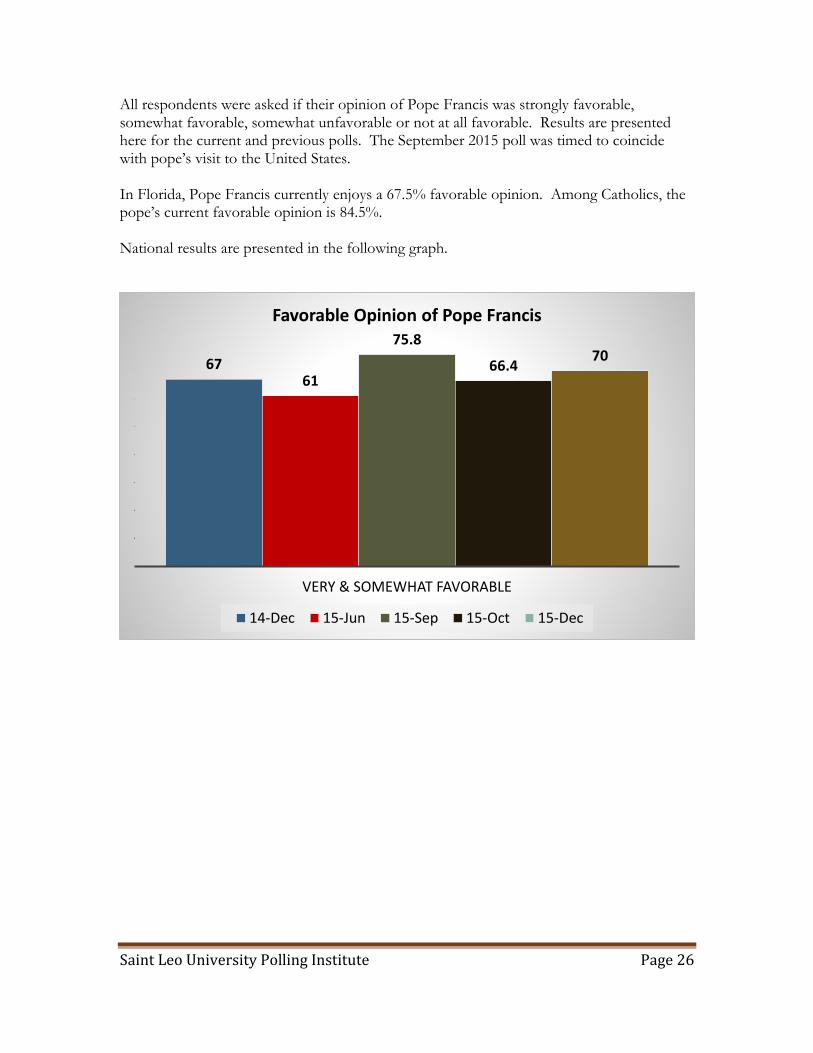
All respondents were asked if their opinion of Pope Francis was strongly favorable, somewhat favorable, somewhat unfavorable or not at all favorable. Results are presented here for the current and previous polls. The September 2015 poll was timed to coincide with pope’s visit to the United States. In Florida, Pope Francis currently enjoys a 67.5% favorable opinion. Among Catholics, the pope’s current favorable opinion is 84.5%. National results are presented in the following graph.
6761
75.8
66.470
VERY & SOMEWHAT FAVORABLE
Favorable Opinion of Pope Francis
14-Dec 15-Jun 15-Sep 15-Oct 15-Dec
Saint Leo University Polling Institute Page 27
TERRORISM
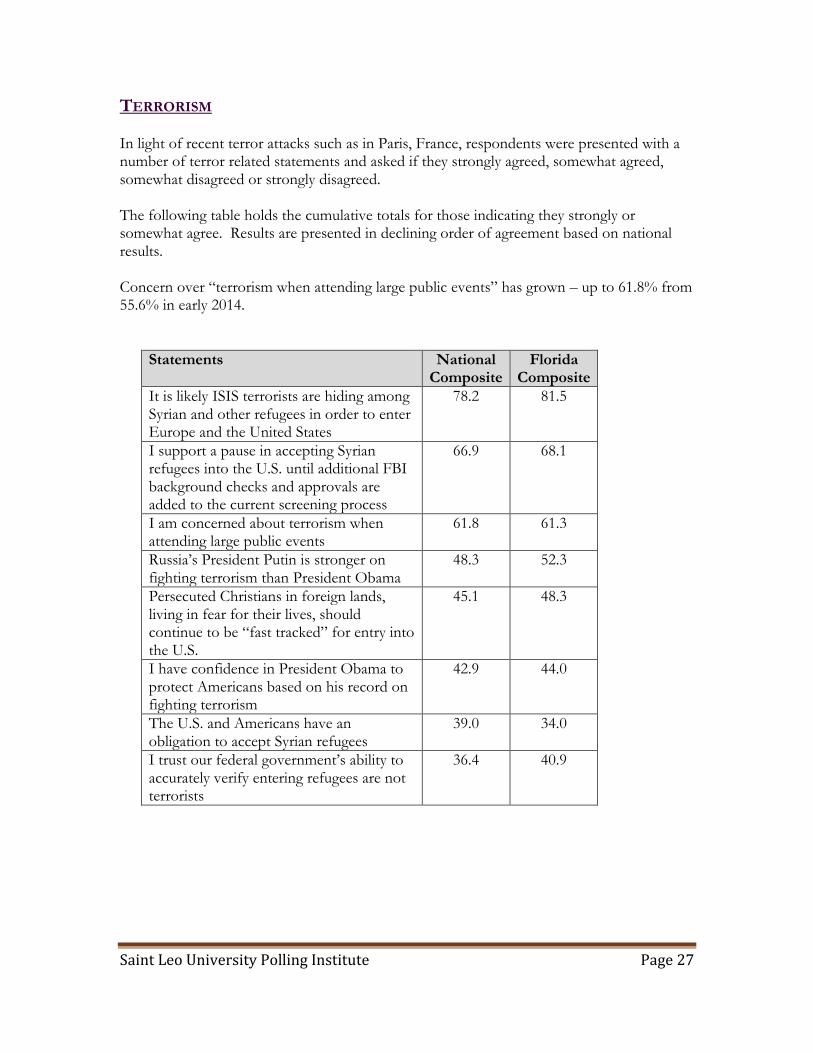
In light of recent terror attacks such as in Paris, France, respondents were presented with a number of terror related statements and asked if they strongly agreed, somewhat agreed, somewhat disagreed or strongly disagreed. The following table holds the cumulative totals for those indicating they strongly or somewhat agree. Results are presented in declining order of agreement based on national results. Concern over “terrorism when attending large public events” has grown – up to 61.8% from 55.6% in early 2014.
Statements National Composite
Florida Composite
It is likely ISIS terrorists are hiding among Syrian and other refugees in order to enter Europe and the United States
78.2 81.5
I support a pause in accepting Syrian refugees into the U.S. until additional FBI background checks and approvals are added to the current screening process
66.9 68.1
I am concerned about terrorism when attending large public events
61.8 61.3
Russia’s President Putin is stronger on fighting terrorism than President Obama
48.3 52.3
Persecuted Christians in foreign lands, living in fear for their lives, should continue to be “fast tracked” for entry into the U.S.
45.1 48.3
I have confidence in President Obama to protect Americans based on his record on fighting terrorism
42.9 44.0
The U.S. and Americans have an obligation to accept Syrian refugees
39.0 34.0
I trust our federal government’s ability to accurately verify entering refugees are not terrorists
36.4 40.9
Saint Leo University Polling Institute Page 28
FLORIDA ISSUES
Republican respondents were asked to think for a moment about the candidates running for the Republican nomination for U.S. Senate from Florida in 2016. Each was asked to report who they would support if the Republican primary for U.S. Senate was held today. Results are presented here on a composite basis and among likely voters for polls conducted in October and December 2015.
Republican Candidates
Florida October
Florida LV
October
Florida December
Florida LV
December
Ron DeSantis 6.2 6.7 6.1 6.1
David Jolly 8.5 8.6 10.4 11.6
Dr. Ilya Katz 2.3 2.5 4.9 4.1
Carlos Lopez-Cantera 4.5 4.3 7.4 8.2
Todd Wilcox 4.5 4.9 6.7 6.8
Someone else 8.5 8.6 6.7 6.8
Unsure / Don’t Know
65.5 64.4 57.7 56.5
N= 177 163 163 147
Democrat respondents were similarly asked to think for a moment about the list of candidates and potential candidates running for the Democratic nomination for the U.S. Senate from Florida in 2016. Each was asked to report who they would support if the Democratic primary for U.S. Senate was held today. Results are presented here for polls conducted in both October and December 2015.
Democratic Candidates
Florida Florida Likely Voters
Florida December
Florida LV
December
Alan Grayson 12.1 14.5 16.1 7.1
Patrick Murphy 15.9 17.6 15.6 16.9
Lateresa A. Jones 5.8 6.7 5.0 6.3
Pam Keith 1.9 1.8 3.5 4.4
Someone else 11.1 10.9 8.5 7.5
Unsure / don’t know 53.1 48.5 51.3 46.9
N= 207 165 199 160
Saint Leo University Polling Institute Page 29
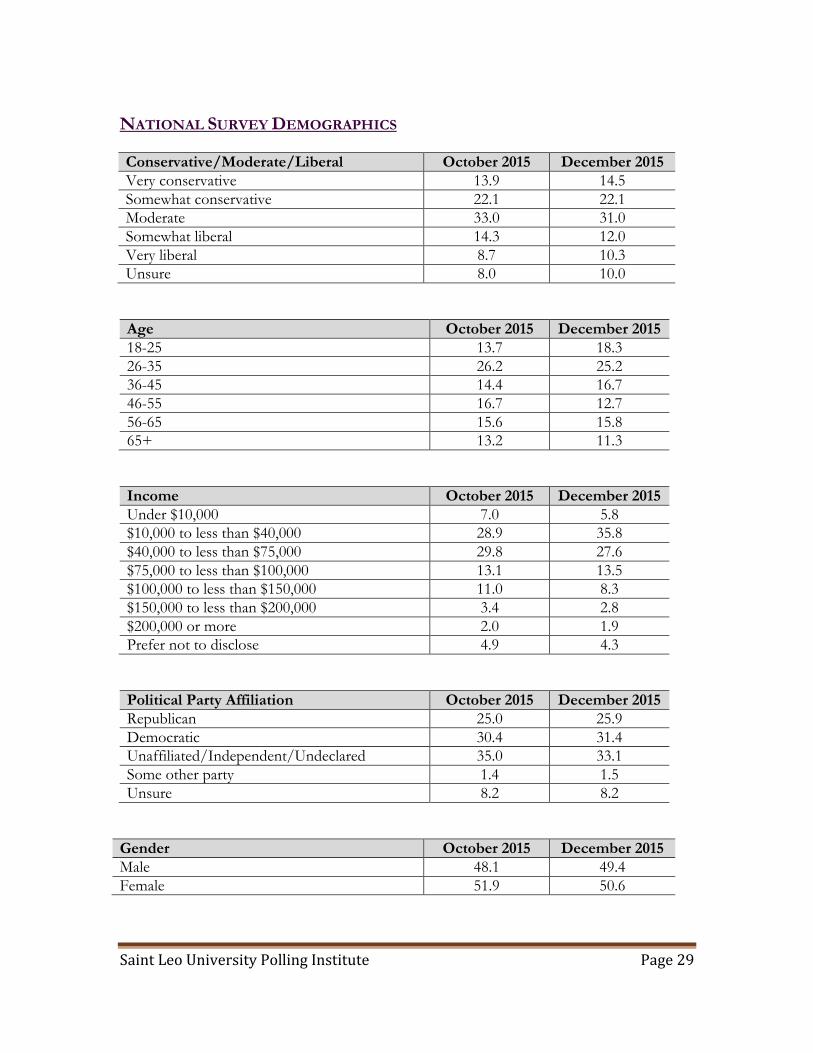
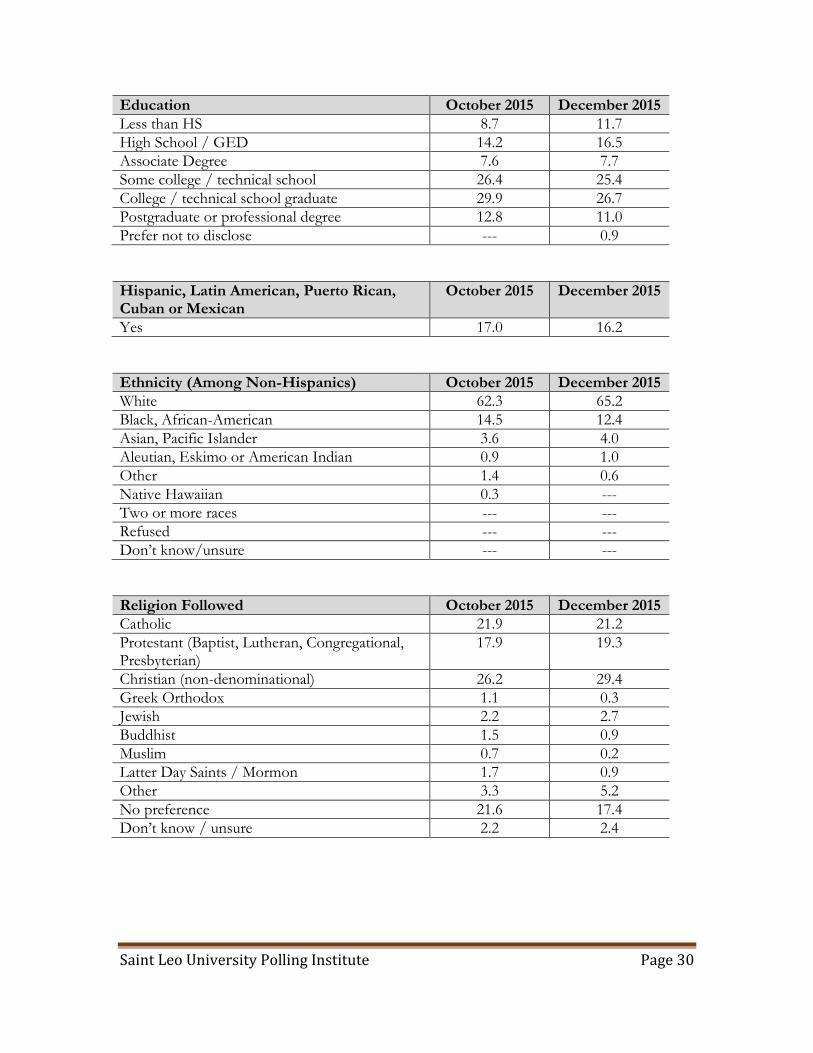
NATIONAL SURVEY DEMOGRAPHICS
Conservative/Moderate/Liberal October 2015 December 2015
Very conservative 13.9 14.5
Somewhat conservative 22.1 22.1
Moderate 33.0 31.0
Somewhat liberal 14.3 12.0
Very liberal 8.7 10.3
Unsure 8.0 10.0
Age October 2015 December 2015
18-25 13.7 18.3
26-35 26.2 25.2
36-45 14.4 16.7
46-55 16.7 12.7
56-65 15.6 15.8
65+ 13.2 11.3
Income October 2015 December 2015
Under $10,000 7.0 5.8
$10,000 to less than $40,000 28.9 35.8
$40,000 to less than $75,000 29.8 27.6
$75,000 to less than $100,000 13.1 13.5
$100,000 to less than $150,000 11.0 8.3
$150,000 to less than $200,000 3.4 2.8
$200,000 or more 2.0 1.9
Prefer not to disclose 4.9 4.3
Political Party Affiliation October 2015 December 2015
Republican 25.0 25.9
Democratic 30.4 31.4
Unaffiliated/Independent/Undeclared 35.0 33.1
Some other party 1.4 1.5
Unsure 8.2 8.2
Gender October 2015 December 2015
Male 48.1 49.4
Female 51.9 50.6
Saint Leo University Polling Institute Page 30
Education October 2015 December 2015
Less than HS 8.7 11.7
High School / GED 14.2 16.5
Associate Degree 7.6 7.7
Some college / technical school 26.4 25.4
College / technical school graduate 29.9 26.7
Postgraduate or professional degree 12.8 11.0
Prefer not to disclose --- 0.9
Hispanic, Latin American, Puerto Rican, Cuban or Mexican
October 2015 December 2015
Yes 17.0 16.2
Ethnicity (Among Non-Hispanics) October 2015 December 2015
White 62.3 65.2
Black, African-American 14.5 12.4
Asian, Pacific Islander 3.6 4.0
Aleutian, Eskimo or American Indian 0.9 1.0
Other 1.4 0.6
Native Hawaiian 0.3 ---
Two or more races --- ---
Refused --- ---
Don’t know/unsure --- ---
Religion Followed October 2015 December 2015
Catholic 21.9 21.2
Protestant (Baptist, Lutheran, Congregational, Presbyterian)
17.9 19.3
Christian (non-denominational) 26.2 29.4
Greek Orthodox 1.1 0.3
Jewish 2.2 2.7
Buddhist 1.5 0.9
Muslim 0.7 0.2
Latter Day Saints / Mormon 1.7 0.9
Other 3.3 5.2
No preference 21.6 17.4
Don’t know / unsure 2.2 2.4
Saint Leo University Polling Institute Page 31
5
Appendix
INTERPRETATION OF AGGREGATE RESULTS
The computer processed data for this survey are presented in the following frequency distributions. It is important to note that the wordings of the variable labels and value labels in the computer-processed data are largely abbreviated descriptions of the Questionnaire items and available response categories. The frequency distributions include the category or response for the question items. Responses deemed not appropriate for classification have been grouped together under the “Other” code. The “NA” category label refers to “No Answer” or “Not Applicable.” This code is also used to classify ambiguous responses. In addition, the “DK/RF” category includes those respondents who did not know their answer to a question or declined to answer it. In many of the tables, a group of responses may be tagged as “Missing” – occasionally, certain individual’s responses may not be required to specific questions and thus are excluded. Although when this category of response is used, the computations of percentages are presented in two (2) ways in the frequency distributions: 1) with their inclusion (as a proportion of the total sample), and 2) their exclusion (as a proportion of a sample sub-group). Each frequency distribution includes the absolute observed occurrence of each response (i.e. the total number of cases in each category). Immediately adjacent to the right of the column of absolute frequencies is the column of relative frequencies. These are the percentages of cases falling in each category response, including those cases designated as missing data. To the right of the relative frequency column is the adjusted frequency distribution column that contains the relative frequencies based on the legitimate (i.e. non-missing) cases. That is, the total base for the adjusted frequency distribution excludes the missing data. For many Questionnaire items, the relative frequencies and the adjusted frequencies will be nearly the same. However, some items that elicit a sizable number of missing data will produce quite substantial percentage differences between the two columns of frequencies. The careful analyst will cautiously consider both distributions. The last column of data within the frequency distribution is the cumulative frequency distribution (Cum Freq.). This column is simply an adjusted frequency distribution of the sum of all previous categories of response and the current category of response. Its primary usefulness is to gauge some ordered or ranked meaning.
Top Related