


Languages
Pages
Legal

NATIONAL GREENHOUSEGAS INVENTORY REPORT
AND MITIGATION ANALYSISFOR THE TRANSPORT SECTOR
IN LEBANON

National Greenhouse Gas Inventory Report and Mitigation Analysisfor the Transport Sector in Lebanon
May 2015

This document should be referenced as:
MoE/UNDP/GEF (2015). National Greenhouse Gas Inventory Report and Mitigation Analysis for the Transport Sector in Lebanon. Beirut, Lebanon.
Copyright © 2015 by the Ministry of Environment – United Nations Development Programme
Reproduction is authorized provided the source is acknowledged and provided the reproduction is not sold. The United Nations Development Programme (UNDP) is the UN’s global development network, advocating for change and connecting countries to knowledge, experience and resources to help people build a better life. We are on the ground in 166 countries, working with them on their own solutions to global and national development challenges. As they develop local capacity, they draw on the people of UNDP and our wide range of partners.
For more information
http://climatechange.moe.gov.lb/
The climate change project management team
Vahakn Kabakian, Project Manager
Lea Kai Aboujaoudé, Project Officer
Yara Daou, Project Research Assistant
Leila El Sayyed, Economist
Mary Awad, Project Assistant
Sara El Rayes, Administrative Assistant
UNFCCC focal point
Samar Malek, Acting Head of Service of Environmental Technology
Disclaimer
The contents of this document are the sole responsibility of its authors, and do not necessarily reflect the opinion of the Ministry of Environment or the United Nations Development Programme, who will not accept any liability derived from its use.This study can be used for research, teaching and private study purposes. Please give credit where it is due.

National Greenhouse Gas Inventory Report and Mitigation Analysis for the Transport Sector in Lebanon
Reference projectsEnabling Activities for the Preparation of Lebanon’s Third National Communication to the UNFCCC
Lebanon’s First Biennial Update Report
Executed byMinistry of Environment
Funded byGlobal Environment Facility
Implemented byUnited Nations Development Programme, Lebanon
Main authorsDr. Charbel Mansour
Dr. Charbel Afif
Dr. Antoine Waked
Lead reviewersLea Kai Aboujaoudé
Yara Daou
ReviewerVahakn Kabakian
External inventory reviewerCarlos Lopez
DesignersNathalie Hamadeh
Palig Haroutunian
PrintingAl Mostakbal Press

ForewordMinistry of Environment
Through the publications of Lebanon’s Initial and Second National Communications to the United Nations Framework Convention on Climate Change, and the Technology Needs Assessment for Climate Change, the Ministry of Environment drew the large climate change picture in the country. The picture shed the light on a number of climate change matters: Lebanon’s contribution to global greenhouse gas emissions, the sectoral share of national emissions, the socio-economic and environmental risks that the country faces as a result of climate change, and the potential actions that could and should be undertaken to fight climate change both in terms of mitigation and adaptation.
Through these series of focused studies on various sectors (energy, forestry, waste, agriculture, industry, finance and transport), the Ministry of Environment is digging deeper into the analysis to identify strengths, weaknesses, threats and opportunities to climate friendly socio-economic development within each sector.
The technical findings presented in this report (National Greenhouse Gas Inventory Report and Mitigation Analysis for the Transport Sector) will support policy makers in making informed decisions. The findings will also help academics in orienting their research towards bridging research gaps. Finally, they will increase public awareness on climate change and its relation to each sector. In addition, the present technical work complements the strategic work of the National Climate Change Coordination Unit. This unit has been bringing together representatives from public, private and non-governmental institutions to merge efforts and promote comprehensive planning approach to optimize climate action.
We are committed to be a part of the global fight against climate change. And one of the important tools to do so is improving our national knowledge on the matter and building our development and environmental policies on solid ground.
Mohamad Al Mashnouk
Minister of Environment

ForewordUnited Nations Development Programme
Climate change is one of the greatest challenges of our time; it requires immediate attention as it is already having discernible and worsening effects on communities everywhere, including Lebanon. The poorest and most vulnerable populations of the world are most likely to face the harshest impact and suffer disproportionately from the negative effects of climate change.
The right mix of policies, skills, and incentives can influence behaviour and encourage investments in climate development-friendly activities. There are many things we can do now, with existing technologies and approaches, to address it.
To facilitate this, UNDP enhances the capacity of countries to formulate, finance and implement national and sub-national plans that align climate management efforts with development goals and that promote synergies between the two.
In Lebanon, projects on Climate Change were initiated in partnership with the Ministry of Environment from the early 2000s. UNDP has been a key partner in assisting Lebanon to assess its greenhouse gas emissions and duly reporting to the UN Framework Convention on Climate Change. With the generous support of numerous donors, projects have also analysed the impact of climate change on Lebanon’s environment and economy in order to prioritise interventions and integrate climate action into the national agenda. UNDP has also implemented interventions on the ground not only to mitigate the effects of climate change but also to protect local communities from its impact.
This series of publications records the progress of several climate-related activities led by the Ministry of Environment which UNDP Lebanon has managed and supported during the past few years. These reports provide Lebanon with a technically sound solid basis for designing climate-related actions, and support the integration of climate change considerations into relevant social, economic and environmental policies.
Ross Mountain
UNDP Resident Representative

Acknowledgements
The authors would like to acknowledge the UNDP/Ministry of Environment climate change team for their input and support, as well as their constructive reviews. We would also like to express our gratitude to the Lebanese Center for Energy Conservation (LCEC, Ministry of Energy and Water) and Dr. Toni Issa (IPTEC) for the data provision.
Finally, the Ministry of Environment would like to thank UNDP/GEF for funding the whole greenhouse gas inventory exercise.

Table of contents
Executive summary.............................................................................................................................................
............................................................................................................................................................امللخص التنفيذي
Part 1: Inventory..................................................................................................................................................
1. Scope.........................................................................................................................................................
2. National circumstances.........................................................................................................................
3. Gaps and constraints identified by INC and SNC...........................................................................
4. General description of methodologies and data sources..............................................................
4.1. Adopting the IPCC guidelines..................................................................................................
4.2. Road transport.............................................................................................................................
4.3. Aviation.........................................................................................................................................
4.4. Maritime transport......................................................................................................................
4.5. Uncertainty assessment.............................................................................................................
5. Results and discussion............................................................................................................................
5.1. Transport sector GHG inventory for 2005............................................................................
5.2. Transport sector GHG inventory for 2010............................................................................
5.3. Trends in Lebanon’s GHG emissions for the transport sector: 1994-2011...................
5.4. Indicators and comparison with other countries.................................................................
Part 2: Mitigation analysis...................................................................................................................................
6. Scope...........................................................................................................................................................
7. Introduction...............................................................................................................................................
8. Existing and planned mitigation actions............................................................................................
9. Proposed mitigation analysis................................................................................................................
9.1. Methodology................................................................................................................................
9.2. Description of baseline scenario.............................................................................................
9.3. Mitigation options......................................................................................................................
10. Conclusion................................................................................................................................................
11. References................................................................................................................................................
Annex I: Time series of the road transport emissions using tier 1.............................................................
Annex II: Tier 1 and tier 2 GHG emissions comparison for the road transport sector........................
Annex III: Tier 1 GHG emissions comparison between SNC and TNC..................................................
i
iii
1
1
1
4
6
6
8
14
15
16
19
19
21
23
32
34
34
34
35
36
36
40
46
59
60
62
63
67

List of figures
Figure 1: The 2012 vehicle fleet distribution................................................................................................
Figure 2: Vehicle percentage distribution per model year of production...............................................
Figure 3: Market share of transport systems in GBA in 2002....................................................................
Figure 4: MEA operating capacity percentage (ratio of total revenue passenger-kilometers to total available seat-kilometers).................................................................................................................
Figure 5: Gasoline and gas/diesel oil imports for the road transport sector from 1994 to 2011......
Figure 6: Classification per country of origin of the 2010 Lebanese vehicle fleet...............................
Figure 7: Fuel imports for the aviation sector from 1994 to 2011...........................................................
Figure 8: Distribution of the different direct GHGs for the road transport category for 2005............
Figure 9: Contribution of the different vehicle categories to the direct GHG emissions for 2005.....
Figure 10: Distribution of the different direct GHGs for the road transport category for 2010..........
Figure 11: Contribution of the different vehicle categories to the direct GHG emissions for 2010....................................................................................................................................................
Figure 12: GHG emissions from 1994 to 2011 for road transport in Gg of CO2eq...........................
Figure 13: Variation of the emissions of CO2, CH4, and N2O relative to the 1994 level....................
Figure 14: Evolution of NOx, CO, NMVOCs and SO2 from 1994 to 2011............................................
Figure 15: Increase of direct GHG emissions in % for the road transport sector in comparison to the 1994 level...................................................................................................................................
Figure 16: Increase of direct GHGs in terms of CO2eq., population, fleet and vehicles per 1,000 persons for the road transport sector............................................................................................
Figure 17: Evolution of the road transport emissions between 1994 and 2011...................................
Figure 18: Percentage distribution of road motorized vehicles from 1994 to 2011............................
Figure 19: Comparisons of GHG emissions of CO2 and CH4 with the use of the tier 1 and tier 2 for the road transport sector..........................................................................................................
Figure 20: Evolution of direct GHG emissions from 1994 to 2011 for international marine bunkers..............................................................................................................................................
Figure 21: Loaded and unloaded cargo in Beirut and Tripoli ports from 2000 to 2011....................
Figure 22: Evolution of direct GHG emissions from 1994 to 2012 for international aviation bunkers..............................................................................................................................................
Figure 23: Number of arrival and departures of aircrafts at the BIA between 1994 and 2011.........
2
2
3
4
10
13
15
19
20
21
22
23
24
24
25
26
28
29
29
30
31
31
32

Figure 24: CO2 emissions per capita, per GDP and per car for some Mediterranean and European countries for a base year of 2005................................................................................................
Figure 25: Population size of Lebanon, 1980-2050....................................................................................
Figure 26: GDP of Lebanon based on Purchasing Power Party (PPP), 2010-2040..............................
Figure 27: ForFITS simplified model structure..............................................................................................
Figure 28: Baseline projection of passenger and freight vehicle stock....................................................
Figure 29: Baseline annual estimated passenger and freight activity......................................................
Figure 30: Baseline projection of passenger and freight energy use.......................................................
Figure 31: Baseline projection of passenger and freight CO2 emissions................................................
Figure 32: Baseline projection of passenger vehicles CO2 emissions per vehicle class.....................
Figure 33: Change in transport activity..........................................................................................................
Figure 34: Change in energy use.....................................................................................................................
Figure 35: Change in CO2 emissions..............................................................................................................
Figure 36: Passenger LDV activity per vehicle class under baseline (B) and mitigation option 2 scenario (M2)....................................................................................................................................
33
38
38
39
43
44
44
45
45
47
48
48
51

List of tables
Table 1: Gaps and needs for the calculation of GHG emissions identified in the INC and SNC.......
Table 2: Reporting categories investigated in the inventory of the Lebanese transport sector...........
Table 3: Data sources collected for the reporting categories......................................................................
Table 4: Description of the vehicles categories used in the calculation of road transport emissions...............................................................................................................................................
Table 5: Road transport gasoline and gas/diesel oil consumption...........................................................
Table 6: Classification of the 2011 vehicle fleet per category and EU emission control technologies.........................................................................................................................................
Table 7: Default EF for road transport under the tier 1 methodology.....................................................
Table 8: Default EU emission factors for gasol ine passenger cars under the t ier 2 methodology.........................................................................................................................................
Table 9: Default EU emission factors for gasoline light-duty vehicles under the tier 2 methodology.........................................................................................................................................
Table 10: Default EU emission factors for diesel heavy-duty vehicles under the tier 2 methodology......................................................................................................................................
Table 11: Default EU emission factors for motorcycles under the tier 2 methodology.......................
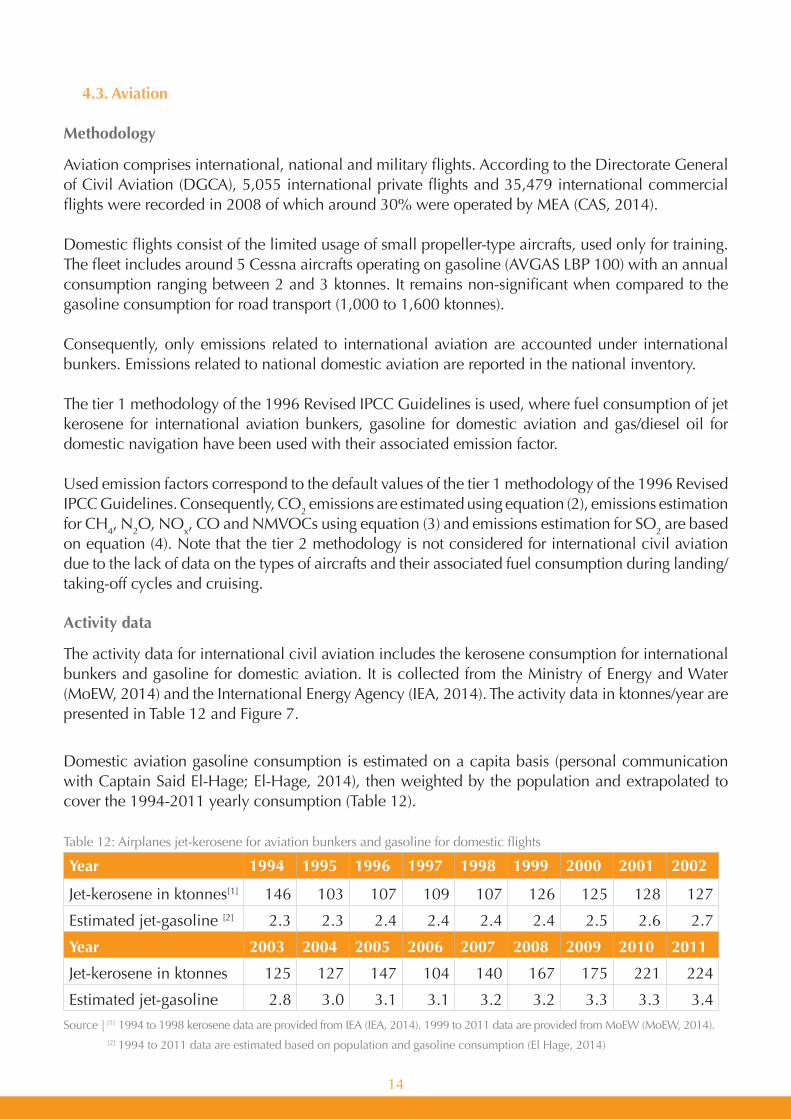
Table 12: Airplanes jet-kerosene for aviation bunkers and gasoline for domestic flights....................
Table 13: Default emission factors for aviation............................................................................................
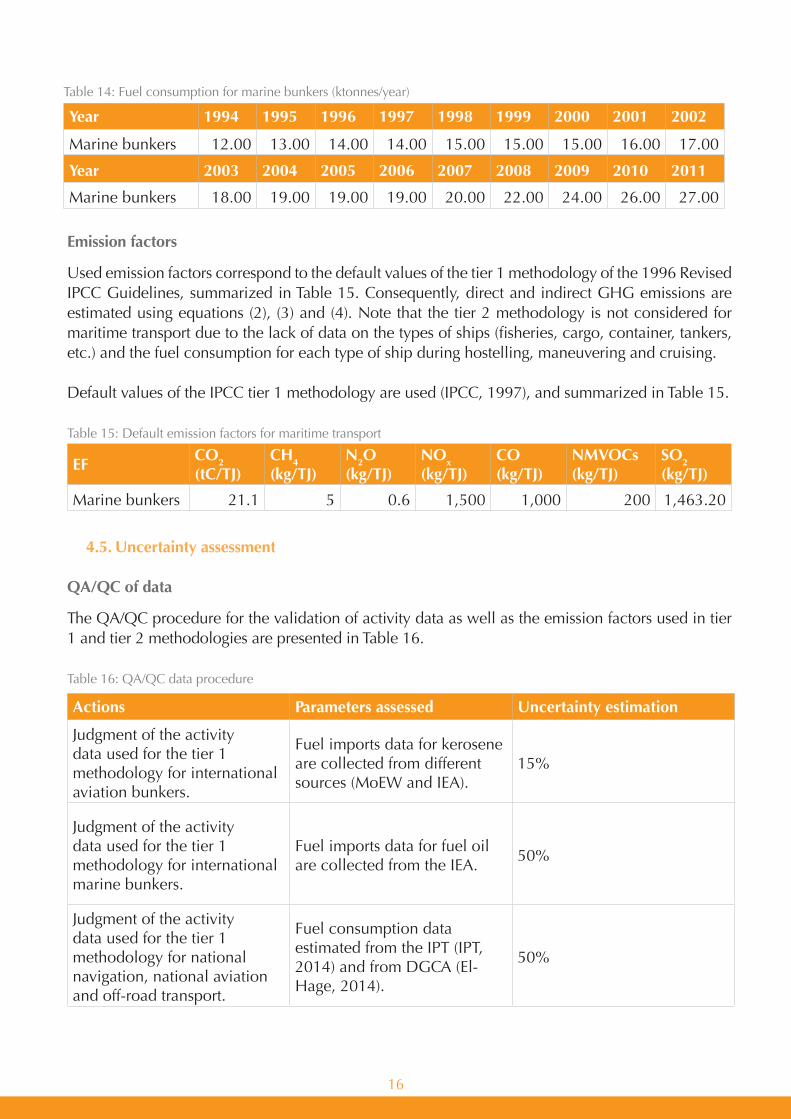
Table 14: Fuel consumption for marine bunkers (ktonnes/year)...............................................................
Table 15: Default emission factors for maritime transport.........................................................................
Table 16: QA/QC data procedure...................................................................................................................
Table 17: QA/QC of the calculation process procedure............................................................................
Table 18: Transport sector GHG emissions for the base year 2005.........................................................
Table 19: Indirect GHG emissions for the transport sector in Gg in 2005............................................
Table 20: Direct GHG emissions from international bunkers in Gg/year in 2005...............................
Table 21: Transport sector GHG emissions in 2010....................................................................................
Table 22: GHG emissions for the transport sector in Gg for the base year of 2010.............................
Table 23: Direct GHG emissions from international bunkers in Gg/year for a base year of 2010...
5
6
7
8
10
11
12
12
13
13
13
14
15
16
16
16
18
19
20
21
21
22
23
Table 24: Trends of road transport emissions in Gg/year and in % during the period 1994- 2011.....................................................................................................................................................
Table 25: Correlation between GDP/capita, veh/capita and GHG emissions......................................
Table 26: Transport modal characteristics considered in the ForFITs model.........................................
Table 27: Output parameters of the ForFITS model....................................................................................
Table 28: Set of hypotheses adopted in the baseline and mitigation scenarios....................................
Table 29: Characteristics of the road transport sector in 2010.................................................................
Table 30: Baseline scenario projections for passenger transport..............................................................
Table 31: Baseline scenario projections for freight transport....................................................................
Table 32: Passenger transport projections of the mitigation option 1 scenario.....................................
Table 33: Passenger transport projections of the scenario shift powertrain technology to FEV and HEV......................................................................................................................................................
Table 34: Passenger transport projections of the scenario shift to mass transport................................
Table 35: Action plan for implementation of scenario shift to fuel-efficient and hybrid electric vehicles................................................................................................................................................
Table 36: Action plan for implementation of scenario shift to mass transport.......................................
27
32
36
37
40
41
42
42
49
50
52
53
56

Acronyms
ASIF Activity, Structural components, energy Intensity and Fuel use
ASK Available Seat Kilometers
BAU Business as Usual
BIA Beirut International Airport
BRT Bus Rapid Transit
CAS Central Administration of Statistics
CDR Council for Development and Reconstruction
CoM Council of Ministers
DGCA Directorate General of Civil Aviation
DGLM Directorate General of Civil Aviation and Maritime Affairs
DGRB Directorate General of Roads and Buildings
DO Diesel Oil
EF Emission Factor
EMEP/EEA European Monitoring and Evaluation Programme/European Environmental Agency
EU European Union
FEV Fuel-Efficient Vehicles
ForFITS For Future Inland Transport Systems
GBA Greater Beirut Area
GDP Gross Domestic Product
Gg Gigagram or 1,000 tonnes
GHG Greenhouse Gas
GWP Global Warming Potential
HDV Heavy-Duty Vehicles
HEV Hybrid Electric Vehicle
ICE Internal Combustion Engine
IEA International Energy Agency
INC Initial National Communication
IPCC Intergovernmental Panel on Climate Change
LCC Lebanese Commuting Company
LDV Light-Duty Vehicles

M & E Monitoring and Evaluation
MEA Middle East Airlines
MMI Mobility Monitoring Indicators
MoE Ministry of Environment
MoEW Ministry of Energy and Water
MoF Ministry of Finance
MoIM Ministry of Interior and Municipalities
MoMo Mobility Model
MoPWT Ministry of Public Works and Transport
MRV Measuring, Reporting and Verification
NMVOCs Non-Methane Volatile Organic Compounds
OCFTC Office des Chemins de Fer et des Transports en Commun
PC Passenger Cars
PKM Passenger Kilometer
PPP Purchasing Power Parity
PUCE Parc, Utilization, Consumption and Emissions
QA/QC Quality Assurance/Quality Control
RPK Revenue Passenger-Kilometers
RPTA Railway and Public Transport Authority
SNC Second National Communication
SRS Schedule Reference Service
SUV Sport Utility Vehicle
TEU Total Equivalent Unit
TMO Traffic Management Organization
TNA Technology Needs Assessment
TNC Third National Communication
UNDP United Nations Development Programme
UNECE United Nations Economic Commission for Europe
UNFCCC United Nations Framework Convention on Climate Change
UNIFIL United Nations Interim Force in Lebanon

Executive summary
In the framework of Lebanon’s Third National Communication (TNC) to the United Nations Framework Convention on Climate Change (UNFCCC), Greenhouse Gas (GHG) emissions’ trend resulting from the transport sector in Lebanon was estimated from 1994 to 2011. Calculations were made using the Revised 1996 Intergovernmental Panel on Climate Change (IPCC) Guidelines for National Greenhouse Gas Inventories and the 2000 Good Practice Guidance and Uncertainty Management in National Greenhouse Gas Inventories. The GHG emissions from the transport sector, namely carbon dioxide (CO2), methane (CH4), and nitrous oxide (N2O), along with the indirect GHGs (carbon monoxide (CO), nitrogen oxides (NOx), sulphur dioxide (SO2) and non-methane volatile organic compounds (NMVOCs)) have been calculated in order to be reported to the UNFCCC as part of the TNC. The transport sector is divided into road transport, maritime transport, and aviation. Tier 2 was used for the calculation of emissions from road transport and tier 1 for the off-road transport, fisheries and yachts boats, and domestic aviation.
Inventory
Greenhouse gas emissions from transport totaled 3,629 Gg (Gigagram or 1,000 tonnes) CO2eq. in 2005 and 5,423.98 Gg CO2eq. in 2010, with carbon dioxide being the main gas emitted. Road transport is the largest contributor, emitting 3,619.23 Gg CO2eq. in 2005 and 5,268.79 Gg CO2eq. in 2010 and passenger cars have the highest share of emissions with an average of 60% of the total road transport GHG emissions.
Between 1994 and 2011, GHG emissions from the road transport sector calculated under tier 2 increased by a factor of 3.7 in 2011 compared to 1994, reaching 5,796.75 Gg CO2eq. This growth is mainly driven by the increase of the fleet volume.
Direct GHG emissions of CO2, CH4 and N2O emitted from the road transport sector significantly increased from 1994 to 2011 by 264%, 159% and 1,000% respectively, with passenger cars as the major contributor.
Direct GHG emissions from 1994 to 2011 in terms of CO2eq. showed an increase for marine international bunkers, with the highest relative yearly increase of 7% observed in the 2005-2011 period. On the other hand, aviation bunkers, which account for international flights only, showed that direct emissions were steady from 1994 till 2005, and then increased between 2008 and 2011. A significant decrease was highlighted in 2006 due to the war that took place during the summer of that year.
Mitigation
The mitigation options analysis is conducted using the For Future Inland Transport Systems (ForFITS) modeling tool, intended to estimate CO2 emissions from transport and to evaluate the impact of mitigation options on transport activity, vehicle stock and energy use. The modeled transport system includes local passenger and freight mobility structure, taking into consideration
i

the different vehicle classes of the Lebanese fleet, powertrains and fuels used. The model bases its projections on economic and social parameters such as the change of Gross Domestic Product (GDP) per capita and population growth.
The scenarios examined in the study aim at assessing the potential of the mitigation strategies identified in the Technology Needs Assessment (TNA) report outcomes in reducing CO2 emissions by 2020 and 2040 compared to the Business as Usual (BAU) trend. The mitigation strategies consist of “renewing the passenger cars fleet with fuel-efficient and hybrid electric vehicles” and “the deployment of a mass transit system in Greater Beirut Area (GBA)”. Accordingly, three mitigation scenarios are derived and examined in the model as follow:
Mitigation option 1: assumes the adoption of an incentivizing sale strategy of fuel-efficient vehicles; consequently, a progressive increase in the share of small vehicles from 11.8% in 2010 to 35% by 2040, paralleled with a reduction in the share of large and inefficient vehicles.
Mitigation option 2: same assumptions as mitigation option 1 in addition to introducing hybrid electric vehicles to the market and a progressive increase of their share up to 10% of new registered vehicles by 2040.
Mitigation option 3: assuming the increase of share of passenger-kilometer activity using mass transport from 36% to 53%, through an efficient mass transport system serving the GBA.
Results indicate that the Lebanese transport sector has significant capacity to reduce its future CO2 emissions with both TNA mitigation strategies. However, the strategy of renewing the fleet with fuel-efficient and hybrid electric vehicles is not sufficient to offset the growth in passenger activity and vehicle stock, both estimated to double by 2040 compared to 2010. Consequently, the adoption of an integrated strategy for a carefully designed portfolio of policies and mitigation incentives is a must, based on the increase of share of mass transport namely in GBA, combined with the replacement of old inefficient vehicles with new fuel-efficient and hybrid vehicles.
ii
iii
امللخص التنفيذي
فــي إطــار البــاغ الوطنــي الثالــث للبنــان إلــى اتفاقيــة األمم املتحــدة اإلطاريــة بشــأن تغيــر املنــاخ، مت تقديــر اجتــاه انبعاثــات غــاز االحتبــاس احلــراري
)الغــازات الدفيئــة( الناجمــة عــن قطــاع النقــل فــي لبنــان خــال الفتــرة ۱۹۹٤ - ۲۰۱۱. ومتــت العمليــة احلســابية باســتخدام اخلطــوط التوجيهيــة
املنقحــة للهيئــة احلكوميــة الدوليــة املعنيــة بتغيــر املنــاخ لعــام ۱۹۹٦ بشــأن عمليــات اجلــرد الوطنيــة لغــازات اإلحتبــاس احلــراري ودليــل املمارســات
الســليمة فــي عمليــات اجلــرد الوطنيــة لغــازات اإلحتبــاس احلــراري و درجــة عــدم اليقــن فــي تقديراتهــا . كمــا مت احتســاب انبعاثــات الغــازات الدفيئــة
الناجمــة عــن قطــاع النقــل، وهــي ثانــي أكســيد الكربــون وامليثــان وأكســيد النيتريــك، إضافــة إلــى انبعاثــات الغــازات الدفيئــة غيــر املباشــرة )أول أكســيد
الكربــون وأكاســيد النتروجــن وثانــي أكســيد الكبريــت ومركبــات عضويــة متطايــرة غيــر ميثانيــة( بهــدف رفــع التقاريــر بهــا إلــى اتفاقيــة األمم املتحــدة
اإلطاريــة بشــأن تغيــر املنــاخ كجــزء مــن البــاغ الوطنــي الثالــث. ومت تقســيم قطــاع النقــل إلــى النقــل البــري والنقــل البحــري واملاحــة واســُتخِدمت
منهجيــة املســتوى ۲ الحتســاب االنبعاثــات الناجمــة عــن النقــل البــري، ومنهجيــة املســتوى ۱ للنقــل فــي املناطــق الوعــرة ومصايــد األســماك واليخــوت
واملاحــة الداخليــة.
قوائم اجلرد
ــام ۲۰۰٥ و ۹٨,٥،٤۲٣ ــي ع ــون ف ــيد الكرب ــي أكس ــئ ثان ــن مكاف ــرام م ــل ٣،۲٦۹ جيغاغ ــاع النق ــن قط ــة م ــازات الدفيئ ــات الغ ــوع انبعاث ــغ مجم بل
جيغاغــرام فــي عــام ۲۰۱۰. النقــل البــري هــو أكبــر مســاهم، يســبب بانبعــاث ٣،٦۱۹,۲٣ جيغاغــرام مــن مكافــئ ثانــي أكســيد الكربــون فــي عــام ۲۰۰٥
و ٥،۲٦٨,٧۹ فــي عــام ۲۰۱۰، وســيارات الــركاب حتتــوي علــى أعلــى نســبة مــن االنبعاثــات قــدره ٦۰٪ مــن إجمالــي انبعاثــات غــازات الدفيئــة النقــل
البــري.
ــة ــي مت احتســابها باســتخدام منهجي ــري، والت ــل الب ــة الناجمــة عــن قطــاع النق ــات الغــازات الدفيئ ــن العــام ۱۹۹٤ والعــام ۲۰۱۱، ارتفعــت انبعاث ب
املســتوى ۲، بعامــل ٣,٧ فــي العــام ۲۰۱۱ مقارنــة بالعــام ۱۹۹٤، لتصــل إلــى ٥،٧۹٦,٧٥ جيغاغــرام مــن مكافــئ ثانــي أكســيد الكربــون. وتدفــع هــذا
النمــّو، بشــكل رئيســي، الزيــادة فــي حجــم أســطول مركبــات النقــل.
وأمــا انبعاثــات الغــازات الدفيئــة املباشــرة مــن ثانــي أكســيد الكربــون وامليثــان وأكســيد النيتريــك واملنبعثــة عــن قطــاع النقــل البــري، فقــد شــهدت زيــادة
ملحوظــة مــن العــام ۱۹۹٤ وحتــى ۲۰۱۱ وذلــك بنســبة ۲٦٤٪ و ۱٥۹٪ و ۱،۰۰۰٪ علــى التوالــي، حيــث كانــت ســيارات الــركاب املســاِهم األساســي.
وأظهــرت انبعاثــات الغــازات الدفيئــة املباشــرة مــن العــام ۱۹۹٤ حتــى ۲۰۱۱، مــن حيــث مكافــئ ثانــي أكســيد الكربــون، زيــادة فــي مــا يتعلــق بخزانــات
الوقــود الدوليــة البحريــة، وذلــك فــي أعلــى زيــادة ســنوية نســبية بلغــت ٧٪ ولوِحظــت فــي الفتــرة مــا بــن ۲۰۰٥ و ۲۰۱۱. ومــن ناحيــة أخــرى، أظهــرت
خزانــات وقــود الطيــران، املعنيــة بالرحــات الدوليــة وحســب، ثباًتــا فــي االنبعاثــات املباشــرة مــن العــام ۱۹۹٤ وحتــى ۲۰۰٥، ومــن ثــم زيــادة بــن ۲۰۰٨
و۲۰۱۱. ومت تســليط الضــوء علــى انخفــاض بــارز فــي العــام ۲۰۰٦ نتيجــة احلــرب التــي وقعــت خــال صيــف ذلــك العــام.
التخفيف
يجــري حتليــل خيــارات التخفيــف باســتخدام أداة النمذجــة مــن أجــل نظــم داخليــة للنقــل فــي املســتقبل )ForFITS( والتــي تهــدف إلــى تقديــر انبعاثــات
ثانــي أكســيد الكربــون الناجمــة عــن النقــل كمــا وتقييــم أثــر خيــارات التخفيــف علــى حركــة النقــل ومخــزون املركبــات البريــة واســتهاك الطاقــة. ويشــمل
نظــام النقــل املنمــذج الــركاب احملليــن وبنيــة نقــل الشــحن، مــع األخــذ بعــن االعتبــار الفئــات املختلفــة للمركبــات فــي األســطول اللبنانــي وأنظمــة نقــل
احلركــة وأنــواع الوقــود املســتخدمة. ويبنــي النمــوذج توقعاتــه علــى املعاييــر االقتصاديــة واالجتماعيــة مثــال تغيــر نصيــب الفــرد مــن النــاجت احمللــي
اإلجمالــي والنمــو الســكاني.
أمــا الســيناريوهات التــي مت اســتعراضها فــي الدراســة فتهــدف إلــى تقييــم إمكانــات اســتراتيجيات التخفيــف التــي مت حتديدهــا فــي نتائــج تقريــر
تقييــم االحتياجــات التكنولوجيــة فــي احلــّد مــن انبعاثــات ثانــي أكســيد الكربــون بحلــول العــام ۲۰۲۰ والعــام ۲۰٤۰، مقارنــة مــع نهــج العمــل املعتــاد.
وتتألــف اســتراتيجيات التخفيــف مــن »جتديــد أســطول ســيارات الــركاب بســيارات كهربائيــة هجينــة ومقتصــدة فــي اســتهاك الوقــود« كمــا و»نشــر
نظــام وســائل نقــل جماعيــة فــي منطقــة بيــروت الكبــرى«. وبنــاًء علــى ذلــك، ميكــن اســتخراج ثاثــة ســيناريوهات للتخفيــف ودراســتها فــي النمــوذج
علــى الشــكل التالــي:
ــة ــادة تدريجي ــي، زي ــود؛ وبالتال ــتهاك الوق ــي اس ــدة ف ــات املقتص ــة للمركب ــع حتفيزي ــتراتيجية بي ــاد اس ــة اعتم ــم ۱: فرضي ــف رق ــار التخفي خي
فــي حصــة الســيارات الصغيــرة مــن ۱۱,٨٪ فــي العــام ۲۰۱۰ إلــى ٣٥٪ بحلــول العــام ۲۰٤۰، وذلــك مبــوازاة انخفــاض فــي حصــة املركبــات
ــر املقتصــدة. ــرة وغي الكبي

iv
خيــار التخفيــف رقــم ۲: الفرضيــات ذاتهــا الــواردة فــي خيــار التخفيــف رقــم ۱، إضافــة إلــى إدخــال الســيارات الكهربائيــة الهجينــة إلــى الســوق
وزيــادة تدريجيــة حلصصهــا حتــى ۱۰٪ مــن املركبــات املســّجلة اجلديــدة بحلــول العــام ۲۰٤۰.
خيــار التخفيــف رقــم ٣: افتــراض زيــادة حصــص حركــة الراكــب بالكيلومتــر باســتخدام وســائل النقــل اجلماعــي مــن ٣٦٪ إلــى ٥٣٪ مــن خــال
نظــام نقــل جماعــي فّعــال يخــدم منطقــة بيــروت الكبــرى.
وتشــير النتائــج إلــى أن قطــاع النقــل اللبنانــي يتمّتــع بإمكانيــة كبيــرة علــى احلــد مــن انبعاثاتــه املســتقبلية مــن ثانــي أكســيد الكربــون باســتخدام
ــد أســطول ســيارات ــة. إال أن إســتراتيجية جتدي ــم االحتياجــات التكنولوجي ــر تقيي ــج تقري ــي نتائ ــا ف ــي مت حتديدهم ــف الت إســتراتيجيتي التخفي
الــركاب بســيارات كهربائيــة هجينــة ومقتصــدة فــي اســتهاك الوقــود ليســت كافيــة للتعويــض عــن النمــو فــي حركــة الــركاب ومخــزون املركبــات،
واللــذان ُيقــّدر أن يبلغــا الضعــف بحلــول العــام ۲۰٤۰، مقارنــًة بالعــام ۲۰۱۰. نتيجــة لذلــك، فــإن اعتمــاد إســتراتيجية متكاملــة حملفظــة
سياســات وحوافــز للتخفيــف يتــّم تصميمهــا بإمعــان هــو أمــر ضــروري، وذلــك بنــاًء علــى ازديــاد حصــة النقــل اجلماعــي باألخــص فــي منطقــة
بيــروت الكبــرى، باالشــتراك مــع اســتبدال املركبــات القدميــة وغيــر املقتصــدة مبركبــات جديــدة هجينــة ومقتصــدة فــي اســتهاك الوقــود.

1
Part 1: Inventory
1. Scope
As a Non-Annex I party to the United Nations Framework Convention on Climate Change (UNFCCC), Lebanon is recommended to report its emissions to the UNFCCC according to decisions 17/CP.8, 2/CP.17 and articles 4 and 12 of the Convention. According to the Second National Communication (SNC) (MoE/UNDP/GEF, 2011), the transport sector is the second consumer of energy in Lebanon, totally dependent on fossil fuels. Its Greenhouse Gas (GHG) emissions account for 28.6% of total emissions from the energy sector and for 21% of the total national GHG emissions for the baseline year of 2000.
This report focuses on the estimates of GHG emissions from the transport sector in Lebanon, for a baseline year of 2005 and for the time series 1994 to 2011. It includes direct and indirect GHGs, i.e. carbon dioxide (CO2), methane (CH4) and nitrous oxide (N2O) for direct GHGs; nitrogen oxide (NOx), carbon monoxide (CO), non-methane volatile organic compounds (NMVOCs) and sulphur dioxide (SO2) for indirect GHGs. The preparation and reporting of this inventory are based on the 1996 Revised Intergovernmental Panel on Climate Change (IPCC) Guidelines (IPCC, 1997), and the IPCC Good Practice Guidance and Uncertainty Management in National Greenhouse Gas Inventories (IPCC, 2000).
National circumstances of the current transport sector are outlined in section 2. Section 3 covers the gaps and constraints identified in the first and second national communications. In section 4, the preparation process and calculation methodology of the GHG emission inventory are presented, including activity data for 2005 to 2011, and emission factors. Section 5 presents the GHG inventory results for the year of 2005 and the time series 1994 to 2011, illustrated by gas and by transport modes.
2. National circumstances
The Lebanese transport sector encompasses land, marine and air mobility subsectors.
Land transport
The land transport sector only consists of road-motorized vehicles, since no appropriate infrastructure for non-motorized vehicles exists (i.e. bicycle lanes, safe storage, and convenient and affordable bike rentals) and the entire rail network is currently derelict (Lebanon used to operate four rail lines: (1) Beirut-Damascus, (2) Naqoura-Tripoli, (3) Tripoli-Homs and (4) Rayak-Aleppo).
Road-motorized vehicles mainly rely on personal-owned passenger cars. The 2012 vehicle fleet database shows a total of 1.58 million registered vehicles, with a distribution presented in Figure 1. The age distribution of passenger cars (public and private) illustrated in Figure 2 reflects the old nature of the fleet, with 71% older than 10 years. Moreover, the engine distribution of the passenger car fleet in 2007 shows that the fleet is mostly inefficient, since 60% of the cars have engine displacements exceeding 2.0 liters, while only 8% have engines less than 1.4 liters (MoE/URC/GEF, 2012).

2
Figure 1: The 2012 vehicle fleet distribution
Source| MoIM, 2013
Figure 2: Vehicle percentage distribution per model year of production
Mass transport consists of public and private buses, minivans and exclusive and shared-ride taxis, all operating on an ad-hoc basis without any coordination, resulting in very poor occupancy rates of about 1.2 passengers per vehicle for taxis, 6 for vans and 12 for buses (MoE/URC/GEF, 2012). In 2002, the mass transport market share in the Greater Beirut Area (GBA) was 31%, split between modes as illustrated in Figure 3 (Baaj, 2002), clearly illustrating the level of underdevelopment of mass transportation in Lebanon. This limited share of the market continues today due to the impracticality, lack of safety and restricted reach of public transportation compared to the attractiveness of owning a private automobile, an alternative that is still promoted over mass transportation in Lebanon through bank loan facilities and affordable new and used car imports.
85.0%
7.4%2.3% 5.3%
Passenger cars
Light-duty vehicles
Heavy-duty vehicles
Motorcycles
15.5%2006-2012
2001-2005
1996-2000
1991-1995
1986-1990
1981-1985
<1980
19.6%
15.3%
11.6%
12.6%
9.6%
15.7%
0% 5% 10% 15% 20% 25%

3
This reality is due in large part to the chaotic, inefficient and unreliable management of the transportation sector, preventing the modernization and growth of the system and allowing the market to be controlled by private operators. For example, the system is oversupplied with 50,000 taxi licenses (known as “red plates”), where an estimated 17,000 of these are illegally procured and operated, with a similar situation of poor forecasting and control of the number of shared taxis and minibuses relative to actual market demand.
Based on collected data from on-road measurements in the GBA with a GPS-guided survey of typical driver habits, the driving patterns in 2011 can be characterized by a relatively low driving range with a high rate of congestion and frequent stops at short time intervals. In fact, it was found that 50% of the trips have a distance lower than 5 km, 25% of stops are below 2 seconds and the total stop time per trip corresponds to more than 15% of travel time (Mansour, 2011). Moreover, observed results reflect the continuous stop-and-go driving patterns, therefore resulting in the inefficient operation of internal combustion engines, and a high rate of fuel consumption and pollutant emissions as a result.
The main road transport legislation are law 341 (6-08-2001) and decree no. 7858/2002, banning the use of private and public cars with diesel engines starting from 15-6-2002, and the use of public buses of 16 to 24 passengers with diesel engines starting from 31-10-2002.
Aviation
Middle East Airlines (MEA) is the national air carrier of Lebanon and Beirut International Airport (BIA) is the only operational commercial airport in the country. In 2012, the number of flights at the BIA reached over 60,000 commercial flights with around 5.9 million incoming and outgoing passengers (BIA statistics, 2014). The BIA is designed to host a maximum of 16 million passengers per year.
MEA flies to 21 countries serving a total of 30 different airports with 62 departures daily. Data is based on the Schedule Reference Service (SRS) Analyser database. It has a fleet mainly consisting of A320 and A330 that stands at 18 aircrafts operating at 68% capacity according to the Figure 4 on Available Seat Kilometers (ASK) and total Revenue Passenger-Kilometers (RPK) (Zouein, 2014).
Figure 3: Market share of transport systems in GBA in 2002
*RPTA: Railway and Public Transport Authority, LCC: Lebanese Commuting Company
Passenger cars
Shared ride taxis
Public buses (RPTA)*
Mini buses
Private buses (LCC)*
Exclusive ride taxis69%
3% 5%1%
14%
8%

4
The other remaining airports in Lebanon such as the Riyak and the Kleyaat airports are reserved for military services. Regarding domestic flights in Lebanon, they show very limited activity since aircrafts are of small propeller engine types, used only for training.
Marine transport
Legal harbors in Lebanon are limited to five: Beirut, Tripoli, Saida, Tyr and Jounieh. Beirut and Tripoli are the two largest commercial ports. In fact, the port of Beirut hosts around 78% of the incoming ships to Lebanon and the port of Tripoli hosts around 16% (CAS, 2014). The number of yearly incoming ships and oil tankers to Beirut port ranges between 2,000 and 2,400 ships, with a total capacity around 700,000 containers Total Equivalent Unit (TEU) per year (Beirut port statistics, 2014). Moreover, Beirut port also observes transit traffic with an average value of 1.8 million tonnes of goods per year. As for Tripoli, its port hosts around 350 to 450 yearly incoming container and cargo ships, and 50 to 90 oil tankers (Tripoli port statistics, 2014).
The fisheries host a fleet of around 2,860 boats with a yearly catch of 9,000 tonnes, insufficient to cover the local fish consumption of 35,000 tonnes; consequently, 74% of the fish is imported. About 98% of the fleet is constituted of open woody boats with length less than 12 meters (EastMED, 2012). The fleet is old (e.g. average age of 17 years at the port of Tyr) and spread over 44 harbors, most of which requires major infrastructure maintenance intervention.
3. GapsandconstraintsidentifiedbyINCandSNC
The gaps and needs for the calculation of GHG emissions from the transport sector that were identified in the Initial National Communication (INC) and Second National Communication (SNC) are summarized in Table 1. They consist of (1) the underdeveloped institutional arrangement for transport data monitoring and collection, (2) the unavailability of specific data and/or the inaccessibility of existing data for adopting tiers 2 and 3 methodologies, and (3) the use of default Emission Factors (EF) from IPCC guidelines instead of Lebanon fuel-specific EF. Note that these gaps still exist during the elaboration of the TNC.
Figure 4: MEA operating capacity percentage (ratio of total revenue passenger-kilometers to total
available seat-kilometers)
Total traffic RPK
100%
80%
60%
40%
20%
0%2011
3,865,000 3,952,000
2012

5
Table 1: Gaps and needs for the calculation of GHG emissions identified in the INC and SNC
Underdeveloped data collection for the inventory
Unavailable and/or unshared specific data for tiers 2 and 3 calculations
Missing road transport activity data on annual fuel consumption per type of fuel and yearly average vehicle mileage per category.
Activity data of off-road vehicles not considered.
Unshared activity data between public/private institutions due to lack of coordination and/or confidentiality.
Use of IPCC default emission factors
No fuel-specific emission factors elaborated for Lebanon.
Enforce specific activity data collection for the preparation of the inventory
Create a national institutional arrangement for the preparation of the GHG inventory, empowering the Central Administration of Statistics (CAS), the relevant ministries and concerned public authorities to develop a Mobility Monitoring Indicators (MMI) platform, in charge of collection (Measuring, Reporting and Verification (MRV)) of transport activity data.
MMI platform should include all activity data needed to estimate Lebanon’s transport sector GHG emissions using tiers 2 and 3 of the IPCC guidelines. Activity data should be reported with uncertainty assessments in order to have statistically acceptable data.
Share of dataStandardize/centralize data reporting and develop protocols for data accessibility.
Develop Lebanon’s fuel-specific emission factors and methodologies
Conduct measurements campaigns in order to elaborate specific emission factors representative of the Lebanese transportation fleet.
Develop GHG emissions estimation models with local research institutes to create Lebanon-specific methodologies using advanced bottom-up approaches for inventory preparation.
Emissions of national navigation and aviation are calculated using unclear assumptions on shares of fuel imports.
National aviation and navigation emissions not included.
INC SNC
Gaps
Needs
Lack of institutional arrangement for data monitoring and reporting.
Need to improve the uncertainty calculation methodologies in the Quality Assurance/Quality Control (QA/QC) procedure.
1.
1.
2.
2.
3.
4.
1.
1.
2.
2.
4.

6
4. General description of methodologies and data sources
4.1. Adopting the IPCC guidelines
The Lebanese transport GHG inventory is carried out based on calculation methodologies of the 1996 Revised IPCC Guidelines (IPCC, 1997), and the IPCC Good Practice Guidance and Uncertainty Management in National Greenhouse Gas Inventories (IPCC, 2000). Lebanon’s transport emissions include all domestic transport modes, divided into the reporting categories summarized in Table 2: aviation, maritime transport and road transport vehicles. Emissions mainly originate from road transport vehicles, since aviation and maritime transport are mostly used for international mobility. The results of direct (CO2, CH4 and N2O) and indirect GHG emissions (NOx, CO, NMVOCs and SO2) for the year of 2005 and the trend for the period 1994 to 2011 per transport mode are given in section 5. Note that emissions from international transport modes: aviation and maritime transport are only reported under the international bunkers section, as per the IPCC guidelines, and are not added to the national total GHG emissions from the transport sector.
Table 2: Reporting categories investigated in the inventory of the Lebanese transport sector
Reporting categories
Description Remarks Methodology
Aviation
Military helicopters, civil, commercial aircrafts, and private jet- and propeller-type aircrafts.
Emissions from military aircrafts are not calculated due to the confidentiality of activity data for military cases.
Civil, private and commercial aircrafts emissions are calculated based on the tier 1 methodology.
Maritime transport
Domestic navigation between local ports, fisheries and international navigation.
Emissions from military navigation are not calculated due to the unavailability of activity data for military cases.Emissions from fisheries are reported under this category. They are reported under the agriculture/forestry/fisheries category of the energy sector.
International navigation from marine bunkers and national navigation from fishing boats and yachts were calculated based on the tier 1 methodology.
Road transport vehicles
On-road vehicle technologies rely on gasoline and gas/diesel internal combustion engines. The fleet encompasses motorcycles, passenger cars, vans, buses and trucks.
Road transport is the only mobility mean considered under land transport as the entire rail network is derelict.
Emissions are estimated using the tier 2 methodology.

7
No national system is established in Lebanon assuming the responsibility for collecting data for the GHG inventory, particularly for the transport sector. Consequently, data are collected from different public and private authorities, local and international organizations, survey and reports, as summarized in Table 3.
Table 3: Data sources collected for the reporting categories
Reporting categories Activity data Sources
Aviation Fuel imports
Ministry of Energy and Water (MoEW, 2014), the International Energy Agency (IEA, 2014) and IPT Energy Center (IPT, 2014)
Road transport
Off-road transport Fuel imports IPT Energy Center (IPT, 2014)
Navigation Fuel importsInternational Energy Agency (IEA, 2014) and IPT Energy Center (IPT, 2014)
Fuel imports
Ministry of Energy and Water (MoEW, 2014), the International Energy Agency (IEA, 2014) and IPT Energy Center (IPT, 2014)
Number of registered vehicles Ministry of Environment (MoE, 2014)
Number of vehicles equipped with a catalyst for emission control
Waked and Afif (2012)
Classification of vehicles by country of origin
Ministry of Finance (MoF, 2011)

8
GHG emissions are estimated using the tier 2 methodology, presented in equation (1), and based on the number of vehicles per category (PC, LDV, HDV and motorcycles) and their activity in terms of distance and/or fuel consumption.
E = ∑a [EFabc.Activityabc]
where
E is CO2, CH4, N2O, CO, NOx and NMVOCs emissions (kg)
EF: emission factor in g/km, g/kg or g/MJ
Activity: travelled distance in km or fuel consumption in kg or MJ for a given mobile source activity
a: fuel type (diesel, gasoline)
b: vehicle type (PC, LDV, HDV and motorcycles)
c: emission control technology depending on the age of vehicles
Vehicle category Description
Passenger carsPrivate personal gasoline cars used for mobility including Sport Utility Vehicles (SUV).
Light-duty vehiclesGasoline vehicles with rated gross weight less than 3,500 kg including light trucks and coaches, designed for transportation of cargo or passengers.
Heavy-duty vehicles
Diesel vehicles with rated gross weight exceeding 3,500 kg including heavy trucks and coaches, designed for transportation of cargo or passengers.
MotorcyclesIncludes a mixture of 2-stroke and 4-stroke engines as well as mopeds having an engine less than 50cc.
4.2. Road transport
Methodology
Road transport covers all internal combustion vehicles used for passengers and goods mobility in Lebanon, except farm tractors and public works vehicles. Types of vehicles investigated in this inventory are motorcycles, passenger cars, vans, buses and trucks, classified into categories in accordance with the guidelines: Passenger Cars (PC), Light-Duty Vehicles (LDV), Heavy-Duty Vehicles (HDV) and motorcycles (Table 4). After banning the use of diesel for vehicles with gross weight lower than 3,500 kg (law 341 (6-08-2001) and decree no. 341/2002), passenger cars, light-duty vehicles and motorcycles run only on gasoline, where heavy-duty vehicles run on diesel.
Table 4: Description of the vehicles categories used in the calculation of road transport emissions

9
For quality check, the road transport GHG emissions are also calculated using the top-down tier 1 methodology, based on the amount of gasoline and gas/diesel fuel imports for the road transport sector. Emissions are calculated from 1994 to 2011 for completeness, using equations (2), (3) and (4) (IPCC, 1997).
E = ∑a[Fuela.EFa]
where E is CO2 emissions (kg)
Fuela: fuel sold (TJ) Lebanon’s fuel imports are reported in kilotonnes (ktonnes)and converted to TJ using the net calorificvalueforeachtypeasreportedinthe guideline,i.e.anetcalorificvalueof44.80kg/ TJforgasolineand43.33kg/TJfordiesel.
EFa: emission factor (kg/TJ) For CO2, it corresponds to the carbon content (carbonEFtC/TJmultipliedbytheconsumption inTJ)ofthefuelmultipliedbythefractionof carbonoxidizedof0.99multipliedby44/12. a: type of fuel (gasoline/diesel)
E = ∑a [Fuela.EFa]
where E is CH4, N2O, CO, NOX and NMVOCs emissions (kg)
Fuela: fuel sold (TJ)
EFa: emission factors of CH4, N2O, CO, NOX and NMVOCs (kg/TJ)
a: type of fuel (gasoline/diesel)
where E is SO2 emissions (kg)
Fuela: fuel sold (TJ)
Sulfur content of fuela: 0.1% for gasoline and 0.3% for diesel
Net calorific value of 44.80 kg/TJ for gasoline and 43.33 kg/TJ for diesel Sulfur retention in ash: 1% The amount of sulfur retained in ash during fuel combustion
Abatement efficiency of fuel: 1% Abatement technologies for SO2 emissions reductions a: type of fuel (gasoline/diesel)
E = ∑a
(Fuel a.(2.sulphur content of fuel a|100).(1|net calorific value of fuel a ).1,000,000.
((100 - sulphur retention in ash of fuel a|100)).(100 - abatement efficiency of fuel a|100))|1,000

10
Activity data
For the tier 1 approach, the needed activity data is Lebanon’s annual gasoline and diesel oil consumption for road transport. Gasoline imports data for road transport are collected from the Ministry of Energy and Water (MoEW) and Ministry of Finance (MoF) (MoEW, 2014, MoF, 2014), whereas gas/diesel oil consumption for road transport are estimated as 14%[1] of the total imports (MoEW, 2014; IPT, 2014). They are presented in Figure 5 and in Table 5. It should be noted that gasoline imports data for road transport showed a consistency among MoEW and International Energy Agency (IEA) data, with calculated differences less than 1%.
Figure 5: Gasoline and gas/diesel oil imports for the road transport sector from 1994 to 2011
Table 5: Road transport gasoline and gas/diesel oil consumption
Source | IEA, 2014
*MoEW, 2014, IPT, 2014
Year 1994 1995 1996 1997 1998 1999 2000 2001 2002
Gasoline (ktonnes)
1,121 1,325 1,377 1,318 1,410 1,342* 1,261* 1,176* 1,177*
Gas/diesel oil (ktonnes)
111 143 130 193 200 245 184 215 233
Year 2003 2004 2005 2006 2007 2008 2009 2010 2011
Gasoline (ktonnes)
1,257* 1,260* 1,270* 1,222* 1,304* 1,398* 1,614* 1,592* 1,595*
Gas/diesel oil (ktonnes)
256 245 233 223 191 252 363 315 343
[1] 14% is the average percent of Diesel Oil (DO) consumption of the fleet in Lebanon (total DO-fuel vehicles/DO consumption per vehicle) for the period 2005-2012.
1,8001,6001,4001,2001,000
800600400200
0
400
350
300
250
200
150
100
50
0
Gasoline consumption road transport
Gas/diesel oil consumption road transport
11
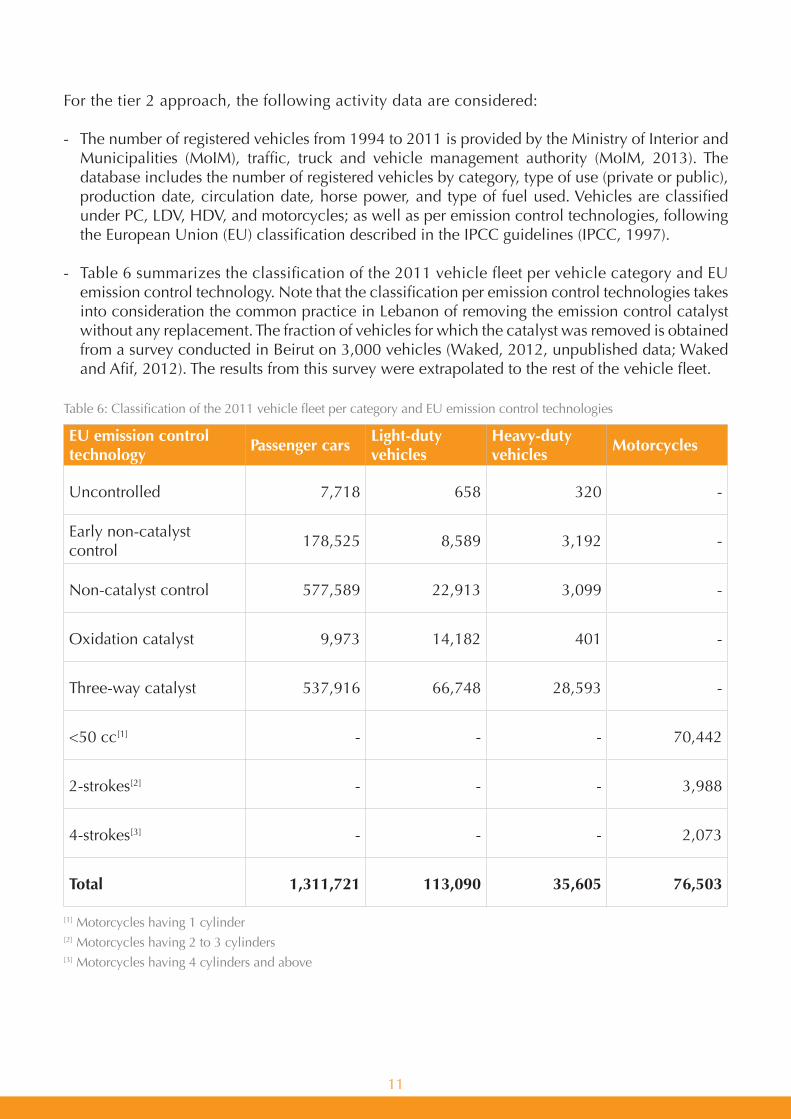
For the tier 2 approach, the following activity data are considered:
- The number of registered vehicles from 1994 to 2011 is provided by the Ministry of Interior and Municipalities (MoIM), traffic, truck and vehicle management authority (MoIM, 2013). The database includes the number of registered vehicles by category, type of use (private or public), production date, circulation date, horse power, and type of fuel used. Vehicles are classified under PC, LDV, HDV, and motorcycles; as well as per emission control technologies, following the European Union (EU) classification described in the IPCC guidelines (IPCC, 1997).
- Table 6 summarizes the classification of the 2011 vehicle fleet per vehicle category and EU emission control technology. Note that the classification per emission control technologies takes into consideration the common practice in Lebanon of removing the emission control catalyst without any replacement. The fraction of vehicles for which the catalyst was removed is obtained from a survey conducted in Beirut on 3,000 vehicles (Waked, 2012, unpublished data; Waked and Afif, 2012). The results from this survey were extrapolated to the rest of the vehicle fleet.
Table 6: Classification of the 2011 vehicle fleet per category and EU emission control technologies
EU emission control technology
Passenger carsLight-duty vehicles
Heavy-duty vehicles
Motorcycles
Uncontrolled 7,718 658 320 -
Early non-catalyst control
178,525 8,589 3,192 -
Non-catalyst control 577,589 22,913 3,099 -
Oxidation catalyst 9,973 14,182 401 -
Three-way catalyst 537,916 66,748 28,593 -
<50 cc[1] - - - 70,442
2-strokes[2] - - - 3,988
4-strokes[3] - - - 2,073
Total 1,311,721 113,090 35,605 76,503
[1] Motorcycles having 1 cylinder [2] Motorcycles having 2 to 3 cylinders [3] Motorcycles having 4 cylinders and above

12
- The annual travelled distance per vehicle category is considered. Due to field data unavailability, an assumption was made using the ForFITS (For Future Inland Transport Systems) database. ForFITS is a modeling tool intended to evaluate the transport activity, energy use and CO2 emissions, using transport data collected from different national and international transport related agencies (UNECE, 2014). For countries with mobility characteristics similar to Lebanon, a value of 12,000 km/year is estimated for passenger cars, 25,000 km/year for light-duty vehicles, 50,000 km/year for heavy-duty vehicles and 5,000 km/year for motorcycles.
Emission factors
Used emission factors for the tier 1 approach are the default values of the IPCC guideline for gasoline and diesel fuels, since no fuel-specific emission factors are established for Lebanon. Values are summarized in Table 7.
Table 7: Default EF for road transport under the tier 1 methodology
Activity data Fuel used CO2 CH4 N2O SO2 NOX CO NMVOCs
Road transport
Gasoline 18.9 20 0.6 43.75 600 8,000 1,500
Gas/diesel oil 20.0 5 0.6 135.72 800 1,000 200
Estimated emission factors for EU gasoline passenger cars
Emissions (g/km)
NOX CH4 NMVOCs CO N2O CO2
Three-way catalyst: assumed fuel economy 11.8 km/l (8.5 l/100 km)
0.5 0.02 0.5 2.9 0.05 205
Oxidation catalyst: assumed fuel economy 12.3 km/l (8.1 l/100 km)
1.4 0.07 1.4 7.5 0.005 190
Non-catalyst controls: assumed fuel economy 12.0 km/l (8.3 l/100 km)
2.3 0.07 4.5 19 0.005 200
Early non-catalyst controls: assumed fuel economy 10.6 km/l (9.4 l/100 km)
2.0 0.08 5.2 29 0.005 225
Uncontrolled: assumed fuel economy 8.9 km/l (11.2 l/100 km)
2.2 0.07 5.3 46 0.005 270
*CO2 EF are in tC/TJ while for CH4, N2O, SO2, NOx, CO and NMVOCs, EF are in kg/TJ.
For the tier 2 methodology, emission factors depend on the production date of vehicles, the vehicle category and the type of fuel used. Therefore, besides the classification per category, the vehicles are also categorized by model year of production, as illustrated in Figure 2. Default EU emission factors are used since no emission factors have been established yet for Lebanon, and on the other hand, the Lebanese vehicle fleet is mostly constituted of European vehicles, as shown in Figure 6 (MoF, 2011). Emission factors values are summarized in Table 8 to 12.
Table 8: Default EU emission factors for gasoline passenger cars under the tier 2 methodology

13
Table 9: Default EU emission factors for gasoline light-duty vehicles under the tier 2 methodology
Table 10: Default EU emission factors for diesel heavy-duty vehicles under the tier 2 methodology
Table 11: Default EU emission factors for motorcycles under the tier 2 methodology
Figure 6: Classification per country of origin of the 2010 Lebanese vehicle fleet (Customsregistercarsatimportasperthemanufacturingcountryalthough thecarmayhavebeenimportedfromanothercountry)
Numbers may reflect rounding.
Estimated emission factors for EU LDV gasoline cars
Emissions (g/km)
NOX CH4 NMVOCs CO N2O CO2
Moderate control: assumed fuel economy 7.4 km/l (13.6 l/100 km)
2.9 0.08 6.1 37 0.006 325
Estimated emission factors for EU HDV diesel cars
Emissions (g/km)
NOX CH4 NMVOCs CO N2O CO2
Moderate control: assumed fuel economy 3.3 km/l (29.9 l/100 km)
10 0.06 1.9 9 0.03 770
Estimated emission factors for motorcycles
Emissions (g/km)
NOX CH4 NMVOCs CO N2O CO2
Motorcycles < 50 ccUncontrolled: assumed fuel economy 41.7 km/l (2.4 l/100 km)
0.05 0.1 6.5 10 0.001 57
Motorcycles > 50 cc 2-strokesUncontrolled: assumed fuel economy 25.0 km/l (4.0 l/100 km)
0.08 0.15 16 22 0.002 95
Motorcycles > 50 cc 4-strokesUncontrolled: assumed fuel economy 19.6 km/l (5.1 l/100 km)
0.3 0.2 3.9 20 0.002 120
Europe
USA
KoreaJapan
China60%
8%4%
28%
<1%
14
Source | [1] 1994 to 1998 kerosene data are provided from IEA (IEA, 2014). 1999 to 2011 data are provided from MoEW (MoEW, 2014). [2] 1994 to 2011 data are estimated based on population and gasoline consumption (El Hage, 2014)
4.3. Aviation
Methodology
Aviation comprises international, national and military flights. According to the Directorate General of Civil Aviation (DGCA), 5,055 international private flights and 35,479 international commercial flights were recorded in 2008 of which around 30% were operated by MEA (CAS, 2014).
Domestic flights consist of the limited usage of small propeller-type aircrafts, used only for training. The fleet includes around 5 Cessna aircrafts operating on gasoline (AVGAS LBP 100) with an annual consumption ranging between 2 and 3 ktonnes. It remains non-significant when compared to the gasoline consumption for road transport (1,000 to 1,600 ktonnes).
Consequently, only emissions related to international aviation are accounted under international bunkers. Emissions related to national domestic aviation are reported in the national inventory.
The tier 1 methodology of the 1996 Revised IPCC Guidelines is used, where fuel consumption of jet kerosene for international aviation bunkers, gasoline for domestic aviation and gas/diesel oil for domestic navigation have been used with their associated emission factor.
Used emission factors correspond to the default values of the tier 1 methodology of the 1996 Revised IPCC Guidelines. Consequently, CO2 emissions are estimated using equation (2), emissions estimation for CH4, N2O, NOx, CO and NMVOCs using equation (3) and emissions estimation for SO2 are based on equation (4). Note that the tier 2 methodology is not considered for international civil aviation due to the lack of data on the types of aircrafts and their associated fuel consumption during landing/taking-off cycles and cruising.
Activity data
The activity data for international civil aviation includes the kerosene consumption for international bunkers and gasoline for domestic aviation. It is collected from the Ministry of Energy and Water (MoEW, 2014) and the International Energy Agency (IEA, 2014). The activity data in ktonnes/year are presented in Table 12 and Figure 7.
Domestic aviation gasoline consumption is estimated on a capita basis (personal communication with Captain Said El-Hage; El-Hage, 2014), then weighted by the population and extrapolated to cover the 1994-2011 yearly consumption (Table 12).
Table 12: Airplanes jet-kerosene for aviation bunkers and gasoline for domestic flights
Year 1994 1995 1996 1997 1998 1999 2000 2001 2002
Jet-kerosene in ktonnes[1] 146 103 107 109 107 126 125 128 127
Estimated jet-gasoline [2] 2.3 2.3 2.4 2.4 2.4 2.4 2.5 2.6 2.7
Year 2003 2004 2005 2006 2007 2008 2009 2010 2011
Jet-kerosene in ktonnes 125 127 147 104 140 167 175 221 224
Estimated jet-gasoline 2.8 3.0 3.1 3.1 3.2 3.2 3.3 3.3 3.4

15
Figure 7: Fuel imports for the aviation sector from 1994 to 2011
Emission factors
In the absence of specific Lebanese emission factors, default values of the IPCC tier 1 methodology are used (IPCC, 1997), and summarized in Table 13.
Table 13: Default emission factors for aviation
EFCO2
(tC/TJ)CH4
(kg/TJ)N2O(kg/TJ)
NOx
(kg/TJ)CO (kg/TJ)
NMVOCs (kg/TJ)
SO2
(kg/TJ)
Jet-kerosene 19.5 0.5 2 300 100 50 21.98
Jet-gasoline 18.9 0.5 0.6 300 100 50 43.75
4.4. Maritime transport
Methodology
Maritime transport encompasses international, national and military navigation. Activities related to fisheries are reported in the energy sector, under the category agriculture/forestry/fisheries (MoE/UNDP/GEF, 2015), and consequently, their emissions are not reported in this report. Emissions related to military maritime transport were not considered due to the unavailability of the activity data.
The IPCC tier 1 methodology is used, where fuel consumption for international marine bunkers and its associated emission factors are considered.
Activity data
The activity data for navigation is limited to the heavy fuel oil consumption for international bunkers and it is collected from the fuel imports data by the International Energy Agency (IEA, 2014). Fuel consumption in ktonnes/year is presented in Table 14.
250
200
150
100
50
0
4.0
3.0
2.0
1.0
0.0
Gasoline domestic aviation Kerosene aviation bunkers
16
Emission factors
Used emission factors correspond to the default values of the tier 1 methodology of the 1996 Revised IPCC Guidelines, summarized in Table 15. Consequently, direct and indirect GHG emissions are estimated using equations (2), (3) and (4). Note that the tier 2 methodology is not considered for maritime transport due to the lack of data on the types of ships (fisheries, cargo, container, tankers, etc.) and the fuel consumption for each type of ship during hostelling, maneuvering and cruising.
Default values of the IPCC tier 1 methodology are used (IPCC, 1997), and summarized in Table 15.
Table 15: Default emission factors for maritime transport
Table 14: Fuel consumption for marine bunkers (ktonnes/year)
EFCO2
(tC/TJ)CH4
(kg/TJ)N2O(kg/TJ)
NOx
(kg/TJ)CO (kg/TJ)
NMVOCs (kg/TJ)
SO2
(kg/TJ)
Marine bunkers 21.1 5 0.6 1,500 1,000 200 1,463.20
Actions Parameters assessed Uncertainty estimation
Judgment of the activity data used for the tier 1 methodology for international aviation bunkers.
Fuel imports data for kerosene are collected from different sources (MoEW and IEA).
15%
Judgment of the activity data used for the tier 1 methodology for international marine bunkers.
Fuel imports data for fuel oil are collected from the IEA.
50%
Judgment of the activity data used for the tier 1 methodology for national navigation, national aviation and off-road transport.
Fuel consumption data estimated from the IPT (IPT, 2014) and from DGCA (El-Hage, 2014).
50%
4.5. Uncertainty assessment
QA/QC of data
The QA/QC procedure for the validation of activity data as well as the emission factors used in tier 1 and tier 2 methodologies are presented in Table 16.
Table 16: QA/QC data procedure
Year 1994 1995 1996 1997 1998 1999 2000 2001 2002
Marine bunkers 12.00 13.00 14.00 14.00 15.00 15.00 15.00 16.00 17.00
Year 2003 2004 2005 2006 2007 2008 2009 2010 2011
Marine bunkers 18.00 19.00 19.00 19.00 20.00 22.00 24.00 26.00 27.00

17
Actions Parameters assessed Uncertainty estimation
Judgment of the emission factors used for the tier 1 methodology for international and national aviation, marine bunkers as well as off-road transport.
Default emission factors of the Revised 1996 IPCC Guidelines are used, since no fuel-specific emission factors are established for Lebanon.
CO2 5%
CH4 factor of 2
N2O factor of 10
Judgment of the activity data used for the tier 1 methodology for road transport.
Fuel imports data for gasoline, and gas/diesel oil are collected from different sources (MoF, MoEW, IEA and World Bank).
10%
Judgment of the emission factors used for the tier 1 methodology for road transport.
CO2 5%
CH4 40%
N2O 50%
Judgment of the activity data used for the tier 2 methodology.
Due to the lack of activity data from different sources, a qualitative uncertainty assessment is performed.
Activity data assessed are: the number of registered vehicles, the annual travelled distance by vehicle category and the number of vehicles not equipped with a catalyst for emissions control.
1. Data on the number of vehicles provided by public institutions have a low uncertainty in the range of 2 to 5%.
2. Data on annual travelled distance have moderate uncertainty since they are based on estimated values.
3. Data on the survey conducted in Beirut have also moderate uncertainties since they are specific for Beirut and are applied to Lebanon in this inventory.
Judgment of the emission factors used for the tier 2 methodology.
EU emission factors used for the tier 2 methodology.
EU emission factors have moderate uncertainty since they are not specific to the Lebanese fleet. However, they are specific to Mediterranean countries. Their reported uncertainties according to the European Monitoring and Evaluation Programme/European Environmental Agency (EMEP/EEA) guide book are in the range of 50-200% for the road transport section (EMEP/EEA, 2013).

18
Calculation method
Actions assessed Uncertainty estimation
Tier 1 methodology
Verification of quantities of fuel imports from different sources (IEA, MoEW and MoF).
The obtained results show differences of less than 1%.
Verification of the calculation through multiple checks of the calculation files.
Comparison of the obtained emissions results to the results generated in the SNC from 2000 to 2006.
Obtained results are comparable (Annex III).
Tier 2 methodology
Verification of the number of registered vehicles from 1994 to 2006 from two sources (MoIM and MoE).
The results show a difference of less than 2%.
Verification of the annual travelled distance as well as the annual fuel consumption for each vehicle category.
The annual travelled distance per vehicle are estimated from ForFITS on the basis of the following considerations:
- Information from household/travel surveys in developed countries as a reference;
- By means of assuming the average speed (km/h) and vehicle usage (hours/day and days/week).
The obtained annual travelled distances were verified by checking the consistency of the assumptions and the statistics on the number of vehicles in the stock, their average travel and their average fuel consumption with the total energy use.
Verification of the use of the appropriate EF for final calculation.
Since local EF do not exist, and to make IPCC EF more appropriate to Lebanese conditions, the absence of a catalyst, the car manufacturer, and the climatic conditions were taken into account in the choice of the EF.
Verification of the calculation through multiple checks of the calculation files.
Comparison between the results of tier 1 methodology and tier 2 methodology (Annex II).
The obtained results show consistency between the two methodologies for CO2, NOx, CH4 and SO2. For N2O, emissions under the tier 2 methodology were overestimated while CO and NMVOCs were underestimated.
QA/QC of calculation process
The QA/QC procedure for the emissions calculation process for tier 1 and tier 2 methodologies are presented in Table 17.
Table 17: QA/QC of the calculation process procedure

19
5. Results and discussion
The results of the GHG emissions from the transport sector include the road transport sub-category; as well as domestic aviation since as per the 1996 Revised Guidelines, international aviation and maritime transport are not considered as national emissions and are categorized under bunkers. Therefore, emissions from international aviation and marine activities are not included in the total emissions of the transport sector.
The results of this GHG emissions inventory encompass both years 2005 and 2010 since the last inventory reported emissions up to 2004 (MoE/UNDP/GEF, 2011).
5.1. Transport sector GHG inventory for 2005
In 2005, GHG emissions from transport totaled 3,629 Gg (Gigagram or 1,000 tonnes) CO2eq. Carbon dioxide, methane, and nitrous oxide constitute 3,550, 0.85, and 0.20 Gg, respectively. Consequently, they contribute to 97.8%, 0.5%, and 1.7% of total CO2eq. respectively for 2005 (Table 18).
Table 18: Transport sector GHG emissions for the base year 2005
CO2eq. CO2 CH4 N2O
Emissions (Gg) 3,629 3,550 0.85 0.20
Contribution 97.8% 0.5% 1.7%
AGlobalWarningPotential (GWP)of1wasused forCO2, 21 forCH4and310 forN2O, as per the IPCC Second
AssessmentReport(SAR),1995.
As for the contribution of the different categories to total emissions, road transport is by far the largest contributor, emitting 3,619.23 Gg CO2eq. in 2005. These emissions are distributed over the three direct GHGs as shown in Figure 8. The values are calculated using the tier 2 methodology with EU emission factors as the Lebanese fleet is mostly constituted of European vehicles (Figure 6). The contribution did not vary significantly on a relative basis compared to 1994 where CO2 contributed to 98.62%.
Figure 8: Distribution of the different direct GHGs for the road transport category for 2005
97.8%
1.7%0.5%
CO2
CH4 (CO2eq.)
N2O (CO2eq.)

20
Category CO2eq. NOx CO NMVOCs SO2
PC 2,216.957 19.162 184.268 39.096 1.300
LDV 578.435 5.106 65.143 10.740 0.347
HDV 818.651 10.488 9.439 1.993 1.534
Motorcycles 5.186 0.005 0.897 0.563 0.003
Total 3,619.2 34.8 259.8 52.4 3.2
As for the contribution of the different vehicle categories, passenger cars have the highest share of the 2005 emissions with 61.25% of the total road transport GHG emissions (CO2eq.), while LDV, HDV, and motorcycles account for 15.98%, 22.63%, and 0.14% respectively. The contribution of the different vehicle categories to emissions of direct GHGs shows that passenger cars contribute the most. LDV is an important contributor to methane and HDV to CO2 and nitrous oxide, as illustrated in Figure 9.
Figure 9: Contribution of the different vehicle categories to the direct GHG emissions for 2005
Indirect GHG emissions from the road transport sector in 2005 account for around 35 Gg for NOx, 260 Gg for CO, 52 Gg for NMVOCs and 3 Gg for SO2 (Table 19). Emissions per vehicle category are dominated by passenger cars. HDV contribution to SO2 emissions is considerable as HDV uses diesel fuel with higher sulphur content than gasoline used for PC.
Table 19: Indirect GHG emissions for the transport sector in Gg in 2005
PC PC
HDV HDV
LDV LDV
Motorcycles Motorcycles
61.25%15.98%
22.63%
75%
17%
7%
1%0.14%
N2O
CO2 CH4
79%
5%
16%
PC
HDV
LDV

21
International bunkers
For international bunkers, the total direct GHG emissions from aviation and marine amounted to 519 Gg of CO2eq. in 2005. Around 89% of these direct GHG emissions originated from aviation. The GHG emissions results from international bunkers are given in Table 20.
Table 20: Direct GHG emissions from international bunkers in Gg/year in 2005
Category CO2 (Gg) CH4 (Gg) N2O (Gg)Total emissions CO2eq. (Gg)
Aviation bunkers 459 0.003 0.004 460.61
Marine bunkers 58 0.004 0.0005 58.73
CO2eq. CO2 CH4 N2O
Emissions (Gg) 5,423.98 5,279.03 1.14 0.398
Contribution 97.33% 0.44% 2.23%
5.2. Transport sector GHG inventory for 2010
In 2010, GHG emissions from transport totaled 5,423.98 Gg CO2eq. Carbon dioxide, methane and nitrous oxide constitute 5,279.03, 1.14, and 0.39 Gg respectively. Consequently, they contribute to 97.33%, 0.44%, and 2.23% of total CO2eq. respectively for 2010 (Table 21).
Table 21: Transport sector GHG emissions in 2010
AGWPof1wasusedforCO2,21forCH4and310forN2O.
As for the contribution of the different categories to total emissions, road transport is by far the largest contributor with 5,268.79 Gg CO2eq. in 2010. These emissions are distributed over the three direct GHGs as shown in Figure 10. The values are calculated using tier 2 methodology with EU emission factors as the Lebanese fleet is mostly constituted of European vehicles (Figure 6). The contribution did not vary significantly on a relative basis compared to 1994 during which CO2 contributed to 98.62%.
Figure 10: Distribution of the different direct GHGs for the road
transport category for 2010
CO2
N2O (CO2eq.)
CH4 (CO2eq.)97.33%
2.23%0.44%

22
As for the contribution of the different vehicle categories, passenger cars have the highest share of the 2010 emissions, with 58.38% of the total road transport GHG emissions (CO2eq.); while LDV, HDV, and motorcycles account for 17.46%, 23.81%, and 0.35% respectively. The contribution of the different vehicle categories to emissions of direct GHGs shows that passenger cars contribute the most. LDV is an important contributor to methane and HDV to CO2 and nitrous oxide, as illustrated in Figure 11.
Figure 11: Contribution of the different vehicle categories to the direct GHG emissions for 2010
Indirect GHG emissions from the road transport sector in 2010 account for around 48 Gg for NOx, 339 Gg for CO, 68 Gg for NMVOCs and 5 Gg for SO2 (Table 22). Emissions per vehicle category are dominated by passenger cars. HDV contribution to SO2 emissions is considerable as HDV uses diesel fuel with higher sulphur content than gasoline used for PC.
Table 22: GHG emissions for the transport sector in Gg for the base year of 2010
Category CO2eq. NOx CO NMVOCs SO2
PC 3,160.253 23.294 214.420 45.617 1.834
LDV 945.067 8.342 106.433 17.547 0.567
HDV 1,289.173 16.516 14.864 3.138 2.416
Motorcycles 19.156 0.018 3.302 2.099 0.011
Total 5,413.6 48.2 339.0 68.4 4.8
PC
PC
PC
HDV
HDV
HDV
LDV
LDV
LDV
MotorcyclesMotorcycles
58.38%17.46%
23.81%
68%
20%
9%
3%0.35%
N2O
CO2 CH4
83%
4% 13%
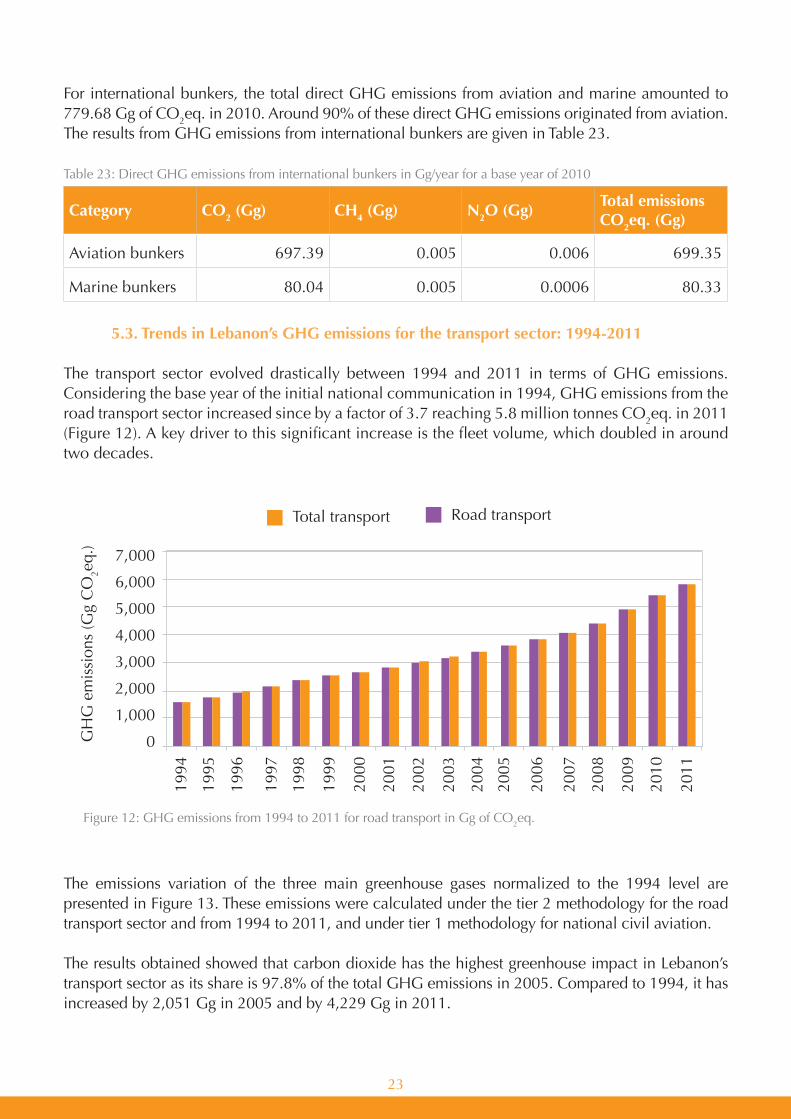
23
For international bunkers, the total direct GHG emissions from aviation and marine amounted to 779.68 Gg of CO2eq. in 2010. Around 90% of these direct GHG emissions originated from aviation. The results from GHG emissions from international bunkers are given in Table 23.
Table 23: Direct GHG emissions from international bunkers in Gg/year for a base year of 2010
The emissions variation of the three main greenhouse gases normalized to the 1994 level are presented in Figure 13. These emissions were calculated under the tier 2 methodology for the road transport sector and from 1994 to 2011, and under tier 1 methodology for national civil aviation.
The results obtained showed that carbon dioxide has the highest greenhouse impact in Lebanon’s transport sector as its share is 97.8% of the total GHG emissions in 2005. Compared to 1994, it has increased by 2,051 Gg in 2005 and by 4,229 Gg in 2011.
Category CO2 (Gg) CH4 (Gg) N2O (Gg)Total emissions CO2eq. (Gg)
Aviation bunkers 697.39 0.005 0.006 699.35
Marine bunkers 80.04 0.005 0.0006 80.33
5.3. Trends in Lebanon’s GHG emissions for the transport sector: 1994-2011
The transport sector evolved drastically between 1994 and 2011 in terms of GHG emissions. Considering the base year of the initial national communication in 1994, GHG emissions from the road transport sector increased since by a factor of 3.7 reaching 5.8 million tonnes CO2eq. in 2011 (Figure 12). A key driver to this significant increase is the fleet volume, which doubled in around two decades.
Figure 12: GHG emissions from 1994 to 2011 for road transport in Gg of CO2eq.
7,000
6,000
5,000
4,000
3,000
2,000
1,000
0
Total transport Road transport
GH
G e
mis
sion
s (G
g C
O2e
q.)

24
CO2 emissions from the transport sector increased by a factor of 3.63 compared to the 1994 level i.e. from 1,555.19 to 5,645.14 Gg while methane emissions have increased by a factor of 2.57 i.e. from 0.46 Gg to 1.2 Gg. This is mainly due to the remarkable growth in the vehicle fleet number. Similarly, nitrous oxide has also increased in 2011 by a significant factor of 10.79 compared to the 1994 level, i.e. from 0.04 Gg to 0.4 Gg due to the fact that vehicles equipped with technologies for emission control are suspected to emit higher amounts of nitrous oxide (IPCC, 1997).
For indirect GHGs, an increase by at least a factor of 2 was observed in 2011 in comparison to 1994. Figure 14 presents the evolution of NOx, CO, NMVOCs and SO2 from 1994 to 2011.
Figure 13: Variation of the emissions of CO2, CH4, and N2O relative to the 1994 level
Figure 14: Evolution of NOx, CO, NMVOCs and SO2 from 1994 to 2011
NM
VO
Cs
1,200%
1,000%
800%
600%
400%
200%
0%
1994
Carbon dioxide
Methane
Nitrous oxide
1997 2000 2003 2006 2009 2012
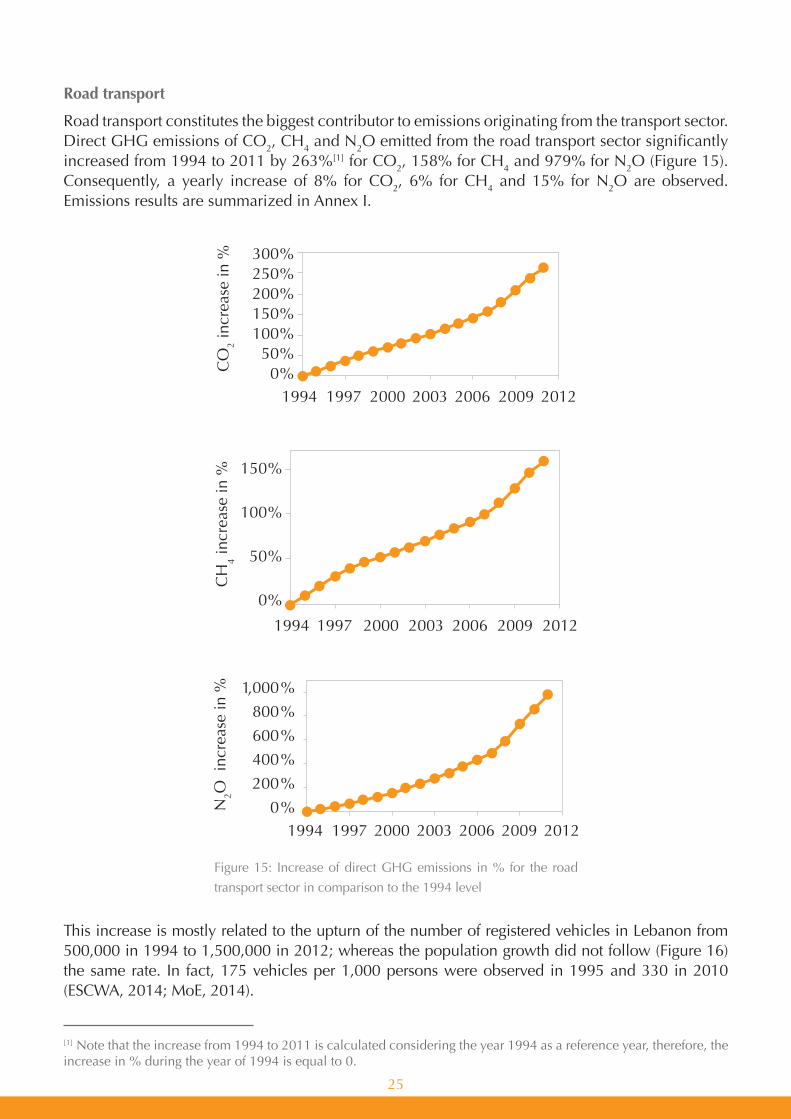
25
Road transport
Road transport constitutes the biggest contributor to emissions originating from the transport sector. Direct GHG emissions of CO2, CH4 and N2O emitted from the road transport sector significantly increased from 1994 to 2011 by 263%[1] for CO2, 158% for CH4 and 979% for N2O (Figure 15). Consequently, a yearly increase of 8% for CO2, 6% for CH4 and 15% for N2O are observed. Emissions results are summarized in Annex I.
This increase is mostly related to the upturn of the number of registered vehicles in Lebanon from 500,000 in 1994 to 1,500,000 in 2012; whereas the population growth did not follow (Figure 16) the same rate. In fact, 175 vehicles per 1,000 persons were observed in 1995 and 330 in 2010 (ESCWA, 2014; MoE, 2014).
Figure 15: Increase of direct GHG emissions in % for the road
transport sector in comparison to the 1994 level
,
[1] Note that the increase from 1994 to 2011 is calculated considering the year 1994 as a reference year, therefore, the increase in % during the year of 1994 is equal to 0.
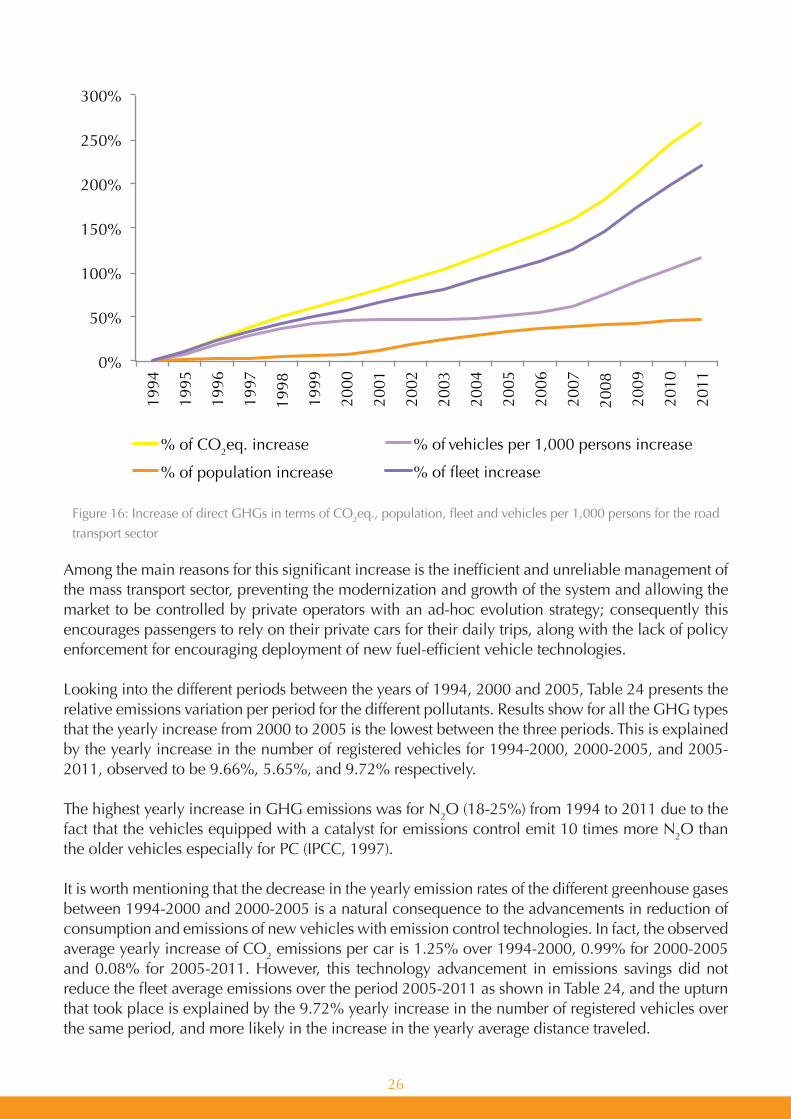
26
Among the main reasons for this significant increase is the inefficient and unreliable management of the mass transport sector, preventing the modernization and growth of the system and allowing the market to be controlled by private operators with an ad-hoc evolution strategy; consequently this encourages passengers to rely on their private cars for their daily trips, along with the lack of policy enforcement for encouraging deployment of new fuel-efficient vehicle technologies.
Looking into the different periods between the years of 1994, 2000 and 2005, Table 24 presents the relative emissions variation per period for the different pollutants. Results show for all the GHG types that the yearly increase from 2000 to 2005 is the lowest between the three periods. This is explained by the yearly increase in the number of registered vehicles for 1994-2000, 2000-2005, and 2005-2011, observed to be 9.66%, 5.65%, and 9.72% respectively.
The highest yearly increase in GHG emissions was for N2O (18-25%) from 1994 to 2011 due to the fact that the vehicles equipped with a catalyst for emissions control emit 10 times more N2O than the older vehicles especially for PC (IPCC, 1997).
It is worth mentioning that the decrease in the yearly emission rates of the different greenhouse gases between 1994-2000 and 2000-2005 is a natural consequence to the advancements in reduction of consumption and emissions of new vehicles with emission control technologies. In fact, the observed average yearly increase of CO2 emissions per car is 1.25% over 1994-2000, 0.99% for 2000-2005 and 0.08% for 2005-2011. However, this technology advancement in emissions savings did not reduce the fleet average emissions over the period 2005-2011 as shown in Table 24, and the upturn that took place is explained by the 9.72% yearly increase in the number of registered vehicles over the same period, and more likely in the increase in the yearly average distance traveled.
Figure 16: Increase of direct GHGs in terms of CO2eq., population, fleet and vehicles per 1,000 persons for the road
transport sector
0%
50%
100%
150%
200%
250%
300%
1994
1995
1996
1997
1998
1999
2000
2001
2002
2003
2004
2005
2006
2007
2008
2009
2010
2011
% of CO2eq. increase
% of population increase
% of vehicles per 1,000 persons increase
% of fleet increase

27
Table 24: Trends of road transport emissions in Gg/year and in % during the period 1994-2011
Number of vehicles
CO2 (Gg) CH4 (Gg) N2O (Gg) NOx (Gg) CO (Gg)NMVOCs (Gg)
SO2 (Gg)
1994 479,120 1,548.18 0.46 0.04 16.14 150.99 29.97 1.20
2000 756,885 2,629.29 0.71 0.10 27.19 218.86 44.38 2.25
2005 970,803 3,540.62 0.85 0.20 34.76 259.75 52.39 3.18
2011 1,536,919 5,634.81 1.19 0.44 50.59 351.91 71.05 5.18
Yearly increase (%) 1994-2000
9.66 11.64 8.67 25.29 11.41 7.49 8.01 14.63
Yearly increase (%) 2000-2005
5.65 6.93 4.14 18.20 5.57 3.74 3.61 8.30
Yearly increase (%) 2005-2011
9.72 9.86 6.72 20.89 7.59 5.91 5.93 10.43
The trend in direct and indirect emissions from 1994 to 2011 shows that PC are the major contributor (Figure 17), with CO2 emissions in 2011 accounting for more than threefold when compared to 1994. LDV and HDV present comparable emissions trends for CO2, N2O and NOx, however HDV show a double SO2 trend despite the lower number of HDV compared to LDV (2% HDV and 7% LDV in 2012) (Figure 18). This is due to the high sulphur content contained in diesel. Note that the contribution of motorcycles shows an upturn of NMVOCs since 2006, as the number has increased by 5% compared to 1994 to reach 84,000 motorcycles in 2012.

28
Figure 17: Evolution of the road transport emissions between 1994 and 2011

29
Figure 18: Percentage distribution of road motorized vehicles from 1994 to 2011
Figure 19: Comparisons of GHG emissions of CO2 and CH4 with the use of the tier 1 and tier 2 for the road transport sector
Comparison of road transport calculations methodologies
Comparison between tier 1 and tier 2 methodologies for the road transport sector showed comparable values for CO2 and CH4 from 2004 to 2011 (Figure 19) whereas N2O emissions among both methodologies were different.
2001
2002
2003
2004
2005
2006
2007
2008
2009
2010
2011
2001
2002
2003
2004
2005
2006
2007
2008
2009
2010
2011
2001
2002
2003
2004
2005
2006
2007
2008
2009
2010
2011
2001
2002
2003
2004
2005
2006
2007
2008
2009
2010
2011

30
Figure 20: Evolution of direct GHG emissions from 1994 to 2011 for international marine bunkers
Observed significant differences between tier 1 and tier 2 methodologies for nitrous oxide are mostly related to the fact that under the tier 2 methodology, newer vehicles emit 10 times more N2O when compared to old vehicles because of the introduction of emission control technologies. For this purpose, N2O calculated emissions for both methodologies are comparable from 1994 to 1998 and are different from 2000 to 2011. In term of CO2eq. emissions, the recorded direct GHG emissions for a base year of 2000 is 2,675.90 Gg under the tier 2 methodology and 4,503.43 Gg if tier 1 was used. The tier 1 reported value in this study for a base year of 2000 is therefore higher by a factor of 1.14 to that of the SNC (3,963 Gg; MoE/UNDP/GEF, 2011). The differences observed between SNC and TNC values are mainly related to the use of different estimation methodologies for gas/diesel consumption for the road transport sector.
International marine bunkers
The trend of direct GHG emissions from 1994 to 2011 in terms of CO2eq., presented in Figure 20, shows an increase for marine international bunkers from 1994 to 2011. The period from 2005 to 2011 has the highest relative yearly increase with 7%, whereas periods from 1994-2000 and 2000-2005 showed an increase by 4% and 5%, respectively.
The 7% yearly increase in GHG emissions from 2005 to 2011 is partly related to the increase in the number of imports/exports of cargo at the Beirut port (Figure 21) with an average value from 2005 to 2011 of 5,605,000 tonnes in comparison to a value of 4,983,000 tonnes from 2000 to 2005. In addition, United Nations Interim Force in Lebanon (UNIFIL) ships’ consumption could have also contributed to the increase in GHG emissions over this same period.

31
Figure 21: Loaded and unloaded cargo in Beirut and Tripoli ports from 2000 to 2011
Figure 22: Evolution of direct GHG emissions from 1994 to 2012 for international aviation bunkers
International aviation bunkers
Aviation bunkers only take into account international flights. The study of the trend from 1994 to 2011 shows that direct emissions were steady from 1994 till 2005, they increased between 2008 and 2011 and decreased significantly during the year of 2006 (Figure 22). The decrease in emissions during the year of 2006 is mainly related to the war that occurred in the typical tourism period of the summer. Consequently, only 32,980 flights (landing and taking off) were recorded in 2006 in comparison to a value of 38,196 for 2005 and a value of 39,060 for 2007 (CAS, 2014). The increase in emissions from 2008 to 2011 is mostly related to the increase in the yearly number of departures and arrivals at the BIA (Figure 23).

32
Figure 23: Number of arrivals and departures of aircrafts at the BIA between 1994 and 2011
*R is the correlation coefficient that measures the interdependence of two random variables. It ranges from -1 to +1
indicating perfect negative correlation at -1, absence of correlation at 0 and perfect positive correlation at +1.
5.4. Indicators and comparison with other countries
The results obtained for direct and indirect GHG emissions from the road transport sector increased significantly from 1994 to 2011. This observed increase in emissions is related to the increase in the number of registered vehicles, population growth and the GDP per capita. Indeed, correlation coefficients R between the GDP per capita (World Bank, 2014), vehicle per capita, population and GHG show values above 0.9 (Table 25) which indicates that a linear correlation exists between the two variables considered for this analysis. This explains how the growth of GDP per capita is causing the observed evolution in the number of vehicles per 1,000 persons, as passengers purchase more private cars to cover their mobility needs in the absence of alternative mass transport systems (Waked and Afif, 2012). Consequently, more GHG emissions are generated.
Table 25: Correlation between GDP/capita, veh/capita and GHG emissions
CO2 CH4 N2O NOx CO NMVOCs SO2
R* (veh/capita vs. GHG) 1994 to 2011
0.96 0.96 0.94 0.96 0.96 0.96 0.96
R (GDP/capita vs. GHG) 1994 to 2011
0.95 0.95 0.94 0.94 0.95 0.95 0.94
R (population vs. GHG)1994 to 2011
0.96 0.96 0.94 0.96 0.96 0.96 0.96
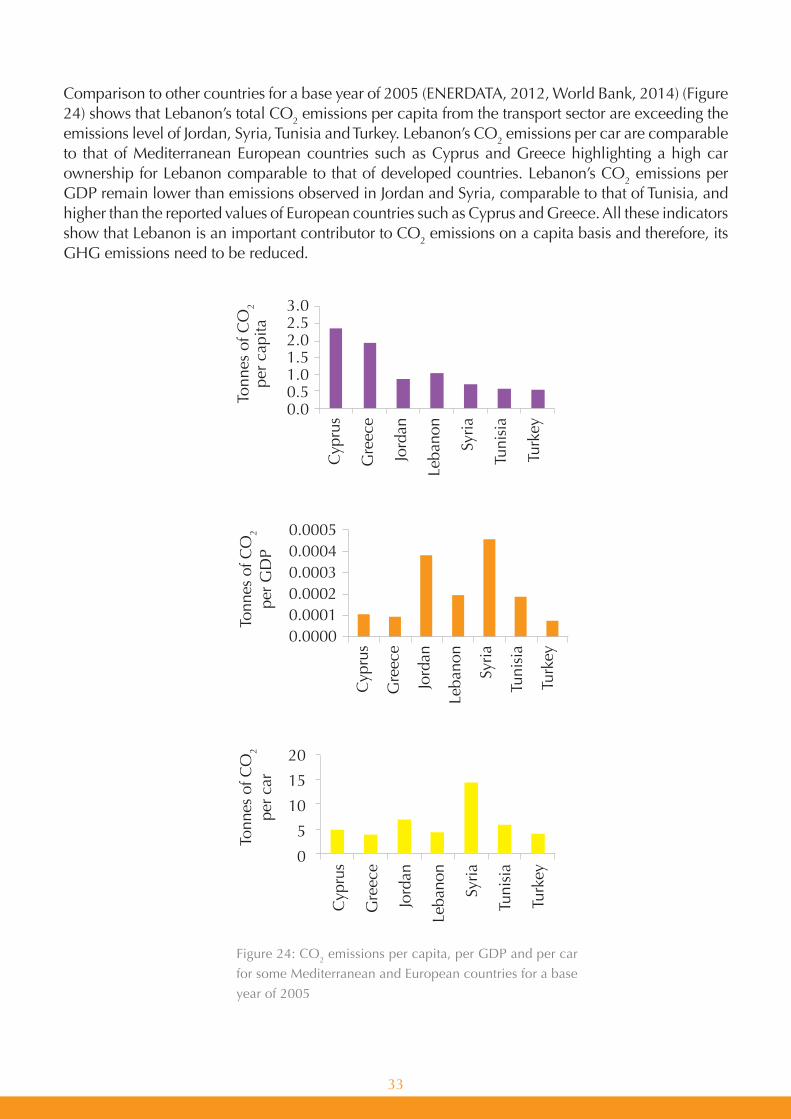
33
Comparison to other countries for a base year of 2005 (ENERDATA, 2012, World Bank, 2014) (Figure 24) shows that Lebanon’s total CO2 emissions per capita from the transport sector are exceeding the emissions level of Jordan, Syria, Tunisia and Turkey. Lebanon’s CO2 emissions per car are comparable to that of Mediterranean European countries such as Cyprus and Greece highlighting a high car ownership for Lebanon comparable to that of developed countries. Lebanon’s CO2 emissions per GDP remain lower than emissions observed in Jordan and Syria, comparable to that of Tunisia, and higher than the reported values of European countries such as Cyprus and Greece. All these indicators show that Lebanon is an important contributor to CO2 emissions on a capita basis and therefore, its GHG emissions need to be reduced.
Cyp
rus
Gre
ece
Jord
an
Leba
non
Syria
Tuni
sia
Turk
ey
Cyp
rus
Gre
ece
Jord
an
Leba
non
Syria
Tuni
sia
Turk
ey0.00050.00040.00030.00020.00010.0000
Tonn
es o
f CO
2
per G
DP
Cyp
rus
Gre
ece
Jord
an
Leba
non
Syria
Tuni
sia
Turk
ey
20
15
10
5
0
Tonn
es o
f CO
2
per c
ar
Figure 24: CO2 emissions per capita, per GDP and per car
for some Mediterranean and European countries for a base
year of 2005

34
Part 2: Mitigation analysis
6. Scope
This section has been developed in the framework of Lebanon’s Third National Communication (TNC) to the United Nations Framework Convention on Climate Change (UNFCCC). It covers the preparation of the mitigation options analysis for the transport sector, which consist in (1) the elaboration of a baseline scenario to project Greenhouse Gas (GHG) emissions from the transport sector for the short-term (2020) and medium-term (2040) under Business as Usual (BAU) conditions, and (2) the proposition of mitigation options and calculation of their emission reduction potential for 2020 and 2040.
This section builds on the results of model runs applied to the transport sector in Lebanon using the For Future Inland Transport Systems model (ForFITS), a modeling tool developed in the context of a project of the United Nations Economic Commission for Europe (UNECE) and intended to assess transport CO2 emissions and to evaluate potential policies to mitigate them (UNECE, 2013). Key parameters discussed in this report include in particular vehicle stock, transport activity, energy use and CO2 emissions.
This section concludes with the formulation of a set of actions for the definition of transport policies having implications for climate change mitigation, leveraging on the results of the ForFITS runs and the assessed mitigation scenarios.
7. Introduction
Eradicating the problems of the Lebanese transport sector is neither affordable, nor economically feasible. However, much can be done to reduce and lessen the burden of their negative impacts on travelers and the government. Hence, effectively managing this sector requires both a holistic and integrated strategy that goes beyond the visible incidence of these problems and the scope of this study, and extends to setting a national transport strategy managing all transport services as a whole.
The Technology Needs Assessment (TNA) report for the transport sector prepared by the MoE/United Nations Development Programme (UNDP) in 2012 tackled the needs to deploy an efficient “mass transit system” in the Greater Beirut Area (GBA) and to “renew the passenger cars fleet with fuel-efficient and hybrid electric vehicles”: two mitigation options that were highly prioritized by transport experts and stakeholders gathered for the purpose of identifying the technology needs for the transport sector. Consequently, the TNA highlighted the barriers as well as the measures and enabling framework to deploy these options (MoE/URC/GEF, 2012).
As a complement to the TNA, this study synthesizes the projection assessments of these two options, underlined in the report as mitigation options “shift to mass transport” and “shift to fuel-efficient and hybrid electric vehicles”. It emphasizes their impact on the transport activity, energy use and CO2 emissions by the years 2020 and 2040, and concludes with action plans for their deployment.

35
8. Existing and planned mitigation actions
Few are the mitigation actions that addressed the problems pertaining to the transport sector over the last decade. The enacted decrees and laws mostly concerned improving the air quality and reorganizing the land public transport sector.
Some of the measures tackled indirectly reducing GHG emissions of the transport sector, such as decree no. 8243/2003 requiring mandatory annual vehicle inspection, which consequently force drivers to annually control the engine operation; and the Lebanese customs restriction on used cars, banning the import of vehicles older than 8 years.
In 2014, the Ministry of Public Works and Transport (MoPWT) presented to the Council of Ministers (CoM) the master plan to revitalize the land public transport for passengers. It encloses a set of actions to be implemented on the short and medium terms, shifting the passenger transport demand to mass transit systems. The main actions with direct impact on reducing GHG emissions are:
On the short-term:
− Implementation of phase 1 of the rail transportation plan, namely the lane connecting the port of Tripoli to the Syrian border;
− Revitalization and restructuring of the operation of public buses inside the cities;
− Continuation of the development project of traffic management in GBA;
− Improvement of the pedestrian infrastructure.
On the long-term:
− Deployment of a Bus Rapid Transit (BRT) on Beirut’s north and south gates, commuting Jounieh to Jiyeh;
− Development of a mass transit system covering territories all over Lebanon and commuting cities;
− Restructuring the freight transport.

36
9. Proposed mitigation analysis
9.1. Methodology
Modeling framework: transport system characteristics
The mitigation options analysis has been performed using ForFITS, a modeling tool that converts information on transport activity into fuel consumption and CO2 emission estimates considering the influence of the demographic and socio-economic context, including policy inputs (UNECE, 2013). The study covers passenger and freight mobility services on inland transport modes, taking into consideration the different vehicle classes, powertrains and fuel blends consistent with the technology requirements. Table 26 characterizes the modal and sub-modal levels considered in the modeling framework. Note that non-motorized transport (walking and cycling), aviation and maritime transport were excluded from the study. Freight transport was only considered in the baseline scenario in order to weigh its energy use and CO2 emissions evolution with respect to passenger transport. It was excluded from the mitigation scenario projections as the scope of this study considers only mitigation measures for passenger transport.
Table 26: Transport modal characteristics considered in the ForFITs model
Urban and non-urban
Passenger Freight
Motorcycles Light-duty vehicles Large roadsLight-duty vehicles
Large roads
Smal
l m
otor
cycl
es a
nd
scoo
ters
(eng
ine
not e
xcee
ding
50
cm
3 )
Inte
rnal
Com
bust
ion
Engi
ne (I
CE)
Gas
olin
e
Smal
l lig
ht
vehi
cles
(unl
aden
ke
rb m
ass
< 1
t)
ICE
and
hybr
id e
lect
ric
Gas
olin
e
Bus
es (c
arry
mor
e th
an 8
sea
ted
pass
enge
rs)
ICE
Gas
olin
e/di
esel
Ligh
t com
mer
cial
veh
icle
s
ICE
Gas
olin
e
Med
ium
and
hea
vy-d
uty
vehi
cles
ICE
Die
sel
Mot
orcy
cles
(e
ngin
e ex
ceed
ing
50
cm3 )
Mid
size
ligh
t ve
hicl
es
(unl
aden
ke
rb m
ass
≥ 1
t and
< 1
.5
t)
Thre
e-w
heel
ers
Larg
e lig
ht
vehi
cles
(u
nlad
en
kerb
mas
s ≥
1.5
t)
Taxi
Transport zonesTransport servicesTransport modes
Vehicle classesPowertrain technologiesFuel blends

37
Calculation methodology
The study provides yearly projection figures on vehicle stock, transport activity, energy use and CO2 emissions as presented in Table 27, to help understand and assess trends in the evolution of the transport sector in 2020 and 2040.
Table 27: Output parameters of the ForFITS model
The evaluation of energy use and CO2 emissions is performed using the Activity, Structural components, energy Intensity and Fuel use (ASIF) framework of equations (5) and (6), based on the decomposition of fuel use into transport activity, energy intensity and structural components, such as the type of transport service (passenger vs. freight), mode, vehicle class and powertrain group. This methodology is used by the International Energy Agency (IEA) in its Mobility Model (MoMo), and is known as Parc, Utilization, Consumption and Emissions (PUCE), which works to ensure consistency between the vehicle parc (stocks), utilization (travel per vehicle), consumption (energy use per vehicle, i.e. fuel economy) and emissions (fuel CO2 emission factors) (OECD/IEA, 2012).
F = ∑Fi = A∑(Ai /A)(Fi /Ai) = A∑SiIi
F total fuel use
A overall vehicle activity (in vehicle-kilometer (vkm))
Fi fuel used by vehicle (i) with a given set of characteristics (by service, mode, vehicle class and powertrain)
Si sectoral structure (expressed as shares of vkm by service, mode, vehicle class and powertrain)
Ii energy intensity (the average fuel consumption per vkm by service, mode, vehicle class and powertrain)
Output parameter Unit Description
Vehicle stock Vehicles
The annual number of vehicles in the fleet stock, provided by transport mode (motorcycles, passenger LDV and buses), and by vehicle class for passenger LDV (small, midsize and large vehicles).
Passenger transport activity
Vehicle-km The annual vehicles overall distance travel activity.
Energy usetoe (tonne-oil-equivalent)
The annual overall fuel consumed by vehicles. For consistency, gasoline and diesel consumption units are converted to tonne-oil-equivalent.
CO2 emissions GgThe annual overall tank-to-wheel CO2 emissions from vehicles.

38
E = ∑Ei = A∑(Ai /A)(Fi /Ai )(Fij /Fi)(Eij /Fij) = A∑SiIiEFij
E total emissions use
Ei emissions generated per vehicle (i) (by service, mode, vehicle class and powertrain)
Fij fuel (j) used in the vehicle (i)
EFij emission factor for the fuel (j) used in the vehicle (i)
These equations constitute the basis of the ForFITS model structure for the calculations per year. They depend on the transport activity expressed as shares of vehicle-kilometer per service, mode, vehicle class and powertrain, which is evaluated on a yearly basis as function of the GDP per capita evolution. Hence, information characterizing the transport system in the base year (2010) are combined with the evolution of population and GDP up to 2040 (Figure 25 and Figure 26), in order to generate transport activity, vehicle stock, fuel consumption and CO2 emission estimates. Figure 27 provides a synthetic description of the calculation flow outlined, also highlighting the links associated with the ASIF calculations. Further information on the calculation methodology is extensively discussed in the ForFITS user manual (UNECE, 2013).
Figure 25: Population size of Lebanon, 1980-2050
Source | ESCWA, 2014
Figure 26: GDP of Lebanon based on Purchasing Power Parity (PPP), 2010-2040
Source | International Monetary Fund, World Economic Outlook database, April 2014, for 2010-2019 values. 2020-2040 values are estimated considering the average growth of 4.61% between 2012 and 2019.
6,000,000
4,000,000
2,000,000
0
1980 1990 2000 2010 2020 2030 2040
Popu
latio
n si
ze
250200150100500
2010 2015 2020 2025 2030 2035 2040
GD
P (P
PP)
(bill
ions
of c
urre
ntin
tern
atio
nal U
SD)

39
Figure 27: ForFITS simplified model structure
Source| ForFITS manual
Passenger transport system characteristicsBase year: vehicles, travel and loadsProjections: structural information
Passenger transport demand generation module
Freight transport demandgeneration module
Transport activity(pkm, tkm, vkm)and vehicle stock
New vehicleregistrations by ageand by powertrain
Energy use
CO2 emissions
Fuel characteristics(cost and taxes)
Vehicle characteristics (vehicle price, technology cost, fuel consumption, performance) by powertrain
Fuel characteristics(emission factors)
Gross domestic product population(base year and projections)
Freight trasport system characteristicsBase year: vehicles, travel and loadsProjections: structural information
Policy inputs
ASIFASIF
extended ASIF
Projection scenarios
A baseline scenario has been carried out first in order to estimate CO2 emissions projection under BAU conditions, basing the projections calculations on available transport system data in the base year (2010) and on data 5 and 10 years prior to the base year (2005 and 2000 respectively). Then mitigation scenarios to increase the share of fuel-efficient vehicles, hybrid electric vehicles and mass transport have been developed and compared to the baseline. They are run on the basis of a set of hypotheses, intended to evaluate policy impacts of shifting the mobility demand from high consuming vehicles to efficient passenger vehicles and mass transit systems. Table 28 provides details on the set of hypotheses that defines each of the scenarios and summarizes the parameters that are subject to a variation across the different scenarios.
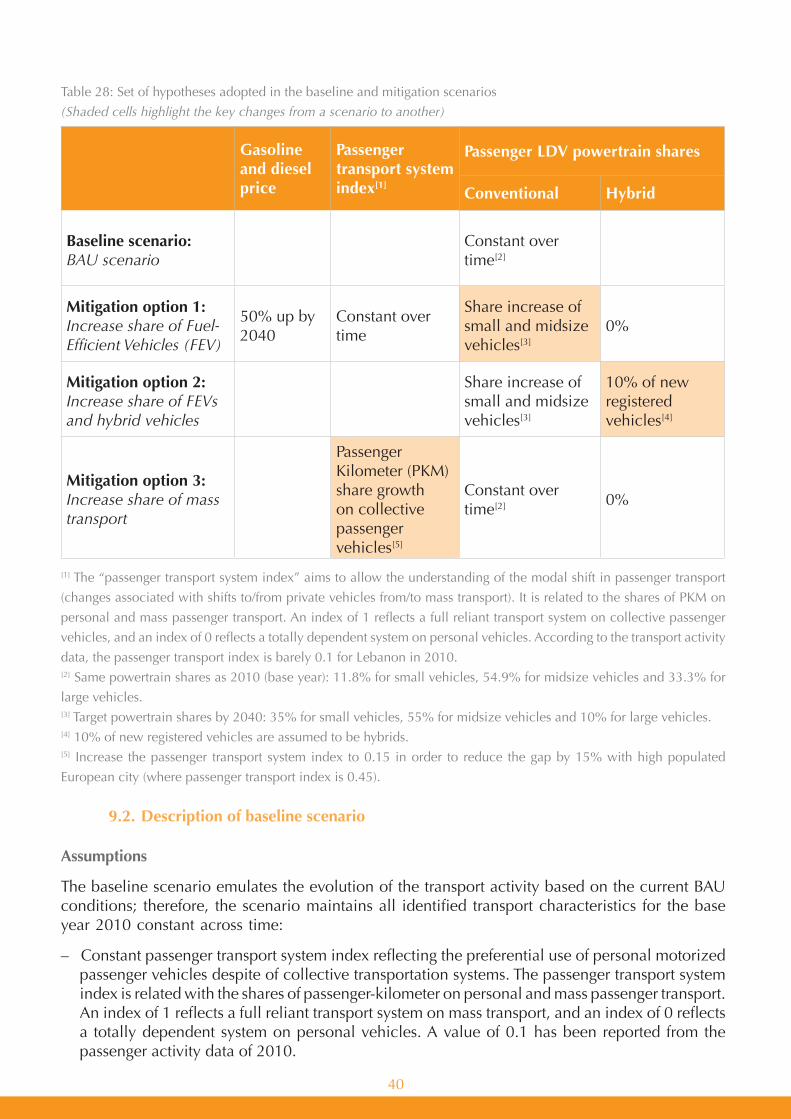
40
9.2. Description of baseline scenario
Assumptions
The baseline scenario emulates the evolution of the transport activity based on the current BAU conditions; therefore, the scenario maintains all identified transport characteristics for the base year 2010 constant across time:
– Constant passenger transport system index reflecting the preferential use of personal motorized passenger vehicles despite of collective transportation systems. The passenger transport system index is related with the shares of passenger-kilometer on personal and mass passenger transport. An index of 1 reflects a full reliant transport system on mass transport, and an index of 0 reflects a totally dependent system on personal vehicles. A value of 0.1 has been reported from the passenger activity data of 2010.
Gasoline and diesel price
Passenger transport system index[1]
Passenger LDV powertrain shares
Conventional Hybrid
Baseline scenario:BAU scenario
Constant over time[2]
Mitigation option 1:Increase share of Fuel-EfficientVehicles(FEV)
50% up by 2040
Constant over time
Share increase of small and midsize vehicles[3]
0%
Mitigation option 2:IncreaseshareofFEVsandhybridvehicles
Share increase of small and midsize vehicles[3]
10% of new registered vehicles[4]
Mitigation option 3:Increase share of mass transport
Passenger Kilometer (PKM) share growth on collective passenger vehicles[5]
Constant over time[2] 0%
Table 28: Set of hypotheses adopted in the baseline and mitigation scenarios
(Shadedcellshighlightthekeychangesfromascenariotoanother)
[1] The “passenger transport system index” aims to allow the understanding of the modal shift in passenger transport
(changes associated with shifts to/from private vehicles from/to mass transport). It is related to the shares of PKM on
personal and mass passenger transport. An index of 1 reflects a full reliant transport system on collective passenger
vehicles, and an index of 0 reflects a totally dependent system on personal vehicles. According to the transport activity
data, the passenger transport index is barely 0.1 for Lebanon in 2010.[2] Same powertrain shares as 2010 (base year): 11.8% for small vehicles, 54.9% for midsize vehicles and 33.3% for
large vehicles.[3] Target powertrain shares by 2040: 35% for small vehicles, 55% for midsize vehicles and 10% for large vehicles.[4] 10% of new registered vehicles are assumed to be hybrids.[5] Increase the passenger transport system index to 0.15 in order to reduce the gap by 15% with high populated
European city (where passenger transport index is 0.45).

41
– Constant low environmental culture index reflecting the poor behavioral changes associated with environmental consciousness. A value of 0.2 is estimated, knowing that a value of 1 represents a culture strongly focused on protecting the environment, while a value of 0 represents the absence of environmental consciousness in decision making.
– Constant powertrain technology share for all vehicles and all modes equal to the shares observed in 2010: 11.8% for small vehicles, 54.9% for midsize vehicles and 33.3% for large vehicles; however taking into account the improvement of the fuel consumption characteristics of each powertrain technology.
– Constant CO2 emission factors, reflecting no changes in fuel blends with respect to tank-to-wheel emission characteristics, and therefore excluding switches towards higher or lower energy-and carbon-intensive fuel options.
In addition, the baseline scenario considers the following parameters:
– A growth in gasoline and diesel fuel price by 50% in 2040; a common hypothesis adopted for all scenarios under consideration.
– The total population is expected to increase by 22% by 2040.
– The GDP is projected to be almost multiplied by 4.
Transport characteristics at the base year 2010
In addition to the socio-economic data that define the context in which the transport system should evolve, information on the characteristics of the transport system in the base year (2010) is provided, summarized in Table 29. This information is compiled and used in the ASIF equations 1 and 2 to determine the total energy and emissions use.
Table 29: Characteristics of the road transport sector in 2010
Vehicle stock
New registered vehicles
Annual travelled distance (km)
Vehicle load(pass/veh)
Vehicle fuel consumption(lge/100 km)
Passenger
2-3 wheelersPassenger LDV
Small vehicles
Midsize vehicles
Large vehicles
Taxi
Buses
60,588
139,503
649,044
393,682
50,000
12,388
13,416
11,258
52,423
31,798
1,785
1,188
5,000
10,000
10,000
10,000
25,000
50,000
1
1.18
1.18
1.18
1.18
11.2
3-6.5
8
12
16
15
25
Freight (t/veh)
Freight LDV
Trucks
96,236
29,970
10,303 25,000
50,000
0.5
3-6
15
17-45

42
Baseline energy use, CO2 emissions and transport activity projections
Table 30 and Table 31 show the values of the main outputs for passenger and freight transport in the reference scenario at the base year 2010, 2020 and 2040.
Table 30: Baseline scenario projections for passenger transport
Table 31: Baseline scenario projections for freight transport
UnitBase year (2010)
2020 2040Ratio 2020/2010
Ratio 2040/2010
Total passenger vehicle stock
Vehicles 1,292,433 1,693,136 2,663,349 1.31 2.06
2-3wheelers
PassengerLDV
Buses
Vehicles 60,587 79,632 124,268 1.31 2.05
Vehicles 1,219,460 1,599,130 2,523,080 1.31 2.07
Vehicles 12,387 14,375 16,001 1.16 1.29
Total vehicle-kmBillion vkm/year
13.68 17.98 27.74 1.31 2.03
Total energy use toe/year 1,497,765 1,633,910 1,898,235 1.09 1.27
Total CO2 emissions
Gg CO2/year
4,350 4,747 5,514 1.09 1.27
UnitBase year (2010)
2020 2040Ratio 2020/2010
Ratio 2040/2010
Total freight vehicle stock
Vehicles 126,202 188,162 495,484 1.49 3.93
FreightLDV
Trucks
Vehicles 96,235 150,093 433,496 1.56 4.50
Vehicles 29,968 38,069 61,988 1.27 2.07
Total vehicle-kmBillion vkm/year
3.90 5.66 14.08 1.45 3.61
Total energy use toe/year 660,446 803,046 1,578,551 1.22 2.39
Total CO2 emissions
Gg CO2/year
1,990 2,410 4,700 1.21 2.36

43
In terms of projections, both the passenger and freight activity increase substantially compared to the base year, which is a direct consequence of the economic growth and leads to an increase in transport activity and fuel consumption use during this period. The economic growth triggers an increase in the number of personal passenger cars (Figure 28) and their annual distance travel (Figure 29), especially for Light-Duty Vehicles (LDV) where vehicle-kilometer (vkm) activity increases by 31% in 2020 and 103% in 2040 compared to the base year. Thus, any fuel saving measure adopted to improve the vehicle performance and efficiency will only partly offset the increasing trend of emissions.
The increase in CO2 emissions (Figure 31) follows closely the trend of the energy demand since emissions are mostly related to fuel consumption (Figure 30). As for the distribution of emissions per vehicle class, passenger CO2 emissions are largely dominated by midsize and large vehicles as illustrated in Figure 32. This is due to the absence of environmental considerations during vehicle purchase, resulting in 88% share of midsize and large vehicles of the total passenger vehicle fleet.
Figure 28: Baseline projection of passenger and freight vehicle stock
2-3 wheelers BusesPassenger LDV Freight LDV Trucks
Veh
icle
sto
ck (
vehi
cles
)
3,500,000
3,000,000
2,500,000
2,000,000
1,500,000
1,000,000
500,000
0
2010
2012
2014
2016
2018
2020
2022
2024
2026
2028
2030
2032
2034
2036
2038
2040

44
Figure 29: Baseline annual estimated passenger and freight activity
Figure 30: Baseline projection of passenger and freight energy use
2010
2012
2014
2016
2018
2020
2022
2024
2026
2028
2030
2032
2034
2036
2038
2040
Bill
ion
km*v
ehic
le/y
ear
4540
353025201510
50
2-3 wheelers
2-3 wheelers
Buses
Buses
Passenger LDV
Passenger LDV
Freight LDV
Freight LDV
Trucks
Trucks
4,000,000
3,500,000
3,000,000
2,500,000
2,000,000
1,500,000
1,000,000
500,000
0
Ener
gy u
se (
toe/
year
)
2010
2012
2014
2016
2018
2020
2022
2024
2026
2028
2030
2032
2034
2036
2038
2040

45
Figure 31: Baseline projection of passenger and freight CO2 emissions
Figure 32: Baseline projection of passenger vehicles CO2 emissions per vehicle class
CO
2 em
issi
ons
(Gg/
year
)
5,0004,5004,0003,5003,0002,5002,0001,5001,000
5000
2010
2012
2014
2016
2018
2020
2022
2024
2026
2028
2030
2032
2034
2036
2038
2040
Midsize vehicles Large vehiclesSmall vehicles
CO
2 em
issi
ons
(Gg/
year
)12,000
10,000
8,000
6,000
4,000
2,000
0
2010
2012
2014
2016
2018
2020
2022
2024
2026
2028
2030
2032
2034
2036
2038
2040
2-3 wheelers BusesPassenger LDV Freight LDV Trucks
46
Freight transport represents 30.6% of the total energy use at the base year, and it is estimated to contribute to 45.4% in 2040 (Figure 30). This increase is the result of the combination of two aspects: (1) the economic growth which is correlated to the increase in freight activity, and (2) the reliance of the increase in freight activity on light freight vehicles (76% of the total freight vehicles at the base year, estimated to reach 87.5% in 2040) (Table 31) which are less energy efficient (per tonne-kilometer) than large freight modes.
For the purpose of this study, freight activities will remain unchanged in the 3 mitigation scenarios, as the study focuses only on mitigating CO2 emissions of passenger transport. However, measures for mitigating freight emissions should be considered in future studies, since freight is expected to be one of the major sources of GHG emissions in 2040 (Figure 31).
9.3. Mitigation options
Description of scenarios
Mitigationoption1:increaseshareoffuel-efficientvehicles
Fuel-efficient vehicles are commonly known in Lebanon by conventional gasoline powered vehicles with reduced fuel consumption compared to similar gasoline vehicles within the same vehicle segment. These vehicles are equipped with advanced technologies like downsized turbocharged engines. In general, fuel-efficient vehicles fall mainly under the small vehicles category; however, continuous developments are held to reduce consumption of conventional midsize and large vehicles, and therefore might be more efficient than small vehicles if these cars are used regularly by more than one occupant. Consequently, for future work, fuel-efficient vehicles should be defined as vehicles presenting reduced consumption per vehicle occupant.
This scenario considers a higher market penetration of fuel-efficient vehicles technologies and a reduction of the share of large vehicles. This scenario aims at increasing the share of small passenger vehicles to 35%, maintaining the share of midsize vehicles at 55% and decreasing the share of large vehicles to 10%. The market for these fuel-efficient vehicles will develop gradually with new vehicles registrations and will rely on the implementation of policies and awareness campaigns to improve the environmental awareness of drivers and direct their purchases to environmentally-friendly vehicles (MoE/URC/GEF, 2012).
Mitigationoption2:increaseshareoffuel-efficientvehiclesandhybridelectricvehicles
Hybrid Electric Vehicles (HEV) combine an electric motor and battery pack to the internal combustion engine found in conventional vehicles. They are classified as micro-hybrid, mild-hybrid, full-hybrid, plug-in hybrid and range-extender electric vehicles; and differentiate by the fraction of electric power added onboard and consequently, the ability to achieve more hybrid functions. Note that the more electric energy is available onboard, the more fuel reduction will result, at the expense of additional purchase cost.
This scenario adopts the same assumptions as mitigation option 1, i.e. an increase of the share of small vehicles with fuel-efficient powertrains and decrease in large vehicles. In addition, this scenario considers the introduction of hybrid electric vehicles to the market, assuming that the share of hybrid electric vehicles sales of new registered vehicles will increase over time and reach 10% by 2040.

47
Mitigationoption3:increasetheshareofmasstransport
The shift to mass transport scenario is illustrated by the increase in the passenger transport system index, for which the share of passenger-kilometer activity is assumed to increase from 36% in 2010 to 53% by 2040. The rationale is to reduce the gap between the passenger transport system indexes of Lebanon (0.1) and mass-transport-oriented sustainable European cities (0.45) by 15% in 2040.
In practice, this assumption is represented by the deployment of a well-designed mass transit system covering GBA, part of which is the public transport plan prepared by the Ministry of Public Works and Transport (MoPWT), in addition to a wide number of policies favoring mass transport over personal vehicles, such as parking and access restrictions for personal vehicles, land use policies that encourage lane dedication for buses, and support for the provision of appealing, widely available and high-quality public transport services (MoE/URC/GEF, 2012).
Emission reduction potential
Figure 33 to Figure 35 illustrate the evolution of the passenger activity (vkm), energy use (toe) and CO2 emissions (Gg) of the 3 considered scenarios. This allows a comparative assessment of the impacts caused by the changes in each scenario compared to the baseline (as highlighted in Table 34).
Figure 33: Change in transport activity
0
5
10
15
20
25
30
2010 2015 2020 2025 2030 2035 2040
Pass
enge
r ac
tivit
y (b
illio
n vk
m/y
ear)
Baseline
Mitigation option 1
Mitigation option 2
Mitigation option 3
Mitigation options 1+2+3
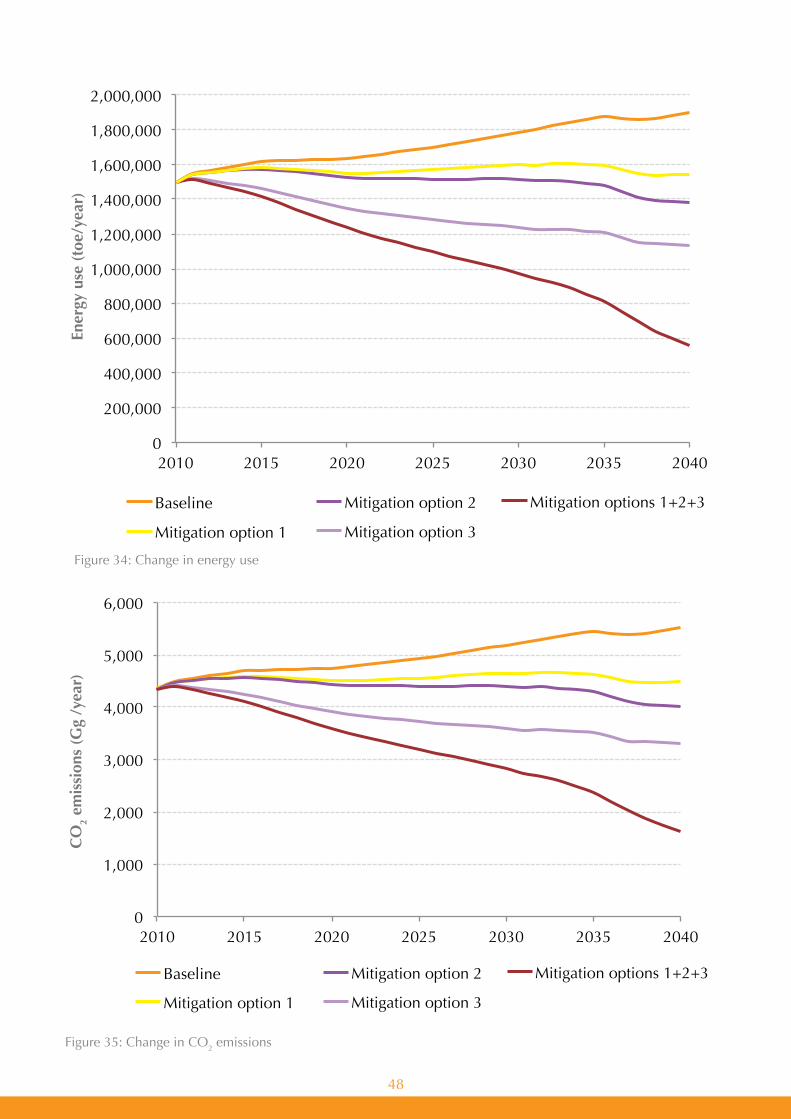
48
Figure 35: Change in CO2 emissions
Figure 34: Change in energy use
0
200,000
400,000
600,000
800,000
1,000,000
1,200,000
1,400,000
1,600,000
1,800,000
2,000,000
2010 2015 2020 2025 2030 2035 2040
Ener
gy u
se (
toe/
year
)
Baseline
Mitigation option 1
Mitigation option 2
Mitigation option 3
Mitigation options 1+2+3
Baseline
Mitigation option 1
Mitigation option 2
Mitigation option 3
Mitigation options 1+2+3
0
1,000
2,000
3,000
4,000
5,000
6,000
2010 2015 2020 2025 2030 2035 2040
CO
2 em
issi
ons
(Gg
/yea
r)

49
Emissionreductionfrommitigationoption1:increaseshareoffuel-efficientvehicles
Despite the fact that this scenario reduces the passenger transport energy use and CO2 emissions in 2040 by 19% compared to baseline scenario (Figure 34 and Figure 35), the transport system remains characterized by being highly personal-vehicle oriented, as use of mass transport still represents less than 10% of the total passenger-kilometer transport activity.
Reduction in energy use and CO2 emissions are the consequence of two mitigation actions: (1) the share increase of fuel-efficient vehicles from 11.8% to 35%, and consequently the decrease of large low-efficiency vehicles from 33.3% to 10%; (2) the fuel price increase by 50% in 2040 compared to 2010. The combination of both mitigation actions leads to a reduced transport activity compared to the baseline as shown in Figure 33. Note that a no-growth fuel price scenario in 2040 would result in an increase in the transport vehicle-kilometer activity; consequently, CO2 emission savings will be counterweighed. Therefore, the fuel price (or from a wider perspective: the mobility cost per mode) is a key parameter to ensure the successful implementation of this scenario, by controlling the transport activity.
Table 32 presents the values of the main outputs of this scenario by 2020 and 2040. Note that the energy use over time is stabilized: a slight increase by 3% between 2010 and 2020, and between 2010 and 2040. CO2 emissions follow the same trend. This steadiness of energy use and emissions is due to the balance effect of increased passenger-kilometer activity and reduced fuel consumption of the fleet, since new fuel-efficient vehicles are replacing large and non-efficient vehicles.
Table 32: Passenger transport projections of the mitigation option 1 scenario
UnitBase year (2010)
2020 2040Ratio 2020/2010
Ratio 2040/2010
Total passenger vehicle stock
Vehicles 1,292,433 1,652,426 2,425,655 1.28 1.88
2-3wheelers
PassengerLDV
Buses
Vehicles
Vehicles
Vehicles
60,587
1,219,460
12,387
77,797
1,560,650
13,978
113,503
2,297,710
14,442
1.28
1.28
1.13
1.87
1.88
1.17
Total vehicle-kmBillion vkm/year
13.68 17.50 25.10 1.28 1.83
Total energy use toe/year 1,497,765 1,549,395 1,543,931 1.03 1.03
Total CO2 emissions
Gg CO2/year
4,350 4,502 4,486 1.03 1.03

50
Emissionreductionfrommitigationoption2:increaseshareoffuel-efficientvehiclesandhybridelectric vehicles
Same trend in transport vehicle-kilometer activity is observed compared to the mitigation option 1 scenario (Figure 33); therefore, the transport system still evolves in a highly personal vehicle oriented scheme. Nevertheless, the deployment of Hybrid Electric Vehicles (HEV) leads to further energy and CO2 emissions:
Table 33: Passenger transport projections of the scenario shift powertrain technology to FEV and HEV
Compared to energy use and CO2 emissions of passenger transport in 2010, 8% of reductions are observed by 2040 (Table 33, Figure 34 and Figure 35).
Compared to the mitigation option 1, the impact of a 10% HEV share of new registered vehicles in 2040 engenders 11% of additional savings in energy use and CO2 emissions. They result from technological advancements of hybrid vehicles in terms of fuel consumption.
Compared to the baseline, the energy and CO2 emissions savings of mitigation option 2 are 27% by 2040 (Figure 34 and Figure 35). This is due to the combination of (1) powertrain technology shift of high-consuming vehicles into high-efficient vehicles (Figure 36), and (2) the deployment of HEV technologies.
-
-
-
UnitBase year (2010)
2020 2040Ratio 2020/2010
Ratio 2040/2010
Total passenger vehicle stock
Vehicles 1,292,433 1,653,549 2,437,284 1.28 1.89
2-3wheelers
PassengerLDV
Buses
Vehicles 60,587
1,219,460
12,387
77,838
1,561,750
13,961
113,950
2,308,995
14,339
1.28
1.28
1.13
1.88
1.89
1.16
Vehicles
Vehicles
Total vehicle-kmBillion vkm/year
13.68 17.57 25.70 1.28 1.88
Total energy use toe/year 1,497,765 1,525,047 1,378,665 1.02 0.92
Total CO2 emissions
Gg CO2/year
4,350 4,431 4,007 1.02 0.92

51
Figure 36: Passenger LDV activity per vehicle class under baseline (B) and mitigation option 2 scenario (M2)
0
200,000
400,000
600,000
800,000
1,000,000
1,200,000
1,400,000
1,600,000
Pass
enge
r veh
icle
sto
ck (
vehi
cles
)
Small vehicles (B) Midsize vehicles (B) Large vehicles (B)
Small vehicles (M2) Midsize vehicles (M2) Large vehicles (M2)
2010
2012
2014
2016
2018
2020
2022
2024
2026
2028
2030
2032
2034
2036
2038
2040
Emissionreductionfrommitigationoption3:increaseshareofmasstransport
The shift to mass transport in this scenario takes into account a change of the passenger transport characteristic index from 0.1 to 0.15, representing a mass transport passenger-kilometers share increase from 36% in 2010 to 53% by 2040.
Shifting to mass transport results in 45% reduction of vehicle-kilometer activity in 2040 compared to the baseline scenario, which obviously reflects a net improvement in traffic congestion. As a result, the energy use and CO2 emissions are reduced by 10% in 2020 and 24% in 2040 compared to 2010. Compared to the baseline, the energy and CO2 emissions savings by 2040 are 40% (Table 34, Figure 34 and Figure 35).

52
Mitigation action plan
The TNA report for the transport sector tackled the needs to deploy the mitigation options of this study: an efficient “mass transit system” and a swap program to “renew the passenger cars fleet with fuel-efficient and hybrid electric vehicles”. The root cause to barriers of both options is the inadequate current transport policy and the absence of national policy providing a coherent transport demand management strategy. This lack of national policy is mainly due to the government clash of interests and therefore its limited willingness to invest.
Measures for overcoming the barriers are specific to each mitigation option; however, a common enabling framework serving both mitigation options mainly consists of creating a financial mechanism incentivizing the use of mass transit systems and environmentally-friendly vehicles and discouraging the use and purchase of inefficient vehicles. Specific measures and action plan for each option are discussed in Table 35 and Table 36 (MoE/URC/GEF, 2012).
Table 34: Passenger transport projections of the scenario shift to mass transport
UnitBase year (2010)
2020 2040Ratio 2020/2010
Ratio 2040/2010
Total passenger vehicle stock
Vehicles 1,292,433 1,515,801 2,163,453 1.17 1.67
2-3wheelers
PassengerLDV
Buses
Vehicles
Vehicles
Vehicles
60,587
1,219,460
12,387
71,099
1,429,350
15,352
99,530
2,040,880
23,043
1.17
1.17
1.24
1.64
1.67
1.86
Total vehicle-kmBillion vkm/year
13.68 14.40 15.24 1.05 1.11
Total energy use toe/year 1,497,765 1,345,957 1,135,994 0.90 0.76
Total CO2 emissions
Gg CO2/year
4,350 3,912 3,308 0.90 0.76

53
Tabl
e 35
: Act
ion
plan
for
impl
emen
tatio
n of
sce
nari
o sh
ift to
fuel
-effi
cien
t and
hyb
rid
elec
tric
veh
icle
s
Mea
sure
sW
hyH
ow t
o do
itPr
iori
tyR
espo
nsib
le
part
yTi
me
scal
eM
onit
orin
g an
d Ev
alua
tion
(M
& E
) in
dica
tors
Cre
ate
appr
opri
ate
finan
cial
ince
ntiv
es
for
hybr
id a
nd
fuel
-effi
cien
t car
s pu
rcha
se.
Red
uce
car
purc
hase
and
ow
ners
hip
cost
s.
Exem
ptio
n fr
om c
usto
ms
and
exci
se fe
es, e
xem
ptio
n fr
om
regi
stra
tion
fees
, exe
mpt
ion
from
roa
d-us
age
fee
at
regi
stra
tion.
1M
oFSh
ort-
term
Law
on
tax
exem
ptio
n by
go
vern
men
t
Paym
ents
of m
inim
um s
alva
ge
valu
e (e
x. U
SD 2
,500
) as
dow
n pa
ymen
t for
car
loan
, ex
tens
ion
of lo
an p
erio
d to
8
year
s, r
educ
e lo
an in
tere
st.
1
MoF
BD
L
Com
mer
cial
ba
nks
Shor
t-te
rmC
ar lo
an p
acka
ge a
nd
faci
litie
s fo
r hy
brid
and
fu
el-e
ffici
ent c
ars
Cre
ate
disi
ncen
tives
fo
r im
port
of n
on-
effic
ient
pre
-ow
ned
cars
.
Lim
it th
e im
port
of
pre
-ow
ned
non
fuel
-effi
cien
t ve
hicl
es.
Gra
dual
ly r
educ
e m
axim
um
age
of im
port
ed p
re-o
wne
d ve
hicl
es to
3 y
ears
with
a
mile
age
low
er th
an 1
00,0
00
km, r
athe
r th
an 8
yea
rs a
s th
e cu
rren
t figu
re.
1
Min
istr
y of
In
teri
or a
nd
Mun
icip
aliti
es
(MoI
M)
Shor
t/med
ium
-te
rmLa
w o
n im
port
of p
re-
owne
d ca
rs
Set u
p ne
w c
oher
ent
tax
polic
ies.
Cop
e w
ith th
e hi
gh d
eman
d fo
r hi
gh fu
el
cons
umin
g pr
e-ow
ned
vehi
cles
.
Ado
pt a
Bon
us-M
alus
tax
polic
y w
here
pol
lute
rs p
ay
mor
e an
nual
roa
d-us
age
fees
, an
d w
here
taxe
s lik
e th
e ro
ad
usag
e fe
es a
re r
econ
side
red
acco
rdin
g to
fuel
effi
cien
cy
and/
or e
mis
sion
s ra
ther
than
en
gine
dis
plac
emen
t as
the
curr
ent fi
gure
.
2M
oFSh
ort-
term
Bon
us-M
alus
tax
sche
me

54
Mea
sure
sW
hyH
ow t
o do
itPr
iori
tyR
espo
nsib
le
part
yTi
me
scal
eM
onit
orin
g an
d Ev
alua
tion
(M
& E
) in
dica
tors
Ren
ew th
e pa
ssen
ger
car
fleet
.
Enha
nce
the
effic
ienc
y of
the
pass
enge
r ca
r fle
et.
Cre
ate
a ca
r sc
rapp
age
prog
ram
bas
ed o
n sw
appi
ng
curr
ent p
asse
nger
car
s w
ith
hybr
id a
nd fu
el-e
ffici
ent c
ars.
2M
oF
New
car
s de
aler
sSh
ort-
term
Car
scr
appa
ge p
rogr
am
Impl
emen
t a v
ehic
le
retir
emen
t pro
gram
. R
emov
e ol
d ca
rs
from
the
fleet
.
Cre
ate
a ca
r te
rmin
atio
n pl
ant t
hat d
eals
with
the
car
term
inat
ion
proc
ess
afte
r th
e sw
ap in
the
scra
ppag
e pr
ogra
m.
3
MoP
WT
MoI
M
MoE
Shor
t/med
ium
-te
rmC
ar te
rmin
atio
n pl
ant
Impl
emen
t le
gisl
atio
n go
vern
ing
vehi
cle
emis
sion
s.
Impr
ove
air
qual
ity
as tr
ansp
ort s
ecto
r is
the
mai
n ai
r po
llute
r.
Upd
ate
decr
ee n
o. 6
603/
1995
re
latin
g to
sta
ndar
ds o
n pe
rmis
sibl
e le
vels
of e
xhau
st
fum
es a
nd e
xhau
st q
ualit
y to
co
ver
all t
ypes
of v
ehic
les.
4M
oESh
ort/m
ediu
m-
term
Upd
ated
dec
ree
6603
/199
5
Upd
ate
the
vehi
cle
insp
ectio
n pr
ogra
m re
quire
men
ts ta
king
in
to c
onsi
dera
tion
spec
ial
requ
irem
ents
for h
ybrid
ca
rs’ i
nspe
ctio
n, in
add
ition
to
man
datin
g th
e pr
esen
ce
of c
atal
ytic
con
verte
rs o
n co
nven
tiona
l gas
olin
e ve
hicl
es.
4M
oE
MoI
MSh
ort/m
ediu
m-
term
Upd
ated
veh
icle
in
spec
tion
prog
ram

55
Mea
sure
sW
hyH
ow t
o do
itPr
iori
tyR
espo
nsib
le
part
yTi
me
scal
eM
onit
orin
g an
d Ev
alua
tion
(M
& E
) in
dica
tors
Cre
ate
inst
itutio
ns
to s
uppo
rt te
chni
cal
stan
dard
s fo
r tr
ansp
orta
tion.
Lim
it th
e im
port
of
defi
cien
t and
cr
ashe
d pr
e-ow
ned
cars
.
Set u
p a
mec
hani
cal i
nspe
ctio
n un
it at
the
port
of B
eiru
t in
char
ge o
f ch
ecki
ng th
e em
issi
ons
and
safe
ty
stan
dard
s of
impo
rted
pre
-ow
ned
cars
bef
ore
ente
ring
the
coun
try.
5M
oPW
T
MoE
Shor
t/med
ium
-te
rm
Mec
hani
cal
insp
ectio
n un
it at
th
e po
rt o
f Bei
rut
Esta
blis
h aw
aren
ess
cam
paig
n.
Prom
ote
hybr
id
and
fuel
-effi
cien
t ca
rs.
Enfo
rce
all m
arke
ting
cam
paig
ns
(bill
boar
ds, T
V, e
tc.)
and
new
car
de
aler
s to
pos
t up
fact
shee
ts o
n al
l veh
icle
s, c
lear
ly d
ispl
ayin
g in
form
atio
n on
veh
icle
ave
rage
fu
el c
onsu
mpt
ion
and
annu
al fu
el
cost
s, in
add
ition
to a
vera
ge C
O2
emis
sion
s.
6M
oPW
T
MoE
Shor
t/med
ium
-te
rmA
war
enes
s ca
mpa
ign
Cre
ate
Mob
ility
M
onito
ring
In
dica
tors
(MM
I) fr
amew
ork.
Dev
elop
su
stai
nabl
e tr
ansp
orta
tion
stra
tegi
es.
Del
egat
e th
e C
AS
with
add
ition
al
expe
rim
ente
d pe
rson
nel a
nd
auth
ority
to p
rovi
de th
e co
mpl
ete
MM
I set
on
a ye
arly
bas
is.
7M
oPW
T
MoE
Shor
t/med
ium
-te
rm
Mob
ility
m
onito
ring
in
dica
tor
fram
ewor
k de
lega
ted
to C
AS

56
Mea
sure
sW
hyH
ow t
o do
itPr
iori
tyR
espo
nsib
le p
arty
Tim
e sc
ale
M &
E in
dica
tors
Dep
loy
effe
ctiv
e in
fras
truc
ture
m
easu
res.
Shift
trav
el
dem
and
to
effic
ient
tran
spor
t m
eans
: bus
tran
sit
syst
em.
Des
ign
a co
mpl
ete
bus
netw
ork
cove
ring
all
boro
ughs
with
in th
e G
reat
er B
eiru
t Are
a (G
BA) a
nd r
eser
ve la
nes
for
bus
oper
atio
n.
1
Mun
icip
aliti
es
Offi
ce d
es C
hem
ins
de F
er
et d
es T
rans
port
s en
Com
mun
(OC
FTC
) D
irec
tora
te G
ener
al o
f R
oads
and
Bui
ldin
gs
(DG
RB
)
Cou
ncil
for
Dev
elop
men
t an
d R
econ
stru
ctio
n (C
DR
)
Shor
t-te
rmB
us n
etw
ork
on
rese
rved
lane
s in
G
BA
Dev
elop
the
supp
ly
chan
nels
of t
he b
us
mas
s tr
ansi
t sys
tem
.
Cov
er th
e de
sign
ed n
etw
ork
with
suf
ficie
nt
num
ber
of
buse
s an
d av
oid
irre
gula
ritie
s in
op
erat
ion.
Ensu
re s
uffic
ient
nu
mbe
r of
tran
sit
buse
s w
ith th
e pr
oper
po
wer
trai
n te
chno
logy
.
1M
oPW
TSh
ort-
term
Purc
hase
of t
he
requ
ired
bus
es
Giv
e ap
prop
riat
e fin
anci
al in
cent
ives
fo
r m
ass
tran
sit
buse
s.
Dec
reas
e th
e co
st
incu
rred
for
the
gove
rnm
ent o
n th
e im
port
of t
he m
ass
tran
sit b
uses
.
Exem
pt m
ass
tran
sit
buse
s (a
nd th
eir
spar
e pa
rts)
from
cus
tom
and
ex
cise
fees
, and
from
re
gist
ratio
n fe
es.
1M
oFSh
ort-
term
Law
on
fee
exem
ptio
n en
acte
d by
the
gove
rnm
ent
Tabl
e 36
: Act
ion
plan
for
impl
emen
tatio
n of
sce
nari
o sh
ift to
mas
s tr
ansp
ort
57
Mea
sure
sW
hyH
ow t
o do
itPr
iori
tyR
espo
nsib
le p
arty
Tim
e sc
ale
M &
E in
dica
tors
Enco
urag
e ta
xi
and
shar
ed ta
xi
owne
rs to
wor
k in
the
bus
mas
s tr
ansi
t sys
tem
.
Lim
it th
e nu
mbe
r of
ill
egal
taxi
s (1
7,00
0 ta
xis)
an
d re
duce
th
e ex
tens
ive
num
ber
of ta
xis
(33,
000
taxi
s).
Cre
ate
an e
mpl
oyee
pac
kage
for
taxi
dr
iver
s in
clud
ing
soci
al b
enefi
ts,
insu
ranc
e, r
etir
emen
t pla
ns, e
tc.
1
MoP
WT
OC
FTC
MoF
Shor
t/med
ium
-te
rmPa
ckag
e fo
r bu
s dr
iver
s
Stim
ulat
e pa
ssen
gers
’ de
man
d to
use
m
ass
tran
sit
buse
s.
Shift
trav
el
dem
and
to e
ffici
ent
tran
spor
t m
eans
: bus
tr
ansi
t sys
tem
.
Esta
blis
h sm
art c
ard
ticke
ting
sche
mes
w
ith a
ppro
pria
te r
educ
ed ta
riffs
.2
OC
FTC
Med
ium
-ter
mSm
art c
ard
ticke
ting
sche
mes
Dep
loy
effe
ctiv
e op
erat
ion
mea
sure
s.
Prov
ide
a qu
ality
of
serv
ice
that
ap
prox
imat
es
that
whi
ch c
ar
driv
ers
have
be
en u
sed
to
with
pas
seng
er
cars
.
Opt
imiz
e th
e op
erat
ion
man
agem
ent
of th
e bu
s m
ass
tran
sit s
yste
m:
cons
erve
a c
lear
and
reg
ular
bus
op
erat
ion,
impl
emen
t a r
eal-
time
info
rmat
ion
syst
em, d
eplo
y pe
rson
aliz
ed tr
avel
pla
nnin
g to
ols,
im
plem
ent
tran
sit s
igna
l pri
ority
, se
t up
stri
ngen
t mai
nten
ance
and
cl
eanl
ines
s pr
ogra
m ,
cons
truc
t re
leva
nt m
aint
enan
ce a
nd r
epai
r w
orks
hops
.
2
MoP
WT
Dir
ecto
rate
G
ener
al o
f Civ
il A
viat
ion
and
Mar
itim
e A
ffair
s (D
GLM
)
OC
FTC
Shor
t/med
ium
-te
rm
Ope
ratio
n m
anag
emen
t st
rate
gy

58
Mea
sure
sW
hyH
ow t
o do
itPr
iori
tyR
espo
nsib
le p
arty
Tim
e sc
ale
M &
E in
dica
tors
Set u
p a
regu
lato
ry
fram
ewor
k fo
r th
e m
ass
tran
sit
sect
or.
Man
age
the
tran
spor
t de
man
d ra
ther
th
an b
eing
co
ntro
lled
by
incu
mbe
nts
(priv
ate
and
publ
ic o
pera
tors
an
d th
e ta
xi
owne
rs).
Set c
lear
reg
ulat
ions
spe
cify
ing
the
oper
atio
n m
aneu
vers
of p
rivat
e bu
s op
erat
ions
and
taxi
ow
ners
. 3
MoP
WT
Shor
t-te
rm
Legi
slat
ion
on s
peci
fyin
g th
e op
erat
ion
man
euve
rs
betw
een
the
vari
ous
mas
s tr
ansi
t ope
rato
rs
Indu
ce/in
itiat
e le
gisl
ativ
e re
form
s in
urb
an
plan
ning
law
s,
expr
opri
atio
n la
ws,
and
traf
fic
law
s.
Dra
ft ne
w a
men
ded
law
s fo
r in
crea
sing
par
king
spa
ce a
nd r
eser
ving
la
nes
for
buse
s.4
MoP
WT
Shor
t/Med
ium
-te
rm
Park
ing
spot
s an
d re
serv
ed la
nes
for
mas
s tr
ansi
t bus
es
in c
onge
sted
urb
an
area
s
Enha
nce
the
role
of
the
Traf
fic
Man
agem
ent
Org
aniz
atio
n (T
MO
).
Car
ry o
ut
the
traf
fic
man
agem
ent
man
date
s it
was
co
ncei
ved
for.
Dev
elop
tech
nica
l exp
ertis
e am
ong
TMO
sta
ff an
d hi
gh le
vel
man
agem
ent.
5M
oPW
TM
ediu
m-t
erm
Wel
l-tr
aine
d TM
O
staf
f
Incr
ease
aw
aren
ess
of
trav
eler
s on
ec
olog
ical
an
d ec
onom
ic
bene
fits
of tr
ansi
t bu
s sy
stem
s.
Shift
trav
el
dem
and
to e
ffici
ent
tran
spor
t m
eans
: bus
tr
ansi
t sys
tem
.
Prov
ide
info
rmat
ion
on C
O2,
fuel
and
co
st s
avin
gs c
ompa
ring
to p
asse
nger
ca
rs.
6M
oPW
TSh
ort/m
ediu
m-
term
Info
rmat
ion
disp
lay
tool
s on
C
O2
and
fuel
sa
ving
s: m
obile
ap
plic
atio
ns,
dedi
cate
d w
ebsi
te,
med
ia c
ampa
igns
, et
c.

59
10. Conclusion
In the current patterns of transport activity, mainly based on passenger vehicles, the Lebanese transport sector generates many environmental and economic burdens on the government and the population. It was represented for example in 2010 by the 4,350 Gg CO2 emissions, the 1.5 million tonne-oil-equivalent of fuel consumed for passenger mobility, and the chronic traffic congestion at every intersection inside the GBA and on the entry gates of the city.
This report highlighted the impact of adopting mitigation measures to lessen the burdens namely reduce the CO2 emissions while responding to the transport sector technology needs identified in the TNA report. The mitigation measures consisted of (1) the replacement of old and inefficient vehicles gradually with fuel-efficient and hybrid electric vehicles to renew the fleet, and (2) the restructuring and modernization of the bus transport system in the GBA to increase the passenger-kilometer activity share of the mass transport from 36% in 2010 to 53% by 2040.
The analysis of the potential CO2 emissions and energy use reductions using the ForFITS model showed that renewing the fleet with efficient and hybrid vehicles leads to significant reductions of 27% by 2040 compared to the BAU mobility patterns. However, the vehicle stock and vehicle-kilometer activity will both increase by 88% by 2040 compared to 2010. Therefore, problems pertaining to the chronic congestion and all related complications of time and productivity losses will persist.
The analysis of increasing the share of mass transport activities indicated also significant CO2 and fuel savings of 40% by 2040 compared to the BAU patterns, and reduced the vehicle-kilometers activities compared to the fleet renewal strategy. Consequently, the lessons learned from the modeling exercise lead us to the conclusion that the future transport national strategy for Lebanon should necessarily be based on the integration of a carefully designed portfolio of policies and incentives, promoting the mitigations strategies assessed in this report.

60
11. References
Baaj (2002). Restructuring the Lebanese Railway and Public Transport Authority (RPTA): From Losing Operator to Effective Regulator. Transport Reviews: A Transnational Transdisciplinary Journal, 22:1,103-113, DOI: 10.1080/01441640110068626.
Beirut port statistics (2014). Annual Number of Incoming Ships from 2009 to 2013. Retrieved from www.portdebeyrouth.com (Last accessed, April, 2014).
BIA statistics (2014). Beirut International Airport statistics. Retrieved from www.beirutairport.gov.lb (Last accessed, April, 2014).
CAS (2014). Monthly Data per Year from 2000 to 2012. Retrieved from www.cas.gov.lb (Last accessed, April, 2014).
EastMED (2012). Report of the FAO EastMED Support to the Fishing Trials Carried Out of the South Lebanese Coasts. Retrieved from www.faoeastmed.org
El Hage (2014). Personal Communication. December 2014
EMEP/EEA (2013). Air Pollutant Emission Inventory Guide Book 2013. European Environmental Agency.
ENERDATA (2012). Global Energy and CO2 Database: Global Energy Intelligence.
ESCWA (2014). The Demographic Profile of Lebanon. Retrieved from www.escwa.un.org (Last accessed, March, 2014).
IEA (2014). Fuel Imports from 1994 to 2012: International Energy Agency. March, 2014
IMF (2014). World Economic Outlook (WEO) Database.
IPCC SAR (1995). Climate Change 1995, the Science of Climate Change. IPCC Second Assessment Report, United Nations Environmental Program.
IPCC (1997). Revised 1996 IPCC Guidelines for National Greenhouse Inventories. Houghton J.T., Meira Filho L.G., Lim B., Tréanton K., Mamaty I., Bonduki Y. et al. (Eds). London: Intergovernmental Panel on Climate Change WGI Technical Support Unit.
IPCC (2000). Good Practice Guidance and Uncertainty Management in National Greenhouse Gas Inventories. Pennman J., Kruger D., Galbally I., Hiraishi T., Buruhani N., Emmanuel S. et al. (Eds). Japan: Institute for Global Environmental Strategies.
IPT (2014). Fuel Consumption Estimation for Off-Road Transport, Road Transport and National Navigation. Personal Communication with Dr. Toni Issa, CEO at IPT.
Mansour (2011). Evaluating Impact of Electrified Vehicles on Fuel Consumption and CO2 Emissions Reduction in Lebanese Driving Conditions Using Onboard GPS Survey. Mansour C., Zgheib E., Saba S., Journal of Energy Procedia, Elsevier, 2011, vol. 6, pp. 261-276.

61
MoE/UNDP/GEF (2011). Lebanon’s Second National Communication Report to the UNFCCC.228pp.
MoE/URC/GEF (2012). Technology Needs Assessment Report for Climate Change, Transport Chapter. Ministry of Environment, 2012.
MoE (2014). The Number of Registered Vehicles in Lebanon: Ministry of Environment.
MoE/UNDP/GEF (2015). National Greenhouse Gas Inventory Report and Mitigation Analysis for the Energy Sector in Lebanon. Beirut, Lebanon.
MoEW (2014). Fuel Imports from 1997 to 2012: Ministry of Energy and Water.
MoF (2011). Car Imports and Related Government Revenues. Ministry of Finance, 2011.
MoF (2014). Fuel Imports from 2001 to 2006. Ministry of Finance, 2014.
MoIM (2013). The Number of Registered Vehicles from 1994 to 2006: Ministry of Interior and Municipalities.
OECD/IEA (2012). World Energy Outlook 2012. Organization for Economic Co-operation and Development, International Energy Agency.
Tripoli port statistics (2014). Annual Number of Incoming Ships from 2005 to 2009. Retrieved from www.portdetripoli.com (Last accessed, April, 2014).
UNECE (2013). United Nations Economic Commission for Europe. ForFITS Model - Assessing Future CO2 Emissions.
UNECE (2014). United Nations Economic Commission for Europe. Retrieved from www.unece.org (Last accessed, July, 2014).
Waked (2012). Caractérisation des Aerosols Organiques à Beyrouth, Liban. Unpublished Data.
Waked and Afif (2012). Emissions of Air Pollutants from Road Transport Lebanon and Other Countries in the Middle East Region. Atmos. Environ. 988 61, 446–452.
World Bank (2014). Statistics on the GDP and Population for Lebanon from 1994 to 2011: World Bank. Retrieved from www.worldbank.org (Last accessed, march, 2014).
Zouein (2014). Sustainable Aviation: Case of Middle East Airlines. Zouein P., Haddad M., Mansour C., UNDP CEDRO Exchange, 2014.

62
Annex I: Time series of the road transport emissions using tier 1 (Gg)
Year CO2 CH4 N2O NOx CO NMVOCs SO2
1994 3,801.77 1.03 0.03 34.04 407.31 76.43 2.86
1995 4,528.75 1.22 0.04 40.63 481.80 90.41 3.44
1996 4,648.06 1.26 0.04 41.58 499.88 93.80 3.47
1997 4,663.14 1.22 0.04 42.16 481.44 90.37 3.72
1998 4,967.49 1.31 0.04 44.87 514.71 96.62 3.94
1999 4,901.07 1.26 0.04 44.61 492.33 92.44 4.07
2000 4,466.77 1.17 0.04 40.38 461.27 86.59 3.56
2001 4,298.42 1.10 0.04 39.13 431.78 81.08 3.57
2002 4,361.18 1.11 0.04 39.81 433.15 81.34 3.68
2003 4,679.56 1.18 0.04 42.76 462.83 86.92 3.98
2004 4,652.02 1.18 0.04 42.43 463.34 87.01 3.91
2005 4,646.20 1.19 0.04 42.30 466.38 87.57 3.87
2006 4,466.95 1.15 0.04 40.66 448.58 84.23 3.71
2007 4,616.98 1.21 0.04 41.74 476.63 89.47 3.68
2008 5,100.57 1.31 0.04 46.41 513.12 96.35 4.23
2009 6,115.07 1.53 0.05 56.08 595.52 111.86 5.31
2010 5,893.99 1.50 0.05 53.80 585.29 109.91 4.98
2011 5,991.02 1.51 0.05 54.85 587.72 110.38 5.15
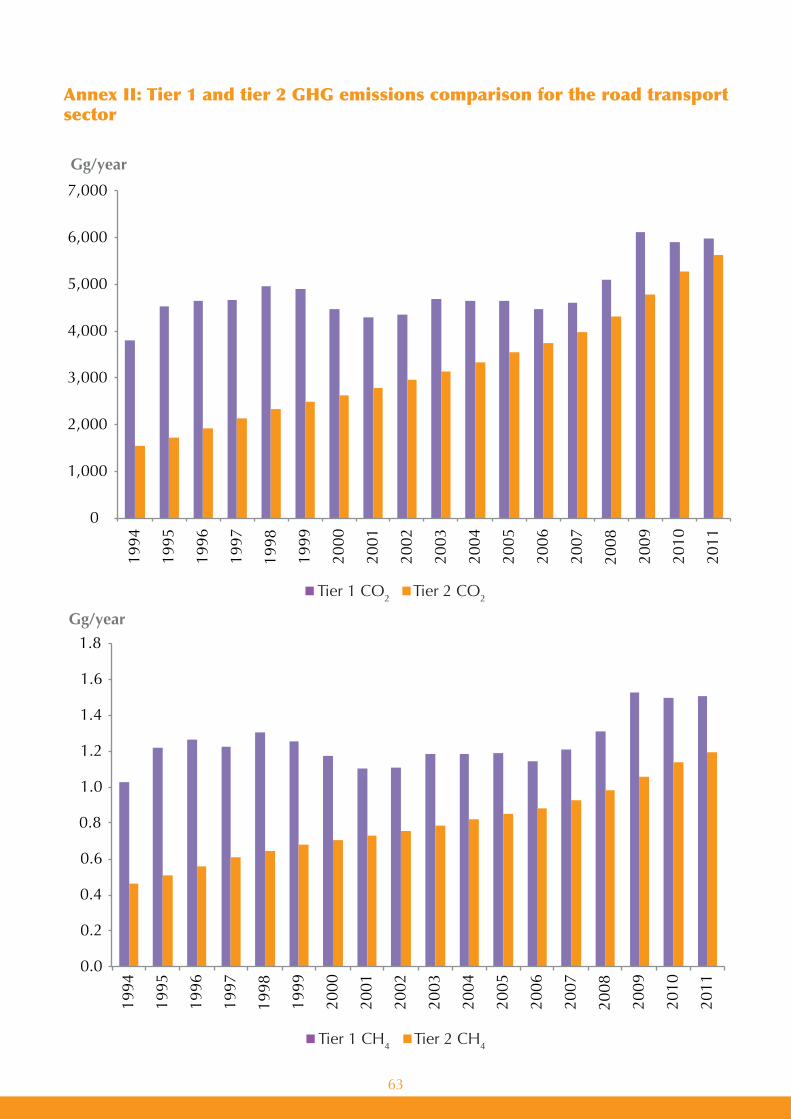
63
Annex II: Tier 1 and tier 2 GHG emissions comparison for the road transport sector
0
1,000
2,000
3,000
4,000
5,000
6,000
7,000
1994
1995
1996
1997
1998
1999
2000
2001
2002
2003
2004
2005
2006
2007
2008
2009
2010
2011
Tier 1 CO2 Tier 2 CO2
Gg/year
Tier 1 CH4 Tier 2 CH4
0.0
0.2
0.4
0.6
0.8
1.0
1.2
1.4
1.6
1.8
1994
1995
1996
1997
1998
1999
2000
2001
2002
2003
2004
2005
2006
2007
2008
2009
2010
2011
Gg/year
Tier 1 CO2 Tier 2 CO2
Tier 1 CH4 Tier 2 CH4
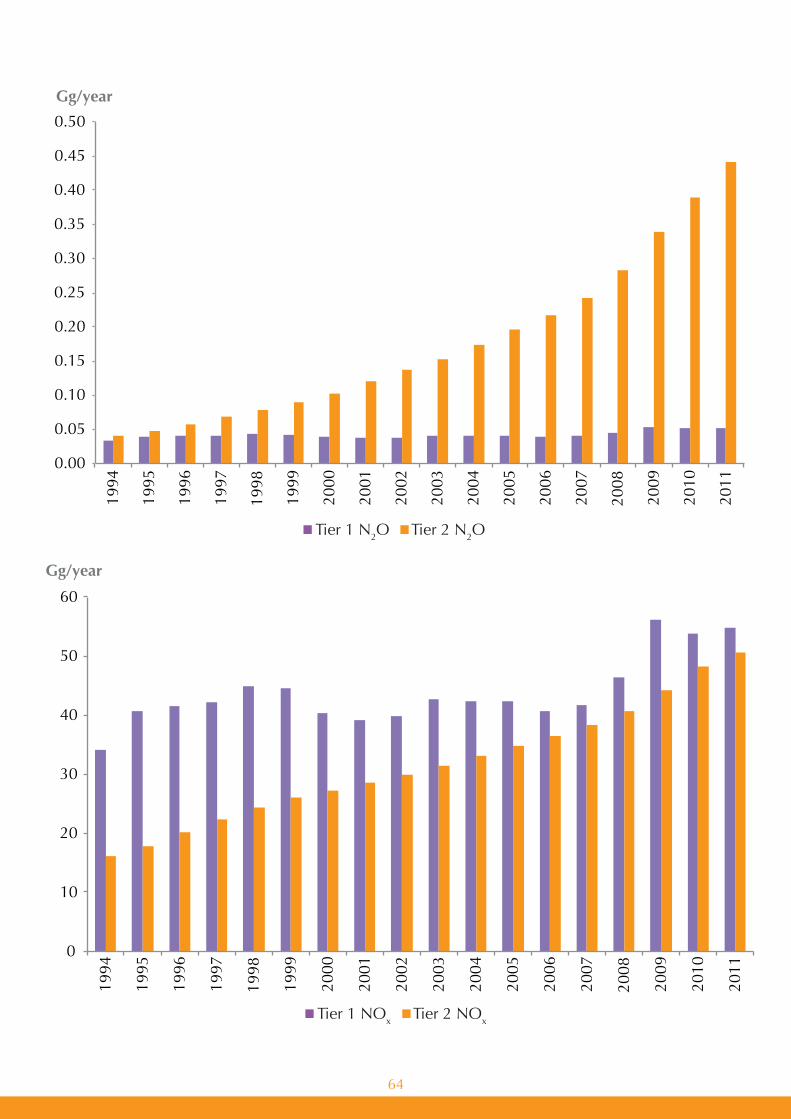
64
Tier 1 N2O Tier 2 N2O
0.00
0.05
0.10
0.15
0.20
0.25
0.30
0.35
0.40
0.45
0.50 19
94
1995
1996
1997
1998
1999
2000
2001
2002
2003
2004
2005
2006
2007
2008
2009
2010
2011
Gg/year
Tier 1 NOx Tier 2 NOx
0
10
20
30
40
50
60
1994
1995
1996
1997
1998
1999
2000
2001
2002
2003
2004
2005
2006
2007
2008
2009
2010
2011
Gg/year
Tier 1 N2O Tier 2 N2O
Tier 1 NOx Tier 2 NOx

65
Tier 1 CO Tier 2 CO
0
100
200
300
400
500
600
700 19
94
1995
1996
1997
1998
1999
2000
2001
2002
2003
2004
2005
2006
2007
2008
2009
2010
2011
Gg/year
Tier 1 NMVOCs Tier 2 NMVOCs
0
20
40
60
80
100
120
1994
1995
1996
1997
1998
1999
2000
2001
2002
2003
2004
2005
2006
2007
2008
2009
2010
2011
Gg/year
Tier 1 CO Tier 2 CO
Tier 1 NMVOCs Tier 2 NMVOCs

66
Tier 1 SO2 Tier 2 SO2
0
1
2
3
4
5
6
1994
1995
1996
1997
1998
1999
2000
2001
2002
2003
2004
2005
2006
2007
2008
2009
2010
2011
Gg/year
Tier 1 SO2 Tier 2 SO2

67
AnnexIII:Tier1GHGemissionscomparisonbetweenSNCandTNC
CO2 SNC CO2 TNC
0
500
1,000
1,500
2,000
2,500
3,000
3,500
4,000
4,500
2000 2001 2002 2003 2004 2005 2006
Gg/year of CO2
CH4 SNC CH4 TNC
2000 2001 2002 2003 2004 2005 2006 0.0
0.2
0.4
0.6
0.8
1.0
1.2
1.4
Gg/year of CH4

68
N2O SNC N2O TNC
2000 2001 2002 2003 2004 2005 2006 0.00
0.05
0.10
0.15
0.20
0.25
Gg/year of N2O
NOx SNC NOx TNC
0
5
10
15
20
25
30
35
40
2000 2001 2002 2003 2004 2005 2006
Gg/year of NOx

69
CO SNC CO TNC
0
50
100
150
200
250
300
350
400
450
500
2000 2001 2002 2003 2004 2005 2006
Gg/year of CO
NMVOCs SNC NMVOCs TNC
0
10
20
30
40
50
60
70
80
90
2000 2001 2002 2003 2004 2005 2006
Gg/year of NMVOCs

70
SO2 SNC SO2 TNC
0.0
0.5
1.0
1.5
2.0
2.5
3.0
3.5
4.0
2000 2001 2002 2003 2004 2005 2006
Gg/year of SO2

NATIONAL GREENHOUSEGAS INVENTORY REPORT
AND MITIGATION ANALYSISFOR THE TRANSPORT SECTOR
IN LEBANON
https://climatechange.moe.gov.lb/
Top Related