


Languages
Pages
Legal


NASA CR -134609
BCAC D6-41521
727 AIRPLANE SIDE INLET LOW-SPEED PERFORMANCE
.CONFIRMATION MODEL TEST FOR REFANNED
JT8D ENGINES
(NASA-CR-134609) NHE 727 AIPLAN2 SIDE N74-2066
INBE LCW-SPEED PEdFCREACE CC FIMATION
ACDEL TEbZ FOE REFANNED JT8D ENGINES
(Boeinq Commercial Airplane Co., Seattle) Unclas
p HC $7.25 CSCL 01C G3/02 35579
by A. L. Schuehle
BOEING COMMERCIAL AIRPLANE COMPANY
A DIVISION OF
THE BOEING COMPANY
Prepared for
NATIONAL AERONAUTICS AND SPACE ADMINISTRA
NASA Lewis Research Center
Contract NAS3-17842
Reproduced by TEc NICAL
INFO oN SA c V\CEUS prg* e5D , IA. 22151

NOTICE
THIS DOCUMENT HAS BEEN REPRODUCED FROM THE
BEST COPY FURNISHED US BY THE SPONSORING
AGENCY. ALTHOUGH IT IS RECOGNIZED THAT CER-
TAIN PORTIONS ARE ILLEGIBLE, IT IS BEING RE-
LEASED IN THE INTEREST OF MAKING AVAILABLE
AS MUCH INFORMATION AS POSSIBLE.

1. Report No. 2. Government Accession No. 3. Recipient's Catalog No.CR-134609
4. Title and Subtitle 5. Report Date
727 Airplane Side Inlet Low-Speed Performance March 1974
Confirmation Model Test for Refanned JT8D Engines 6. Performing Organization Code
7. Author(s) 8. Performing Organization Report No.
A. L. Schuehle D6-41521
10. Work Unit No.
9. Performing Organization Name and Address
Boeing Commercial Airplane Company 11. Contract or Grant No.P.O. Box 3707Seattle, Washington 98124 NAS3-17842
13. Type of Report and Period Covered
12. Sponsoring Agency Name and Address Contractor Report
National Aeronautics and Space Administration 14. Sponsoring Agency CodeWashington, D.C. 20546
15. Supplementary Notes
Project Manager, A. A. MedeirosNASA Lewis Research Center, Cleveland, Ohio 44135
16. Abstract
This report presents the results of a low-speed wind tunnel test of a 0.3 scale model 727 airplaneside inlet for Pratt & Whitney Aircraft JT8D-100 engines. The test was conducted by the PropulsionTechnology Staff of the Boeing Commercial Airplane Company under authorization of NASA ContractNAS3-17842, "Phase II Program on Ground Test of Refanned JTSD Engines and Nacelles for the 727Airplane". The objectives of the test were to develop lines for a full-scale flightworthy inlet,to evaluate inlet total pressure recovery and steady-state total pressure distortion, and toobtain model-scale distortion data which can be used in the assessment of the compatibility ofthe inlet with the JT8D-100 series engines. A secondary objective was to obtain internal/external cowl static pressures for the determination of nacelle loads.
Two basic inlet models were tested at static, forward speed, angle-of-attack (inflow angle), andcross-wind conditions. One model was with and one without an acoustic ring. Two modifications tothe models were also tested, one with the ring closer to the inlet throat and one with a largerlip. Test measurements consisted of inlet surface static pressure, engine face total pressure,inlet airflow, tunnel total pressure, tunnel total temperature and tunnel velocity. Totalpressure traverses were taken directly behind the ring and strut. No dynamic measurements weretaken.
Test results indicate acceptable inlet total pressure recovery and total pressure distortion atstatic, forward speed, and angle-of-attack conditions. At cross-wind conditions, the two basicinlets had acceptable distortion at 11 knots cross wind, but the distortion became marginal whencompared to the Pratt & Whitney Aircraft limits at 20 knots cross wind.
17. Key Words (Suggested by Author(s)) 18. Distribution Statement
727 AirplaneSide Inlet Unclassified - UnlimitedInlet Pressure Recovery and DistortionRefanned JT8D EngineInlet Wind Tunnel Test
19. Security Classif. (of this report) 20. Security Classif. (of this page) 21. No. of Pages 22. Price'
Unclassified Unclassified 80
* For sale by the National Technical Information Service, Springfield, Virginia 22151
NASA-C-168 (Rev. 6-71)

FOREWORD
The low-speed wind tunnel test described in this report was
performed by the Propulsion Technology Staff of the Boeing
Commercial Airplane Company,A Division of The Boeing Company,
Seattle, Washington. The work, sponsored by NASA Lewis Research
Center and reported herein, was performed between October 1973
and February 1974.
This report has been reviewed and is approved by:
L. J. inslow, Group Engineer DatePropulsion Technology Staff
J. . F rell DateChief, taff TechnologyJT8D Refan Porgram
K. P. Rice DateProgram ManagerJT8D Refan Program
Preceding page blank
III

TABLE OF CONTENTSPage
1.0 SUMMARY -------------------------------------------- 1
2.0 INTRODUCTION --------------------------------------- 5
2.1 BACKGROUND ------------------------------------ 5
2.2 INLET DESIGN ---------------------------------- 6
2.2.1 Design Constraints and Goals ----------- 6
2.2.2 Design Procedure ----------------------- 7
3.0 MODEL AND TEST DESCRIPTION -------------------------11
3.1 MODEL DESCRIPTION AND MODEL INSTRUMENTATION---- 11
3.2 TEST FACILITY AND FACILITY INSTRUMENTATION-----12
3.3 TEST PROCEDURE AND TEST CONDITIONS ------------ 13
3.4 DATA REDUCTION AND PRESENTATION --------------- 15
4.0 RESULTS AND DISCUSSION ----------------------------- 17
4.1 SURFACE MACH NUMBER DISTRIBUTION -------------- 17
4.2 TOTAL PRESSURE RECOVERY ----------------------- 17
4.3 TOTAL PRESSURE DISTORTION -------------------- 19
4.3.1 Engine Face Pressure Recovery Maps ----- 19
4.3.2 Pratt & Whitney Aircraft Distortion-----20Criteria
4.4 COMPARISON WITH EXISTING 727 SIDE INLET ------- 23
4.4.1 Inlet Geometry and Airflow ------------- 23
4.4.2 Total Pressure Recovery ---------------- 24
4.4.3 Total Pressure Distortion -------------- 24
5.0 CONCLUSIONS ---------------------------------------- 25
6.0 FIGURES---------------------------------------------27
APPENDIX A - SYMBOLS ------------------------------------ 71
APPENDIX B - INLET COORDINATES -------------------------- 75
RFFFRENCES ------------------------------------------------ 79
Preceding page blankV

1.0 SUMMARY
A low-speed performance confirmation model test was conducted
for a Boeing 727 airplane side engine inlet designed for use
with refanned JT8D engines (designated the JT8D-100 series).
The test was conducted in the Boeing Low-Speed Wind Tunnel
located at North Boeing Field, Seattle, Washington.
The objectives of the test were:
* To develop lines for a full-scale flightworthy inlet, for
ground test, with performance (total pressure recovery and
distortion) comparable to the existing 727 side inlet.
* To evaluate inlet total pressure recovery and steady-state
total pressure distortion of the side engine inlet at JT8D-100
engine airflows at low-speed and cross-wind conditions.
* To obtain model-scale distortion data which can be used in the
assessment of the compatibility of the inlet with the
JT8D-100 series engines.
A secondary objective of the test was to obtain internal/
external cowl static pressures for the determination of nacelle
loads.
Two basic 0.3 scale models (AHI/ATH = 1.25), without acoustic
treatment, were tested at static, forward speed, angle-of-attack
(inflow angle), and cross-wind conditions. The two models were
without an acoustic ring (Configuration 1) and with an acoustic
ring (Configuration 2). Two inlets were designed and tested so
that full-scale ground test hardware fabrication could proceed
on the basis that either inlet Configuration 1 or 2 could be
ground tested. Two modifications to these basic models were
tested at a selected number of conditions. The modifications
consisted of using a larger lip (Configuration 1L,

AHI/ATH = 1.30) to investigate improved cross-wind performance;
and moving the acoustic ring leading edge closer to the throat
(Configuration 2R) to obtain more acoustic surface area.
Test measurements consisted of inlet internal and external sur-
face static pressure, engine face total pressure, inlet airflow,
tunnel total pressure, tunnel total temperature, and tunnel
velocity. Total pressure traverses were taken directly behind
the ring and strut. No dynamic measurements were taken.
Conclusions drawn from the test are:
* The cruise and angle-of-attack recovery and distortion of
the Configuration 1 inlet, accounting for acoustic treat-
ment, will be slightly better than that of the existing 727
inlet.
* The cruise recovery of the Configuration 2 inlet, excluding
acoustic treatment, will be slightly lower (0.003) than that
of the Configuration 1 inlet.
* The Configuration 1 and 2 inlets have an acceptable distortion
at 11 knots cross wind, but the distortion becomes marginal
when compared to the Pratt & Whitney Aircraft limit at
20 knots cross wind. The 30 knot cross-wind condition at
70 knots forward speed (cross wind/rolling takeoff) shows an
acceptable distortion level. The two inlets were designed
using a throat Mach number and lip contour that give an
equivalent or slightly better cross-wind performance than
the existing 727, and using normal operating procedures
cross-wind performance should not present a problem. For a
small cruise performance penalty, Configuration LL will
provide additional static cross-wind capability (up to
30 knots).
2

* The acoustic ring of Configuration 2 provides a baffling ef-
fect, when compared to Configuration 1, keeping the low
pressure distorted flow in the outer annulus. This results
in a "clean" core flow at all test conditions.
* The Configuration 2R inlet showed that the ring leading edge
may be moved further into the throat, thus providing more
acoustic treatment area, without a static, cross-wind or
angle-of-attack recovery or distortion penalty.
3

2.0 INTRODUCTION
2.1 BACKGROUND
The Pratt & Whitney Aircraft JT8D-100 engine is a derivative of
the basic JT8D turbofan engine modified to incorporate a new
larger diameter, single-stage fan with a bypass ratio of 2.0
and two supercharging low-pressure compressor stages. The
modification lowers jet noise, increases takeoff and cruise
thrust, and lowers specific fuel consumption. The use of a
JT8D-lOO series engine, also referred to as a refanned JT8D,
on the Boeing 727 airplane requires a larger side engine inlet
due to the increased engine diameter and increased engine air-
flow. A new airplane nacelle for JT8D-100 series engines is
currently being developed through a joint Boeing/NASA effort.
Two side inlet configurations have been designed for the
nacelle. The inlets were designed considering inlet acoustic
performance. The design and test results of the two inlets,
along with test results for two modifications to these inlets,
are the subjects of this report. The test evaluated the inlet
internal aerodynamic performance at low-speed and cross-wind
conditions using 0.3 scale models. The test was conducted
during November and December 1973, in the Boeing Low-Speed
Wind Tunnel, located at North Boeing Field, Seattle, Washington.
The objectives of the test were:
* To develop lines for a full-scale flightworthy inlet, for
ground test, with a performance (total pressure recovery and
distortion comparable to the existing 727 side inlet.
* To evaluate the inlet total pressure recovery and steady-
state total pressure distortion of the side engine inlet
at JT8D-1OO0 engine airflows at low-speed and cross-wind
conditions.
Preceding page blank5

* To obtain model-scale distortion data which can be used in the
the assessment of the compatibility of the inlet with the
JT8D-100 series engines.
A secondary objective of the test was to obtain internal/external
cowl static pressures for the determination of nacelle loads.
This test was performed under authorization of NASA Contract
NAS33-17842, "Phase II Program on Ground Test of Refanned JT8D
Engines and Nacelles for the 727 Airplane," to support the
development of a new 727 side engine inlet.
2.2 INLET DESIGN
2.2.1 Design Constraints and Goals
The following constraints were imposed on the side inlet design:
* The inlet diameter at the engine face (D2 ) shall be 50.1
inches.
* To avoid interference with galley door access the inlet
length to diameter ratio (L/D 2 ) shall not be greater than
0.8.
* Two inlets shall be designed, one with and one without an
acoustic splitter ring.
The inlet corrected airflow capability shall be as follows:
(1) 467 lb/sec at takeoff, sea level static condition,
std. day.
(2) 480 lb/sec at MCR, 0.8Mo , 30,000 ft., std. day.
(3) 501 lb/sec at MCT, 0.6M co, 35,000 ft., std. day.
The maximum JT8D-100 engine cold day airflow at both
sea level and 10,000 ft., -60OF ambient temperature, is
516 lb/sec. Applying a +3 percent production engine
airflow tolerance results in a 531.5 lb/sec maximum
airflow.
6

The inlet angle-of-attack (inflow angle) capability shall be
greater than or equal to the angles measured during the
Reference 1 wind tunnel flowfield test. The maximum angle
measured during the test was found to be a 17 degree down-
wash angle relative to the engine centerline during unstalled
wing operation.
The following design goals were set:
* A cross-wind capability equivalent to or better than the
existing 727 production side inlet.
Total pressure distortion and recovery levels, for the inlet
without an acoustic ring, equivalent to or better than the
existing 727 production inlet.
2.2.2 Design Procedure
A number of inlets, both with and without acoustic splitter
rings, have been designed and model tested during past studies
at the Boeing Company. The design procedure evolved from these
past studies was generally followed in this design. This
involves laying out a lip, diffuser, and centerbody contour
which accounts for the following:
* internal flow considerations
* acoustic considerations
* engine airflow schedule
e inlet angle-of-attack (inflow angle)
* inlet cross-wind capability
* external aerodynamic considerations
* manufacturing considerations
The empty inlet potential flow field is then computed using an
axially symmetric, compressible, potential flow computer analysis.
The contours are then modified if the potential flow results
indicate flow regions which may be improved. If the inlet is
to be used with an acoustic ring the empty inlet contours are
7

designed so as to accommodate the added blockage due to the ring.
The ring contour is then wrapped around the potential flow
streamline (particular streamline dictated by acoustic consid-
erations) with a new potential flow field being computed after
the ring insertion. The placing of the splitter around the
natural streamline should produce the least amount of flow
disturbance. Further refinements in the contours are then made
if flow field results indicate improvements can be made. No
account is made in the potential flow computations for the
struts which support the ring.
Based on the Reference 2 high speed nacelle drag test it was
determined that axially symmetric side inlets with a highlight
diameter of 52.2 inches would be satisfactory. A lip contraction
ratio (AHI/ATH) of 1.25, identical to the present 727, was
selected since the present 727 lip has not presented problems
during operation. Based on other Boeing studies a super ellipse( )2.2 + (y ) 2.2 = 1] was selected for the lip contour.
The highlight diameter and specified contraction ratio yield a
throat area (1712.81 inches2 ) which gives a one dimensional
cruise throat Mach number similar to the existing 727 with
JT8D-l or -7 engines. At a corrected airflow of 480 lb/sec.
the JT8D-100 inlet throat Mach number is 0.57. Based on manu-
facturing considerations it was decided to make all internal
surfaces axially symmetric. This could be done and still meet
the angle-of-attack and cross-wind objectives discussed in
Section 2.2.1.
The design procedure was applied to develop inlets with and
without an acoustic ring. Early in the design it was decided
that a common lip, diffuser, and nose dome would be used for
the two inlets. This common aspect makes it possible to decide
later in the development phase whether or not to use an acoustic
ring. It also makes it impossible to truly optimize both
8

configurations, though with the relatively thin acoustic ring
(0.7 inches full scale) the penalty is small.
The two inlet configurations are shown in Figure 1.
Configuration 1 is without and Configuration 2 with the acoustic
ring. Figures 2 and 3 show the Mach number distributions obtained
from the potential flow analysis. All analyses were done using
the 480 lb/sec cruise corrected airflow. The Configuration 2
ring leading edge location was selected based on the inter-
section of the near static (V, = 15 knots) and forward speed
(Moo = .8) streamlines as shown on Figure 2, and, on past Boeing
work. The ring trailing edge is one inch upstream of the engine
face. This provides ring removal clearance with a near maximum
of acoustic surface for the inlet length constraint. This also
allows a substantial distance (approximately 14 inches) between
the ring trailing edge and the first stage fan. The ring radial
location, determined from acoustic considerations, is on the
streamline which is equidistant from the cowl and nose dome at
the engine face.
For reference purposes the one dimensional throat and engine
face Mach numbers as a function of corrected airflow and the
one dimensional area distribution for the two inlets are shown
in Figure 4. It should also be pointed out that on the refan
engine the nacelle slopes 3 degrees out from the airplane body
buttock line and 3 degrees 22 minutes up from the airplane
body water line. This is approximately the same on the
existing 727 nacelle.

3.0 MODEL TEST DESCRIPTION
3.1 MODEL DESCRIPTION AND MODEL INSTRUMENTATION
The inlets tested were 0.2994 scale axially symmetric aluminum
models. All wall surfaces were hardwall, therefore without
acoustic material. In addition to the Configuration 1 and 2
inlets described in the previous section two modifications to
these basic inlets were also tested. An additional lip
(AHI/ATH = 1.30, Configuration IL) was tested at cross-wind
conditions to determine the potential for improved cross-wind
performance. A ring and centerbody assembly (Configuration 2R),
built for the NASA Phase I Refan Program, was tested to evaluate
extending the ring leading edge closer to the inlet throat. All
four inlet configurations, shown in Figure 5, used a common dif-
fuser. Configurations 1 and 2 internal contours are identical
to that currently being developed for the full-scale ground
test. The strut contour and strut circumferential spacing
have been changed slightly on the full-scale Configuration 2
inlet. A tabulation of the coordinates for all four models is
given in Appendix B.
The models were tested without fuselage simulation at static,
forward speed, and angle-of-attack conditions. The airplane
fuselage was simulated during static and cross-wind testing,
the windward side inlet being tested. Photos of the model in
the cross-wind and forward speed installation and a view into
the inlet are shown in Figures 6, 7, and 8 respectively.
Figure 9 shows a sketch of the inlet in the cross-wind and forward
speed installations.
A total of 57 static ports were utilized on the Configuration 1
inlet, 77 on Configuration 2. Configuration 1L and 2R utilized
the eight engine face static pressure ports only. Figure 10
shows the location of the static ports.
Preceding page blank 1 D

Engine face total-pressure measurements were made using an
existing fifteen-inch diameter, four-arm (16 probes per arm)
rotating rake. The closest total pressure probes to the cowl
and nose dome being 0.15 inches model scale. Measurements were
taken at angular increments of 15 degrees. For a portion of
the test conditions two total pressure traversing probes,
located 180 degrees apart at the engine face, were used to
obtain a detailed definition of the strut and ring wakes.
Figure 11 shows a sketch of the rotating rake and traversing
probes. Only steady state measurements were taken during the
test.
3.2 TEST FACILITY AND FACILITY INSTRUMENTATION
The test was conducted in the Boeing Low-Speed Wind Tunnel "B"
facility. The tunnel contains a 9 foot by 9 foot square test
section. An Allison 501-D13 gas turbine driving a variable
pitch propeller is used to draw atmospheric air through the
bellmouth, flow straighteners, and test section. The test section
airspeed could be varied from approximately 0 to 180 knots.
Engine airflow simulation was obtained by using a General Electric
J-47 turbojet engine as a pumping source. Air was drawn through
the inlet model, a venturi meter and into the engine. Venturi
airflow measurements were accurate to within +1 percent of the
measured value. A 19 percent blockage screen (0.41 inch mesh
with 0.041 inch diameter wire) was used for most test conditions.
The screen was located as near the fan face station as possible
(4-3/4 inches model scale from the engine face) in order to
simulate the upstream effects of the fan rotor on the flow. With
the screen installed the inlet choked at a simulated full scale
corrected air flow of 502 lb/sec. Without the screen airflows in
excess of 570 lb/sec. were possible.
Tunnel total and static pressure, tunnel total temperature and
venturi temperatures and pressures were recorded for each test
12

condition. This steady-state data along with the model steady
state data were recorded on the standard 9 x 9 Low Speed Wind
Tunnel data acquisition system. This system, a Hewlett-Packard
Dymec 2010D, is a trap and scan scannivalve system with output
on punched paper tape. The capability of monitoring on-line
engine RPM and a selected number of static pressures was available
for setting test conditions.
3.3 TEST PROCEDURE AND TEST CONDITIONS
After the model was assembled, leak checked, and the instrumen-
tation zero checked, the tunnel velocity and inlet airflows were
set and allowed to stabilize for at least 30 seconds. Data were
then recorded at various rake angles (at 15 degree increments
between 7.5 and 82.5 degrees). Model surface pressure measure-
ments were recorded at the first rake angle only.
Data were taken for static, crosswind and angle-of-attack
(0 to 22.5 degrees) conditions. Data were taken for a full
scale corrected airflow range of 180 to approximately 502 lb/sec
with the screens and up to 560 lb/sec without the screens.
Table 1 shows a summary of the test conditions at which the
various models were tested. As shown on Table I the inlet angle
of attack is actually a downwash due to the presence of the wing.
Because of facility limitations all angles were in the upwash
direction for the test model. Thus to go from the model test
configuration to the airplane configuration all angles-of-attack
results must be rotated by 180 degrees. The 76 knot, 22.5 degree
installation simulates a 30 knot cross-wind 70 knot forward speed
condition. The higher velocities at 22.5 degrees were run for
the determination of nacelle loads. The nacelle loads results
are reported in Reference 3.
13

TABLE I
CONFIGURATION NO. I CONFIGURATION NO. 2INLET ANGLE-OF-ATTACK INLET ANGLE-OF-ATTACK
RUN NUMBER -o*, 17.*, 22.s5 , . RUN NUMBER .-o*, 14.8", 17.5", 22.5, o*
B0, o, o', 9 0* 0-o, o', o*, o', 9o0
0 I 0 39 1342
II 4 10 14
1520 3 20 18
16
30 20 19
35 I45 35 38
8 70 1Q , 70 37
76 47 76 26
28 22180 43 4 " 100 Q) 31
*33 27
120 23CONFIGURATION NO. IL
INLET ANGLE-OF-ATTACK 150 49 32 24
RUN NUMBER .0' 34
0-o90 180 36 50 30 (S
0 S 40 5 1 3 5 2 5
CONFIGURATION NO. 2R
10 RUN NUMBER INLET ANGLE-OF-ATTACKSa-17.5*
, 0*
20 0, 90
I-bd 0 9
30 II
2 20 10
NOTES: 3 .
(D Cross wind (Bg 90 ) with 180 52
fuselage except as noted,.other conditions withoutfuselage.
) without screens also.
) Without fuselage. tWLEI) Static pressure data only. OWL
$ Without screens only. 3 22'
14

3.4 DATA REDUCTION AND PRESENTATION
During the test program data were reduced using a standard
Boeing data reduction computer program for inlet tests. Data
were reduced using a quick look and final reduction version of
the program.
Quick-look data were obtained by processing the punched paper
tape through the Boeing Mechanical Laboratories. SDS 92 computer.
The tabular output consisted of total and static pressure
measurements, surface Mach number distributions, surface pres-
sure coefficients, surface pressure ratios, the rotating rake
pressure array, inlet recovery, inlet airflow, and the steady-
state distortion parameter (PT Max - PT Min)/PT2.
Additional quick look (on line) data were obtained from the test
facilities own PDP8 computer. This consisted of tunnel condi-
tions, inlet airflow, and the rotating rake pressure array.
Final data were obtained by generating a magnetic tape from the
paper tape and processing it through the Boeing CDC 6600 computer.
The final data consisted of tabular information similar to that
obtained from the quick look data plus the distortion para-
meters defined by Pratt & Whitney Aircraft (see Section 4.3.2).
Engine face plots showing lines of constant total pressure
recovery were also generated on the CDC 6600 computer. All
final data are permanently stored on microfilm.
The total pressure recovery measurements (PT2 /PT) presented in
this document are computed on an area-average basis. The cowl
wall region is handled by taking the average of the wall static
pressure measurement and the closest total pressure probe
multiplied by the annular area segment between the two. Inter-
15

mediate regions are handled by multiplying the annular area
segment between any two probes by the average of their total
pressures. The nose dome wall region is computed by taking
a straight line fit from the last two total pressure probes to
the wall. The nose dome was handled in this manner because its
boundary layer is very thin, and of a high power law exponent,
and straight line fitting to the wall static pressure would
over estimate the loss in this region.
All airflow data presented in this report have been converted
from 0.2994 model scale to full scale values.
16

4.0 RESULTS AND DISCUSSION
4.1 SURFACE MACH NUMBER DISTRIBUTION
Surface Mach number distributions at zero and 17.5 degrees angle
of attack are shown in Figures 12 and 13 for Configurations 1 and
2 respectively. The analytical results plotted in the figures,
are in good agreement with the data for the region from near the
throat to the engine face. In the lip region the results differ
since the analysis was done for a Moo = .8 whereas the data is
for a VT = 180 knots. At 17.5 degrees inlet angle of attack lip
Mach numbers in excess of 1.3 were measured on the lower lip,
the internal surface Mach numbers downstream of the throat re-
maining approximately the same.
4.2 TOTAL PRESSURE RECOVERY
Configuration 1 total pressure recoveries at static, cross-wind,
forward speed, and angle-of-attack conditions are shown in
Figures 14 and 15. As shown in Figure 14 at cross-wind
velocities greater than 11 knots the recovery deteriorates
rapidly. Figure 15 shows the recovery at the static condition
with and without the fuselage. Without the fuselage a vortex
was visually observed at static conditions coming off the tunnel
side wall. This was also observed in the engine face measure-
ments and accounts for the lower recovery without the fuselage
at higher inlet airflows. At the angle-of-attack conditions,
of 22.5 and 17.5 degrees the inlet shows high recoveries. At
the 70 knot forward speed condition, shown on Figure 15, the
inlet recovery level is nearly as high as that measured at
180 knots.
Configuration 2 total pressure recoveries at static, cross-wind,
forward speed, and angle-of-attack conditions are shown in
Figures 16 and 17. The same type of statements can be made
17

concerning the Configuration 2 inlet performance as were made
for the Configuration 1 inlet, except, that due to the ring
surface area the recovery level is lower. There was no
evidence of ring leading edge separation at the static, forward
speed or angle-of-attack conditions. The inlet was tested with-
out the screens and without the fuselage at static and cross-
wind conditions. For the static condition the presence of the
screens made little difference in the recovery; but, at the cross-
wind condition of 30 knots the screens provided an improvement
in the recovery as shown in Figure 16. The presence of the
fuselage provided some improvement at the static condition as
shown in Figure 17 and a substantial improvement at the 20 and
30 knot cross-wind conditions as shown in Figure 16. The inlet
recovery did not vary substantially over the range of tunnel
velocities and angle-of-attack conditions tested as shown in
Figure 17. As with the Configuration 1 inlet the Configuration 2
pressure recovery at 70 knots forward speed is nearly as high
as that at 180 knots.
Total pressure traverses of the ring wake and strut wakes were
taken at the engine face for the Configuration 2 inlet.
Figure 18 shows a portion of the results. At the cruise air-
flow a minimum pressure ratio (PT/PTc) of 0.88 was measured
behind the ring and 0.958 behind the struts. By integrating
the ring and wake traverse measurements of Figure 18 (assuming
the wake does not change along the trailing edge) the loss due
to the strut and ring may be estimated. The cowl and nose dome
loss may be obtained from rotating rake measurements, along with
a second measurement of the ring loss. When this is done the
total pressure loss (1-recovery, where the recovery is as
discussed in Section 3.4) for each component of the Configuration 1
and 2 inletsat a corrected airflow of 481 lb/sec is as
follows:
18

Loss (1-Recovery)
Cowl 0.0050 } Configuration 1 and 2Nose Dome 0.0000 JRing 0.0030Struts 0.0003 JConfiguration 2
Total 0.0083
The static and cross-wind recovery measurements of the Configu-
ration 1L inlet are shown in Figure 19. Because of the high
contraction ratio (AHI/ATH = 1.30) the inlet showed high recovery
levels even at the 30 knot cross-wind condition.
The static, angle-of-attack and cross-wind recovery of the
Configuration 2R inlet is shown in Figure 20. The recovery
levels measured on the 2R model are comparable to the Configu-
ration 2 model indicating that the Configuration 2 acoustic ring
leading edge may be extended closer to the throat.
4.3 TOTAL PRESSURE DISTORTION
4.3.1 Engine Face Pressure Recovery Maps
Engine face pressure recovery maps show lines of constant steady
state total pressure recovery at the engine face station. Such
maps are useful as a visual aid. Although recovery maps were
made for all test conditions only a select few are shown. These
consist of:
Figure 21 Configuration 1 at 180 knots and ff= 17.50
Figure 22 Configuration 1 at 20 knots cross wind
Figure 23 Configuration 2 at 180 knots and d= 17.50
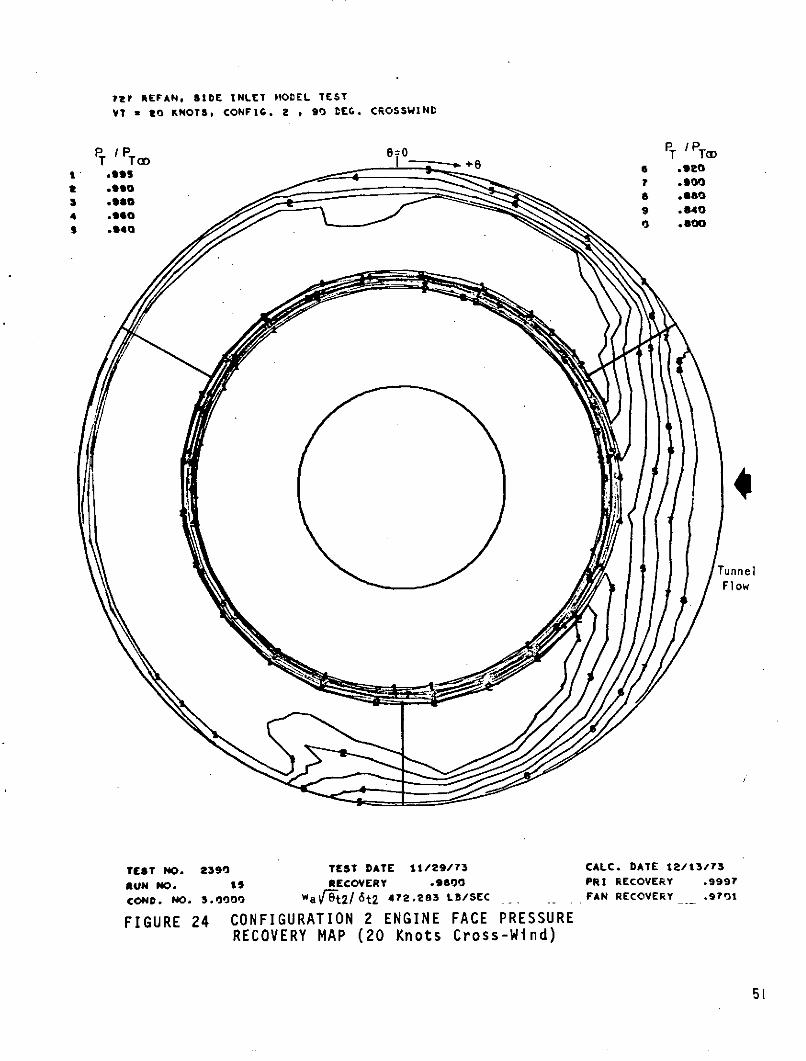
Figure 24 Configuration 2 at 20 knots cross wind
Figure 25 Configuration 1L at 30 knots cross wind
19

The Configuration 1 recovery map, Figure 21, shows a small low
pressure region downstream of the lower lip during angle-of-
attack operation. Figure 22 shows a large low pressure region
towards the windward side at a 20 knot cross-wind condition.
The Configuration 2 recovery map, Figure 23, shows a similar low
pressure region, as that of Configuration 1, at the lower lip
during angle-of-attack operation. Also the low pressure region
directly behind the acoustic ring can be seen in the figure. The
strut wakes do not show since the rotating rake was oriented so
as to avoid taking measurements directly behind the struts.
Figure 24 shows the Configuration 2 inlet at a 20 knot cross-
wind condition. As shown on the figure the ring provides a
baffling effect, keeping the distorted low pressure flow in the
outer annulus.
Figure 25 shows the Configuration LL inlet at a 30 knot cross-
wind condition. Even with the high cross flow velocity, and
high inlet airflow (481 lb/sec), the low pressure region remains
relatively small.
4.3.2 Pratt & Whitney Aircraft Distortion Criteria
Radial and circumferential total pressure distortion parameters
and limits have been defined by Pratt & Whitney Aircraft for the
JT8D-100 series engines. The distortion parameters and limits,
described in Reference 4, are for instantaneous total pressures.
The radial distortion limit of Reference 4 has since been updated
to the limit shown in this document. The parameters are defined
as:
* Radial Distortion =
PT Max Ring Avg - PT Local Ring Avg
T Max Ring Avg
where ring averages are taken over a full 3600
20

* Circumferential Distortion =
PT Ring Avg - PT Min Sector Avg
T Ring Avg
where ring averages are taken over a full 3600 and Min Sector
Avg is the lowest average total pressure at a given radius
for the sector of concern (either a 60 degree or 180 degree
sector).
During this test only steady-state total pressure measurements
were taken, consequently the radial and circumferential distortion
data presented are based on steady-state values only.
Distortion values were computed from the data based on the Pratt &
Whitney Aircraft definitions and are presented for the following
conditions:
Figures 26, 27 and 28 Configuration 1, 60 degree circumfer-
ential, 180 degree circumferential, and
radial at static, forward speed, and
angle-of-attack conditions.
Figures 29, 30 and 31 Configuration 1, 60 degree circum-
ferential, 180 degree circumferential,
and radial at cross-wind conditions.
Figures 32, 33 and 34 - Configuration 2, 60 degree circum-
ferential, 180 degree circumferential,
and radial at static, forward speed,
and angle-of-attack conditions.
Figures 35, 36 and 37 - Configuration 2, 60 degrees circum-
ferential, 180 degree circumferential,
and radial at cross-wind conditions.
21

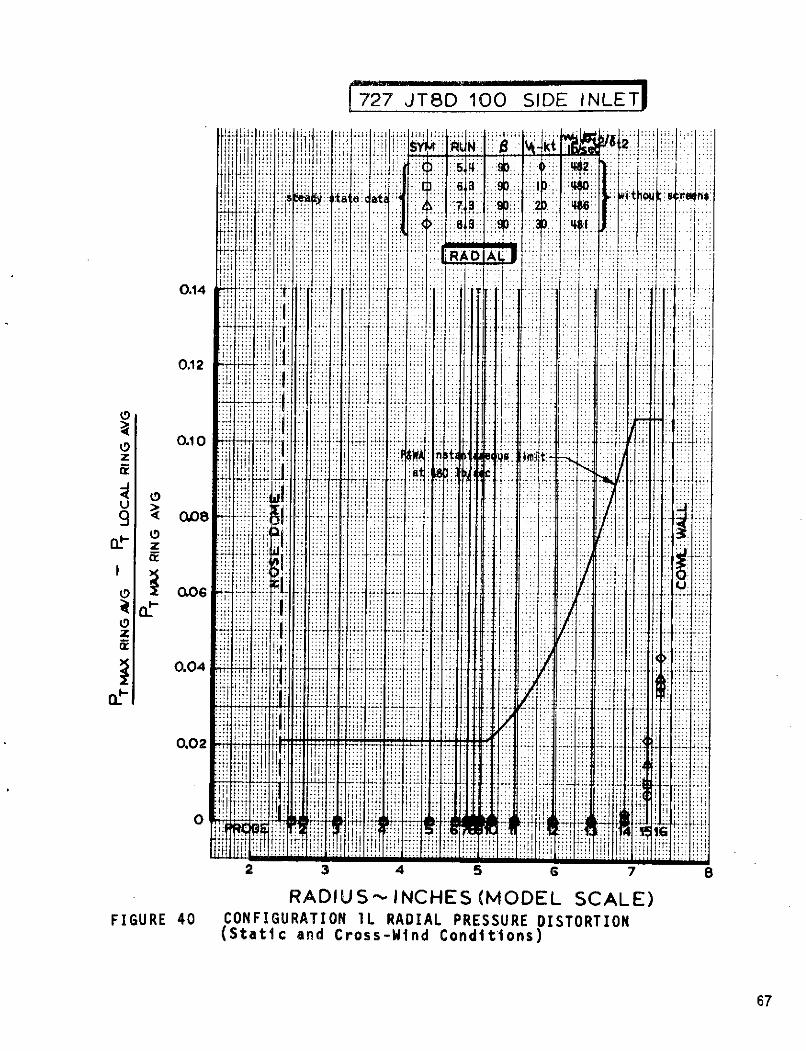
Figures 38, 39 and 40 - Configuration IL, 60 degrees
circumferential, 180 degree circum-
ferential, and radial at static and
cross-wind conditions.
The Configuration 1 inlet distortion falls well below the limit
line at static, forward speed, and angle-of-attack conditions
as shown in Figures 26, 27, and 28. This is true even for the
30 knot cross-wind 70 knot forward speed (cross wind/rolling
takeoff) condition. The steady-state distortion is so low that
even if a dynamic component were measured and an instantaneous
distortion value computed it is expected that the distortion
would remain below the limit. This is also the case for the
11 knot cross-wind condition shown on Figures 29, 30 and 31.
At 20 knots cross wind the 60 degree sector distortion surpasses
the limit as shown on Figure 29. The 180 degree and radial
distortions fall below the limit line as shown on Figures 30
and 31.
The Configuration 2 inlet distortion, with the exception of the
region directly behind the ring (probes 7, 8 and 9), falls well
below the limit lines at static, forward speed, and angle-of-
attack conditions as shown on Figures 32, 33 and 34. This is
expected to be true even if the dynamic component were considered.
The ring wake may be excluded from the limits shown, and when the
limit is exceeded specific distortion patterns will be submitted
to Pratt & Whitney Aircraft for evaluation (Reference 4). The
circumferential distortion behind the ring shown on Figures 32
and 33 is more a measure of the asymmetry of the rotating rake
and the ring rather than a true distortion. For the same reason
the Figure 34 radial distortion behind the ring will be somewhat
larger than that shown. For example the traverse data of
Figure 18 (run 30.5) indicates a radial distortion directly behind
the ring of 12 percent. Whereas, the rotating rake data of
Figure 34 (run 36.5) indicates a radial distortion of 10.8 per-
cent directly behind the ring (probe 8).
22

The Configuration 2 inlet, unlike Configuration 1, falls below
the limit line at 20 knots cross wind as shown in Figures 35, 36
and 37 (run 15.3). The 60 degree sector distortion is near the
limit line and if the dynamic component were accounted for it may
surpass the limit. The 10 knot cross-wind data shown on the
figures (run 14.3) falls well below the limit and if the dynamic
component were considered it is expected that it would remain below
the limit. As with the pressure recovery an improvement was
obtained in the distortion at cross-wind conditions with the
fuselage as shown in the figures.
The Configuration IL inlet falls well below the distortion limit
even up to 30 knots cross wind as shown in Figures 38, 39 and 40.
Even with a dynamic component it is expected that it will fall
well below the limit.
4.4 COMPARISON WITH EXISTING 727 SIDE INLET
4.4.1 Inlet Geometry and Airflow
The JT8D-1OO0 inlet was designed to give internal performance
similar to the production inlet. Consequently many of the design
features are the same. Figure 41 compares the JT8D-lO0 inlet
with the production inlet on a JT8D-15 engine. Depending on
which basic JT8D engine is considered, the JT8D-1OO0 inlet
provided 40 to 48 percent more airflow and is consequently larger
in diameter. The lip contraction ratios of the two inlets and
cruise throat Mach number (when compared to the JT8D-1 and -7)
are the same. Because of galley door access interference problems
the JT8D-1O0 inlet was limited to 40 inches in length. This
is adequate for good internal performance but limits the surface
area available for acoustic treatment.
The production inlet has 40 of turning between the engine face and
highlight. The JT8D-100 is axially symmetric.
23

4.4.2 Total Pressure Recovery
A comparison between the total pressure recovery of the production
and the JT8D-100 inlets is shown on Figure 42. The production
data were taken in the same tunnel facility, for approximately
the same model scale (0.3 compared to 0.37), with comparable
engine face probe placement and data reduction. The data presented
for the production inlet is for a slightly modified model. The
modifications consisted of the cowl diffuser surface being
dished out somewhat, to accommodate acoustic rings in subsequent
testing, and a longer centerbody. As shown in Figure 42 the
JT8D-100 Configuration 1 inlet has a slightly higher recovery,
at zero and 17.5 degrees angle of attack at cruise airflows,
than the modified production model. The Configuration 2 recovery
is slightly lower (.003) than the Configuration 1 inlet at the
cruise airflow.
4.4.3 Total Pressure Distortion
A comparison of the total pressure distortion for the JT8D-100,
the modified production, and the full scale production inlet is
shown in Figure 43. The distortion parameter, shown in the
figure, is for the (average-minimum) /average total pressure ratio
which has been used in past inlet development testing. As shown
in the figure the Configuration 1 model distortion is lower than
that of the modified production inlet.
24
5.0 CONCLUSIONS
The cruise and angle-of-attack recovery and distortion of the
hardwall Configuration 1 inlet will be slightly better than
that of the existing 727 hardwall inlet. Since the new 727
inlet utilizes a maximum of peripheral treatment the same
statement will be true when acoustic treatment is included for
both inlets. The hardwall Configuration 2 cruise recovery will
be slightly lower (0.003) than that of the Configuration 1 inlet.
The Configuration 1 and 2 inlets have an acceptable distortion
at 11 knots cross wind, but the distortion becomes marginal when
compared to the Pratt & Whitney Aircraft limit at 20 knots cross
wind. The 30 knot cross-wind condition at 70 knots forward
speed (cross-wind/rolling takeoff) shows an acceptable distortion.
level. The two inlets were designed using a throat Mach number
and lip contour that give an equivalent or slightly better cross-
wind performance than the existing 727, and using normal operating
procedures cross-wind performance should not present a problem.
For a small cruise performance penalty, Configuration 1L will
provide additional static cross-wind capability (up to
30 knots).
The acoustic ring of Configuration 2 provides a baffling effect,
when compared to Configuration 1, keeping the low pressure
distorted flow in the outer annulus. This results in a "clean"
core flow at all test conditions.
The Configuration 2R inlet showed that the ring leading edge may
be moved further into the throat, thus providing more acoustic
treatment area, without a static, cross-wind, or angle-of-
attack recovery or distortion penalty.
25

6.0 FIGURES
Figure No. Title Page
1 CONFIGURATIONS 1 AND 2 JT8D-lOO SIDE INLET 30
2 CONFIGURATION 2 PREDICTED MACH NUMBER 31DISTRIBUTION
3 CONFIGURATIONS 1 AND 2. SURFACE MACH NUMBER 32DISTRIBUTION (Potential Flow Analysis)
4 CONFIGURATIONS 1 AND 2 AREA DISTRIBUTION AND 33MACH NUMBER
5 SIDE INLET TEST CONFIGURATIONS 34
6 CROSS-WIND INSTALLATION 35
7 CONFIGURATION 2 FORWARD SPEED INSTALLATION 35
8 INLET CONFIGURATION 2 35
9 WIND TUNNEL CROSS-WIND AND FORWARD SPEED 36INSTALLATIONS
10 CONFIGURATIONS 1 AND 2 STATIC PRESSURE 37PORT LOCATIONS
11 ROTATING RAKE CONFIGURATION 38
12 CONFIGURATION 1 SURFACE MACH NUMBER 39DISTRIBUTIONS
13 CONFIGURATION 2 SURFACE MACH NUMBER 40DISTRIBUTIONS
14 CONFIGURATION 1 PRESSURE RECOVERY VS 41AIRFLOW (Static & Cross-Wind Conditions)
15 CONFIGURATION 1 PRESSURE RECOVERY VS 42AIRFLOW (Static, Fwd Speed and Angle-of-Attack Conditions)
16 CONFIGURATION 2 PRESSURE RECOVERY VS 43AIRFLOW (Static and Cross-Wind Conditions)
Preceding page blank
27

Figure No. Title Page
17 CONFIGURATION 2 PRESSURE RECOVERY VS AIR- 44FLOW (Static, Fwd Speed and Angle-of-Attack Conditions)
18 CONFIGURATION 2 ENGINE FACE RING AND STRUT 45TOTAL PRESSURE TRAVERSE
19 CONFIGURATION IL PRESSURE RECOVERY VS 46AIRFLOW (Static & Cross-Wind Conditiions)
20 CONFIGURATION 2R PRESSURE RECOVERY VS AIR- 47FLOW (Static, Angle-of-Attack and Cross-Wind Conditions)
21 CONFIGURATION 1 ENGINE FACE PRESSURE 48RECOVERY MAP (180 Knots @ d = 17.50)
22 CONFIGURATION 1 ENGINE FACE PRESSURE 49RECOVERY MAP (20 Knots Cross Wind)
23 CONFIGURATION 2 ENGINE FACE PRESSURE 50RECOVERY MAP (180 Knots @ i= 17.50)
24 CONFIGURATION. 2 ENGINE FACE PRESSURE 51RECOVERY MAP (20 Knots Cross-Wind)
25 CONFIGURATION 1L ENGINE FACE PRESSURE 52RECOVERY MAP (30 Knots Cross-wind)
26 CONFIGURATION 1 CIRCUMFERENTIAL PRESSURE 53DISTORTION 600 SECTOR (Static, FwdSpeed and Angle-of-Attack Conditions)
27 CONFIGURATION 1 CIRCUMFERENTIAL PRESSURE 54DISTORTION 1800 SECTOR (Static, Fwd Speedand Angle-of-Attack Conditions)
28 CONFIGURATION 1 RADIAL PRESSURE DISTORTION 55(Static, Fwd Speed and Angle-of-AttackConditions)
29 CONFIGURATION 1 CIRCUMFERENTIAL PRESSURE 56DISTORTION 600 SECTOR (Cross-WindConditions)
30 CONFIGURATION 1 CIRCUMFERENTIAL PRESSURE 57DISTORTION 1800 SECTOR (Cross-WindConditions)
28

Figure No. Title Page
31 CONFIGURATION 1 RADIAL PRESSURE 58DISTORTION (Cross-Wind Conditions)
32 CONFIGURATION 2 CIRCUMFERENTIAL PRESSURE 59DISTORTION 600 SECTOR (Static, Fwd Speedand Angle-of-Attack Conditions)
33 CONFIGURATION 2 CIRCUMFERENTIAL PRESSURE 60DISTORTION 1800 SECTOR (Static, Fwd Speedand Angle-of-Attack Conditions)
34 CONFIGURATION 2 RADIAL PRESSURE DISTORTION 61(Static, Fwd Speed and Angle-of-AttackConditions)
35 CONFIGURATION 2 CIRCUMFERENTIAL PRESSURE 62DISTORTION 600 SECTOR (Static and Cross-Wind Conditions)
36 CONFIGURATION 2 CIRCUMFERENTIAL PRESSURE 63DISTORTION 1800 SECTOR (Static andCross-Wind Conditions)
37 CONFIGURATION 2 RADIAL PRESSURE DISTORTION 64(Static and Cross-Wind Conditions)
38 CONFIGURATION IL CIRCUMFERENTIAL PRESSURE 65DISTORTION 60 SECTOR (Static and Cross-Wind Conditions)
39 CONFIGURATION 1 CIRCUMFERENTIAL PRESSURE 66DISTORTION 180 SECTOR (Static and Cross-Wind Conditions)
40 CONFIGURATION 1L RADIAL PRESSURE 67DISTORTION (Static and Cross-WindConditions)
41 DESIGN COMPARISON OF 727 PRODUCTION 68AND JT8D-1OO SIDE INLETS
42 PRESSURE RECOVERY COMPARISON 727-200 69PRODUCTION (Modified) AND JT8D-1OO0SIDE INLETS
43 TOTAL PRESSURE DISTORTION COMPARISON 70727-200 PRODUCTION AND JT8D-100 SIDEINLETS
29

W
:jI :7:, :P.I e ;::I:::, 2.5:1 :T::
-:-! ... suerelipe::i::;-: i: :iiii-r - i I .: :
_ :_i: :- r !! :!:I:.7- .: l:: : : :::- . :.: . :~ :I: :mde tes only)
.. . ... ...... ... V -1 :!ii':" : ::::I
....~~~.. .. .... . .. I:F ( ).::::::: !:. ::- .: :: :;: :..: 00 9 JI O
1- -W .17-- 7--
.: w ._' : -. '2-L- :- _: - : .:: ::::---
[.:: : i:L ii:
Lip ,1 iticit 2.5:1 '7: - - -::!:: Modifie N J 0009i
--- .. ...-;: :super :ellipse - ro .
'7- :A- It i:-iii -i: - -
-25-- Ajj /A" ; ... ... . ..... . :-
I:: -.:-: ..... ....-- .-:! . ::: -- : ::
. . . ... . _, - . .. . .. , . . .... .. I- _-- :: - --- 7 -1
w- !:i : I" " 7 7: I i- ! !- i ::,-::- :_ :U::"::'Iii7:: .~~~~I ;:: ' jii-lji . I:l:: ii i~l~i~i fi :.:l.LI: .- li:i
:A::
' ~ ~ ~ ~ . .... ... ... : 5 "--. --- --*.: -:,- - ' -7_ . . ,0 . H._lt-": ~~r~ '-f~ '' jiii : : :! .: " i :. _..1':!:::: .l''iii:1: ;: .. :1:h:1::j~INCHES: _ (FUL SC LE) -i i--:!ii':i:: ": - lfii
.--.: .... .. ...i _ i::i.... ... ....F:GURE I("AA OwC AN TD 0 E L
2 15ad NACA 63 ::f i:j:
H. F:: t _w 7 -ii r
:~::::1=r 7! MoWdified NACA ~~
a :~: irfoil. T. E. r
C3 i- ;il Confiurati on no. 2 ring -7 7
" 10 .. .. ... ...
I~i L --- .7r
7= -7 77 .: ; i~
aw ::10
X . CHS FULSCL
FIGURE ii I CONFIURATONS AND2 JT8-1OOSIDEINLE

727 JT8D-100 SIDE INLET CONFIGURATION NO. 2 Wa 4/6t2 =48O0 Ib/sec M. 0.8
0 .3
25.00
2 o.00 _ _t_ ____5 0s0 502 0 50t 05
X .. -55
< 15.00 ___U I ( f a o
5.00
. 5.00 60.00 .00 so.00 46.00 40.00 3500 30.0.00 20 00 15-00 10 00 5 . 0
X q- INCHES FULL SCALE
FIG 2 PREDICTED MACH NUMBER DISTRIBUTION (Configuration 2)
CAiiiiiiiiii iii-~~~iiiii~iiiI~ii

Milt 4111111V II t t I
it i lit W ! lifii iiil~i !~tiif j ii iiiiiiit 'W 4146 1141 ilt :.t i:11il~i
It U411 ING jl R CONFIGMATION NO. 2 7 0 FI 1-f 1:: 1 ~liii it
tH if 14,11 T3lll
.1. ~~Insi e sur ace :i -:l -T:
.1 . i t ; :J - m -pi
CJ :A :1
i it TIT u~: ;utside surface..;:.LAJ i 1114 w I it i i ii I i 04 1 r- I :: :-
,,%(52 W bse,::::~ , it~ i~rr;:i~ -i:i::T;; '
- 1 . I ; ... I : I t i
::1 ::: iri~~~~~i~' il! il i .... ... il: :l.ll:; ll ;. 'ii '.::::r:: .:: IIj I -_
i+I
...... ........ .
.6t -t t'ii . - :, i i t
CL3 Conifi t i o
-.C ij j ;: L':. I . ;?I
tit it 11;ilice
~::I
4w !tt .......,
it -Iri~it :1 -1
"Ji. i;:T i i, 1 1
lit l:l't .,.I i ;FIGUR 3 COFIGUATION I AN 2 SRFACEMACH UMBEDITRBUIO (otntalFlw nayss
32Ij i ~ ii i i~

itt l t Lll :: I:
727 JTBD-100 SIE INLETI: 5E. IN E ... . .. 7-
'i::i:..;
T-- 550 .-.r
M i '
T.-. 1.0
: " ,i - ' . : :: .2 .
I.. ui P2 "/-- --=
!:L;.:q . ..... ],~:I:: _1:: .-_ "!" .
"'N~~~~_1 . T... T ... I(... ...
2 00~
::i! ii . l k .
T, INCHES FULL .......
7:l / .. . .. .............. ..
I7:
;::: J. 00 R1N! d* ( .;.-: W 2
7t7:
FIGURE 4 CONFGURATIONS AD 2RAREA DISTIUINADMAHNME
tj d. LA33
7--: T .. . .. . .
it .71111 1, NCHES W FULL SCAI ' :~t
7 i i''' I::~n lr
T!:!.
FIUR 4CNFGUAIOS AD2 RE ISRIUTO AD AH UME
iiilii~ii ' I; : :: t: : :: 1 ; :I: : :::~r~tI33_

CONFIGURATION I CONFIGURATION 2
THROAT THROAT ENQ FACE(33.2) ENO FACE (33.2)
20
25I 25. 090 30 20 10 0 40 30 20 10 0
X I - INCHES (FULL SCALE) X t - INCHES (FULL SCALE)
CONFIGURATION IL CONFIGURATION 2R
THROAT ENG FACE THROAT(33.2) (33.2) ENO FACE
30% LIP 25% LIP
20 1.2 9.0 20
COMMON DIFFUSER I 0 COMMON DIFFUSER
0 30 20 040 30 20 10 0 40 30 20 10 0
X ( - INCHES (FULL SCALE) X (- INCHES (FULL SCALE)
Notes:o Throat diameter M.70 in. (full scale) - all models.o Engine face cowl diameter 50.10 in. (full scale) - all models.o Nose dome engine face diameter 16.00 in. (full scale) - all models.o Common nose dome on configurations I, 2 and IL.o 25% lip defined as AI/AT : 1.25.
FIGURE5 SIDE INLET TEST CONFIGURATIONS
34

FIGURE 7 CONFIGURATION 2 FORWARDSPEED INSTALLATION
FIGURE 6 CROSS-WINDINSTALLATION
j. reproducea atThis page e by a iff ereilt
back of the repod tpovderepro ar lrobetter tail
FIGURE 8 INLET CONFIGURATION 2
35

CROSS-WIND INSTALLATION
Tunnel CSTunnel t
Ceiling 4 - 8
Fuselag/
3C~
103 Tunnel 4C cn103" ! "'
Side Inlett 36.6"
0
056 0=00
+0
Floor / Configuration 2Foo / Side Inlet
Flow
TUNNEL CROSS SECTION PLAN VIEW(LOOKING DOWN TUNNEL)
FORWARD SPEED ANGLE-OF-ATTACK INSTALLATION
Ceiling
A / EL-Deg.'A'- In B'- In.
Configuration 2 00 0 54.0 33.0
S14.8 40.6 46.4
S 46" 4----5 17.5 38.0 49.0
22.5 33.0 54.0
Floor
TUNNEL CROSS SECTION ALL DIMENSIONS INCHES MODEL SCALE
(LOOKING DOWN TUNNEL)
FIGURE 9 WIND TUNNEL CROSS-WIND AND FORWARD SPEED INSTALLATIONS
36

30
LA-
20 -
_J
0 =
ANGULAR10 SYM POSITION-e
20 v 170"v 180'
-30
I I I I I.40 30 20 10 0 NOT SHOWM * x=
X - INCHES FULL SCALE PORTS e. 35,80! 125, 21,26,305,350'ON COWL
PORTS * 035 80'ON NOSE DOME
COWL AIG NOSE DOME
o 0 0 0 a 0.20 I
0. t • • xch
2.0 I4.05.0 x x x x
08.0 A z
12.0 2
15.0 [ 2 x x16.0 x20.0 x x x x31.0 I22.4 I 224.0 S A 2 x25.2 x'6. 0 I26. 2227.2 a 129.0 x 231.0 2
u 33.2 2
34.25 xw 35.24 I
S 36.24 x 237.2 338.15 239.05 . 23 9
. 8 x 2
4 09
V 39.73 2 A37.97 x x36.07 x
FIGURE 10 CONFIGURATIONS 1 AND 2 STATIC PRESSURE PORT LOCATIONS
37

ROTATION y Steady state traversing probe
.063 in.
ARM #4 (277.5') NoseDome
- ARM #2 (97.50)
RCowl
19% blockage screen
Steady state traversing probe TYPICAL ARM TO SCALE
ARM #3 (187.5) 1806RI6 --
PROBE LOCATIONS* R -
FULL SCALE MODEL SCALE Ri -
RADIUS INCHES RADIUS INCHESRi3 -
RI 8.500 2.545
R 2 9.018 2.70
R 3 10.521 3.15 R12
R4 12.525 3.75
R5 14.529 4.35 RI - Rco. 25.05"
R 6 15.665 4.69 (Full ScaR7 16. 166 4.84 Rio - = 7.50"
R9 -- (R8 16.466 4.93 8 - (Model Scal
R9 16.767 5.02 7
R l0 17.268 5 17 R6R II 18.270 5.47 R5
R 12 19.940 5.97
R 13 21.610 6.47
R Iq 23.046 6.90 Ru -
R 15 24.015 7.19
R 16 24.549 7.35
R3 -
o All arms 900 aparto All four arms identical
o Probe size .062 inches max. R2 -
probe size O.D. (model scale) RI -o Probe tips are located in the C "
engine face RNose = 8.00" (Full SalejDome =2.3952" odel ale
FIGURE 11 ROTATING RAKE CONFIGURATION
38

I: *l . .:Ii i;;; '
'iii ii!i! It RN I I lOTSl:-1 b/sec ',:li::il
;I:- , : . 't'l_,-it .*li i i ii l ii . , .,: I1 ... ... . "
o.: poent ial fl w allyl 2 . :::
,:i;: i:. 4€,, )~t•j lit -" .Sm . se! ., : •
..... :3 43- _l.3, 8 ... !: 0 .- :-.- .I
if; :.c.)';ijij i: : I :: I: / :1 : 1 ' ; " I t 'it ........ . . ... .,5
Jii lit
'~~~ ..4:,:!
uJ::1;:!. :::: -:'! : :: '7 7 li "I' "
Z:
,I:: , 'i: ..7! ... ... ..
:... ... t.- :"
1. ,:,;€ -i t l l ,i i l i l Ii t l ;i:l t -f tl-,
7.:
-- L0t_ Lt] 1. I ,L[ i : ; ~:tl]L _ I_ -I I J 1 .L .1
:4 7i4 :
:: jj :: ...t..ftitl1i.iii ..!!{!!.: ',i : : I ;: : i •'
7 -7- 17 -. :2c
i! ta:
7 .
7 ..........
t--: ---- -----i-
1-77-T-= , 'r 7
it iI-: t
FIGURE~ ~ ~ ~ ~ ~~ ~I 12 COFGRTO 1 SUFCEM NME DSRBUIN
t.: t t39
'7 .8 1. .. ...
T7. : : I: I.
it .;-1 8 ... ... r'0 Externa Inte ai :
'-'30 i :Ii!; i ij4 1
x ES (ULL SI E)
... ... h it itt-..
FIGRE 2 CNFGURTIO ISURACEMAH NMBE DSTRBUTON
:iilii:/::iii:: ::::;:::::::::~.39

: : ::;;+ ,ItNelt~S ": i , ::IFI:
:: r , +,il,+::i~ !+iil .... .. :ii i +I ; e :: ::::';:! t i : t+:1': +. :-++-
:;:'-- " +- ' '! : : ": '+ ' !. ... . ...
+++I.-+ ! , + +..:; !l tu~1
tr NO 4;:'U G ~~ :~il
i t ! I, .. K 1.,
tt.4 1=1 U:: _H
,:::: " i '~ "l '-Poe tilflw n ly i--11.
i W t t!i , 1_0 L181fit: i 7
I. T14 W- ..11/ W4 41! ", Poenialo aals
S 1: i l l ljl j : 1: Ir l .: [i - i:
"::+t; '.1:ii~~ili :; '' I:
I....I 1 I :h i Ii .. ... H 8
; .I :t ' '
: -+z- - : I: F";
:, i= ": :i : : :1: I::j/ iii i
T7 14 -1: :I:
.. . . .. .....
-7,11 ... ... I 4
FIGURE !-7D
74
7:. .. Lr "I:: P .. ;
I: ,t-T :;I: :1::i I":I.:
T.;.. ~I-" ::1!::~:::1:: ll.' 7
::T
; : : :: : : :: :I . : : : ::iiil'iilii -L~~iii i: : :I':~Tl~r:i~7I ' - -:T 7Truji : l : : I:::; : : I
::::~~::'iiiiii :~il: : i-t-7
tiij~~ b: : :
"A 7:, '7.:
7, ~ ~ ~ : ' :~iii :p::;~3 i~ili rf ace Sur :; 7i:: :
14 it : 31
-c INCHES FULL ALEJ: :f-, j id: L: I: :: : L 4i'p
m,.J til ITT", I:d di 1111 "Id f I I F, 11 t41 mill RiW41 ii", I Hit !FIUE1 OFGRTIN2SRAEMC NME ITIUIN
40ii

100 ..
. ----99- ..
0
200 25 300 350 400 4 50 500 550 600CORRECTED ARFLOW Wa2 LB / SEC
(FULL SCALE)
FIGURE 14 CONFIGURATION 1 PRESSURE RECOVERY VS AIRFLOW (Static & Cross-Wind Conditions)

100 .. .... ..F0
0
u
LJ
w
w
" "
fr-
CORREC TED AlIRFLOW Wa4'O2/ 't2 " LB I SEC(FULL SCALE)
FIGURE 15 CONFIGURATION 1 PRESSURE RECOVERY VS AIRFLOW (Static, Fwd Speedand Angle-of-Attack Conditions)
EL
. . . . . . . . .....
200 250 300 350-U~C~- ~?~r 400 450 500 550 GM
CORRECTVED Al RFLOW W 2,1 St 2 LB I E(FULL SCALE)
FIGURE 15 CONFIGURATION 1 PRESSURE RECOVERY VS AIRFLOW (Static, Fwd Speedand Angle-of-Attack Conditions)

100
> II
L0Z . .n .... C T A. .
Cr
uL
94 --- --
200 250 300 350 400 4 50 500 550 600
CORRECTED AI RFLOW Wa 'rt2/ t2 " LB / SEC(FULL SCALE)
FIGURE 16 CONFIGURATION 2 PRESSURE RECOVERY VS AIRFLOW (Static and Cross-Wind Conditions)

-F
100
w>0U
-J
200 250 300 350 400 450 500 550 M
CORREC TED Al RFLOW Wa t 2/ t2 - LB / SEC(FULL SCALE)
FIGURE 17 CONFIGURATION 2 PRESSURE RECOVERY VS AIRFLOW (Static, Fwd Speedand Angle-of-Attack Conditions)

, ,: /I:! i~~~t -W 4 ,t .. ..A- tSt ti nA' i
•-: ;. :::: .. .. ii I '::::
.4-.9-
o. F36.- 3 3
-t o.96 t I j j
......- : .. . . :- 1 :i: :" t : ,
-r, iti: :- I ~-..ii. .1. • : , " :- : ' '' e. '.I 35.2 ---- . .
C. 36. 3 " I 36.
!::RADIUS
336.
LI
ft . Kt i
16~t 17 _~
4 i 7 7'' ! AI L. . vi bi- --.I.' .. .: " ' I RUN I K l bsec
,* T I .;: ! '3 6 .3 . - - . V136.4 0'....0, 81. Cru {
i: I:: : iI ::CL i -7f"]- "t-- + ....... 3.5. , -502 - "
"~:. I:: ': : Lt
Sn; D . . 35.4. i7.. 808
.7 -t SetonCC4Ll olIi.
36.36.. ... 3 6 . ... .......
94 -;Jl 7
I- -
I
go 5 62 ; 64 I' .
u i 77a e
60 : 9 298 300 i 302 304 ,
_;.1. 1111. t' , 6
.ANGULAR POSITION DEGREES
: .... .. '; ; "i L-: :' : ''': '" " ' '" + i .. i' :ii :1 -
: ,RADIUS 20 INCHES FULL SCALEJ:t "
::1 jii i j i~jjf~f!jfIIi l~i; I- - I I A°i[.7+, : : .., 8 . .' " ., . . r -- r . i. . F[ :!m !m N i .''4 ' i" r . . !- !:i . : . .. . : .
FIGURE 18 CONFIGURATION 2 ENGINE FACE RING AND STRUT
TOTAL PRESSURE TRAVERSE
45

100
wt
U-- - -- --- _ _ _ ___._ _ _ _ _ __-'_-.' :
wf
-- ----
--+-- ---_El _ --m-lEE -E
0 ___
. . , . ... ... b- -- -- - - - , -, -- - -. . . . . .. .... ... . ... .......
LI 97
Lli
----- - - ----- -- -
-:~~~_ , _1__ Ti ..- '.-- -- ------
I-~
200 250 300 350 400 450 500 550 600
CORREC TED Al RFLOW Wa~/~2 LB/ISEC(FULL SCALE)
FIGURE 19 CONFIGURATION 1L PRESSURE RECOVERY VS AIRFLOW (Static & Cross-Wind Conditiions)
.. . I ,.. - " ! -' I l.. . :-I-- l ' ... . : ... .... : - = r - -- - --+d -- A=---- : - ---_:: , . == - = -i: ====-=-==: _ ,... . +: ii . -- i t L C' - i- .. . ,- -'i -', i:::A + ; -----rT
• :, !,, ! ,, " ' - - - i: i ,i '. -.- '- " , i =:= - ---. ... .... ..... .h ....
CORE TED AI RFO Wa"t, t - LB / SEC94 --(FULL SCALE)FIGRE19COFIURTIN L RESUE ECVEY S IRLOW- (Satc& rssWndCndtios

100
@
0 W~t 9
1
I, == -
..... . .. . . .. . .
N
(FLLSCLE
L
w05
FIGUE 20CONFIGURATION 2R PRESSURE RECOVERY VS AIRFLOW (Static, Angle-of-AttackadCross-Wind Conditions)
-'ai
(FLLSCLE
V) UE2 OFGRTO 2PRSUERCVR SARFOW(ttc nl-fAtc
Ln rs-id odtos

Yt7 REFAN, SIDE INLET WOCEL TEST
CONFIG. 1, ALPHA s17.50EC. FwD. VELOCITY
TUNNEL VELOCITY z= 18 KNOTS
P IP
T .PTOD .I .1 6 .38 .990 7 .900
3 .0900 8 .860
4 .90O 9 .040
9 .940 0 .800
TEST NO. 2390 TEST CATE 12/12/73 CALC. CATE 01/16/74
RUN NO. 46 RECOVERY .9944 PRI RECOVERY .9995
COND. NO. 4.0000 wa/u2/6t2 468.904 LB/SEC FAN RECOVERY .9919
FIGURE 21 CONFIGURATION 1 ENGINE FACE PRESSURERECOVERY MAP (180 Knots @ 5 = 17.50)
48

7IZ REFAN, SIDE INLET MODEL TEST
VTs tO KTS , CONFIGURATION NO. I , 90 DEG. X-WIND
/ P .9= 0 P / PT
S .99S 6 .920
a .09o 7 .900
3 .90 8 .680
4 .940 9 .640
S .940 .600
TunnelFlow
TEST NO. 2390 TEST DATE 11/15/73 CALC. DATE 12/06/73
RUN NO. 3 RECOVERY .9745 PRI RECOVERY .9990
COD. _NO. 5.0000 Wa V' 2/6t2 485.492 LB/SEC FAN RECOVERY .9623
FIGURE 22 CONFIGURATION 1 ENGINE FACE PRESSURERECOVERY MAP (20 Knots Cross Wind)
49

711 REAN, SIDE INLET MODEL TEST
COrts. 2, ALPHA 217.50DE. FrD. VELOCITY
TUNNEL VELOCITY' 180 KNOTS
T oo I T180
N NO. R .0$ 9 2
8 90 ? 900
a 900 * M0
4 9OO 9 e840
0 0940 0 .00
SEE FIGURE 18 FOR WAKE DEFINITION
POO
TEST NO. 23L90 TEST DATE 12/ 5/?3 CALC. DATE 01/09/74
RUN NO. 35 RECOVERY .9917 PRI RECOVERY .9992
COND. NO. 3.0000 Wa!t-216t2 466.275 LB/SEC FAN RECOVERY .9879
FIGURE 23 CONFIGURATION 2 ENGINE FACE PRESSURERECOVERY MAP (180 Knots @ = 17.50)
50
?zr REFAN. SIDE INLET MODEL TEST
VT a 20 KNOTSi CONFIG. 2 , 90 DEG. CROSSWINC
P IPT e0 PT /PTT ToD + T TDa
i . .92
a .06.t .' .
.90
4 .960 9 .840
S .4 .800
TunnelFlow
TEST NO. 2390 TEST DATE 11/29/73 CALC. DATE 12/13/73
RUN NO. 1s RECOVERY .9690 PRI RECOVERY .999?
COND. NO. 3.0000 waFt2 /6t 2 472.283 LB/SEC FAN RECOVERY .9701
FIGURE 24 CONFIGURATION 2 ENGINE FACE PRESSURERECOVERY MAP (20 Knots Cross-Wind)
51

1?7 REFAN, SIDE INLET MODEL TEST
VT a 30 KNOTS, CONFIGURATION ILe 30 PERCENT LIP, 90 DEG. X-WIND
p 8:0 PT IPToT IPT ----- +
3 ,II . .90
3 .e0 a .660
4 .60 9 .840S .940 0 .600
TunnelFlow
TEST NO. 2590 TEST DATE 11/16/73 CALC. DATE 12/06/73
RUN NO. 4 RECOVERY .9901 PRI RECOVERY .9995
COND. NO. 3.0000 w~ 1i26t2 480.784 LB/SEC FAN RECOVERY .9878
FIGURE 25 CONFIGURATION 1L ENGINE FACE PRESSURERECOVERY MAP (30 Knots Cross-wind)
52

727 JT8D-100 SIDE INLET
tiI t I i
0.14 I.
0.12
O 00 0
0,10 H I
T I fill
0
2 4 5 6 a
RADIUS INCHES(MODEL SCALE)FIGURE 26 CONFIGURATION 1 CIRCUMFERENTIAL PRESSURE
DISTORTION 600 SECTOR (Static, Fwd
Speed and Angle-of-Attack Conditions)
53

727 JTBD-100 SIDE INLET
titlii-
I I iflit
0.14 iit: .
ItI
0.12
i1 i ,
i! Illi lil i! i ii iI! Jll !
H 44I i i
i P- •- i { 1
RADUS '-" ICHE (MDE SCALE)iii iit ''
and Agle-f-Atack ondiions
5; o
C602l lill iii 11 IT: rlii "i T
1; ii~ii i iiif r!'
It I Ill' i
liti1 iI ;i ::I ii0 if '
(32 3 4 5 ii
RADIS ICHES(MOEL SALEFIUR 2 CNIGRAIO CRCMFRETALPRSSR
DISTORTION 180 SECTOR (Staic, Fwd Speeand Anle-ofAttac Condtions
54 i i!: I i

727 JT8D 100 SIDE INLET
0.14
0.12
0
RAUIUS.- IH MO LS E
00
R S ICE (
FIGURE 28 CONFIGURATION 1 RADIAL PRESSURE DISTORTION
0

1727 JTBD-100 SIDE INLET.. .........W ill I I I;i
til tii l -
i i il lii ili iii i -
H:it
i:! ii i!;.LU. ,;;..
O,1 i ii lili -i ill-iii i
IINI
'o i i i0.12 ij ~iiii i
-4 1 .iii~i~i,, i ,I ii i ."; i .
z .... ... .
RADIUS - INCHES(MODEL SCALE)FIGURE 29 CONFIGURATIONI:: i li CICMFRNTA PRESSUREt
DISTORTION ~~i 600 SETO (osWn Codtins)
50010tt I6
11 q I I I I !hE 11.. ..
H :: jl
I i I
i it
9 3 4 5 GRAIU ICES(MDL CAE
FIUE 9COFGUAIO CRUMEENIL RSSR
DITOTIN 00SCTR CrssWndCodiios
56 ' 'j

727 JTBD-100 SIDE INLET
It AL .I . .
...... ......... T1.11
WW I i il
q it -ft4+ :H
104104 I tKbi'H t fI H 111M 'i if I i 11 I0.14
..... I l
0.10f +1 . i i..... ~ ~ ~ ... .. .. .....
. . . . .1 i 11" I
D0 .0
IX-:
0i'
a.- 0,06 ..... .... ..
A .. .. .... N.......... ...... ... f
' ll'' i 111 ii 'i1 tlll il-- il if
" i
0 ,0 4.... ... ...
FIGURE 30 CONFIGURATION 1 CIRCUMFE ENTIAL PRESSUREDISTORTION 1800 SECTOR (Cross-Wind Conditions)
:57
J.iSI . . . . . . . . . fif
01 !
off if
2 3 4 5 6 7i'RAIU INCHES (MODEL SCALE) ;
F.IGURE 30 CONFIGURATION 1 ESRDISORION180 SCTR Cos -WndConi i o s
c I! iii iii 57

727 JT8D 100 SIDE INLET
014
0.12
09 0.10
a a
o
n 3 4 5 8 7
RADIUS~ INCHES(MODEL SCALE)FIGURE 31 CONFIGURATION 1 RADIAL PRESSURE
DISTORTION (Cross-Wind Conditions)
58

727 JT80D-100 SIDE INLET
0.14
0.12
0.12
I
2 A
RADIUS INCHES(MODEL SCALE)
if
and Angle-of-Attack Conditions)
1I
0.04 i67

1727 JTBD-1O0 SIDE INLET|
i i '
t:i I! ::::o., ::iii ii i i i i1• i: T .6 iis
IT I ... :...
iii.; .1tij ! t
0.10 iIii i!;
....
i !:,;4: 4i II
11.1 L H. ifi 11 j~ ii ii
' " 0i lil' ii;
e)~~~., .h 1. .. .... .i... . ... .
RADUS INHE(MDE SCALE)i iii ii ii
iii i i:i ti: i
ifi
:i:I I i t
DIST TO 180 "0CTO (Sai, +w Seed
060
0 7;
t If I it it1! it I
2 3 4 5 G 7::
and Angle :of Attai k Conditions)
60;i ::I::i::

-727 JT8D 100 SIDE INLETJ
0.14
0.12
o. Hio il 1 V [ I i
106o0
0.04
0.02
RADIUS--INCHES (MODEL SCALE)FIGURE 34 CONFIGURATION 2 RADIAL PRESSURE DISTORTION(Static, Fwd Speed and Angle-of-Attack Conditions)
61
LLo
a ~~~I~ III~~~i~JMIW. -II~IIrK /[
61

7Z27 J7GDCO SSF O~ :I
N EE1j7t...............
?l{.i 1t .I Y screens
i:i
I~ Illt;i:1 i i ;i i tII1 i LI I ill
.14 4.j Th1 4
0A440 lfii- I=it i1o iii
0.0I I I t ' i l ,-ii~ iIiii ' '; I 1iiiifl i
hd .. .
4 4 Jfi~ Iitt!
1 !d I0
i t
1t
I IT ; "
2 I
7 iI
FIGURE 35 CONFIGURATO r tRCUMFIRENTIIL H,#RI
Wind Conditios
62
I 1 H 1 - ll -"! li
0 I I ,::, li t:~
,1T1
FIGURE 35 CONFIGRATION 2 CIRCUMFRENTIAL PRESSUR
Wid onitios
62~ij 1i E Iii1 . ~ i: iii ' i i :Ij ii

727 JT8D-100 SIDE NLET
screens
0.14
0.12
si o
0
I-
2 35 7
RADIUS 0 INCHES(MODEL SCALE)
FIGURE 36 CONFIGURATION 2 CIRCUMFERENTIAL PRESSUREDISTORTXON 1800 SECTOR (Static and Cross-Wind Conditions)
63
FIUR 3 ONIGRAIN 0CICMFRETILPRSSRDIIOTXN10SETR(Sai ndCos-idCndtos
i6

727 JT8D 100 SIDE INLET!
screens
it
0.12
Sii
. ..T 1 1
IilOl ift! i
0.02
RADIUS- INCHES (MODEL SCALE)
FIGURE 37 CONFIGURATION 2 RADIAL PRESSURE DISTORTION
(Static and Cross-Wind Conditions)
64

727 JT8D-100 SIDE INLET
0.14 ..
0.12 T1hI II
0610 4j
,I- +
0 1 ..I I
RADIUS INCHES(MODEL SCALE)
DISTORTION 600 SECTOR (Static and Cross-ind Conditions)
65
[I
Q 04

727 JTBD-100 SIDE INLET
.. .... ....
0.14
iti0.10
. l i
0602 I
FIGURE 39 CONFIGURATION IL CIRCUMFERENTIAL PRESSUREDISTORTION 1800 SECTOR (Static and Cross-Wind Conditions)
OC1 Ii :xl i ii l tlI ffiI 11Illiiiii Iii l i
RADIUS~ ~~ i i INHE (MDE CAFIUR 39 COFGRTO LCRUFRN IAL RESUR
DITRIN18 o SCO (Sai ands Cos-inCodtns
6Gllii
727 JTBD 100 SIDE INLET
I 2:2If 4 i
fill ~. ... . .
0.14... .i t $k li 6 it l o :pr rt i iii i I llli: ::
... ... ... s : y .2 i :: ... .. ..: .: : .: .: ........ ......
, !...1.. 1..... .... ... :
.............0.10 .. ..
Q !T 7: . .I... . ..
... ... .........
... .... ...i ii i lil l il~i i . . .... ... .... .. . ...
0.04
7i :::- 7 -r- 't<:
i
FIGURE ~ ~ ~ ~: 40 CNIUATO&LRDAL PRESUR DISORIO
rx :4t: )A :i~ ::':: ' '
w e ... .... ... 4 : i ::i
....:i:. .. ...
::L .. :: .... .. I ... ... : I:
: : : : :: >: :::: ::0. 2... .... ..
(St ti and. Cros W..i nd Cond.. ... i ) 0.047
777 . .. .... .. ..... ... ...: : ::I:: :.: I:I: ::
.......... ....r i0.02 f7ii i IIliII II
.... .. .... . :O ~i 0 :: ::: "" .;i.... ... .... i:.
. .. . . . . . .. . .
4 3 4 5 7: '::C3 1i : RADIUS- INCHES (MODEL SCALE):I:I: ::
FIGUE 40 CONFGURAION L RDIALPRESURE ISTOTIOaoe ~i(Static and Cross-Wind Condit'i1.:....,..;::ons) :
I:: :,:::i67

727-200 PRODUCTION(TRUE VIEW)
727 JT8D-100CONFIGURATION I
* The production inlet is identical 727-200 727-200 *on all JT8D series engines. JT8D-I00 (PRODUCTION) JT8D-15,a.a cruise corrected airflow, a 2/I t 2 - Ib/sec 480 326
M.=:0.8, 30,000 feet, std. day
Highlight diameter - inches 52.21 42.305
Highlight area - sq. in. 2141.07 1405.64
Lip loading, WaV/t 2 A HI - lb/sec-ft 2 32.28 33.40
Highlight Mach number 0.420 0.438
Throat diameter - inches 46.70 37.84
Throat area - sq. in. 1712.87 1124.59Throat Mach number 0.572 0.604Contraction ratio (highlight area / throat area) 1.25 1.25
Lip contour 2.5:1 super ellipse 2.111:1 ellipse
Distance between inlet e and fuseolage - inches 44.5 (approximate) 39.01
Engine face diameter - inches 50.10 40.50Nose dome diameter - inches 16.00 12.030
Engine face area ~ sq. in. 1770.29 1174.59
Engine face area / throat area 1.034 1.044Engine face Mach number 0.543 0.563Nose dome length - inches 25.20 15.038.Degrees of cant 0.0 4.0
Length / engine face diameter 0.8 1.0
FIGURE 41 DESIGN COMPARISON OF 727 PRODUCTION AND JT8D-100 SIDE INLETS
68

I -. .- . ........
727-200 P DUCTION DDIFIED :- -: 727 JTD- 100 SIDE INLET '.. SIE INLET .0.37 SCALE: CONFIGURATION 0.30 SCALE :iii. . . . .. :..... 17 . .: + .
" 0Z V-KNOTS SYM V KNOTS : .
p+: .. . . - . . ' -7 = 7 -. 77 ...... F I-o aE 4 0 _ou...... 17 18 0 7 .5 - 18 0" Configuration 2
-.1 7.5 180_ _+_ -- +_..0....urtion 2.... + '-
.. est prob (full i i.. -.
7-f-L - from the cowl wall-all data. -. ii ::i :-.S- 'i Al data without acoustic treatment :
.4.ips
L-.-9 6-
:+ ... ..
01) 350 00 0 0
I t I 6 t2
... 4 .CORR CTED AIRFLOW, L B/SEB . .
(FULL SCALE)
FIGURE 42 PRESSURE RECOVERY COMPARISON 727-200 PRODUCTION (Modified) AND JT8D-100SIDE INLETS
: - --

-..4 . 727-200 PRODUCTION (MODIFIED) 727-200 PRODUCTION 727 JT8D-100 SIDE INLET -SIDE INLET 0.37 SCALE SIDE INLET- FULL SCALE! CONFIGURATION I - 0.30 SCALE
S SYM IV KNOTS SYM ALTITUDE MACH NO. SYM -KNOTS: - h i
S o 180 9o b.3o 0 o 180
.. C> 10,250 0.34
- - ± L : --. 9,900 -- 0.21
C . 21,300 - 0.37 i : : ::I::::
. . . -- . . 20,200 0.41I 31,000 0.47
SA 30,700 0.851
S 10o : - -- - O 30,800 0.88 ---.. ..
. .. . . L 41,600 0.65
S- 9 .i 41000 0.80 8. .-- - _ _ e- .. .......7 .. ..... .. . -r .Note: ?2 -
8 .*Closest probe inch (full scale)from the cowl wall - all data
t - .Model data without acoustic treatmen i7
- * Full scale data with 12 inchesL ... ..of treatment ....
0 :.
--
7 7250 300 350 ... 50 500
2 ----- • ---
v CORRECTED AI :-2.t2 . LB/SEC:..-.. . .- --, .- . 3. . . . .
FULL SCALE)
S- T200TA i 250 RE.300 DISTORTI35ON COMPARISON 727-2050 00 PRODUCTION AND JT 100 SIDE INLETS
--.-CORRECTED AIRFLOW, W 82 /6t2 LB/SEC .. : - - .-- ..... . . . ------ , : I
FIGURE 43 TOTAL PRESSURE DISTORTION COMPARISON 727-200 PRODUCTION AND JT8D-100 SIDE INLETS

APPENDIX A
SYMBOLS
71

APPENDIX A
SYMBOLS
a Half the major axis of an ellipse
AHI Highlight area (or Hilite)
ATH Throat area
BBL Body Buttock Line
BWL Body Water Line
b Half the minor axis of an ellipse
D2 Engine face diameter
Kt Knots
L Inlet length
L.E. Leading edge
MCR Maximum Cruise
MCT Maximum Continuous Thrust.
Moo Free stream Mach number
MTH Throat Mach number (one dimensional)
M2 Engine face Mach number (one dimensional)
PToo Freestream (tunnel) total pressure
PT Engine face total pressure measurement
PT Min Minimum engine face total pressure measured
PT Max Maximum engine face total pressure measured
P Area average (see Section 3.4) of engine faceT2 total pressure measurements
PT2/PToo Total pressure recovery
PT Ring Avg, Average engine face total pressure at a
PT Local Ring given radius
Avg 73
Preceding page blank

Max Ring Avg The maximum average engine face total pressureT Max Ring vg computed at the given radii (Maximum PT Ring Avg )
P Average engine face total pressure at a givenT Min Sector Avg radius in the minimum total pressure sector
(for 60 or 180 degree sectors)
R Inlet Radius
TT2 Total temperature at engine face (average)
Vt Tunnel velocity
V, Freestream velocity
T.E. Trailing edge
Wa Actual airflow
Wa 2/ 6t 2 Engine face corrected airflow
X Inlet centerline distance, or coordinate inellipse equation
Y Coordinate in ellipse equation
Inlet angle-of-attack (inflow angle) relativeto engine and inlet
SInlet yaw angle relative to inlet
0 Angular position around engine face
9 t2 TT2 / 5 18 . 7 when TT2 is in degrees Rankine
6 t2 PT2/ 14 .69 when PT2 is in pounds per square inch
74
APPENDIX B
INLET COORDINATES
75

APPENDIX B-INLET COORDINATES
ALL MODELS AXIALLY SYMMETRICALL DIMENSIONS INCHES FULL SCALE
COWL CONFIGURATIONS 1,2, and 2R NOSE DOME
(CONFIGURATION IL from X - 33.2 to-94 C)NFIGURATIONS 1.2. and IL
X4 R COMMENT x R COMMENT x R COMMENT
6.631 31. 000 37.200 23.766 25.200 0.00 - Nose
14. 092 30. 945 Contour not 36. 700 23. 652 (The lip contour 25. 000 1. 006
17.784 30. 658 critical in 35.700 23. 489 t .etremely 24.000 2.439
24. 476 30.123 thi region 34. 700 23. 394 critical) 23. 000 3.269
27.822 29.745 33.700 23.354 22.000 3.902
31.168 29. 272 33. 200 23. 350 - Throat 20. 000 4.867 (3.15:1 Ellipse)
33. 398 28. 890 33. 000 Z3. 3505 18. 000 5. 599
35. 629 28.421 Estereal 32. 000 23. 364 16. 000 6.181
37.302 27.962 Co l 31.000 23.398 12.000 7.035
28.417 27.553 30.000 23.449 8.000 7.586
39.254 27.137 28. 000 23.600 4.000 7.89839.S2 2.95 NASA fefan 9
39. 532 26. 90 Nacelle Cro 26. 000 23. 806 2.000 7.975
39. 755 26. 76 Contour - Ftl 360J 24.000 24.046 0. 00 8. 000 . Face, Slope = 0
39. 867 26. 631 22. 000 24. 295 Internal 0. to -9 8.000
39.9785 26.469 20. 000 24. 532 Cowl
40.034 26.3579 16.000 24.922
40.090 26.1061 - Hilite 14.000 25.059
40.000 25.558 12.000 25.150
39.900 25.340 10.000 25.190
39.800 25.182 - 8.000 25.17939. 600 24. 943 Lp - Super Ellip'e 6.000 25.13739.400 24.758 2.2 2.2 i4.000 25. 090
39.200 24.606 ) +/'\ =11 3.000 25.07238.700 24.308 l \b / 2.000 25.060
38. 200 24.084 1.000 25.052
37.700 23.907 0.000 25. 050- Eng. Face, slope = 0
o... , 2,.o5o RING-CONFIGURATION 2
NOSE
x R Slope
27. 179 14. 835 (±) 50. 10 L. E. Radiue . 090"' 1
27.200 14.770 With Center X 27. 11
STRUTS -CONFIGURATION 2 27.168 14.709 (39.9 14.
Strut x Inside Radius Outside Radius
/c y/ _ ,/ /c (NACA 0009) 7. 179 - 14.835
.00 .00 .300 .04501 Airfoil 27. 168 14.709 -
.0125 .0142 .400 .04352 27. 050o 14.64 1.937
.025 .019642 .00 .04352 7 26.800 14.579 15.044 Modified NACA
.025 .01961 .500 .03971 C 14.547 15.120
.050 .02666 .600 .03423 26.500 14.547 15.0 632 AO 526. 150 14. 536 15. I1O
.075 .03150 .700 .02748 25.800 14. 547 15. 243
.100 .03512 .800 .01967 Rig 25.500 14.569 15.273
.150 .04009 .900 .01086 25.000 14.614 15.318
.200 .04303 .950 .00605 24.500 14.658 15.362
.250 .04456 L00 .00095 24.000 14.703 15.407
Note: C = 10.3 inches, perpendicular to leading edge 23.000 14.792 15.496 tr
L. E. Radius = . 0089XC 22. 000 14. 881 15.585
Strutes 120° intemle 18. 000 15.237 15. 941
16.000 15.415 16.119
14.000 15.593 16. 29
12.000 15.738 16.439
10.002 15.858 16.559
8.000 15. 94 16. 646
6.000 16.025 16.700
5.000 16.076 16.696
4.000 16.140 16. 670 Modified NACA
3.000 16.222 16. 622 0009 Airfoil
2.500 16. 271 16. 589
2.050 16.319 16.554
1.500 16. 385 16. 504 -1.000 16.4507 16.4507
Preceding page blank i77

RING-CONFIGURATION 2R
Nose
i Slope
31.176 14.691 () 47.75 0 E. radis- .1090-31. 200 14.626 0 a31. 171 14.561 () 42. 25o
= 14. 630
X Inside I Outside R
31. 176 - 14.691
31.171 14.561 STRTS-CONFIGURATION 2R
31.050 14.492 14.783 STRUTS-CONFIGURATION 230.800 14.416 14.8 I30.500 14.377 14.941 i.a Strut
30. 150 14.356 14.995 63 2A015 a/c y/c x/c y/c NACA 0009
29.800 14.350 15.032 Airfoil Airfoil
29.500 14.355 15.03729.500 14.35578 15.037 .0 0.0 .30 .03001S. 12.0125 .00947 .40 .02902 .
28.500 14.413 15. 125..025 .01307 .50 .02647
28. 002 14.454 15. 151 .025 .01307 ;s0 .026472.00 Z 14.537 1.230 .050 .01777 .60 .02282
27.000 14.537 16.230
26.000 14.620 15.312 .0 ..0210 .0 .01832Rin
24.000 14.792 15.496 .100 .02341 .0 .0131222.000 14.984 15.691 .150 .02673 .90 .0074
20.000 15. 182 15. 886 .200 .02869 .95 .00403
18.000 15.368 16.076 .250 .02971 1.00 .0063
16. 000 15. 540 16.254 Note: C = 12.6", Perpendicular to L. E.
14.000 IS.706 16. 395 L. E. Radius = .0040 . C
12. 000 15. 895 16.42 Modified NACA 0009 Struts 6 1200 intervals
11.000 16.016 16.420 Airfoil
10.500 16.083 16.408
10.002 16.153 16.386
9.500 !6.228 16.352
9.000 16.306 16.30J
LIP AND EXTERNAL COWLCONFIGURATION IL
NOSE DOME Comment
CONFIGURATION 2R S.385 3 1.5119.076 31. 175 Not Critical
XI R Comment 25. 768 30. 640 in This Relton
29.200 0.0 - Nose 29.114 30.262
29.000 .935 32.460 29.789
28.000 2.268 34.691 29.407
27.000 3.046 36.921 28.939
26.000 3.641 38.594 28.479
24.000 4.557 3.65:1 39.710 28.070 External Cowl22.000 5.260 Ellipse 40.546 27.654
20.000 5.829 40. 825 27.467
16.000 6.692 41.048 27.273
12.000 7.293 41.159 27. 149
8.000 7.694 41.271 26.986
4.000 7.925 41.3267 . 26.875
Z.000 7.981 41.3827 26.6231 Hilite
0.000 8.000 --Eng. ace, Slope 0 41.300 26.044
0. to -9 8.000 41.000 25.47440.800 25.241 (Lip Super Ellipee40.500 24.971 2.2 2.240.000 24.633 - .39.400 24.330 -. b) =38.700 24.06238.200 23.91037.700 23.78336.700 23.59035.700 23.46234.700 23.38633.200 23.350 - Throat
78

REFERENCES
1. Easterbrook, W. G., Roberts, W. H., The Boeing CommercialAirplane Company, "Low-Speed Wind Tunnel Flow Field Resultsfor JT8D Engine on the Boeing 727-200", NASA CR Document,to be released.
2. Easterbrook, W. G., Carlson, R. B., The Boeing CommercialAirplane Company, "Cruise Drag Results from High SpeedWind Tunnel tests of NASA Refan JT8D Nacelles on The Boeing727-200", NASA CR-134546, February 1974.
3. Bailey, R. W., Vadset, H. J., The Boeing Commercial AirplaneCompany," 727/JT8D Refan Side Nacelle Air Loads", NASACR-134547, March 1974.
4. Pratt & Whitney Aircraft, "Phase I Engine Definition andCharacteristics of the JT8D-100 Turbofan Engine",P&WA TM-4713, April 13, 1973.
79

THE FOLLOWING PAGES ARE DUPLICATES OF
ILLUSTRATIONS APPEARING ELSEWHERE IN THIS
REPORT. THEY HAVE BEEN REPRODUCED HERE BY
A DIFFERENT METHOD TO PROVIDE BETTER DETAIL