


![cRGD-functionalized, DOX-conjugated, and 64Cu-labeled ... · properties, multifunctional nanocarriers simultaneously exhibiting these eight functionalities are extremely rare [3e7].](https://static.fdocuments.net/doc/165x107/5f8a7bf14348d04f514aabe1/crgd-functionalized-dox-conjugated-and-64cu-labeled-properties-multifunctional.jpg)

Languages
Pages
Legal

S1
Multifunctional hexacatenar mesogen exhibiting supergelation, AIEE and its ability as a volatile acid sensor
Balaram Pradhana, Monika Guptab, Santanu Kumar Palb, and Ammathnadu S. Achalkumara*
aDepartment of Chemistry, Indian Institute of Technology Guwahati, Guwahati, 781039, Assam, India
b Department of Chemical Sciences, Indian Institute of Science Education and Research (IISER) Mohali, Sector-81, Knowledge City, Manauli 140306, Punjab, India.
Supporting information
Table of Contents
Serial Number Contents Page numbers (i) Materials and methods S2 (ii) Synthetic scheme S3 (iii) Experimental Section S3-S5 (iv) NMR Spectra S6-S8 (v) Thermogravimetric Analysis S9 (vi) X-ray diffraction studies S9- S10 (vii) Photophysical properties S10-S11 (viii) Gelation studies S12-S15 (ix) Acidochromic properties S15 (x) Calculation of Detection Limit S16 (xi) Mass spectrometry S17 (xii) References S18
Electronic Supplementary Material (ESI) for Journal of Materials Chemistry C.This journal is © The Royal Society of Chemistry 2016
S2
(i) Materials and methods
All commercially obtained chemicals were used as received. As required the solvents were dried
as per the standard protocols. Silica gel or neutral alumina used as stationery phase for column
chromatography. Alluminium sheets coated with silica gel were used for thin layer
chromatography (TLC) to monitor the reactions and column purifications. Infrared spectra were
measured on a Perkin Elmer IR spectrometer at room temperature by preparing the KBr pellet. 1H and 13C NMR spectra were recorded using Varian Mercury 400 MHz (at 298K) or Bruker 600
MHz NMR spectrometer. Mass spectrometry was carried out using MALDI-TOF mass
spectrometer or High Resolution Mass Spectrometer. Polarizing optical microscope (POM)
(Nikon Eclipse LV100POL) in conjunction with a controllable hot stage (Mettler Toledo FP90)
was used for the characterization of mesogens. The phase transitions, associated enthalpy
changes were obtained by differential scanning calorimeter (DSC) (Mettler Toledo DSC1). X-ray
diffraction (XRD) studies were carried out using image plate and a detector. This setup had Cu
Kα (λ =0. 15418 nm) radiation from a source (GeniX3D, Xenocs) operating at 50 kV and 0.6
mA in conjunction with a multilayer mirror was used to irradiate the sample. Glass capillaries
containing the sample were used for the measurements. Thermogravimetric analysis (TGA) was
accomplished with a thermogravimetric analyser (Mettler Toledo, model TG/SDTA 851
e).Perkin-Elmer Lambda 750, UV/VIS/NIR spectrometer was used to obtain UV-Vis spectra,
while Fluoromax-4 fluorescence spectrophotometer and Perkin Elmer LS 50B spectrometer were
used to obtain emission spectra in solution state and solid thin film state respectively. The
xerogel of the compounds were prepared from gel state, evaporating the solvent first in air for 2-
3 days followed by vacuum. Then, the morphologies of the xerogel were examined by Atomic
Force Microscopy (AFM) and field emission scanning electron microscopy (FE-SEM). Atomic
Force microscopy (AFM) images were obtained for the spin-coated films using Agilent 5500-
STM instrument. Field Emission Scanning Electron Microscope (FESEM) images were recorded
on Zeiss Sigma microscope at an accelerating voltage of 2-8kV.
S3
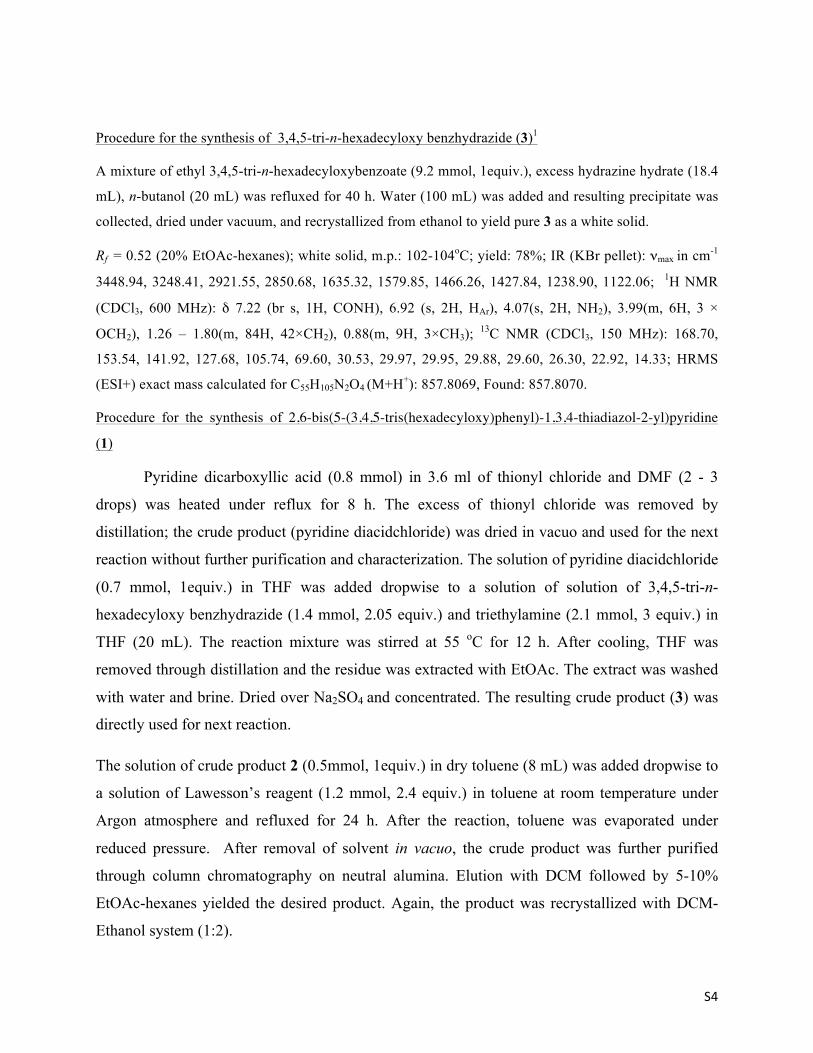
(ii) Synthetic Scheme
Scheme 1. Synthesis of hexacatenar 1. Reagents and conditions (yield): (i) n-Bromoalkanes, anhydrous K2CO3, DMF, 80 oC, 24 h (85%); (ii) NH2NH2.H2O, n-butanol, reflux, 48 h (78%); (iii) (a) 2,5-pyridine dicarboxyllic acid, SOCl2, reflux, 8h; (b) 3, THF, triethylamine, 12h, reflux; (iv) Lawesson's reagent, toluene, reflux, 17 h (65%).
(iii) Experimental Section
Procedure for the synthesis of ethyl 3,4,5-tri(hexadecyloxy) benzoate (4)1
A mixture of ethyl gallate (10.1 mmol, 1equiv.), anhyd. K2CO3 (66.6 mmol, 6.6 equiv.), n-
bromohexadecane (33.3 mmol, 3.3 equiv.) were taken in dry DMF (20 ml) and heated at 80 oC for 17 h
under nitrogen atmosphere. Then the reaction mixture was poured into ice-water and extracted with
CH2Cl2. The combined extract was washed with water, brine, and then dried over anhyd. Na2SO4 and
concentrated. The crude product was purified by column chromatography on neutral alumina. Elution
with hexanes followed by 2 - 5% EtOAc-hexanes yielded the desired product.
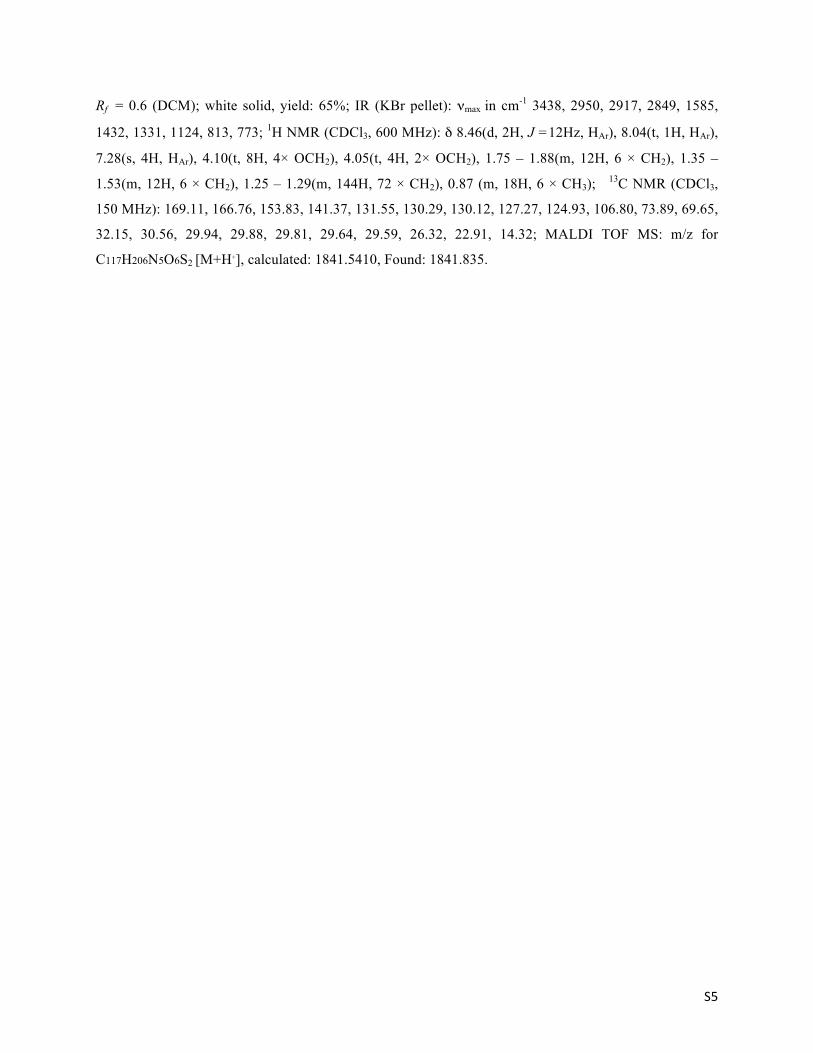
Rf = 0.81(10% EtOAc-hexanes); white solid, m.p.: 54-56oC; yield: 85%; IR (KBr pellet): νmax in cm-
12922.08, 2850.18, 1716.36, 1583.80, 1468.54, 1426.93, 1331.02, 1218.57, 1110.30; 1H NMR (CDCl3,
400 MHz): δ 7.25 (s, 2H, HAr), 4.35 (q, 2H, J = 7.2 Hz, COOCH2), 4.01 (t, 6H, 3 × OCH2), 1.25-1.82 ( m,
84H, 42 × CH2), 0.87(m, 12H, 4 × CH3), 13C NMR (CDCl3, 100 MHz): 166.70, 153.04, 142.61, 125.28,
108.29, 73.72, 69.44, 61.17, 33.05, 32.16, 30.56, 29.94, 29.89, 29.87, 29.80, 29.63, 29.60, 29.57, 26.32,
26.29, 22.92, 14.63, 14.33. HRMS (ESI+) exact mass calculated for C57H107O5 (M+H+): 871.8113, Found:
871.8121.
S4
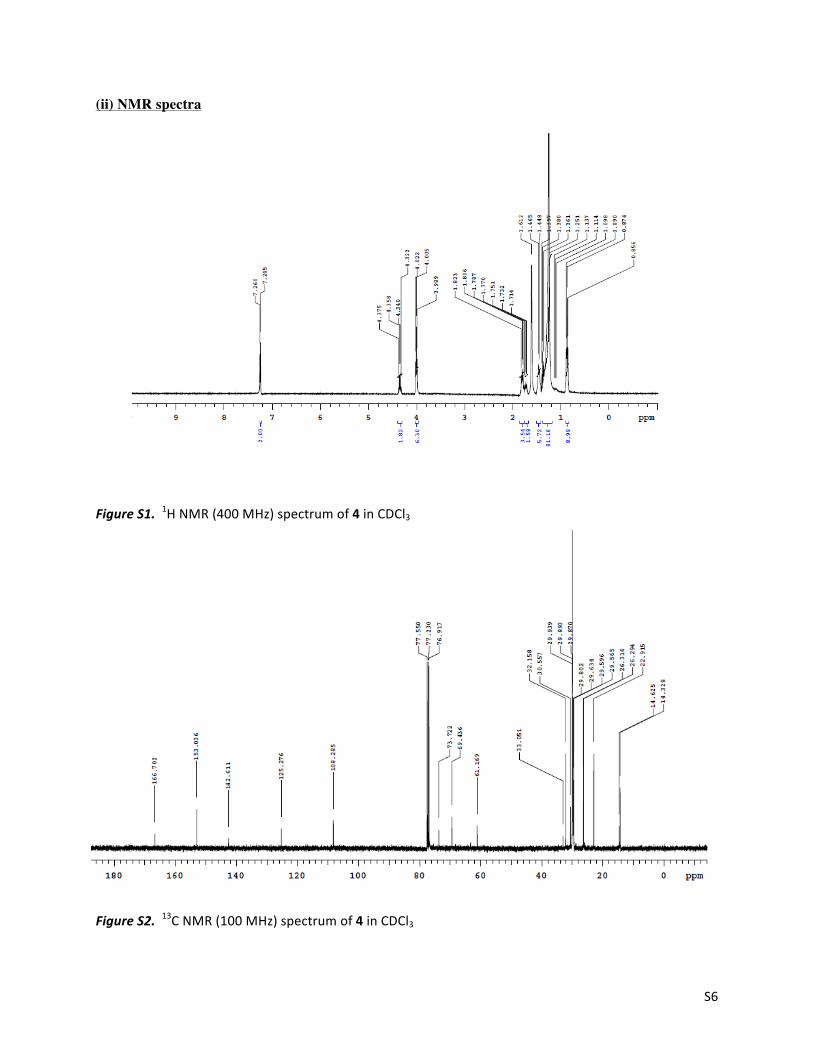
Procedure for the synthesis of 3,4,5-tri-n-hexadecyloxy benzhydrazide (3)1
A mixture of ethyl 3,4,5-tri-n-hexadecyloxybenzoate (9.2 mmol, 1equiv.), excess hydrazine hydrate (18.4
mL), n-butanol (20 mL) was refluxed for 40 h. Water (100 mL) was added and resulting precipitate was
collected, dried under vacuum, and recrystallized from ethanol to yield pure 3 as a white solid.
Rf = 0.52 (20% EtOAc-hexanes); white solid, m.p.: 102-104oC; yield: 78%; IR (KBr pellet): νmax in cm-1
3448.94, 3248.41, 2921.55, 2850.68, 1635.32, 1579.85, 1466.26, 1427.84, 1238.90, 1122.06; 1H NMR
(CDCl3, 600 MHz): δ 7.22 (br s, 1H, CONH), 6.92 (s, 2H, HAr), 4.07(s, 2H, NH2), 3.99(m, 6H, 3 ×
OCH2), 1.26 – 1.80(m, 84H, 42×CH2), 0.88(m, 9H, 3×CH3); 13C NMR (CDCl3, 150 MHz): 168.70,
153.54, 141.92, 127.68, 105.74, 69.60, 30.53, 29.97, 29.95, 29.88, 29.60, 26.30, 22.92, 14.33; HRMS
(ESI+) exact mass calculated for C55H105N2O4 (M+H+): 857.8069, Found: 857.8070.
Procedure for the synthesis of 2,6-bis(5-(3,4,5-tris(hexadecyloxy)phenyl)-1,3,4-thiadiazol-2-yl)pyridine
(1)
Pyridine dicarboxyllic acid (0.8 mmol) in 3.6 ml of thionyl chloride and DMF (2 - 3
drops) was heated under reflux for 8 h. The excess of thionyl chloride was removed by
distillation; the crude product (pyridine diacidchloride) was dried in vacuo and used for the next
reaction without further purification and characterization. The solution of pyridine diacidchloride
(0.7 mmol, 1equiv.) in THF was added dropwise to a solution of solution of 3,4,5-tri-n-
hexadecyloxy benzhydrazide (1.4 mmol, 2.05 equiv.) and triethylamine (2.1 mmol, 3 equiv.) in
THF (20 mL). The reaction mixture was stirred at 55 oC for 12 h. After cooling, THF was
removed through distillation and the residue was extracted with EtOAc. The extract was washed
with water and brine. Dried over Na2SO4 and concentrated. The resulting crude product (3) was
directly used for next reaction.
The solution of crude product 2 (0.5mmol, 1equiv.) in dry toluene (8 mL) was added dropwise to
a solution of Lawesson’s reagent (1.2 mmol, 2.4 equiv.) in toluene at room temperature under
Argon atmosphere and refluxed for 24 h. After the reaction, toluene was evaporated under
reduced pressure. After removal of solvent in vacuo, the crude product was further purified
through column chromatography on neutral alumina. Elution with DCM followed by 5-10%
EtOAc-hexanes yielded the desired product. Again, the product was recrystallized with DCM-
Ethanol system (1:2).
S5
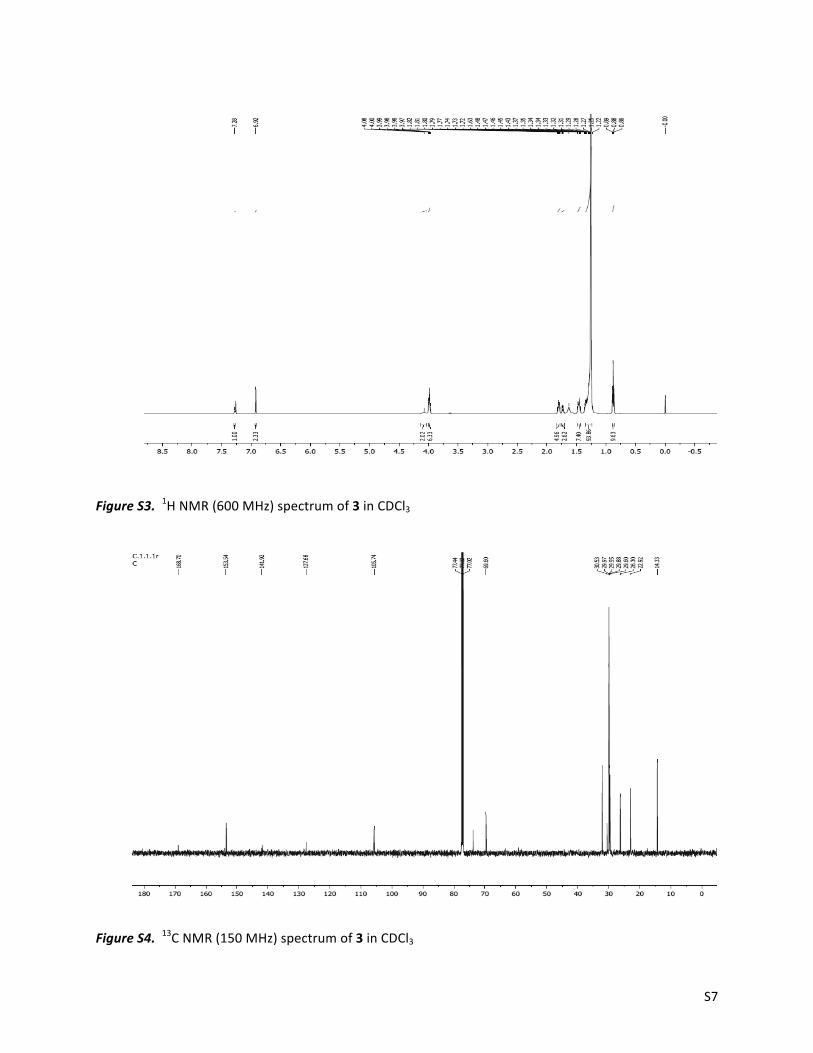
Rf = 0.6 (DCM); white solid, yield: 65%; IR (KBr pellet): νmax in cm-1 3438, 2950, 2917, 2849, 1585,
1432, 1331, 1124, 813, 773; 1H NMR (CDCl3, 600 MHz): δ 8.46(d, 2H, J =12Hz, HAr), 8.04(t, 1H, HAr),
7.28(s, 4H, HAr), 4.10(t, 8H, 4× OCH2), 4.05(t, 4H, 2× OCH2), 1.75 – 1.88(m, 12H, 6 × CH2), 1.35 –
1.53(m, 12H, 6 × CH2), 1.25 – 1.29(m, 144H, 72 × CH2), 0.87 (m, 18H, 6 × CH3); 13C NMR (CDCl3,
150 MHz): 169.11, 166.76, 153.83, 141.37, 131.55, 130.29, 130.12, 127.27, 124.93, 106.80, 73.89, 69.65,
32.15, 30.56, 29.94, 29.88, 29.81, 29.64, 29.59, 26.32, 22.91, 14.32; MALDI TOF MS: m/z for
C117H206N5O6S2 [M+H+], calculated: 1841.5410, Found: 1841.835.
S6
(ii) NMR spectra
Figure S1. 1H NMR (400 MHz) spectrum of 4 in CDCl3
Figure S2. 13C NMR (100 MHz) spectrum of 4 in CDCl3
S7
Figure S3. 1H NMR (600 MHz) spectrum of 3 in CDCl3
Figure S4. 13C NMR (150 MHz) spectrum of 3 in CDCl3
S8
Figure S5. 1H NMR (600 MHz) spectrum of 1 in CDCl3
Figure S6. 13C NMR (150 MHz) spectrum of 1 in CDCl3
S9
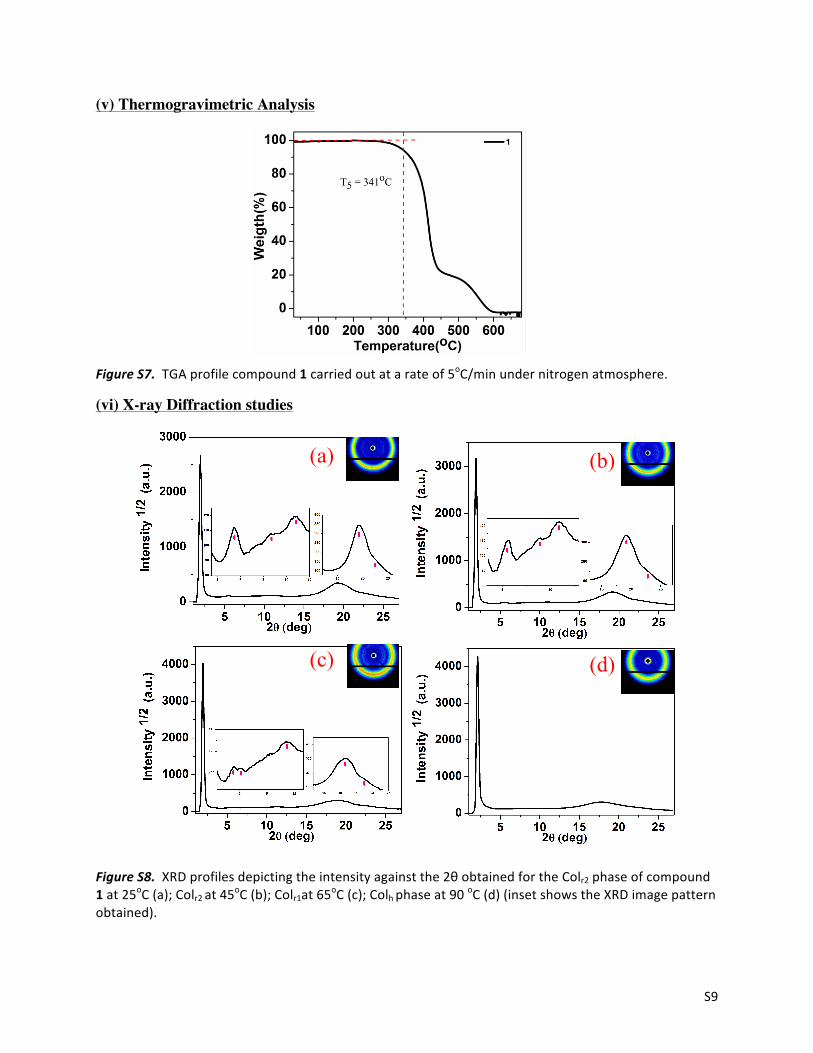
(v) Thermogravimetric Analysis
Figure S7. TGA profile compound 1 carried out at a rate of 5oC/min under nitrogen atmosphere.
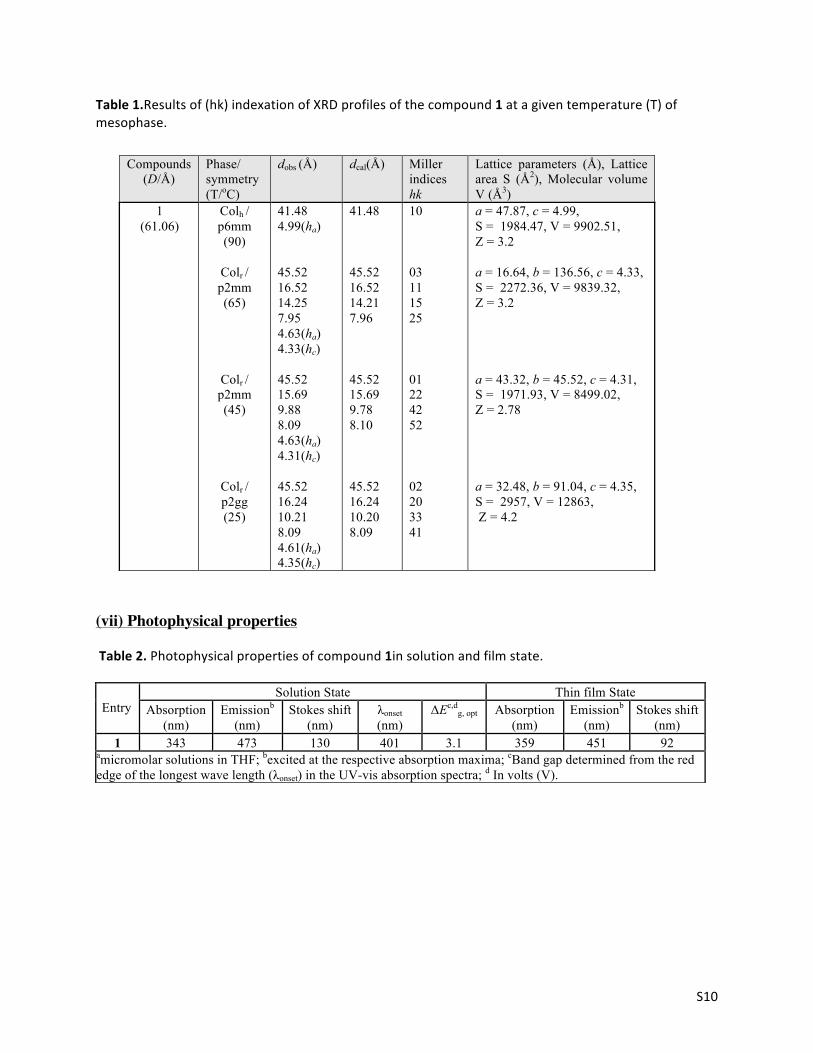
(vi) X-ray Diffraction studies
Figure S8. XRD profiles depicting the intensity against the 2θ obtained for the Colr2 phase of compound 1 at 25oC (a); Colr2 at 45oC (b); Colr1at 65oC (c); Colh phase at 90 oC (d) (inset shows the XRD image pattern obtained).
(a) (b)
(c) (d)
S10
Table 1.Results of (hk) indexation of XRD profiles of the compound 1 at a given temperature (T) of mesophase.
(vii) Photophysical properties
Table 2. Photophysical properties of compound 1in solution and film state.
Compounds (D/Å)
Phase/ symmetry (T/oC)
dobs (Å) dcal(Å) Miller indices hk
Lattice parameters (Å), Lattice area S (Å2), Molecular volume V (Å3)
1 (61.06)
Colh / p6mm (90)
Colr / p2mm (65)
Colr / p2mm (45)
Colr / p2gg (25)
41.48 4.99(ha) 45.52 16.52 14.25 7.95 4.63(ha) 4.33(hc) 45.52 15.69 9.88 8.09 4.63(ha) 4.31(hc) 45.52 16.24 10.21 8.09 4.61(ha) 4.35(hc)
41.48 45.52 16.52 14.21 7.96 45.52 15.69 9.78 8.10 45.52 16.24 10.20 8.09
10 03 11 15 25 01 22 42 52 02 20 33 41
a = 47.87, c = 4.99, S = 1984.47, V = 9902.51, Z = 3.2 a = 16.64, b = 136.56, c = 4.33, S = 2272.36, V = 9839.32, Z = 3.2 a = 43.32, b = 45.52, c = 4.31, S = 1971.93, V = 8499.02, Z = 2.78 a = 32.48, b = 91.04, c = 4.35, S = 2957, V = 12863, Z = 4.2
Entry
Solution State Thin film State Absorption
(nm) Emissionb
(nm) Stokes shift
(nm) λonset (nm)
ΔEc,dg, opt Absorption
(nm) Emissionb
(nm) Stokes shift
(nm) 1 343 473 130 401 3.1 359 451 92
amicromolar solutions in THF; bexcited at the respective absorption maxima; cBand gap determined from the red edge of the longest wave length (λonset) in the UV-vis absorption spectra; d In volts (V).
S11
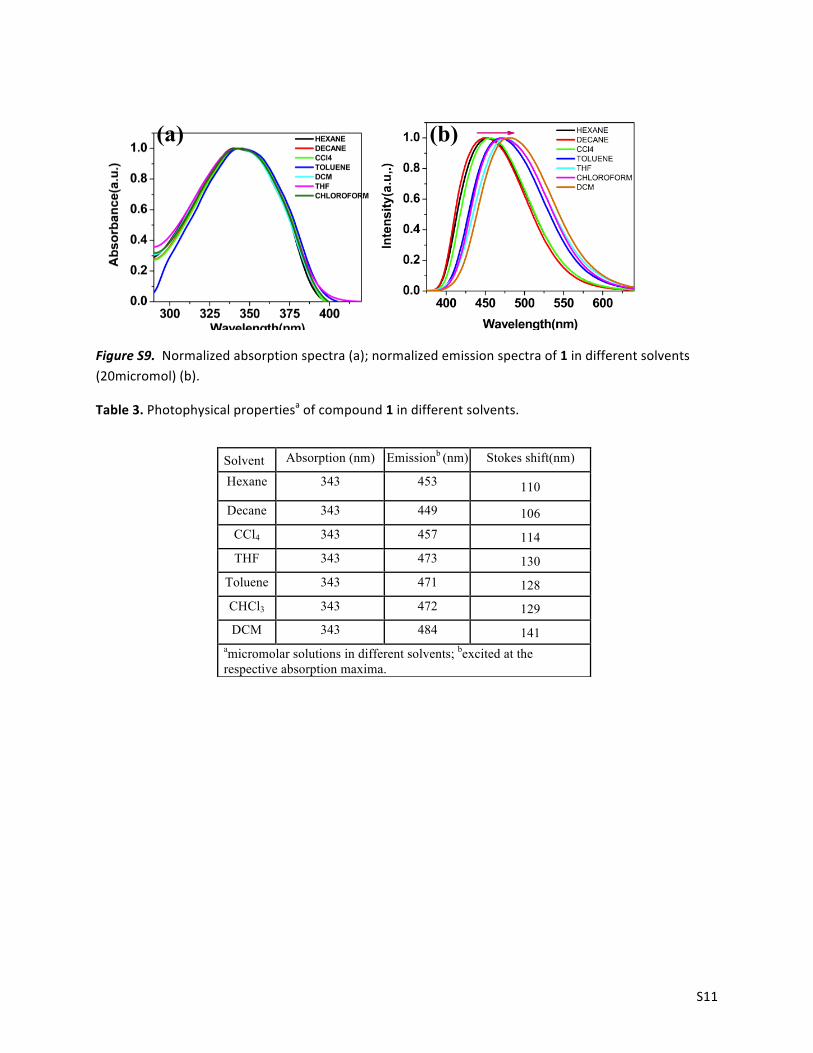
Figure S9. Normalized absorption spectra (a); normalized emission spectra of 1 in different solvents (20micromol) (b).
Table 3. Photophysical propertiesa of compound 1 in different solvents.
(a) (b)
Solvent Absorption (nm) Emissionb (nm) Stokes shift(nm)
Hexane 343 453 110
Decane 343 449 106 CCl4 343 457 114 THF 343 473 130
Toluene 343 471 128 CHCl3 343 472 129 DCM 343 484 141
amicromolar solutions in different solvents; bexcited at the respective absorption maxima.
S12
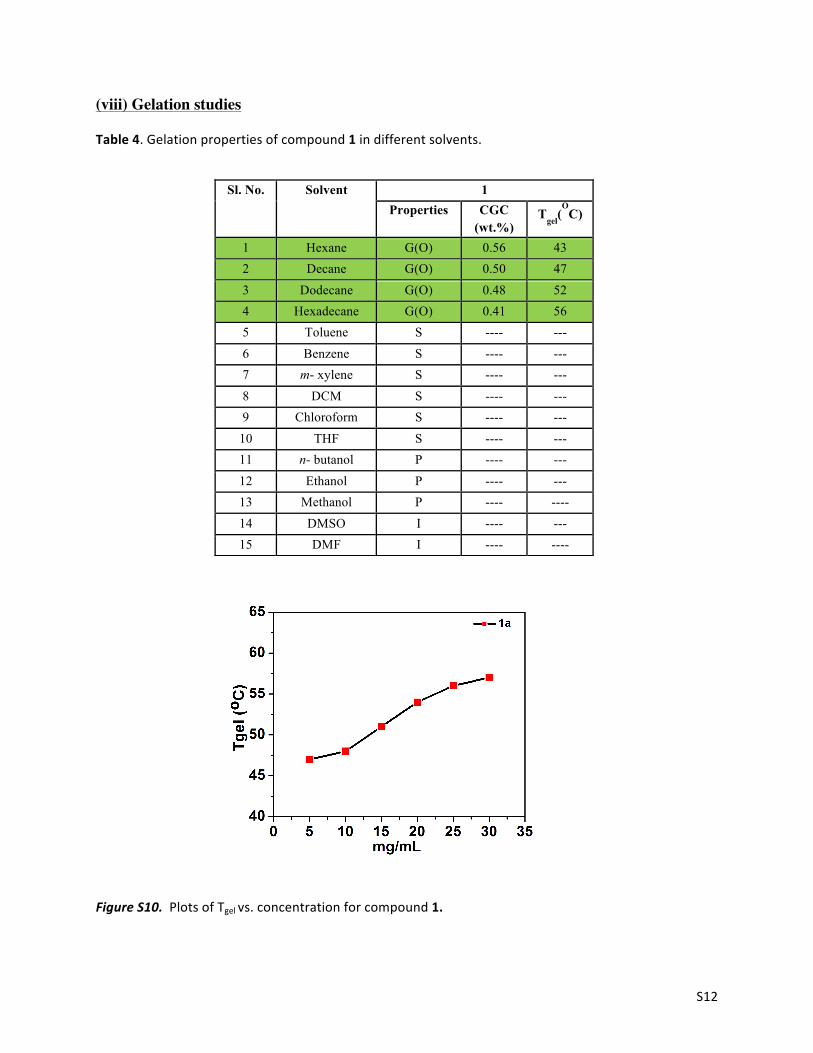
(viii) Gelation studies
Table 4. Gelation properties of compound 1 in different solvents.
Figure S10. Plots of Tgel vs. concentration for compound 1.
Sl. No. Solvent 1 Properties CGC
(wt.%) Tgel(
OC)
1 Hexane G(O) 0.56 43 2 Decane G(O) 0.50 47 3 Dodecane G(O) 0.48 52 4 Hexadecane G(O) 0.41 56 5 Toluene S ---- --- 6 Benzene S ---- --- 7 m- xylene S ---- --- 8 DCM S ---- --- 9 Chloroform S ---- ---
10 THF S ---- --- 11 n- butanol P ---- --- 12 Ethanol P ---- --- 13 Methanol P ---- ---- 14 DMSO I ---- --- 15 DMF I ---- ----
S13
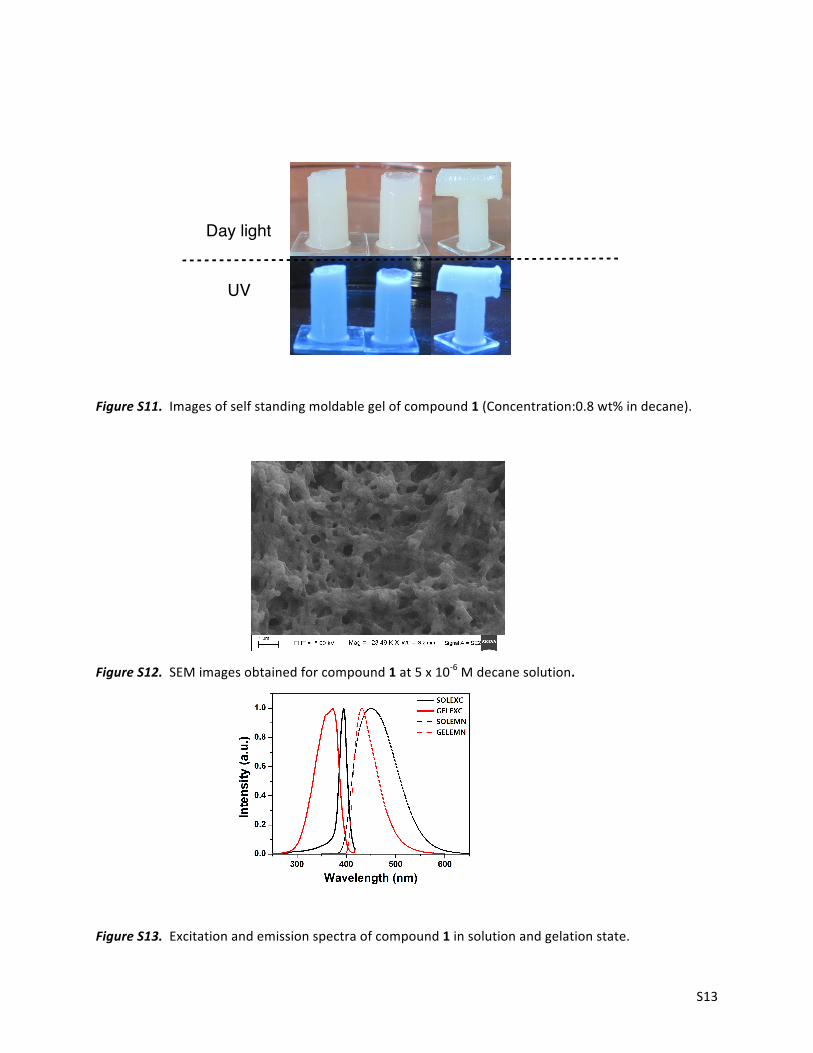
Figure S11. Images of self standing moldable gel of compound 1 (Concentration:0.8 wt% in decane).
Figure S12. SEM images obtained for compound 1 at 5 x 10-‐6 M decane solution.
Figure S13. Excitation and emission spectra of compound 1 in solution and gelation state.
Day light
UV
S14
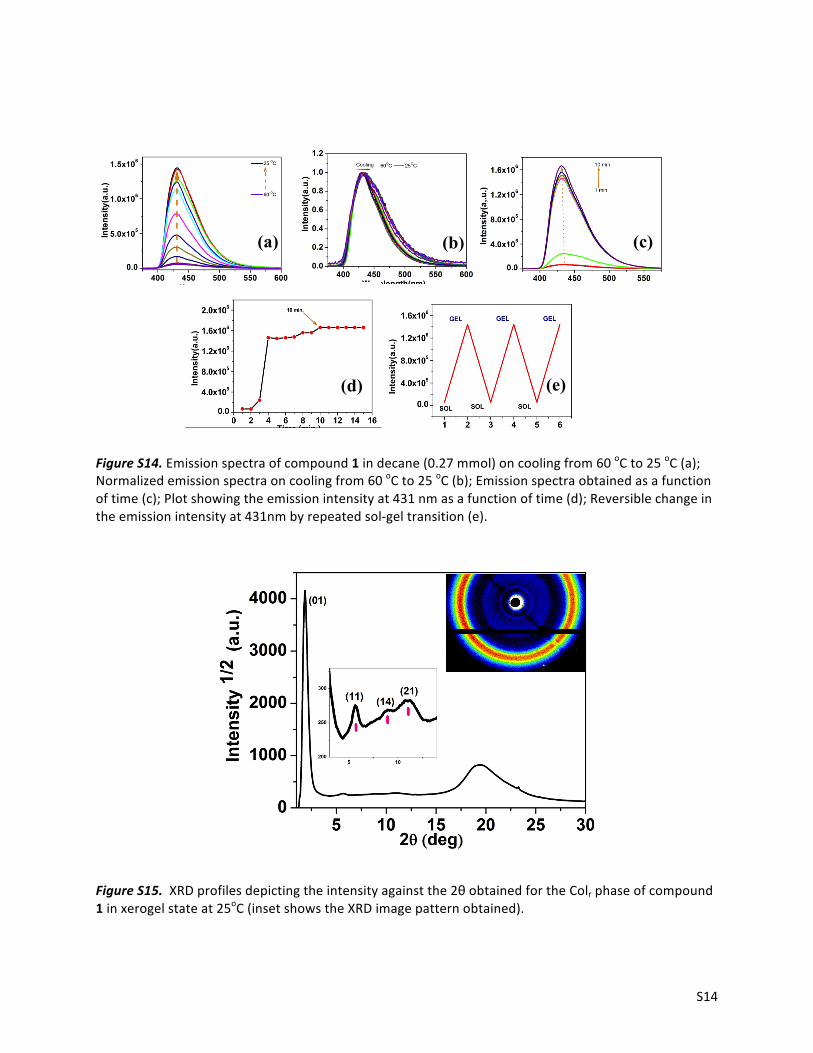
Figure S14. Emission spectra of compound 1 in decane (0.27 mmol) on cooling from 60 oC to 25 oC (a); Normalized emission spectra on cooling from 60 oC to 25 oC (b); Emission spectra obtained as a function of time (c); Plot showing the emission intensity at 431 nm as a function of time (d); Reversible change in the emission intensity at 431nm by repeated sol-‐gel transition (e).
Figure S15. XRD profiles depicting the intensity against the 2θ obtained for the Colr phase of compound 1 in xerogel state at 25oC (inset shows the XRD image pattern obtained).
(e)
(a) (b)
(d)
(c)
S15
Table 5.Results of (hk) indexation of XRD profile of the compound 1 xerogel at room temperature (RT).
(ix) Acidochromic properties
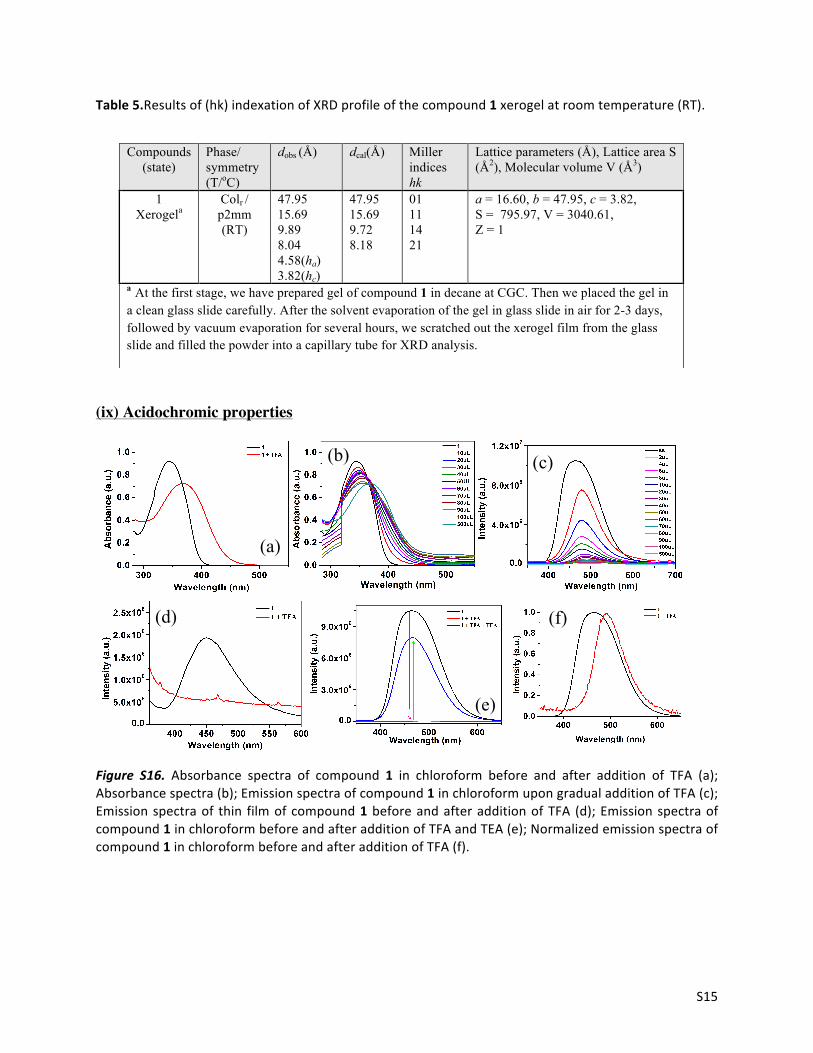
Figure S16. Absorbance spectra of compound 1 in chloroform before and after addition of TFA (a); Absorbance spectra (b); Emission spectra of compound 1 in chloroform upon gradual addition of TFA (c); Emission spectra of thin film of compound 1 before and after addition of TFA (d); Emission spectra of compound 1 in chloroform before and after addition of TFA and TEA (e); Normalized emission spectra of compound 1 in chloroform before and after addition of TFA (f).
(a)
(b) (c)
(d)
(e)
(f)
Compounds (state)
Phase/ symmetry (T/oC)
dobs (Å) dcal(Å) Miller indices hk
Lattice parameters (Å), Lattice area S (Å2), Molecular volume V (Å3)
1 Xerogela
Colr / p2mm (RT)
47.95 15.69 9.89 8.04 4.58(ha) 3.82(hc)
47.95 15.69 9.72 8.18
01 11 14 21
a = 16.60, b = 47.95, c = 3.82, S = 795.97, V = 3040.61, Z = 1
a At the first stage, we have prepared gel of compound 1 in decane at CGC. Then we placed the gel in a clean glass slide carefully. After the solvent evaporation of the gel in glass slide in air for 2-3 days, followed by vacuum evaporation for several hours, we scratched out the xerogel film from the glass slide and filled the powder into a capillary tube for XRD analysis.
S16
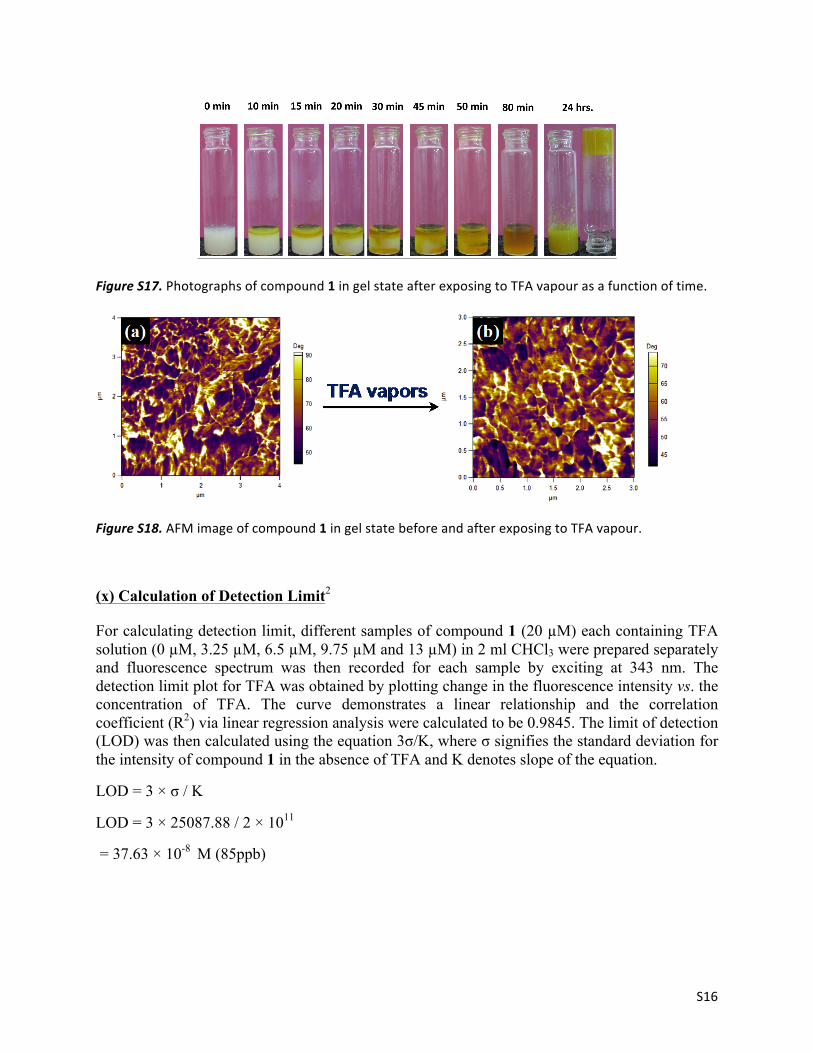
Figure S17. Photographs of compound 1 in gel state after exposing to TFA vapour as a function of time.
Figure S18. AFM image of compound 1 in gel state before and after exposing to TFA vapour.
(x) Calculation of Detection Limit2
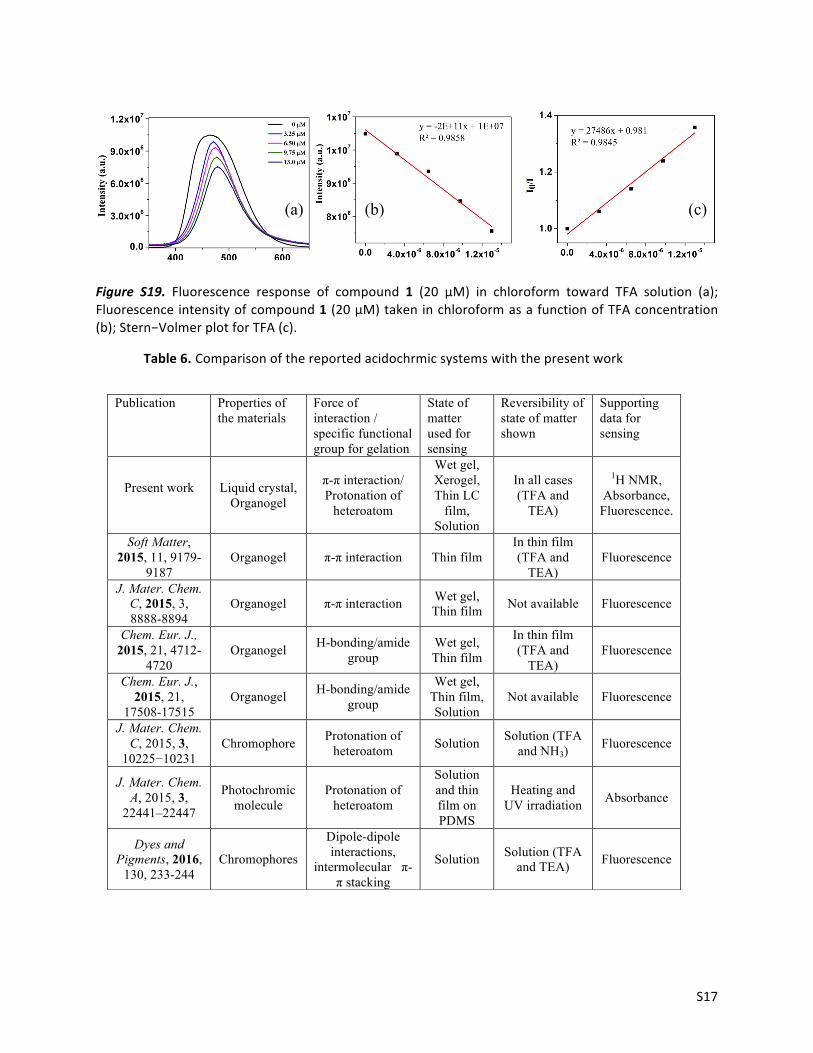
For calculating detection limit, different samples of compound 1 (20 µM) each containing TFA solution (0 µM, 3.25 µM, 6.5 µM, 9.75 µM and 13 µM) in 2 ml CHCl3 were prepared separately and fluorescence spectrum was then recorded for each sample by exciting at 343 nm. The detection limit plot for TFA was obtained by plotting change in the fluorescence intensity vs. the concentration of TFA. The curve demonstrates a linear relationship and the correlation coefficient (R2) via linear regression analysis were calculated to be 0.9845. The limit of detection (LOD) was then calculated using the equation 3σ/K, where σ signifies the standard deviation for the intensity of compound 1 in the absence of TFA and K denotes slope of the equation.
LOD = 3 × σ / K
LOD = 3 × 25087.88 / 2 × 1011
= 37.63 × 10⁻⁸ M (85ppb)
S17
Figure S19. Fluorescence response of compound 1 (20 μM) in chloroform toward TFA solution (a); Fluorescence intensity of compound 1 (20 µM) taken in chloroform as a function of TFA concentration (b); Stern−Volmer plot for TFA (c).
Table 6. Comparison of the reported acidochrmic systems with the present work
(a) (b) (c)
Publication Properties of the materials
Force of interaction / specific functional group for gelation
State of matter used for sensing
Reversibility of state of matter shown
Supporting data for sensing
Present work
Liquid crystal, Organogel
π-π interaction/ Protonation of
heteroatom
Wet gel, Xerogel, Thin LC
film, Solution
In all cases (TFA and
TEA)
1H NMR, Absorbance,
Fluorescence.
Soft Matter, 2015, 11, 9179-
9187 Organogel π-π interaction Thin film
In thin film (TFA and
TEA) Fluorescence
J. Mater. Chem. C, 2015, 3, 8888-8894
Organogel π-π interaction Wet gel, Thin film Not available Fluorescence
Chem. Eur. J., 2015, 21, 4712-
4720 Organogel H-bonding/amide
group Wet gel, Thin film
In thin film (TFA and
TEA) Fluorescence
Chem. Eur. J., 2015, 21,
17508-17515 Organogel H-bonding/amide
group
Wet gel, Thin film, Solution
Not available Fluorescence
J. Mater. Chem. C, 2015, 3,
10225−10231 Chromophore Protonation of
heteroatom Solution Solution (TFA and NH3)
Fluorescence
J. Mater. Chem. A, 2015, 3,
22441–22447
Photochromic molecule
Protonation of heteroatom
Solution and thin film on PDMS
Heating and UV irradiation Absorbance
Dyes and Pigments, 2016,
130, 233-244 Chromophores
Dipole-dipole interactions,
intermolecular π-π stacking
Solution Solution (TFA and TEA) Fluorescence
S18
(xi) Mass spectrometry
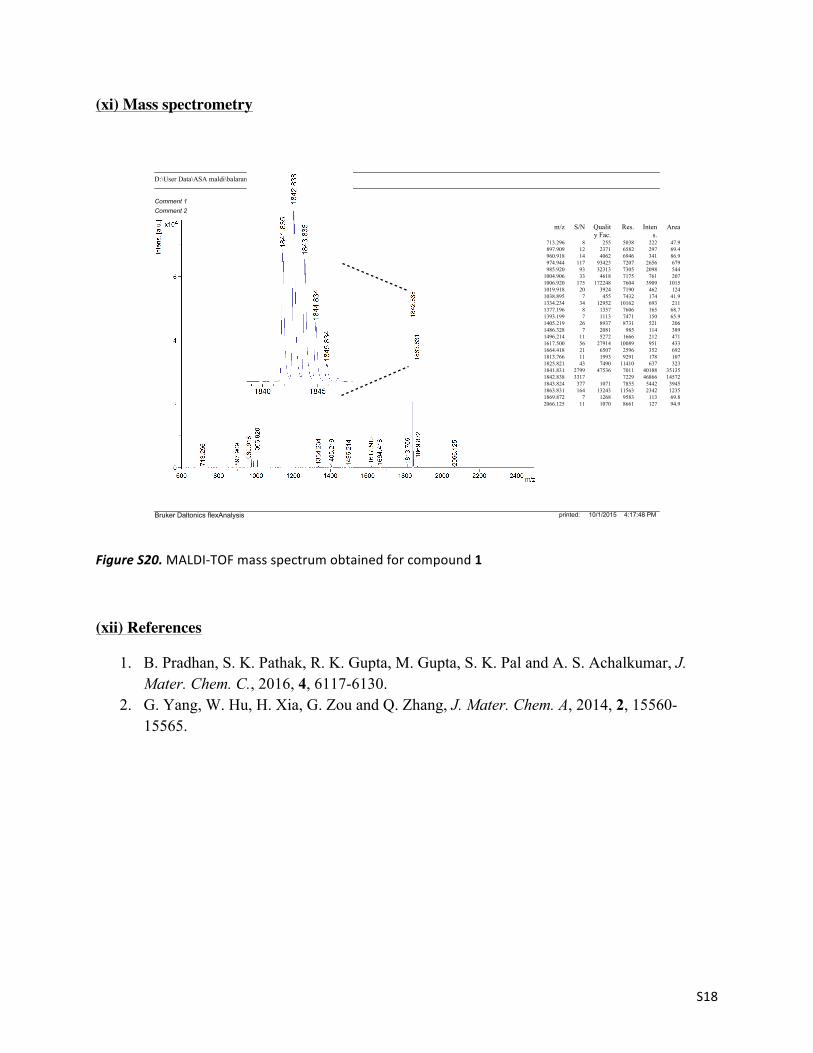
Figure S20. MALDI-‐TOF mass spectrum obtained for compound 1
(xii) References
1. B. Pradhan, S. K. Pathak, R. K. Gupta, M. Gupta, S. K. Pal and A. S. Achalkumar, J. Mater. Chem. C., 2016, 4, 6117-6130.
2. G. Yang, W. Hu, H. Xia, G. Zou and Q. Zhang, J. Mater. Chem. A, 2014, 2, 15560-15565.
Comment 1Comment 2
m/z S/N Quality Fac.
Res. Intens.
Area
713.296 8 255 5038 222 47.9897.909 12 2371 6582 297 69.4960.918 14 4062 6946 341 86.9974.944 117 93423 7207 2656 679985.920 93 32313 7305 2098 544
1004.906 33 4618 7175 761 2071006.920 175 172248 7604 3909 10151019.918 20 3924 7190 462 1241038.895 7 455 7432 174 41.91334.234 34 12952 10162 693 2111377.196 8 1357 7606 165 68.71393.199 7 1113 7471 150 65.91405.219 26 8937 8731 521 2061486.328 7 2081 985 114 3891496.214 11 5272 1666 212 4711617.500 56 27914 10089 951 4331664.418 21 6507 2596 352 6921813.766 11 1993 9291 178 1071825.821 43 7490 11410 637 3231841.831 2799 47536 7011 40188 351351842.838 3317 7229 46866 145721843.824 377 1071 7855 5442 39451863.831 164 13243 11563 2342 12351869.872 7 1268 9583 113 69.82066.125 11 1070 8661 127 94.9
D:\User Data\ASA maldi\balaram\BP-151\BP-151\0_O17\1\1SRef
10/1/2015 4:17:48 PMprinted:Bruker Daltonics flexAnalysis
Comment 1Comment 2
m/z S/N Quality Fac.
Res. Intens.
Area
713.296 8 255 5038 222 47.9897.909 12 2371 6582 297 69.4960.918 14 4062 6946 341 86.9974.944 117 93423 7207 2656 679985.920 93 32313 7305 2098 544
1004.906 33 4618 7175 761 2071006.920 175 172248 7604 3909 10151019.918 20 3924 7190 462 1241038.895 7 455 7432 174 41.91334.234 34 12952 10162 693 2111377.196 8 1357 7606 165 68.71393.199 7 1113 7471 150 65.91405.219 26 8937 8731 521 2061486.328 7 2081 985 114 3891496.214 11 5272 1666 212 4711617.500 56 27914 10089 951 4331664.418 21 6507 2596 352 6921813.766 11 1993 9291 178 1071825.821 43 7490 11410 637 3231841.835 2500 7737 35317 100521842.838 3317 7229 46866 145721843.836 2364 7445 33395 102901844.834 1132 8058 15994 45561845.834 356 9163 5040 12871863.833 124 12279 1730 3131864.837 200 11365 2778 5341865.831 123 12505 1709 3211869.872 7 1268 9583 113 69.82066.125 11 1070 8661 127 94.9
D:\User Data\ASA maldi\balaram\BP-151\BP-151\0_O17\1\1SRef
10/1/2015 4:18:53 PMprinted:Bruker Daltonics flexAnalysis
Top Related