


Languages
Pages
Legal


Presented at the 1st International Conference on Advanced Lithium Batteries for Automotive Applications held September 15-17, 2008 in Argonne, Illinois
NREL is a national laboratory of the U.S. Department of Energy Office of Energy Efficiency and Renewable Energy operated by Midwest Research Institute • Battelle
Gi-Heon KimKandler Smith
National Renewable Energy Laboratory
NREL/PR-540-44245
Multi-Scale Multi-Dimensional Model for Better Cell Design and Management
1st International Conference on Advanced Lithium Batteries for Automotive ApplicationsArgonne, September 15–17, 2008

National Renewable Energy Laboratory Innovation for Our Energy Future
[m]
“Requirements” are usually defined in a macroscale domain and terms.
PerformanceLifeCostSafety
Design of Materials
VoltageCapacityLattice stabilityKinetic barrierTransport property
Design of Electrode ArchitectureLi transport path (local)Electrode surface areaDeformation & fatigueStructural stabilitySurface physics
Design of Electrodes Pairing and Lithium TransportElectrodes selectionLi transportPorosity, tortuosityLayer thicknesses Load conditions
Design of Electron Current & Heat Transport
Electric & thermal connectionsDimensions, form factorComponent shapes
Requirements & Resolutions
Multi-Scale Physics in Li-Ion Battery

National Renewable Energy Laboratory Innovation for Our Energy Future
a) Quantum mechanical and molecular dynamic modelingb) Numerical modeling for addressing the impacts of architecture of
electrode materialsc) 1D performance model capturing solid-state and electrolyte diffusion
dynamicsd) Cell-dimension 3D model for evaluating macroscopic design factors
[m]
a) b) c) d)
Need a Multi-Scale Model?Numerical approaches focusing on different length scale physics

National Renewable Energy Laboratory Innovation for Our Energy Future
Why macro-scale transport becomes critical?
Sub-electrode scale physicsKineticsLi diffusionIon transportHeat dissipation
Spatial variation of …
• Electric potentials• Temperatures
Design of current and heat flow paths
Size EffectDimension
Surface Area / Volume
Spatial Difference(gradient x distance)
Flux (gradient) Barrier (distance)
Dimension Increase
Spatial ImbalanceIncrease

National Renewable Energy Laboratory Innovation for Our Energy FutureC
urre
nt C
olle
ctor
(Cu)
Cur
rent
Col
lect
or (A
l)
Neg
ativ
eEl
ectro
de
Sepa
rato
r
Posi
tive
Elec
trode
Image source: www.dimec.unisa.it
SimulationDomain
X
R
x
=
• Multi-scale physics from sub-micro-scale to battery-dimension-scales• Difficulties in resolving microlayer structures in a computational grid
Macro Grid Micro Grid(Grid for Subgrid Model)
+
To address …
Multi-Scale Multi-Dimensional (MSMD) Modeling
Approach in the Present Study

National Renewable Energy Laboratory Innovation for Our Energy Future
),,( tRXT ),,,( txRXsφ),,,( txRXeφ
),,,,( trxRXcs
),,,( txRXce
),,( tRXV
),,,( txRXQi
),,,( txRXjLi),,( tRXSOC
),,( tRXi
VAdxQtRXQ
xi∫=),,(
NOTE:Selection of solution scheme for either grid system is independent of the other.
Cur
rent
Col
lect
or (C
u)
Cur
rent
Col
lect
or (A
l)
Neg
ativ
eEl
ectro
de
Sepa
rato
r
Posi
tive
Elec
trode
Image source: www.dimec.unisa.it
Detailed Structure
X
R
x
≈ Cell Dimension Transport Model
Electrode Scale Submodel (1D)+
Solution Variables

National Renewable Energy Laboratory Innovation for Our Energy Future
Previous StudyAABC 08, Tampa, May 2008
“Poorly designed electron and heat transport paths can
cause excessive nonuniform use of materials and then deteriorate the performance and shorten the life of the battery.”

National Renewable Energy Laboratory Innovation for Our Energy Future
Analysis
Comparison with Experimental ResultsModel Validation against JCS VL41M Test Data
Macro-Scale Design Evaluation AnalysisImpacts of Aspect Ratio of a Cylindrical Cell

National Renewable Energy Laboratory Innovation for Our Energy Future
Analysis
Comparison with Experimental ResultsModel Validation against JCS VL41M Test Data
Macro-Scale Design Evaluation AnalysisImpacts of Aspect Ratio of a Cylindrical Cell
The JCS VL41M cell was chosen as a candidate for several reasons:• 1-D electrochemical model was previously validated vs. VL41M current/voltage data.• Thermal imaging experiments were recently run.• Future calorimeter test data will allow for further refinement & validation of the model.
National Renewable Energy Laboratory Innovation for Our Energy Future
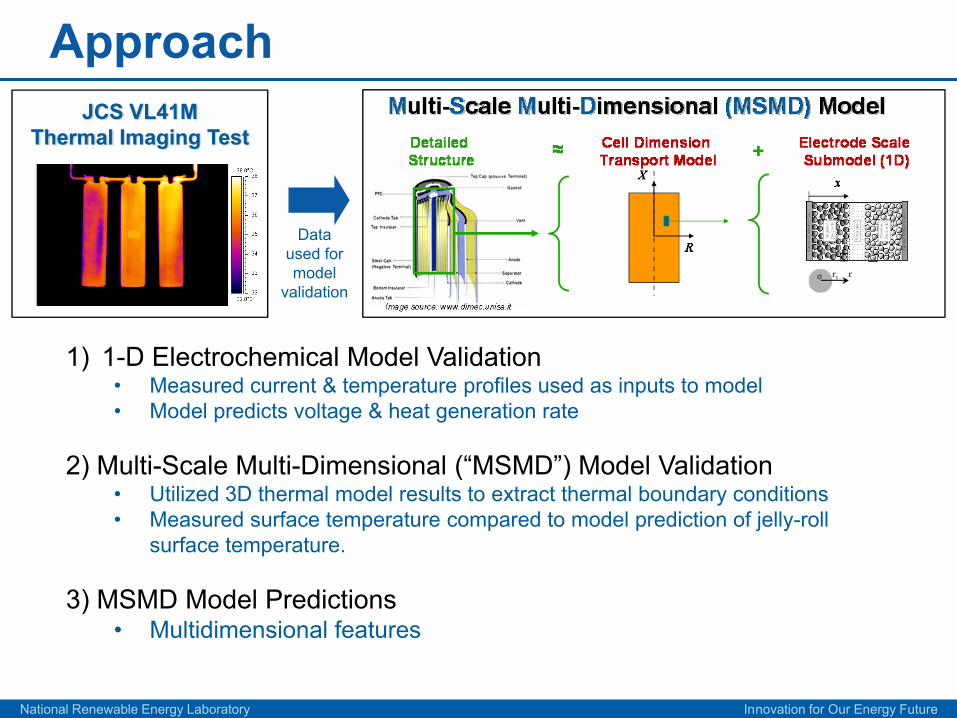
Approach
1) 1-D Electrochemical Model Validation• Measured current & temperature profiles used as inputs to model• Model predicts voltage & heat generation rate
2) Multi-Scale Multi-Dimensional (“MSMD”) Model Validation• Utilized 3D thermal model results to extract thermal boundary conditions• Measured surface temperature compared to model prediction of jelly-roll
surface temperature.
3) MSMD Model Predictions• Multidimensional features
JCS VL41M Thermal Imaging Test
Data used for model
validation

National Renewable Energy Laboratory Innovation for Our Energy Future
1) 1D Electrochemical Model Validation
Measured current and skin temperature* profiles from thermal imaging test used as inputs to lumped thermal/1-D electrochemical model.
Model voltage prediction compares favorably with data.• Error generally < 50 mV
* Skin temperature measured via thermocouple on can wall, 3” from bottom.
CD CS Rest
Test Profile:5 charge-depletion cycles + 60 charge-sustaining cycles per USABC manual (BSF = 39)

National Renewable Energy Laboratory Innovation for Our Energy Future
Irreversible heat generation rate predicted by 1-D electrochemical modelcompares well with calculated value using measured current and voltage and model open-circuit voltage.
• Entropic heat effects seem to be non-negligible and may need to be included in the model.
Qirr = Imeas(OCPmodel – Vmeas)
CD CS Rest
Test Profile:5 charge depletion cycles + 60 charge sustaining cycles per USABC manual (BSF = 39)
* More rigorous heating rates and specific heat to be measured in upcoming calorimeter testing.
1) 1D Electrochemical Model Validation

National Renewable Energy Laboratory Innovation for Our Energy Future
2) MSMD Model ValidationAssumption for Model Simplification
Extended Foil
Extended Foil Axisymmetric
Note: The schematics shown above do not represent actual JCS VL41M.

National Renewable Energy Laboratory Innovation for Our Energy Future
2) MSMD Model Validation
• Complex thermal pathway was captured in 3D thermal model, then appropriate thermal boundary condition was evaluated for MSMD model
Retrieving information from 3D Thermal Model for MSMD model input
IR Image Model
100 A Geometric Cycle - Steady
- General system response for temperature distributions at cell skins, terminals and bus bars is well predicted and reveals how heat is transferred through the 3 cell assembly.

National Renewable Energy Laboratory Innovation for Our Energy Future
2) MSMD Model ValidationEvaluating thermal boundary conditions at jelly-roll surfaces
Heat transfer coefficient at jelly-roll surfaces of the middle cell
Area Weighted Averageshtop = 22.6 W/m2Khside = 8.7 W/m2Khbottom= 12.4 W/m2K
hinf = 8 W/m2K
htop
hside
hbottom
Axisymmetric MSMD Model

National Renewable Energy Laboratory Innovation for Our Energy Future
2) MSMD Model Validation
cp = 1230 J/kg K
Comparison with Measured Temperature
Measured can surface temperature and model-predicted jelly-roll temperature agree reasonably well. Without an internally-instrumented cell, it is not possible to directly validate the MSMD model’s jelly-roll temperature predictions.
CD CS Rest
1.4°C

National Renewable Energy Laboratory Innovation for Our Energy Future
(max(I)-min(I)) / avg(I) = 1.6%
XR
Reaction Current
3) MSMD Model Prediction
• t = 1770 s• Tcan wall = 31.6°C• Current = 409 A
Snapshots at the end of CHARGE DEPLETING cycles
X
R
max(T) – min(T) = 1.4oC
XR R max(SOC) – min(SOC) = 0.24%
X
SOC
Temperature
Potential
Heat Transport
Electron Transport

National Renewable Energy Laboratory Innovation for Our Energy Future
3) MSMD Model PredictionAh-throughput during CHARGE DEPLETING cycles
Ah-throughput imbalance during CD cycling (Ah/m2 – Ah/m2avg)/Ah/m2
avg
%
+ -
oC
• t = 1770 s• Tcan wall = 31.6°C• Current = 409 A
Temperature at the end of CD cycles

National Renewable Energy Laboratory Innovation for Our Energy Future
Analysis
Comparison with Experimental ResultsModel Validation against JCS VL41M Test Data
Macro-Scale Design Evaluation AnalysisImpacts of Aspect Ratio of a Cylindrical Cell
The JCS VL41M cell was chosen as a candidate for several reasons:• 1-D electrochemical model was previously validated vs. VL41M current/voltage data.• Thermal imaging experiments were recently run.• Future calorimeter test data will allow further refinement and validation of the model.

National Renewable Energy Laboratory Innovation for Our Energy Future
Aspect Ratio of Cylindrical Cells
US06 CD cycle• Pavg = 14 kW, PRMS = 32 kW
PHEV10 application• US06 cycle discharges 3.4
kWh in 12 minutes (~3C rate)
20 Ah cell• Well suited for PHEV10• BSF = 78 → Vnom ≈
290V
“Nominal”
“Large H”“Large D”

National Renewable Energy Laboratory Innovation for Our Energy Future
Brief Look at “What H/D Ratio Means”
22
, ~ HiP foilloss δρ ′′⋅
2~ HiVfoil δρ ′′⋅
Δ
H
W
Volume = const
H
D
H x W = const +
-
e- +
- e-
Foil thicknesses Al: 20 µmCu: 15 µm
Voltage at Positive Foil Voltage at Negative Foil
i“: current [A/m2] ρ: resistivityδ: foil thickness
Hδ
ρ 2i ′′⋅
δρ 2i ′′⋅
+
-

National Renewable Energy Laboratory Innovation for Our Energy Future
10s Power Capability Comparison
Large H
Nominal
Large D
40
110
90
60
50
100
80
70
120
30
27
73
60
40
33
67
53
47
80
2010 20 30 8040 50 60 9070
SOC (%)
Dis
char
ge P
ower
(kW
)
Cha
rge
Pow
er (k
W)
HPPC, BSF = 78
• Large H design has almost 10% less power capability.
D[mm]: 28H[mm]: 350
D[mm]: 50H[mm]: 107
D[mm]: 115H[mm]: 20

National Renewable Energy Laboratory Innovation for Our Energy Future
US06 CD Cycle x 2, Natural Convection
Large H cell has greatest temperature rise owing to long electronic current paths resulting in high foil heating.
Foil heat contribution to total:• 15% - Large H• 1.7% - Nominal• <0.1% - Large D
Large H cell has greatest internal temperature imbalance.

National Renewable Energy Laboratory Innovation for Our Energy Future
Amp-hourThroughputImbalance
Large Dia. Cell-0.1% to +0.03%
Nominal Cell-0.2% to +0.3%
Large Height Cell-1.2% to +2.9%
US06 CD cycle
2.5%
2.0%
1.5%
1.0%
0.5%
0%
-0.5%
-1.0%
US06 CD Cycle x 2, Natural Convection(Ah/m2 – Ah/m2
avg)/Ah/m2avg

National Renewable Energy Laboratory Innovation for Our Energy Future
Summary
Nonuniform battery physics, which is more probable in large-format cells, can cause unexpected performance and life degradations in lithium-ion batteries.
A Multi-Scale Multi-Dimensional model was developed as a tool for investigating interaction between micro-scale electrochemical process and macro-scale transports using a multi-scale modeling scheme.
The developed model will be used to provide better understanding and help answer engineering questions about improving cell design, cell operational strategy, cell management, and cell safety.
Engineering questions to be addressed in future works include …What is the optimum form-factor and size of a cell?Where are good locations for tabs or current collectors?How different are measured parameters from their nonmeasurable internal values? Where is the effective place for cooling? What should the heat-rejection rate be?How does the design of thermal and electrical paths impact under current-related safety events, such as internal/external short and overcharge?
National Renewable Energy Laboratory Innovation for Our Energy Future
Acknowledgments
Vehicle Technologies Program at DOE• Tien Duong• Dave Howell
NREL Energy Storage Task• Ahmad Pesaran

National Renewable Energy Laboratory Innovation for Our Energy Future
Thank you!

National Renewable Energy Laboratory Innovation for Our Energy Future
Additional Slides

National Renewable Energy Laboratory Innovation for Our Energy Future
Heat Transfer – 100 A Geometric Cycle
ACB
AC B
-20
-10
0
10
20
30
40
50
60
70
80
90
positiveterminal
negativeterminal
side top botomPerc
enta
ge o
f Hea
t Rej
ectio
n [%
]
Cell A Cell B Cell C
4.927.29
9.68
68.46
4.99
4.66
positive cablenegative cablebus bar surfacesside surfacestop surfacesbtm surfaces
Percentage of Heat Rejection from Each Cell
Percentage of Heat Rejection from Assembly
- Skin temperature of Cell C is low, because it is directly connected to the cable through the positive terminal. - There are inflows of heat through the positive thermals at Cell A and Cell B which are connected to the negative terminals of the neighbor cells.- Most heat is rejected through cell side surfaces. About 10% of heat is dissipated at bus bar surfaces. 12% runs away through cables.

National Renewable Energy Laboratory Innovation for Our Energy Future
3) MSMD Model Prediction
Temperature Distribution after 30 sec 300 A discharge
Temperature Distribution after 20 min 100 A geometric cycling

National Renewable Energy Laboratory Innovation for Our Energy Future
US06 CD Cycle x 2, Natural Convection
Tmax-Tmin = 1.7°CTavg = 44.7°C
Tmax-Tmin = 1.7°CTavg = 45.5°C
Tmax-Tmin = 3.2°CTavg = 47.6°C
Temperature Distribution

National Renewable Energy Laboratory Innovation for Our Energy Future
IntegratedHeat
Imbalance
20%
15%
10%
5%
0%
-5%
Large Dia. Cell-0.1% to +0.1%
Nominal Cell-1.1% to +2.7%
Large Height Cell-9% to +21%
US06 CD cycle
US06 CD Cycle, Natural Convection

National Renewable Energy Laboratory Innovation for Our Energy Future
Forced Convection
Average temperature
lower
Natural Convection(h = 8 W/m2 K)
Forced Air Convection(h = 30 W/m2 K)
Heat generation
similar
Temperature imbalance
1-3°C higher
~ 5oC in Large H and Large D format, ~2oC in Nominal

National Renewable Energy Laboratory Innovation for Our Energy Future
Forced convection – negligible impact on where heat is generated
IntegratedHeat
Imbalance
20%
15%
10%
5%
0%
-5%
Large Dia. CellNatural: -0.1% to +0.1%Forced: -0.3% to +0.2%
Nominal CellNatural: -1.1% to +2.7%Forced: -1.2% to 2.8%
Large Height CellNatural: -9% to +21%Forced: -9% to +21%
US06 CD cycle
ForcedConvectionForced
Convection
Forced Convection

National Renewable Energy Laboratory Innovation for Our Energy Future
Despite additional thermal imbalance, forced convection does not drastically change localized material usage.
Amp-hourThroughputImbalance
Large Dia. CellNatural: -0.1% to +0.03%Forced: -0.3% to 0.07%
Nominal CellNatural: -0.2% to +0.3%Forced: -0.3% to 0.4%
Large Height CellNatural: -1.2% to +2.9%Forced: -1.3% to 2.9%
US06 CD cycle
2.5%
2.0%
1.5%
1.0%
0.5%
0%
-0.5%
-1.0%
ForcedConvectionForced
Convection
Forced Convection

National Renewable Energy Laboratory Innovation for Our Energy Future
Comparison of natural and forced convection
at t = 690 s of US06 cycle
Tavg (°C) Tmax-Tmin (°C)
Natural 44.4 1.6
Forced 40.9 4.1
Tavg (°C) Tmax-Tmin (°C)
Natural 45.2 1.7
Forced 42.6 4.8
Tavg (°C) Tmax-Tmin (°C)
Natural 47.2 3.2
Forced 43.0 4.4
Large D
Large H
Nominal
Top Related