


Languages
Pages
Legal


Multi-factor approach to reduce cardiovascular risk in diabetes
Prof. Nicola Napoli, MD PhDDivision of Endocrinology and Diabetes Università Campus Bio-Medico di Roma
Washington University in St Louis

Type 2 diabetes progression: vascular changes and tissue damage
Adapted from DeFronzo et al. International Textbook of Diabetes. 3rd edn. New York, NY: John Wiley & Sons; 2004:1141

Tissue damage leads to serious long-term complications in type 2 diabetes
Adapted from Diabetes Atlas 4th edn. International Diabetes Federation. 2009
CHF, congestive heart failure; ESRD, end-stage renal disease; MI, myocardial infarction; TIA, transient ischaemic attack

Adapted from Brown et al. Diabetes Obes Metab 2000;2(Suppl. 2):S11–18
Micro- and macrovascular complications are associated with type 2 diabetes

Microvascular complications of type 2 diabetes

UKPDS: glycaemic control – effects on microvascular endpoints*
Adapted from Stratton et al. BMJ 2000;321:405–12HDL-C, high-density lipoprotein cholesterol; LDL-C, low-density lipoprotein cholesterol; SBP, systolic blood pressure; TG, triglycerides
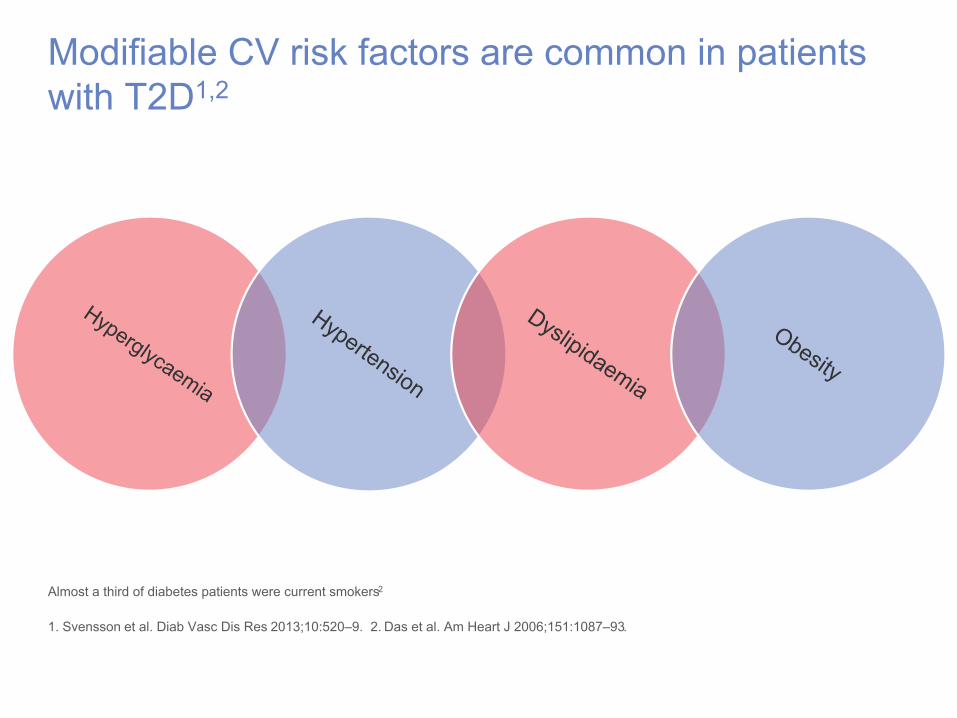
Modifiable CV risk factors are common in patients with T2D1,2
Hyperglycaemia
Hypertension
Dyslipidaemia
Obesity
7
Almost a third of diabetes patients were current smokers2
1. Svensson et al. Diab Vasc Dis Res 2013;10:520–9. 2. Das et al. Am Heart J 2006;151:1087–93.

*In individuals with overt cardiovascluar disease, a lower LDL-cholesterol goal of <70 mg/dL (1.8 mmol/L), using high-dose of a statin, is an option.AACE Diabetes Mellitus Clinical Practice Guidelines Task Force. Endocr Pract. 2007;13(suppl 1):1-68."Standards of Medical Care in Diabetes—2011." Diabetes Care 34(Supplement 1): S11-S61.
Target Treatment Goals
AACE/ACE 2011 ADA 2011
A1C ≤ 6.5% < 7.0%Blood pressure <130/80 mm Hg <130/80 mm Hg
Cholesterol (lipids)
• LDL-C < 100 mg/dL (< 70 mg/dL for patients with diabetes and coronary artery disease)
• HDL-C > 40 mg/dL in men;> 50 mg/dL in women
• Triglycerides <150 mg/dL
• LDL-C < 100 mg/dL (< 70 mg/dL for patients with diabetes and coronary artery disease)
• HDL-C > 40 mg/dL in men;> 50 mg/dL in women;
• Triglycerides < 150 mg/dL
ABCs of Type 2 Diabetes: AACE/ACE 2011 and ADA 2011
Handelsman Y, et al. American Association of Clinical Endocrinologists Medical Guidelines for Clinical Practice for Developing a Diabetes Mellitus Comprehensive Care Plan. Endocr Pract. 2011;17(Suppl 2):1-53. Standards of Medical Care in Diabetes—2011. Diabetes Care. 34(Supplement 1): S11-S61.

*In individuals with overt cardiovascluar disease, a lower LDL-cholesterol goal of <70 mg/dL (1.8 mmol/L), using high-dose of a statin, is an option.AACE Diabetes Mellitus Clinical Practice Guidelines Task Force. Endocr Pract. 2007;13(suppl 1):1-68."Standards of Medical Care in Diabetes—2011." Diabetes Care 34(Supplement 1): S11-S61.
Target Treatment Goals
AACE/ACE 2011 ADA 2011
A1C ≤ 6.5% < 7.0%
Fasting glucose
Fasting plasma glucose:< 110 mg/dL
Preprandial capillary plasma glucose: 70 – 130 mg/dL
Postprandial glucose
2-hr postprandial glucose:< 140 mg/dL
Peak postprandial capillary plasma glucose: < 180 mg/dL
Glycemic Control Recommendations for Type 2 Diabetes:
AACE/ACE 2011 and ADA 2011
Handelsman Y, et al. American Association of Clinical Endocrinologists Medical Guidelines for Clinical Practice for Developing a Diabetes Mellitus Comprehensive Care Plan. Endocr Pract. 2011;17(Suppl 2):1-53.
Standards of Medical Care in Diabetes—2011. Diabetes Care. 34(Supplement 1): S11-S61.
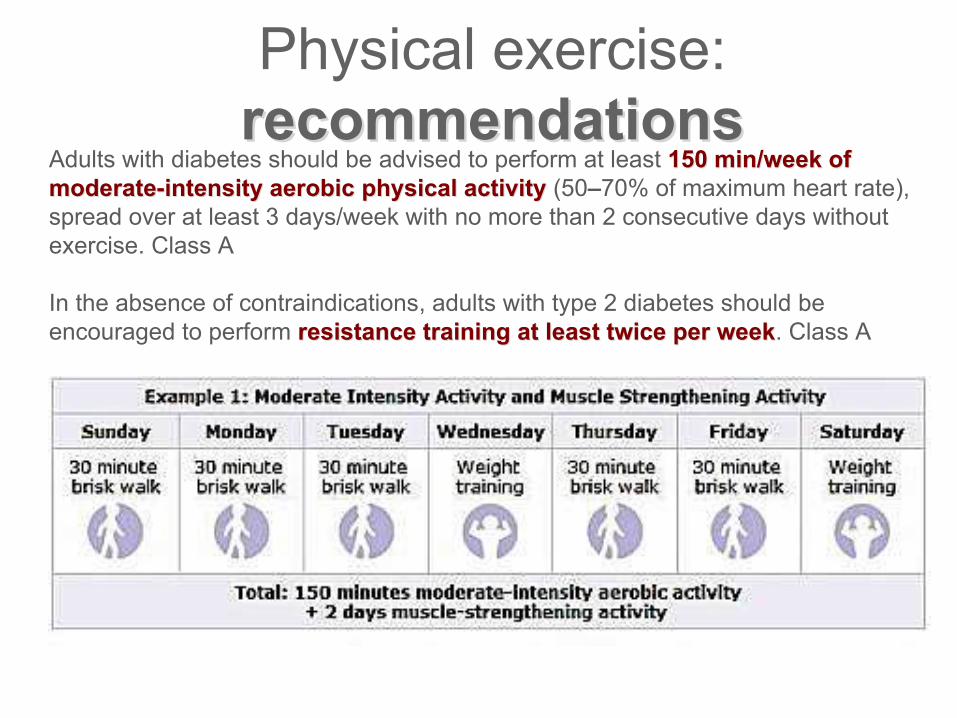
Physical exercise: recommendationsrecommendations
Adults with diabetes should be advised to perform at least 150 min/week of150 min/week ofmoderate-intensity aerobic moderate-intensity aerobic physical activity physical activity (50–70% of maximum heart rate), spread over at least 3 days/week with no more than 2 consecutive days without exercise. Class A
In the absence of contraindications, adults with type 2 diabetes should be encouraged to perform resistance training resistance training at least twice per weekat least twice per week. Class A
10

ØØ Caloric Caloric restriction restriction is a drastic intervention on eating habits
aimed to reduce the caloric intake of about 25%.
ü Energy intake of about 1800 kcal/die, rich in fruit, vegetable, nuts, soy
and meat
ü Reduced intake of carbohydrates and hydrogenated oils
Fontana L et al. JAMA 2009
Caloric restriction
11

Recent trials of newer glucose-lowering agents on the primary CV outcome
12
SAVOR-TIMI 53
EXAMINE
HR: 1.0(95% CI: 0.89, 1.12)
HR: 0.96(95% CI: UL ≤1.16)
TECOSHR: 0.98(95% CI: 0.88, 1.09)
EMPA-REG OUTCOME®
ELIXAHR: 1.02(95% CI: 0.89, 1.17)
Empagliflozin
DPP-4 inhibitors*
GLP-1 analogues
CV, cardiovascular; HR, hazard ratio; DPP-4, dipeptidyl peptidase-4*Saxagliptin, alogliptin, sitagliptinAdapted from Johansen OE. World J Diabetes 2015;6:1092-96
2013 2014 2015
From: https://s3-eu-west-1.amazonaws.com/mevents/easd/empa-reg-slide-kit.pptx
2016
LEADER
HR: 0.87(95% CI: 0.78, 0,97)
HR: 0.86(95% CI: 0.74, 0.99)
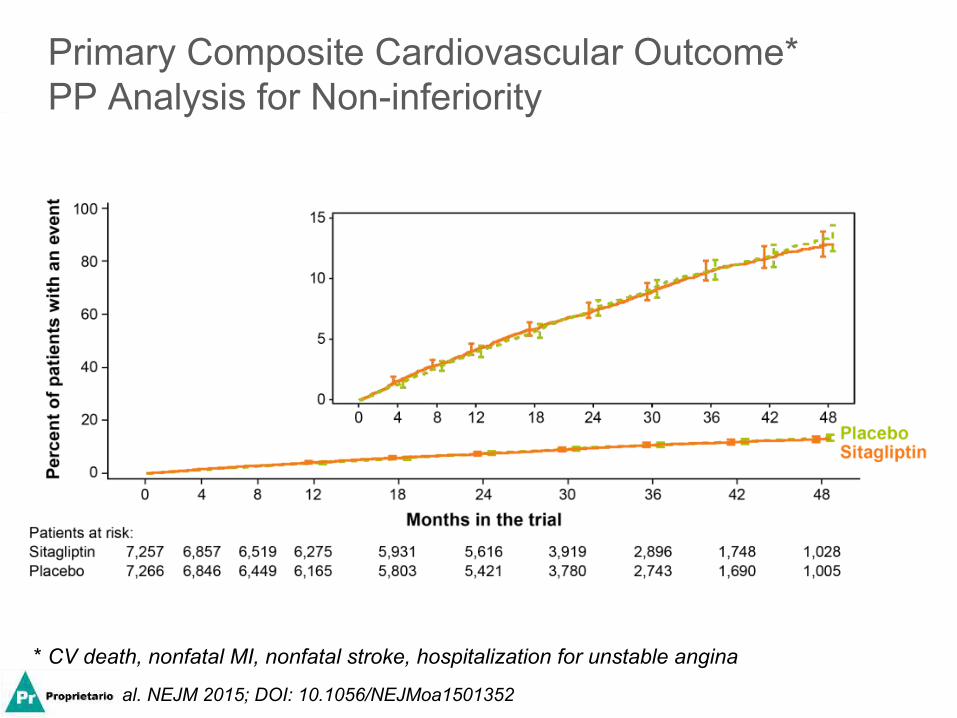
Primary Composite Cardiovascular Outcome* PP Analysis for Non-inferiority
* CV death, nonfatal MI, nonfatal stroke, hospitalization for unstable angina
Green JB et al. NEJM 2015; DOI: 10.1056/NEJMoa1501352

Alogliptin and MACE
Events, No. (%) Placebo: 316 (11.8)Alogliptin: 305 (11.3)
Cum
ulative Incide
nce of th
e Prim
ary En
d Po
int (%)
MonthsPlacebo (n): 2679 2299 1891 1375 805 286Alogliptin (n): 2701 2316 1899 1394 821 296
* Using alpha=0.01.
Hazard ratio, 0.96 (* one-sided repeated CI bound, 1.16)
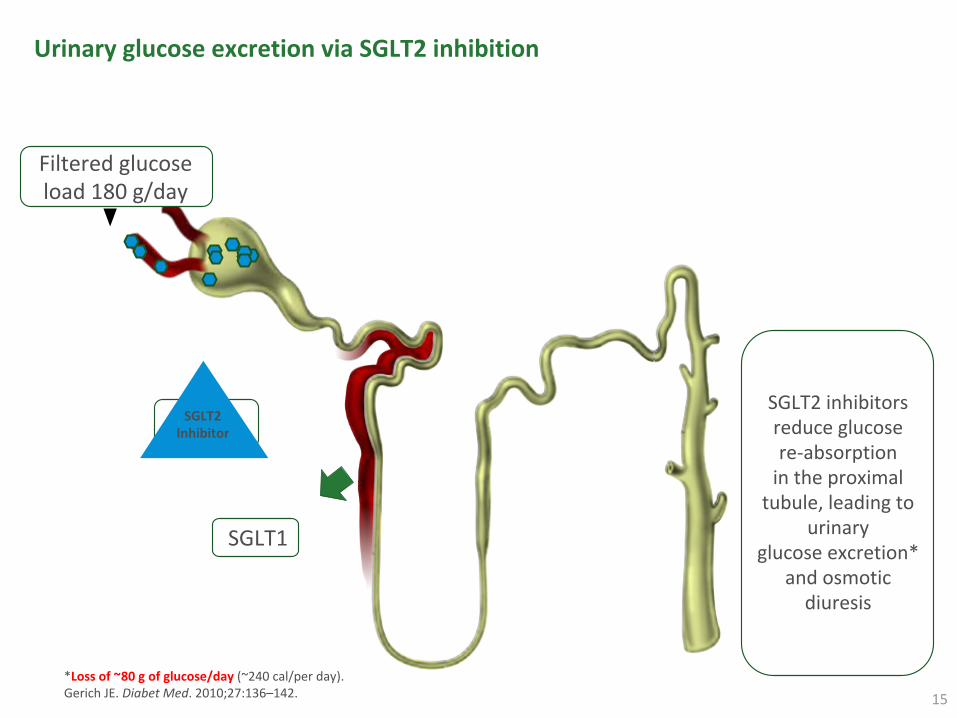
*Loss of ~80 g of glucose/day (~240 cal/per day).Gerich JE. Diabet Med. 2010;27:136–142.
Urinary glucose excretion via SGLT2 inhibition
SGLT2SGLT2Inhibitor
SGLT1
SGLT2 inhibitors reduce glucose re-absorption in the proximal
tubule, leading to urinary
glucose excretion* and osmotic diuresis
Filtered glucose load 180 g/day
15

Pooled data
Phase III pooled efficacy and cardiovascular risk factor analysisPlacebo-corrected change* from baseline in HbA1c
Pooled data from 4 pivotal Phase III trials
16
Adjusted
mean (SE) differen
ce versus p
lacebo
in change from
baseline in HbA
1c (%
) 0.00
-0.10
-0.20
-0.30
-0.40
-0.50
-0.60
-0.70
-0.80
-0.90
-1.00
-0.62
-0.74
-0.57-0.48
-0.64
-0,5
-0.52-0.68
-0.85
-0.64 -0.61 -0.59 -0,6-0.68
Pooled Monotherapy MET PIO MET+SUInsulin
78 week Mild RI
Empagliflozin 10 mg QD Empagliflozin 25 mg QD
Patients, n 831 821 224 224 217 213 165 168 225 216 169 155 98 97
BL HbA1c, % 7.98 7.96 7.87 7.86 7.94 7.86 8.07 8.06 8.07 8.10 8.27 8.27 8.02 8.01
BL, baseline; MET, metformin; PIO, pioglitazone; QD, once daily; RI, renal impairment; SE, standard error; SU, sulphonylurea.*All statistically significant unless otherwise marked. Hach T, et al., Häring H-U, et al., Rosenstock J, et al., Barnett A, et al. Diabetes. 2013;(Suppl 1) (P69-LB, P1092, P1102, P1104, respectively); Kovacs C, et al. Diabetes Obes Metab. 2013 Aug 1. doi: 10.1111/dom.12188; Häring H-U, et al. Diabetes Care. 2014. doi:10.2337/dc12-2673.Barnett A, et al. Lancet Diabetes Endocrinol. 2014 May;2(5):369-84. doi: 10.1016/S2213-8587(13)70208-0Rosenstock J, et al Poster: 931, 49th Annual Meeting of the European Association for the Study of Diabetes, 23–27 September 2013

Pooled data
Adjusted
mean (SE) differen
ce versus p
lacebo
in change from
baseline in SBP
(mmHg
) 0.00
-1.00
-2.00
-3.00
-4.00
-5.00
-6.00
-7.00
-3.40
-2.60
-4.10-3.86
-2.70
-4.20-3.57
-3.80-3.40
-4.80 -4.73
-2.10 -2.50
-5.12
BL, baseline ; MET, metformin; PIO, pioglitazone; QD, once daily; RI, renal impairment; SBP, systolic blood pressure; SE, standard error; SU, sulphonylurea. *All statistically significant unless otherwise marked. †Not statistically significant. Hach T, et al., Häring H-U, et al., Rosenstock J, et al., Barnett A, et al. Diabetes. 2013;(Suppl 1) (P69-LB, P1092, P1102, P1104, respectively); Kovacs C, et al. Diabetes Obes Metab. 2013 Aug 1. doi: 10.1111/dom.12188; Häring H-U, et al. Diabetes Care. 2014. doi:10.2337/dc12-2673.Barnett A, et al. Lancet Diabetes Endocrinol. 2014 May;2(5):369-84. doi: 10.1016/S2213-8587(13)70208-0Rosenstock J, et al Poster: 931, 49th Annual Meeting of the European Association for the Study of Diabetes, 23–27 September 2013
Phase III pooled efficacy and cardiovascular risk factor analysisPlacebo-corrected change* from baseline in SBP
Pooled data from 4 pivotal Phase III trials
18
Patients, n 831 821 224 224 217 213 165 168 225 216 169 155 98 97
BL SBP (mmHg) 129.6 129 133 129.9 129.6 130 126.5 125.9 128.7 129.3 132.4 132.8 137.4 133.7
Pooled Monotherapy MET PIO MET+SUInsulin
78 week Mild RI
†
Empagliflozin 10 mg QD Empagliflozin 25 mg QD

Pooled data
Adjusted
mean (SE) differen
ce versus p
lacebo
in change from
baseline in bod
y weight (kg)
0.00
-0.50
-1.00
-1.50
-2.00
-2.50
-3.00
-3.50
-1.80-1.93
-1.63
-1.95-1.76
-2.90
-1.43
-2.01-2.15
-2.01-1.81 -1.99
-2.80
-2.00
BL, baseline; BW, body weight; MET, metformin; PIO, pioglitazone; QD, once daily; RI, renal impairment; SE, standard error; SU, sulphonylurea.*All statistically significant unless otherwise marked. Hach T, et al., Häring H-U, et al., Rosenstock J, et al., Barnett A, et al. Diabetes. 2013;(Suppl 1) (P69-LB, P1092, P1102, P1104, respectively); Kovacs C, et al. Diabetes Obes Metab. 2013 Aug 1. doi: 10.1111/dom.12188; Häring H-U, et al. Diabetes Care. 2014. doi:10.2337/dc12-2673.Barnett A, et al. Lancet Diabetes Endocrinol. 2014 May;2(5):369-84. doi: 10.1016/S2213-8587(13)70208-0Rosenstock J, et al Poster: 931, 49th Annual Meeting of the European Association for the Study of Diabetes, 23–27 September 2013
Phase III pooled efficacy and cardiovascular risk factor analysisPlacebo-corrected change* from baseline in body weight
Pooled data from 4 pivotal Phase III trials
19
Patients, n 831 821 224 224 217 213 165 168 225 216 169 155 98 97
BL BW (kg) 78.77 79.10 78.35 77.80 81.59 82.21 77.97 78.93 77.1 77.5 91.6 94.7 92.05 88.06
Pooled Monotherapy MET PIO MET+SUInsulin
78 week Mild RI
Empagliflozin 10 mg QD Empagliflozin 25 mg QD

0
10
20
30
40
-10
-20
-30
-40
17.7
-22.3-30
-20
-10
0
10
20
3011.2
-11.0
CI, confidence interval; EMPA, empagliflozin; H2H, head-to-head; QD, once daily. *Dedicated sub-study using magnetic resonance imaging; patient participation was optional.Ridderstråle M, et al. Lancet Diabetes Endocrinol. 2014;2:691‒700.
104-week study with empagliflozin H2H versus glimepiride Change from baseline in visceral and subcutaneous fat at Week 104*
EMPA-REG
H2H-SU™Glimepiride
(n = 34)Empagliflozin
(n = 39)
Glimepiride EMPA 25 mg QD
Mean baseline (95% CI)
175.1(142.4, 207.9)
156.2(137.1, 175.3)
Glimepiride EMPA 25 mg QD
Mean baseline (95% CI)
339.5(297.9, 381.1)
346. (310.6, 381.3)
-22.2 cm3
(95% CI: -37.1, -7.4)p = 0.0039
-40.0 cm3
(95% CI: -58.9, -21.1)p < 0.0001
Mean (95%
CI) change from
baseline in
abdo
minal visc
eral adipo
se tissue
(cm
3 )
Mean (95%
CI) change from
baseline in
subcutaneo
us adipo
se tissue
(cm
3 )
Glimepiride (n = 34)
Empagliflozin(n = 39)
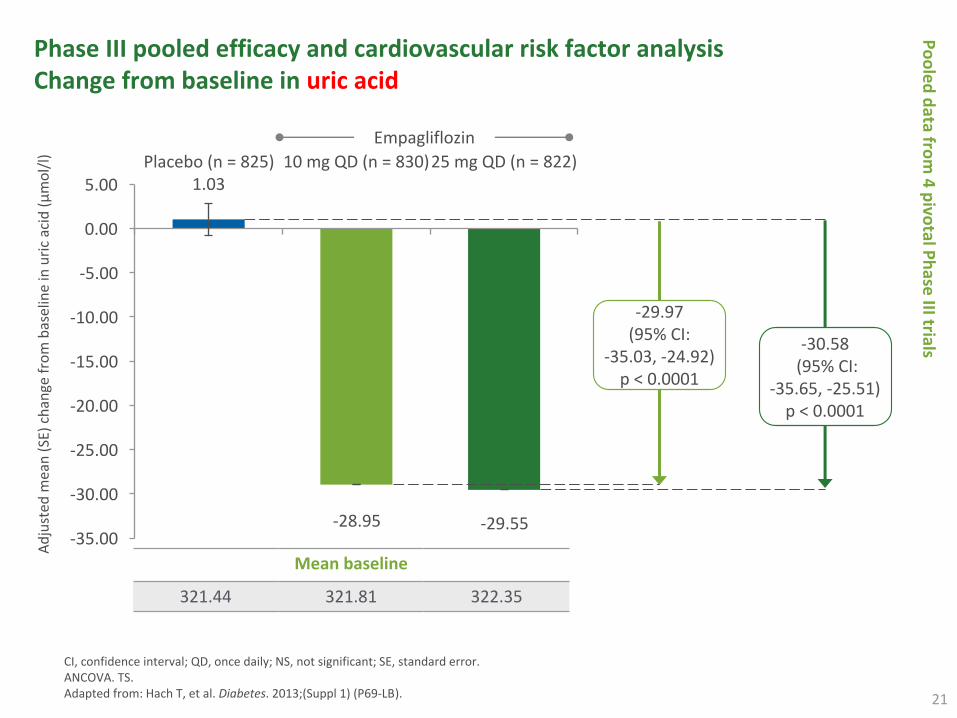
Adjusted
mean (SE) change from
baseline in uric acid (μmol/l) Placebo (n = 825) 10 mg QD (n = 830)25 mg QD (n = 822)
0.00
5.00
-5.00
-10.00
-15.00
-20.00
-25.00
-30.00
-35.00
1.03
-28.95 -29.55
Phase III pooled efficacy and cardiovascular risk factor analysisChange from baseline in uric acid
21
Pooled data from 4 pivotal Phase III trials
Mean baseline
321.44 321.81 322.35
-29.97(95% CI:
-35.03, -24.92)p < 0.0001
-30.58 (95% CI:
-35.65, -25.51)p < 0.0001
Empagliflozin
CI, confidence interval; QD, once daily; NS, not significant; SE, standard error.ANCOVA. TS.Adapted from: Hach T, et al. Diabetes. 2013;(Suppl 1) (P69-LB).

Primary Results of EMPA-REG OUTCOME®
Summary of primary results. Please refer to manuscript for full details
22
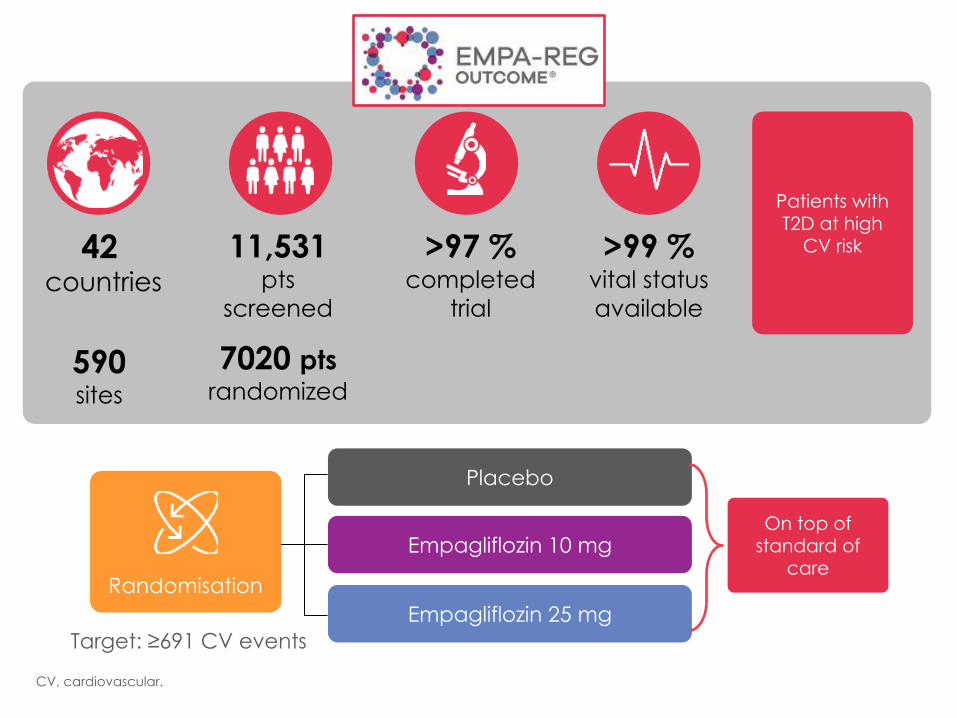
42countries
590sites
11,531 pts
screened
7020 pts randomized
>97 % completed
trial
>99 %vital status available
Randomisation
Empagliflozin 10 mg
Empagliflozin 25 mg Target: ≥691 CV events
Patients with T2D at high
CV risk
Placebo
On top of standard of
care
CV, cardiovascular.
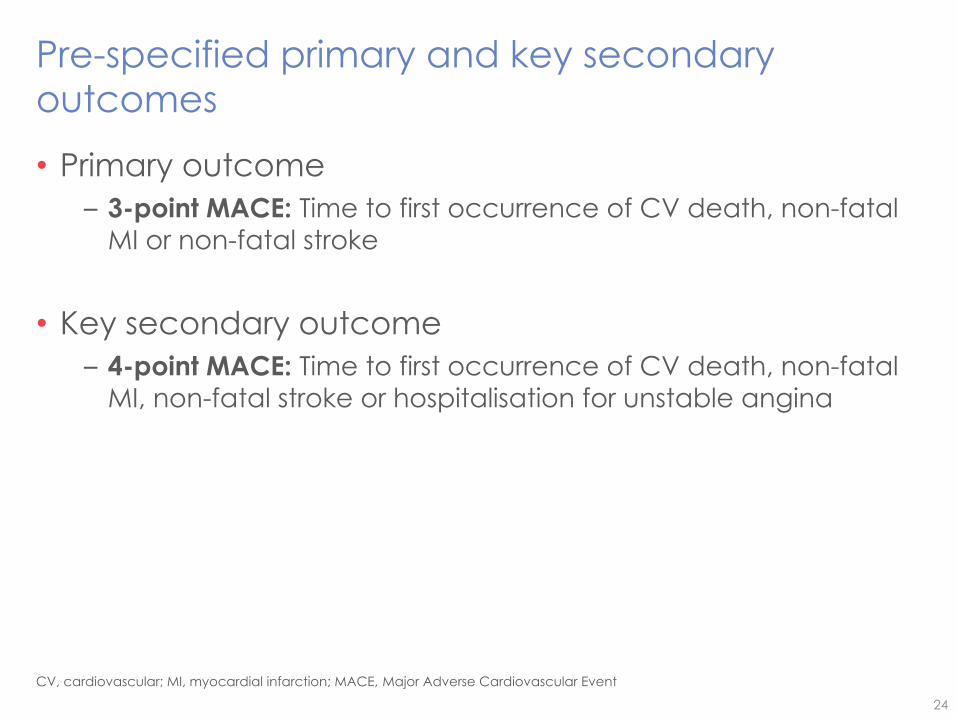
Pre-specified primary and key secondary outcomes
• Primary outcome– 3-point MACE: Time to first occurrence of CV death, non-fatal
MI or non-fatal stroke
• Key secondary outcome– 4-point MACE: Time to first occurrence of CV death, non-fatal
MI, non-fatal stroke or hospitalisation for unstable angina
24
CV, cardiovascular; MI, myocardial infarction; MACE, Major Adverse Cardiovascular Event

Baseline characteristics: CV complicationsPlacebo (n=2333)
Empagliflozin 10 mg
(n=2345)
Empagliflozin 25 mg
(n=2342)Any CV risk factor 2307 (98.9%) 2333 (99.5%) 2324 (99.2%)
Coronary artery disease 1763 (75.6%) 1782 (76.0%) 1763 (75.3%)Multi-vessel coronary artery disease
1100 (47.1%) 1078 (46.0%) 1101 (47.0%)
History of MI 1083 (46.4%) 1107 (47.2%) 1083 (46.2%)Coronary artery bypass graft 563 (24.1%) 594 (25.3%) 581 (24.8%)History of stroke 553 (23.7%) 535 (22.8%) 549 (23.4%)Peripheral artery disease 479 (20.5%) 465 (19.8%) 517 (22.1%)Single vessel coronary artery disease
238 (10.2%) 258 (11.0%) 240 (10.2%)
Cardiac failure* 244 (10.5%) 240 (10.2%) 222 (9.5%)Data are n (%) in patients treated with ≥1 dose of study drug
28
*Based on narrow standardised MedDRA query “cardiac failure”

Cardiovascular outcomes
32

Cardiovascular outcomes
33
-14% -38%
-35%-32%

Safety and tolerability
34

EMPA-REG OUTCOME®: conclusions
• Empagliflozin reduced risk for 3-point MACE by 14%
• Empagliflozin reduced hospitalisation for heart failure by 35%
• Empagliflozin reduced CV death by 38%
• Empagliflozin improved survival by reducing all-cause mortality by 32%
35
CV, cardiovascular

EMPA-REG OUTCOME®: Summary
• Empagliflozin was associated with a reduction in HbA1c without an increase in hypoglycaemia, reductions in weight and blood pressure, and small increases in LDL cholesterol and HDL cholesterol
• Empagliflozin was associated with an increase in genital infections but was otherwise well tolerated
36
MACE, Major Adverse Cardiovascular Event; HDL, high density lipoprotein; LDL, low density lipoprotein

Number needed to treat (NNT) to prevent one death across landmark trials in patients with high CV risk
37
1. 4S investigator. Lancet 1994; 344: 1383-89, http://www.trialresultscenter.org/study2590-4S.htm; 2. HOPE investigator N Engl J Med 2000;342:145-53, http://www.trialresultscenter.org/study2606-HOPE.htm
Simvastatin1
for 5.4 years
30High CV risk
5% diabetes, 26% hypertension
1994 2000 2015
Pre-statin era
56 High CV risk
38% diabetes, 46% hypertension
Ramipril2for 5 years
Pre-ACEi/ARB era
<29% statin
Empagliflozin for 3 years
39T2DM with high CV risk
92% hypertension
>80% ACEi/ARB
>75% statin
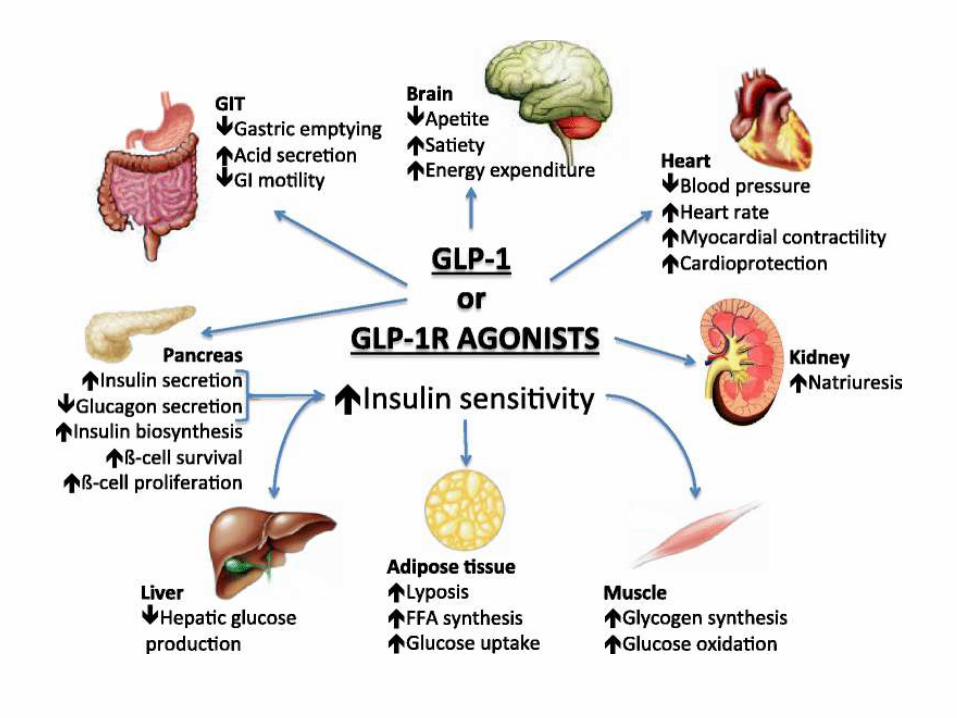
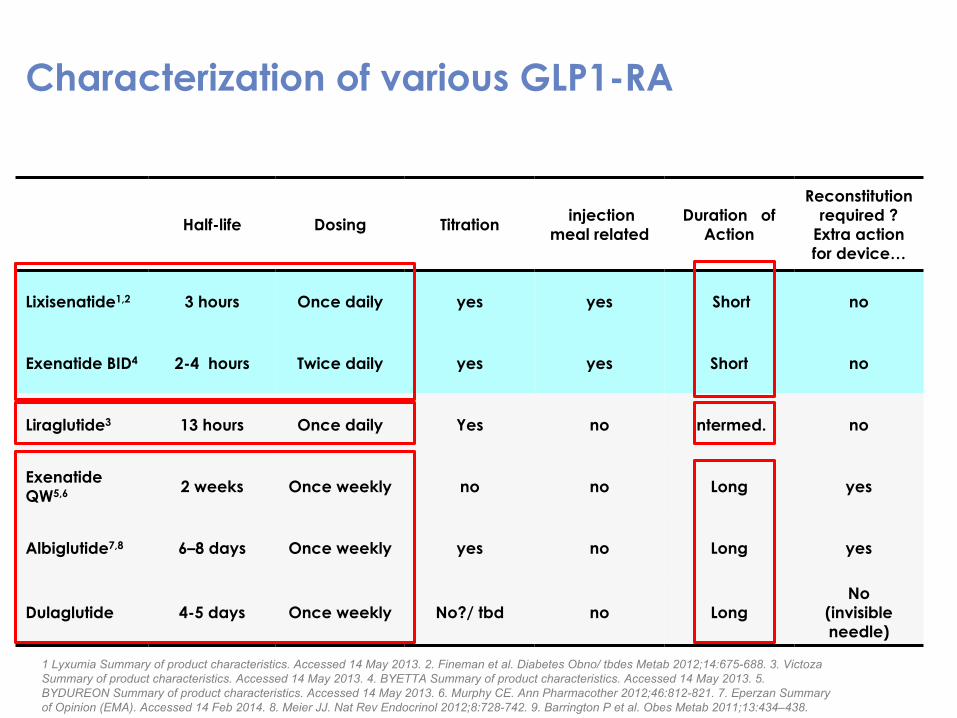
Characterization of various GLP1-RA
Half-life Dosing Titration injection meal related
Duration of Action
Reconstitution required ?
Extra action for device…
Lixisenatide1,2 3 hours Once daily yes yes Short no
Exenatide BID4 2-4 hours Twice daily yes yes Short no
Liraglutide3 13 hours Once daily Yes no Intermed. no
Exenatide QW5,6 2 weeks Once weekly no no Long yes
Albiglutide7,8 6–8 days Once weekly yes no Long yes
Dulaglutide 4-5 days Once weekly No?/ tbd no LongNo
(invisible needle)
1 Lyxumia Summary of product characteristics. Accessed 14 May 2013. 2. Fineman et al. Diabetes Obno/ tbdes Metab 2012;14:675-688. 3. Victoza Summary of product characteristics. Accessed 14 May 2013. 4. BYETTA Summary of product characteristics. Accessed 14 May 2013. 5. BYDUREON Summary of product characteristics. Accessed 14 May 2013. 6. Murphy CE. Ann Pharmacother 2012;46:812-821. 7. Eperzan Summary of Opinion (EMA). Accessed 14 Feb 2014. 8. Meier JJ. Nat Rev Endocrinol 2012;8:728-742. 9. Barrington P et al. Obes Metab 2011;13:434–438.
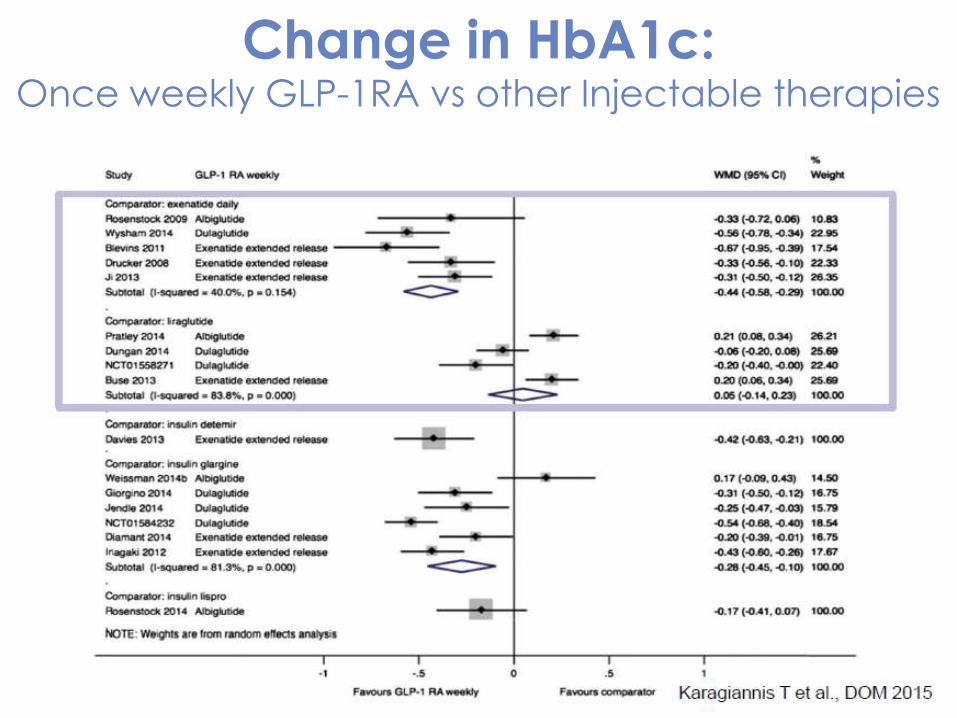
Change in HbA1c:Once weekly GLP-1RA vs other Injectable therapies

LEADER: Study design
CV, cardiovascular; HbA1c, glycosylated haemoglobin; OAD, oral antidiabetic drug; OD, once daily; T2DM, type 2 diabetes mellitus.Marso SP et al. N Engl J Med 2016. DOI: 10.1056/NEJMoa1603827.
Liraglutide 0.6–1.8 mg OD + standard of care
Placebo + standard of care
Duration 3.5–5 years
9340 patients• Double blinded• 2-week placebo run-in
Randomisation (1:1)
End of treatment
Key exclusion criteria• T1DM• Use of GLP-1RAs, DPP-4i, pramlintide, or rapid-acting
insulin• Familial or personal history of MEN-2 or MTC
Key inclusion criteria• T2DM, HbA1c ≥7.0%• Antidiabetic drug naïve; OADs and/or basal/premix insulin• Age ≥50 years and established CV disease or chronic renal
failure or
• Age ≥60 years and risk factors for CV disease
Placebo run-in
Safety follow-up
Safety follow-up
30 days2 weeks
Screening

CV death
4668
4672
4641
4648
4599
4601
4558
4546
4505
4479
4445
4407
4382
4338
4322
4267
1723
1709
484
465
HR=0.7895% CI (0.66 ; 0.93)
p=0.007
Patients at risk
Liraglutide
Placebo
Pat
ien
ts w
ith
an
eve
nt
(%)
Time from randomisation (months)
The cumulative incidences were estimated with the use of the Kaplan–Meier method, and the hazard ratios with the use of the Cox proportional-hazard regression model. The data analyses are truncated at 54 months, because less than 10% of the patients had an observation time beyond 54 months. CI, confidence interval; CV, cardiovascular; HR, hazard ratio.Marso SP et al. N Engl J Med 2016. DOI: 10.1056/NEJMoa1603827.

Non-fatal myocardial infarction
4668
4672
4609
4613
4531
4513
4454
4407
4359
4301
4263
4202
4181
4103
4102
4020
1619
1594
440
424
HR=0.8895% CI (0.75 ; 1.03)
p=0.11
Patients at risk
Liraglutide
Placebo
Pat
ien
ts w
ith
an
eve
nt
(%)
Time from randomisation (months)
The cumulative incidences were estimated with the use of the Kaplan–Meier method, and the hazard ratios with the use of the Cox proportional-hazard regression model. The data analyses are truncated at 54 months, because less than 10% of the patients had an observation time beyond 54 months. CI, confidence interval; HR, hazard ratio.Marso SP et al. N Engl J Med 2016. DOI: 10.1056/NEJMoa1603827.

Non-fatal stroke
4668
4672
4624
4622
4564
4558
4504
4484
4426
4405
4351
4314
4269
4228
4194
4141
1662
1648
465
445
HR=0.8995% CI (0.72 ; 1.11)
p=0.30
Patients at risk
Liraglutide
Placebo
Pat
ien
ts w
ith
an
eve
nt
(%)
Time from randomisation (months)
The cumulative incidences were estimated with the use of the Kaplan–Meier method, and the hazard ratios with the use of the Cox proportional-hazard regression model. The data analyses are truncated at 54 months, because less than 10% of the patients had an observation time beyond 54 months. CI, confidence interval; HR, hazard ratio.Marso SP et al. N Engl J Med 2016. DOI: 10.1056/NEJMoa1603827.

Expanded MACEAll-cause death
Hospitalisation for HF

Expanded MACECV death, non-fatal MI, non-fatal stroke, coronary revascularisation, or hospitalisation for unstable angina pectoris or heart failure
Patients at risk
Liraglutide
Placebo
4668
4672
4515
4506
4356
4336
4221
4157
4063
4002
3914
3857
3793
3697
3682
3581
1452
1410
395
366
HR=0.8895% CI (0.81 ; 0.96)
p=0.005
Pat
ien
ts w
ith
an
eve
nt
(%)
Time from randomisation (months)
The cumulative incidences were estimated with the use of the Kaplan–Meier method, and the hazard ratios with the use of the Cox proportional-hazard regression model. The data analyses are truncated at 54 months, because less than 10% of the patients had an observation time beyond 54 months. CI, confidence interval; HR, hazard ratio; MACE, major adverse cardiovascular event.Marso SP et al. N Engl J Med 2016. DOI: 10.1056/NEJMoa1603827.

All-cause death
4668
4672
4641
4648
4599
4601
4558
4546
4505
4479
4445
4407
4382
4338
4322
4268
1723
1709
484
465
Patients at risk
Liraglutide
Placebo
Pat
ien
ts w
ith
an
eve
nt
(%)
Time from randomisation (months)
The cumulative incidences were estimated with the use of the Kaplan–Meier method, and the hazard ratios with the use of the Cox proportional-hazard regression model. The data analyses are truncated at 54 months, because less than 10% of the patients had an observation time beyond 54 months. CI, confidence interval; HR, hazard ratio.Marso SP et al. N Engl J Med 2016. DOI: 10.1056/NEJMoa1603827.
HR=0.8595% CI (0.74 ; 0.97)
p=0.02
0 6 12 18 24 30 36 42 48 540
5
10
15
20

Hospitalisation for heart failure
4668
4672
4612
4612
4550
4540
4483
4464
4414
4372
4337
4288
4258
4187
4185
4107
1662
1647
467
442
HR=0.8795% CI (0.73 ; 1.05)
p=0.14
Patients at risk
Liraglutide
Placebo
Pat
ien
ts w
ith
an
eve
nt
(%)
Time from randomisation (months)
The cumulative incidences were estimated with the use of the Kaplan–Meier method, and the hazard ratios with the use of the Cox proportional-hazard regression model. The data analyses are truncated at 54 months, because less than 10% of the patients had an observation time beyond 54 months. CI, confidence interval; HR, hazard ratio.Marso SP et al. N Engl J Med 2016. DOI: 10.1056/NEJMoa1603827.

Conclusion
In patients with type 2 diabetes at high risk of cardiovascular events on standard therapy,
liraglutide- as compared to placebo-treated patients had lower rates of cardiovascular events
and all-cause death
Marso SP et al. N Engl J Med 2016. DOI: 10.1056/NEJMoa1603827.

ADA/EASD
pos
ition
statemen
t 2012
Towards
the pe
rson
alization of glycaem
ic ta
rgets
Inzucchi S. et al, Diabetes Care. Vol 35 (2012)
50
Top Related