


Languages
Pages
Legal


Moisture-related failures of operational amplifiers in plastic
packages
Moisture-related failures of operational amplifiers in plastic
packages
A. Teverovsky, F. FeltParts, Packaging, and Assembly Technologies Office,
Code 562, GSFC/ QSS Group, Inc.

M&A COTS’042
Purpose Purpose
To review statistics of HAST failures in linear devices encapsulated in plastics.To estimate the acceleration factor and mechanism of failures.To discuss results of environmental stress testing and the risk for space applications.
M&A COTS’043
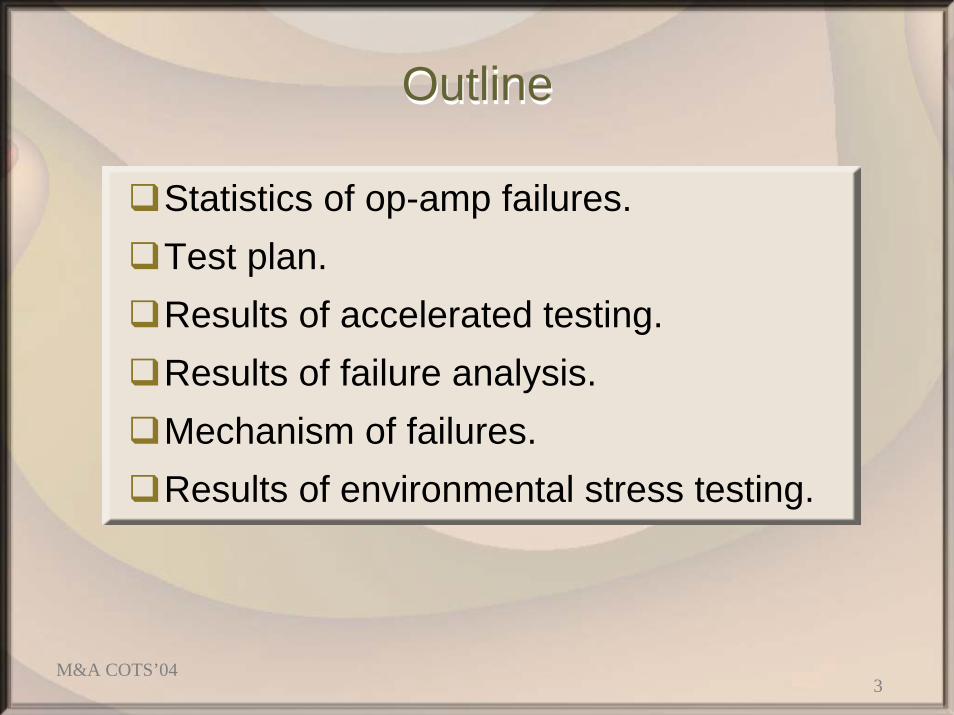
OutlineOutline
Statistics of op-amp failures.Test plan. Results of accelerated testing.Results of failure analysis.Mechanism of failures.Results of environmental stress testing.

M&A COTS’044
HAST test conditionsHAST test conditions
Preconditioning per JESD22 – A113-B: moisture soak for 168 H @ +85C/85%RH, 3 cycles of solder reflow at @ + 220C, flux immersion for 10 sec, rinsing in deionized water.
HAST conditions: T = 130 oC, RH = 85 %, t = 250 hrs, electrical bias.
Sample size: each lot 30 samples.

M&A COTS’045
SMT simulation and HAST resultsSMT simulation and HAST results
Part Type Pack DC SMT HAST Comm.
OP1 Instr. SOIC8 0030, 0110 1/30, 0/30
30/30, 27/30 Param. failures
OP2 Quad SOIC16 0101 16/30 2/30 SMT: IOS and AOL HAST: init.+1 new
OP3 Instr. SOIC8 0022, 9628 0/16, 0/16 0/16, 0/16
OP4 Bandw SOIC8 0018 0/30 0/30
OP5 Bandw SOIC8 0041 0/30 0/30
OP6 Dual SOIC8 0033, 0109, 9946
0/30, 0/30, 0/30
0/30, 0/30, 1/30
Possibly reverse installation
OP7 Precis. SOIC8 0019, 0021, 0029
0/30, 0/30, 0/30
0/30, 0/30, 0/30
OP8 Quad SOIC16 9945 2/30 0/28
M&A COTS’046
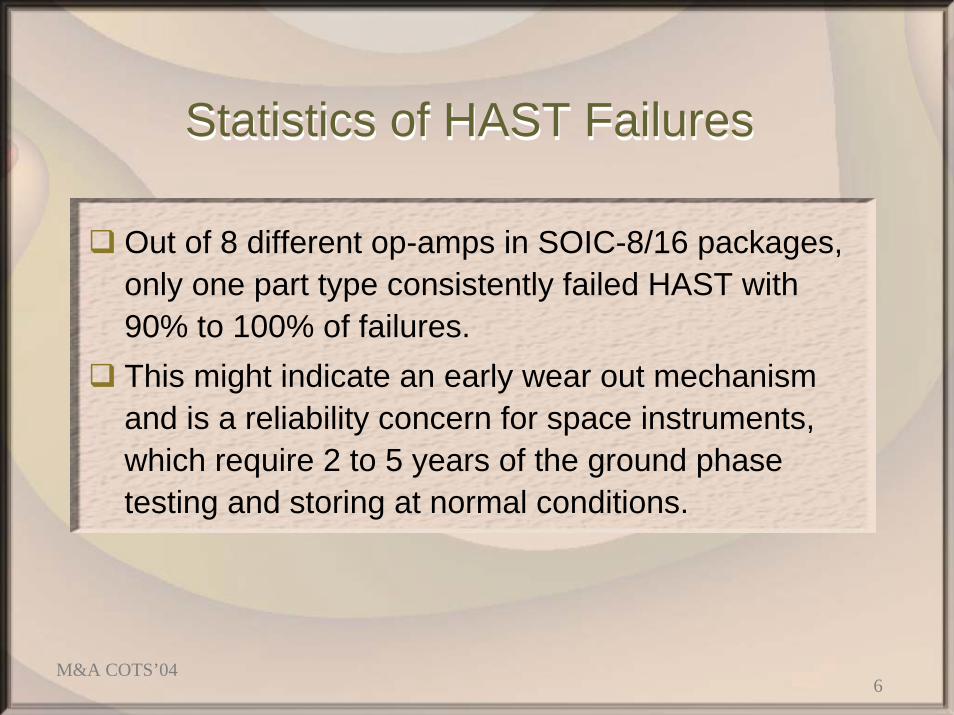
Statistics of HAST FailuresStatistics of HAST Failures
Out of 8 different op-amps in SOIC-8/16 packages, only one part type consistently failed HAST with 90% to 100% of failures.This might indicate an early wear out mechanism and is a reliability concern for space instruments, which require 2 to 5 years of the ground phase testing and storing at normal conditions.

M&A COTS’047
Test PlanTest PlanTwo groups of op-amps were tested under bias and without bias at three temperatures and 85% RH for up to 800 hrs.After HAST the parts, which were tested without bias, were biased at RT for up to 1300 hrs.Characteristics were measured periodically through the testing.
HAST bias schematic

M&A COTS’048
Test Results at 130 oC HASTTest Results at 130 oC HAST
0.3
0.35
0.4
0.45
0.5
0.55
init 96 hr125 C
50 hr 150hr
250hr
350hr
IPS,
mA
0.3
0.35
0.4
0.45
0.5
0.55
init 96 hr125 C
50 hr 150hr
250hr
350hr
IPS,
mA
unbiased
biased
Power supply current Offset voltage
-300-200-100
0100200300
init 96 hr125 C
50 hr 150hr
250hr
350hr
VOS,
uV
biased
-300-200-100
0100200300
init 96 hr125 C
50 hr 150 hr 250 hr 350 hr
VOS,
uV
unbiased

M&A COTS’049
Test Results at 130 oC HAST, Cont’dTest Results at 130 oC HAST, Cont’dNo failures and/or parametric shifts for unbiased parts.
Drop of IPS coincided with decrease of IOS.
Similar degradation in IPS and IOS was observed during HAST at 110 and 150 oC.
Failure condition: 10% decrease in IPS.
101112131415
init 96 hr125 C
50 hr 150hr
250hr
350hr
IOSP
, nA
101112131415
init 96 hr125 C
50 hr 150hr
250hr
350hr
IOSP
, nA
unbiased
biased
Input leakage current

M&A COTS’0410
Distribution of Biased HAST FailuresDistribution of Biased HAST FailuresFailures during biased HAST
0
20
40
60
80
100
0 200 400 600 800 1000
time, hr
failu
res,
%
130 C
150 C
110 C
Arrhenius plot of median life
10
100
1000
2.3 2.35 2.4 2.45 2.5 2.55 2.6 2.65
1000/T, 1/K
med
ian
time,
hr
Ea = 0.59 eV
HAST per JESD22-A110B, 130 oC/96hrs, might not reveal these failures.Ea is lower than in Peck-Hallberg model (0.79 -1.1 eV).This increases the probability of failures at low T.

M&A COTS’0411
Arrhenius-Weibull modelArrhenius-Weibull model
10.00
1.00E+5
100.00
1000.00
10000.00
450.00300.00 330.00 360.00 390.00 420.00
Life time prediction at 85% RH
temperature, K
time,
hr
2.2 years Ea = 0.59 eV
HAST at 85% RHT = 110, 130, and 150 deg.C
1% failures

M&A COTS’0412
Life Time Prediction for LT OperationLife Time Prediction for LT Operation
Based on Arrhenius-Weibull model, 1% of the parts operating at 85% RH at RT are expected to fail after ~2.2 years.
Based on Pecht- Hallberg model (1<n<5), the proportion of failuresat 50% RH would be 0.6 to 0.07%.
Due to the capillary effect, a weak dependence of failures on relative humidity is possible.
⎟⎠⎞⎜
⎝⎛= −
kTERHAt an
f exp)(
M&A COTS’0413
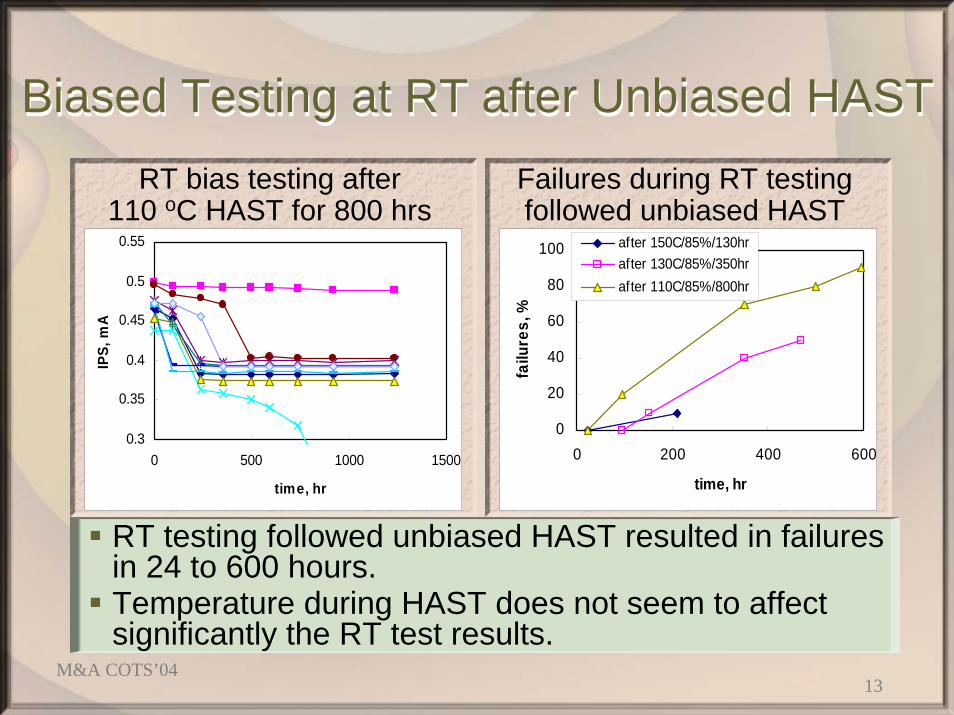
Biased Testing at RT after Unbiased HASTBiased Testing at RT after Unbiased HASTRT bias testing after
110 oC HAST for 800 hrs
0.3
0.35
0.4
0.45
0.5
0.55
0 500 1000 1500
time, hr
IPS,
mA
Failures during RT testing followed unbiased HAST
0
20
40
60
80
100
0 200 400 600
time, hr
failu
res,
%
after 150C/85%/130hr after 130C/85%/350hr after 110C/85%/800hr
RT testing followed unbiased HAST resulted in failures in 24 to 600 hours.Temperature during HAST does not seem to affect significantly the RT test results.

M&A COTS’0414
Analysis of Failed PartsAnalysis of Failed PartsFA result: corrosion of thin film resistors
Most failures during biased HAST exhibited a missing section of a chromium thin-film resistor.

M&A COTS’0415
Analysis of Failed Parts, Cont’dAnalysis of Failed Parts, Cont’d
All failures had damage to the first stripe (+bias) close to marking numbers in 1 MΩ Cr/Si resistors.In some cases missing sections of resistors were associated with cracks in passivation.
A dark-field view insert shows SEM view insert shows a rupture of the glassivation. a crack in the glassivation

M&A COTS’0416
Analysis of Failed Parts, Cont’dAnalysis of Failed Parts, Cont’d
Biased HAST at 130C/85%,350hr Bias 150C/85%
A
B
In many cases no cracks in the glassivation were observed during SEM examination.In several cases resistors B also had missing portions on the side close to aluminum stripe.

M&A COTS’0417
Analysis of Failed Parts. RT Testing after Unbiased HAST
Analysis of Failed Parts. RT Testing after Unbiased HAST
Different samples after 470 hrs of RT bias followed unbiased HAST at 130C/85%/350 hr
RT testing of moisturized samples resulted in corrosion of Cr/Si resistors similar to HAST failures.

M&A COTS’0418
Analysis of Failed Parts, Cont’d IIAnalysis of Failed Parts, Cont’d II
FIB trench of the failed part at the cracking glassivation
Locations of crack and missing section of resistor do not coincide.Voiding in nitride/oxide might contribute to the failures.

M&A COTS’0419
Limiting Factors of DegradationLimiting Factors of Degradation
MOISTURE
+V
Si
SiO2 ISiO2 II
Si3N4Al
molding compound
Cr resistor
D1
D2
Ionic current
Corrosion
Failures were due to both the presence of moisture and applied bias, thus indicating anodic corrosion.Possible limiting factors for corrosion failures:
Diffusion through MC;Galvanic process;Diffusion through Si3N4/SiO2

M&A COTS’0420
Limiting Factor I: Moisture Diffusion through Plastic Package
Limiting Factor I: Moisture Diffusion through Plastic Package
180 140 120 100 80 60 40 20 T, oC
1.E-14
1.E-13
1.E-12
1.E-11
1.E-10
1.E-09
2 2.2 2.4 2.6 2.8 3 3.2 3.4 3.6 3.8
reciprocal temperature, 1000/K
D, m
2 /s
13456778HCEMEpoliset
U = 0.43 eV
)/exp( kTUDD o −=
Characteristics of different MCs Time to moisture saturation [C(0)/Co = 99%] in MC:
h = 0.5 mm is the thickness of MC above the die.
Temp, oC τ, hr150 2.3130 4.2110 8.225 380.4
122 )]([12)( −×××= TDhT πτ
Moisture diffusion through plastic does not limit HAST failures.At RT package can keep moisture for ~2 weeks only.

M&A COTS’0421
Limiting Factor II: Anodic Corrosion of Cr/Si Resistor
Limiting Factor II: Anodic Corrosion of Cr/Si Resistor
Time to corrosion failure at RT According to Faraday’s law, the time necessary to remove a portion of the resistor of a volume ∆V, 50X10X0.005µm:
IAFnV×××
××∆=
ηρτ
1.E+00
1.E+01
1.E+02
1.E+03
1.E+04
1.E+05
1.E+06
1.E+07
1.E+08
1.E-16 1.E-15 1.E-14 1.E-13 1.E-12 1.E-11 1.E-10 1.E-09
leakage current, A
time,
hr
FE= 1%
FE= 10%experim min
experim max
Possible range of I
At Ea ~0.5 eV, increase in T to 110 – 150 oC would increase conductance in 90 to 400 times.
At RT failures might be caused by moisture-induced Ileak in the picoamp range during 10X to 100X hrs.At HT (110 to 150 oC) this time is reduced to hours, so the galvanic process is not a limiting factor of failures.

M&A COTS’0422
Limiting Factor III: Moisture Diffusion through Si3N4 passivation and CVD SiO2
Limiting Factor III: Moisture Diffusion through Si3N4 passivation and CVD SiO2
Literature data on moisture diffusion in silica-based
materials
Time for moisture diffusion through Si3N4 and SiO2.
τ = h2/D(T), h = 1 µm
0.1
1
10
100
1000
10000
100000
1000000
0.0022 0.0024 0.0026 0.0028 0.003 0.0032 0.0034
1/T, 1/Ktim
e, h
r CVD
Nitride
150C 130C 110C
1E-20
1E-18
1E-16
1E-14
1E-12
1E-10
0.0022 0.0024 0.0026 0.0028 0.003 0.0032 0.0034
1/T, 1/K
D, c
m2 /s
vitreous silica CVD PSGLPCVD SiO2 Plasma nitrideoxinitride CVD PSG Tquartz APCVD
At 110<T<150 oC diffusion through CVD SiO2 takes < 10hrs.From 100 to 10,000 hrs is necessary to penetrate through the layer of nitride passivation.

M&A COTS’0423
Failure MechanismFailure MechanismNormally, Si3N4 layers are impermeable to moisture and time-to-HAST failure >1000 hrs. Missing portions of resistors were mostly observed on stripes close to Al metallization.Unevenness of the structure, excessive contamination and/or mechanical stresses in areas close to Al stripes possibly resulted in defects in Si3N4.
MOISTURE
+V
Si
SiO2 ISiO2 II
Si3N4Al
molding compound
Cr resistor
Ionic current
defective area
Microcracks or micropores in defective areas of passivationenhance moisture diffusion and activate galvanic current in the underlying SiO2 I layer causing corrosion of Cr/Si resistors.

M&A COTS’0424
Evaluation of Risks for Space Applications, HTSL.
Evaluation of Risks for Space Applications, HTSL.
10.00 10000.00100.00 1000.00
1.00
5.00
10.00
50.00
90.00
99.00
time, hr
cum
ulat
ive
failu
res,
%
175C
190C
200C
Parametric failures (VOS) during HTSL at 175, 190, and 200 oC.
Moisture released during HT aging of MC could have caused corrosion failures at T>>130 oC.FA: failures were not related to corrosion.Median life Ea ~1.05 eV. Assuming Weibulldistribution for 150 oC at β = 7.7 and η = 29,653 hr, the time to 1% failure is ~1.9 years.
No risk for the mission during long-term storage.
M&A COTS’0425
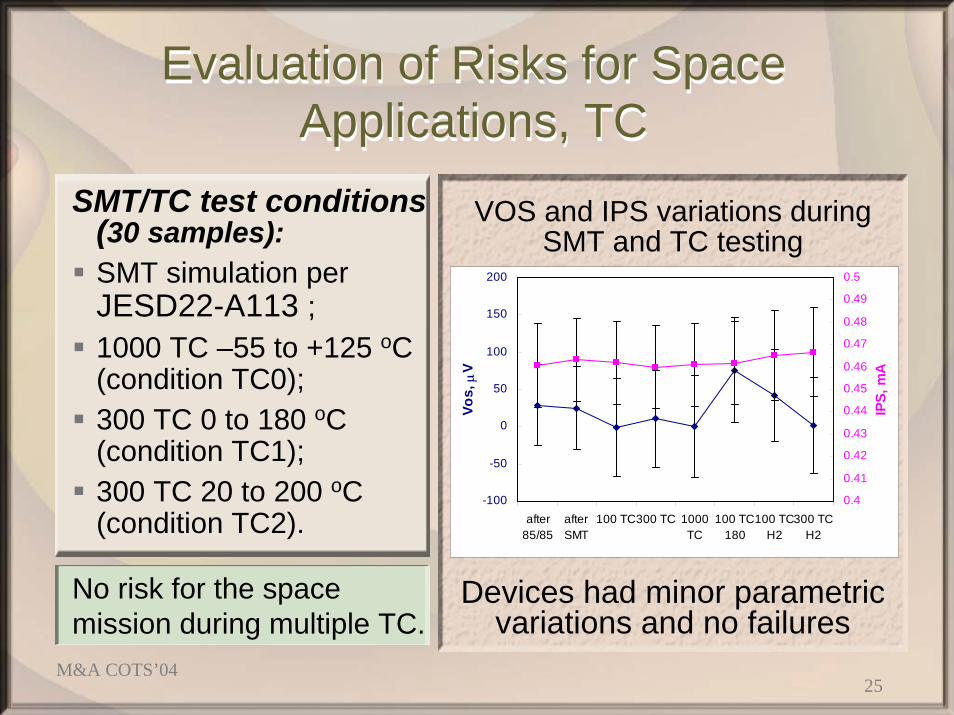
Evaluation of Risks for Space Applications, TC
Evaluation of Risks for Space Applications, TC
SMT/TC test conditions (30 samples):SMT simulation per JESD22-A113 ;1000 TC –55 to +125 oC(condition TC0);300 TC 0 to 180 oC(condition TC1);300 TC 20 to 200 oC(condition TC2).
Devices had minor parametric variations and no failures
VOS and IPS variations during SMT and TC testing
-100
-50
0
50
100
150
200
after85/85
afterSMT
100 TC300 TC 1000TC
100 TC180
100 TCH2
300 TCH2
Vos,
µV
0.4
0.41
0.42
0.43
0.44
0.45
0.46
0.47
0.48
0.49
0.5
IPS,
mA
No risk for the space mission during multiple TC.
M&A COTS’0426
ConclusionConclusionWearout failures of instrumental op-amps during HAST were due to corrosion of thin film Cr/Si resistors.Unbiased HAST did not cause failures; however, post-HAST testing under bias at RT resulted in failures similar to biased HAST.The activation energy of failures is 0.59 eV. Arrhenius-Weibull model predicts 1% failures for the parts operating at RT and 85% RH after ~2.2 years.The limiting factor in corrosion failure is moisture diffusion through microscopic defects in passivationlayers.A combination of unbiased HAST with RT bias testing might be a good alternative to biased HAST for QA of parts intended for space applications.
Top Related