


Languages
Pages
Legal


Modeling Health Insurance
Coverage Estimates for
Minnesota Counties
Joint Statistical Meetings
Miami Beach, Florida
August 1, 2011
Joanna Turner and Peter Graven
State Health Access Data Assistance Center
(SHADAC)
University of Minnesota, School of Public Health
Supported by a grant from The Robert Wood Johnson Foundation

www.shadac.org
Acknowledgements
• Thanks to the Minnesota Department of
Health, Health Economics Program for their
support of this work
• www.health.state.mn.us/healtheconomics
2

www.shadac.org3
Outline
• Background
• Research Objective
• Methodology
• Results

www.shadac.org
Background
• Minnesota Health Access Survey (MNHA)
– Telephone survey conducted every 2 years
– Provides MN and regional estimates, including
estimates for select populous counties and cities
• County level estimates are frequently
requested data
4

www.shadac.org
U.S. Census Bureau County Level
Uninsurance Estimates
• American Community Survey (ACS)
– 1-year estimates: 12 Minnesota counties (Available)
– 3-year estimates: 47 Minnesota counties (Fall 2011)
– 5-year estimates: 87 Minnesota counties (Fall 2013)
• Small Area Health Insurance Estimates
Program (SAHIE)
– 2007 estimates (most recent year) for all 87
Minnesota counties
– Release of 2008 and 2009 estimates planned for
Fall 2011
5

www.shadac.org
Research Objective
Produce Minnesota uninsurance rates by
county for 2009
– Use the Minnesota Health Access Survey (MNHA)
– Use other sources of uninsurance estimates
– Include estimates of uncertainty
– Allow for future input sources
– Use methods accessible to Minnesota Department of
Health staff
– Use methods that can be applied to other states
6
www.shadac.org
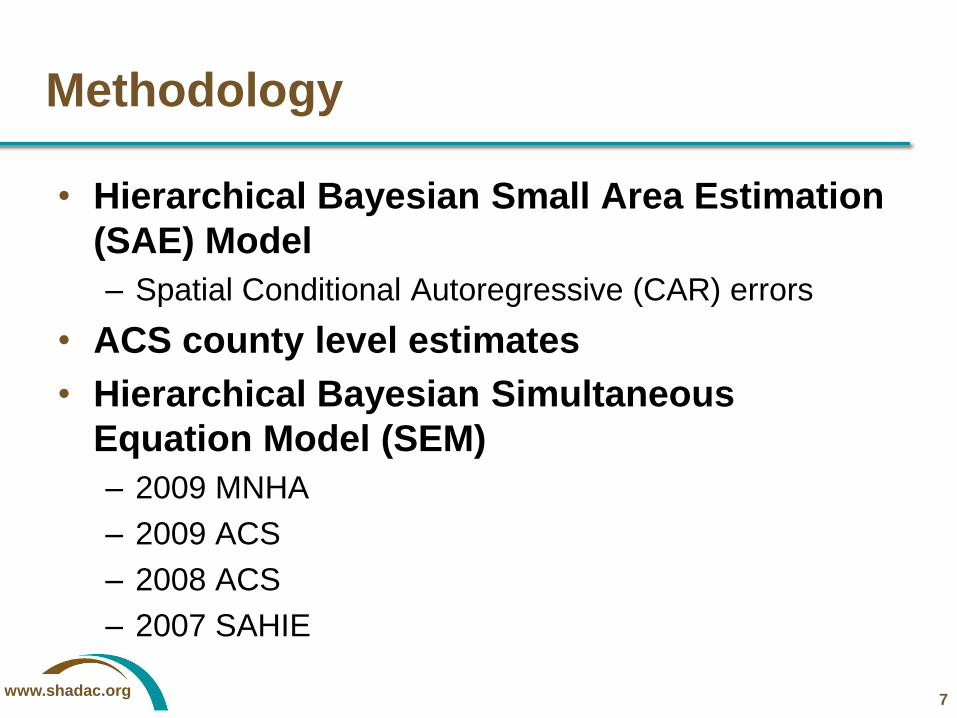
Methodology
• Hierarchical Bayesian Small Area Estimation
(SAE) Model
– Spatial Conditional Autoregressive (CAR) errors
• ACS county level estimates
• Hierarchical Bayesian Simultaneous
Equation Model (SEM)
– 2009 MNHA
– 2009 ACS
– 2008 ACS
– 2007 SAHIE
7

www.shadac.org
Methodology Overview
8
Simultaneous
Equation Model
2009 MNHA SAE
Estimates
2008, 2009 ACS
County Model
2008, 2009 ACS 1-
year estimates of
uninsurance
- PUMA level
PUMA-County
Crosswalk
2007 SAHIE
Estimates
2008, 2009 ACS
County Estimates
Final Results: 2009
MN County Estimates
of Uninsurance
2009 MNHA SAE
Model
Additional Data
Sources
– county level
2005-2009 ACS 5-
year estimates of
demographics
– county level
2009 MNHA direct
estimates of
uninsurance
– county level
www.shadac.org
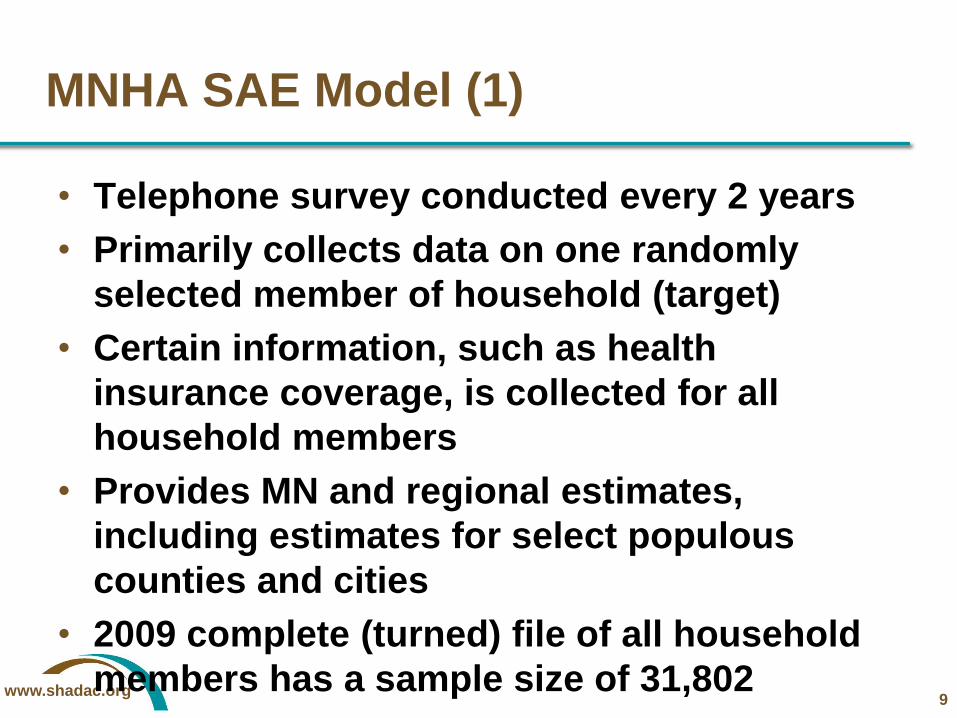
MNHA SAE Model (1)
• Telephone survey conducted every 2 years
• Primarily collects data on one randomly
selected member of household (target)
• Certain information, such as health
insurance coverage, is collected for all
household members
• Provides MN and regional estimates,
including estimates for select populous
counties and cities
• 2009 complete (turned) file of all household
members has a sample size of 31,802 9

www.shadac.org
MNHA SAE Model (2)
• Area-level spatial conditional autoregressive
(CAR) model
• Covariates X include ACS 5-year data,
Census Bureau population estimates, and
additional sources including administrative
records. For example:
– Quarterly Census of Employment and Wages
(QCEW)
– Local Area Unemployment Statistics (LAUS)
10

www.shadac.org
MNHA SAE Model (3)
• Variables predicting the direct estimate of
uninsurance in the MNHA survey:
– Immigration Rate, 2000-2009 (Population estimates)
– Percent Employed Working in Retail, 2009 (QCEW)
– Percent Moved into State, 2005-2009 (ACS)
– Weekly Wage, 2009 (QCEW)
– Percent White, 2005-2009 (ACS)
– Percent Land in Farms, 2007 (USDA)
– Percent 65 and Over, 2005-2009 (ACS)
– Average Unemployment Rate, 2009 (LAUS)
11

www.shadac.org
Methodology Overview – ACS
County
12
2009 MNHA SAE
Model
Simultaneous
Equation Model
2009 MNHA SAE
Estimates
2009 MNHA direct
estimates of
uninsurance
– county level
2005-2009 ACS 5-
year estimates of
demographics
– county level
Additional Data
Sources
– county level 2007 SAHIE
Estimates
2008, 2009 ACS
County Estimates
Final Results: 2009
MN County Estimates
of Uninsurance
2008, 2009 ACS 1-
year estimates of
uninsurance
- PUMA level
2008, 2009 ACS
County Model
PUMA-County
Crosswalk

13
Public Use Microdata Area (PUMA)

www.shadac.org
ACS County Model
• Two types of estimates
– County estimate exists in 1-year ACS (12 counties)
Estimate and SE used directly
– County is a subset of PUMA (75 counties)
Estimate from PUMA
SE is the PUMA estimate times the ratio of the PUMA
poverty SE divided by the county poverty SE
14
www.shadac.org
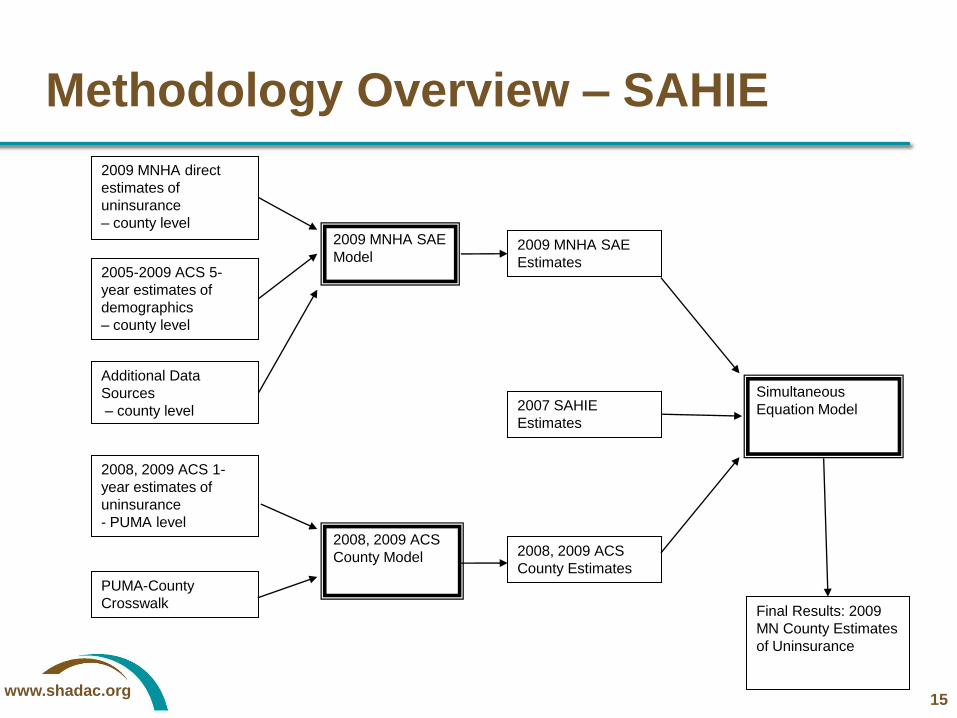
Methodology Overview – SAHIE
15
2009 MNHA SAE
Model
Simultaneous
Equation Model
2009 MNHA SAE
Estimates
2009 MNHA direct
estimates of
uninsurance
– county level
2005-2009 ACS 5-
year estimates of
demographics
– county level
Additional Data
Sources
– county level
2008, 2009 ACS
County Model
2008, 2009 ACS 1-
year estimates of
uninsurance
- PUMA level
PUMA-County
Crosswalk
2007 SAHIE
Estimates
2008, 2009 ACS
County Estimates
Final Results: 2009
MN County Estimates
of Uninsurance

www.shadac.org
SAHIE Estimates
• Census Bureau's Small Area Health
Insurance Estimates (SAHIE) program
produces model-based estimates of health
insurance coverage
– State estimates by age/sex/race/income categories
– County estimates by age/sex/income categories
• Estimates are for 0-64 so we need to make a
correction to use in our all ages model
16

www.shadac.org
Methodology Overview – SEM
Model
17
2009 MNHA SAE
Model
Simultaneous
Equation Model
2009 MNHA SAE
Estimates
2009 MNHA direct
estimates of
uninsurance
– county level
2005-2009 ACS 5-
year estimates of
demographics
– county level
Additional Data
Sources
– county level
2008, 2009 ACS
County Model
2008, 2009 ACS 1-
year estimates of
uninsurance
- PUMA level
PUMA-County
Crosswalk
2007 SAHIE
Estimates
2008, 2009 ACS
County Estimates
Final Results: 2009
MN County Estimates
of Uninsurance
www.shadac.org
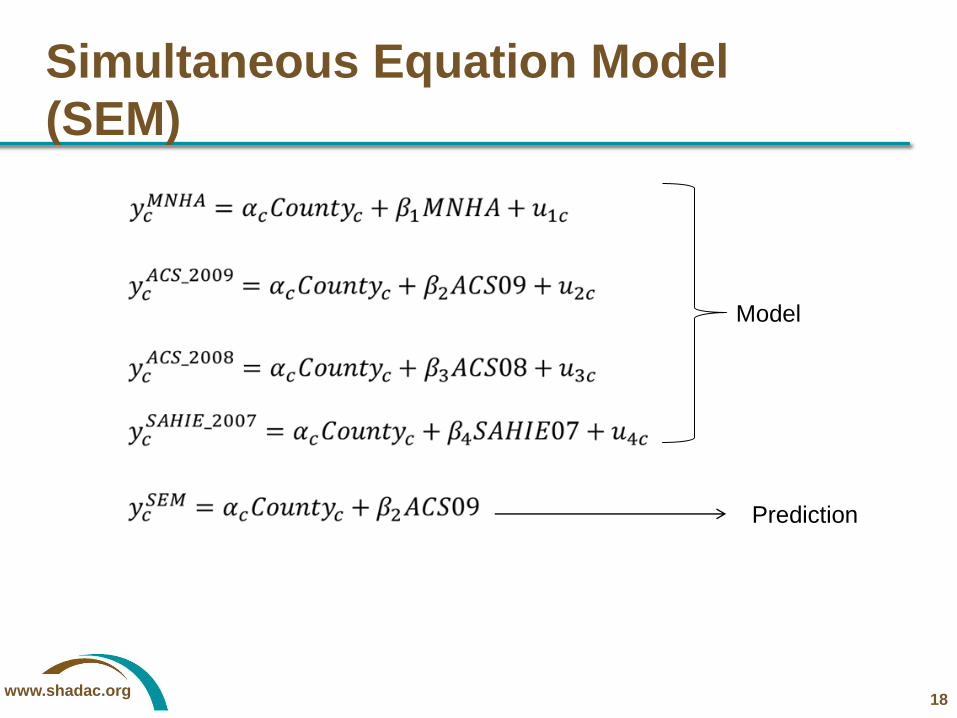
Simultaneous Equation Model
(SEM)
18
Model
Prediction
www.shadac.org
Limitations/Enhancements
• MNHA SAE model could include more
advanced variable selection and
transformations
• MNHA SAE model could take advantage of
information outside the state
• Multi-staged methodology removes non-
parametric errors
– Integrated model could propagate errors more
accurately19
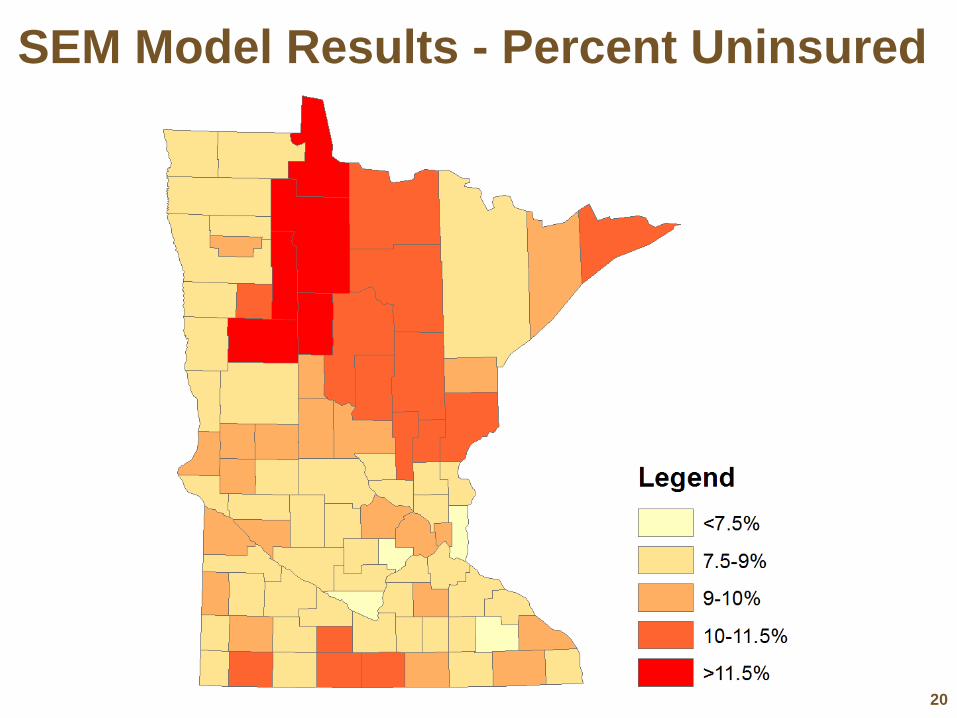
20
SEM Model Results - Percent Uninsured

www.shadac.org
SEM Model Results - Precision
• Standard Deviation from SEM model ranges
between (0.5-1.3)
• Coefficient of Variation (CV)
– CV=Standard deviation/Estimate
– Used as threshold for release by Census/NCHS
• >30% CV estimates are unreliable
– Ranges between (5.7%-14.4%)
21

22
SEM Model Results - CV

23
SEM Model Results - Source Comparison
0.0
5.0
10.0
15.0
20.0
25.0O
lmst
ed
Was
hin
gto
nC
arve
rN
ico
llet
Was
eca
Po
lkD
ako
taSt
ear
ns
Wilk
inB
en
ton
She
rbu
rne
Do
dge
Mo
wer
Ro
seau
An
oka
Pe
nn
ingt
on
Sco
ttC
lay
Swif
tSt
eel
eB
row
nW
abas
ha
Blu
e E
arth
Me
eke
rP
op
eM
arti
nG
oo
dh
ue
Kan
diy
oh
iC
ott
on
wo
od
Ho
ust
on
Pip
esto
ne
Ch
isag
oJa
ckso
nR
ock
Mah
no
me
nO
tter
Tai
lSi
ble
yB
ig S
ton
eK
itts
on
Isan
tiR
ed
wo
od
Le S
ue
ur
No
rman
Lyo
nR
en
ville
Yello
w M
edic
ine
St. L
ou
isW
righ
tW
ino
na
Fre
ebo
rnW
aden
aD
ou
glas
Ste
ven
sTo
dd
Gra
nt
Ch
ipp
ewa
Hen
nep
inM
orr
iso
nFi
llmo
reR
ice
Re
d L
ake
Lake
Lac
qu
i Par
leM
urr
ayTr
ave
rse
Lin
coln
Ram
sey
Car
lto
nM
arsh
all
Ko
och
ich
ing
Itas
caFa
rib
ault
No
ble
sW
ato
nw
anM
cLeo
dC
row
Win
gP
ine
Cas
sK
anab
ecM
ille
Lacs
Co
ok
Ait
kin
Lake
of
the
Wo
od
sB
eck
erH
ub
bar
dB
elt
ram
iC
lear
wat
er
SEM Rate
2009 MNHA (SAE)
2009 ACS (County)
2008 ACS (County)
2007 SAHIE

www.shadac.org
Conclusions
• Produced uninsurance estimates and
estimates of uncertainty using a state survey
and multiple outcomes
• Methodology is accessible and can be
applied to other states
24

25
Sign up to receive our newsletter and updates at www.shadac.org
facebook.com/shadac4states
@SHADAC
Joanna Turner
State Health Access Data Assistance Center
University of Minnesota, Minneapolis, MN
612-624-4802
Top Related