


Languages
Pages
Legal


1
Model based management system (BMS) for
Lithium-ion Batteries
M.A.P.L.E.
Modeling, Analysis, and Process-control Laboratory
for Electrochemical systems
Department of Chemical Engineering
University of Washington, Seattle

2
Current research topics:
– New materials (Si, Ge), ionic liquids,
core shell (magic bullet), hybrid
organic/inorganic materials
– Electrolyte decomposition, insitu
measurements, stress/phase field
modeling and measurements
– May take 20-30 years before
commercialization
Battery Research
While we wait
– Can we get more life, energy
density and improve safety with
better design?
– 10% increase in energy density at
high power for 20% additional life
– Move phase field and detailed
models to applications
If fundamental/systems engineering approaches are established for short term
goals, they are valid for next generation materials and systems

3
Outline
• Introduction
– Lithium-ion batteries and available models
Pseudo-two-dimensional thermal model (P2D)
• Problems with high-rate charging
– Overpotential
– Thermal effect
– Stress-strain effect
• Model reformulation
• Optimal charging profiles
• Conclusion
Separator
Anode
Container
Anode Cathode
Anode lead

4
Lithium-ion battery
Cathode Separator Anode
Curr
ent
Colle
cto
r Curre
nt C
olle
cto
r
Li+
Charging
e
Charge
1y x yLiMO Li MO xLi xe
Charg
6 6
e
xxL x Le Ci i C
Li+ Li+
Li+
Li+

5
Motivates design of architecture and operational strategies based on engineering
scaleup principles
Wide range of energy and power demands
ICD
Cell Phones
&
MP3 players
Laptops
& Tablets
Satellites
Plug-in hybrid
vehicles
Electric vehicles
Energy
Po
wer
Power grid
(images taken from the internet from various sources)

6
Sandwich Level
SEI layer growth
Side reactions
Non uniform current
Stress related cracking
Ohmic resistance
Mass transfer resistance
Lithium-ion batteries – Current limitations
Market Issues
Cost
Life
Safety
System Level
Underutilization
Capacity fade
Lower energy density
Thermal runaway
(V. Ramadesigan+, JES, 2012)

7
Current design practice is not good enough

8
Reverse engineering flight
[from Frank Doyle’s 2005 AIChE CAST award lecture]

9
But really, batteries are just like us
• Operate best between 65-75°F
65°F
75°F
65°F
75°F
65°F
75°F
Too Cold! Too Hot! Just Right

10
Which charging protocol is better?
• Protocol 1 reaches 4.2 V first and stays there
• Protocol 2 reaches 4.2 V at a later time but goes well above
4.2 V
Time (s) Time (s)
0
0.5
1
1.5
2
2.5
3
3.5
4
0 400 800 1200 16003.5
3.6
3.7
3.8
3.9
4
4.1
4.2
4.3
4.4
4.5
0 400 800 1200 1600
Vo
lta
ge
(V
)
Cu
rre
nt
(C-r
ate
)
Voltage Current

11
100% 0%
20%
40% 60%
80%
SOC
Battery
• No way to directly measure state of charge (SOC)
• No way to measure state of health (SOH)
• Only voltage, current are measurable
Can’t look inside the battery

12
Models for batteries
Predictability
CP
U t
ime
Porous
Electrode P2D
x
r
x
r
x
r
Single
Particle
Model
Stack
Thermal
Model
MD, KMC, etc
Empirical
Models Intercalation + Faraday’s law
Electrochemical Engg. +
Faraday’s law + intercalation
P2D +
Stress-strain
Plane shifts
Li+
stress & strain in graphite during intercalation / deintercalation
Stress effects on Graphite structure
P2D + Population
balance
Adding more physics provides more fidelity
and functionality for the model and the BMS
Comes at a higher computational cost
SOC
SOC
(+),(-)
SOC(x),
SOH,
T(x)
SOC(x,y),
SOH,
T(x,y)

13
Equivalent Circuit Model
• Very fast, 2-3 ordinary differential
algebraic equations (DAEs)
• No temperature or life effects, needs
to be updated when battery fades
UOC
RO
UTh
UTh
CTh ITh
IL
UL
Th LTh
Th Th Th
U IU
R C C
L OC TH L OU U U I R

14
Singe-particle model
• Fast, 20-30 DAEs (for a finite difference
formulation)
• Captures intercalation and kinetics in
lumped form
• Not valid for low temperature, high rates,
fast charging
Cathode Anode

15
Porous electrode two-dimensional (P2D)
model – electrolyte phase
+
-
Cu
rren
t co
llecto
r
- +
-
+
- +
-
+
-
+
-
+ - +
- +
Cu
rren
t co
llecto
r
Anode Cathode Separator
Solvated Anions
Solvated Lithium ion
Solvent
graphite particle
cathode particle
2
p p peff,p 2
( is the electrolyte concentration)
ε 1
c
c cD a t j
t x
Material balance
eff,p
eff,p1 2eff,p
1 2
2κ lnκ 1
( , are the solid- & liquid-phase potentials)
x
RT ct I
x F x
Charge balance
(J.S. Newman+, 1993-2012)

16
+
-
Cu
rren
t co
llecto
r
-
+
-
+
-
+
-
+ -
+
-
+ - +
- +
Cu
rren
t co
llecto
r
Anode Cathode Separator
Solvated Anions
Solvated Lithium ion
Solvent
graphite particle
cathode particle
P2D model – solid phase
LiyMO2 Lithiated
Graphite
s
p s
s,p p c
D T ct
2
1eff,p p p2
1( is the solid-phase potential)
a Fjx

17
+
-
Cu
rren
t co
llecto
r
-
+
-
+
-
+
-
+ -
+
-
+ - +
- +
Cu
rren
t co
llecto
r
Anode Cathode Separator
Solvated Anions
Solvated Lithium ion
Solvent
graphite particle
cathode particle
P2D model – kinetics
LiyMO2 Graphite
Reaction
Reaction
Li+
S
surfp p1 2, sinh
2o T CF
j i URT

18
+
-
Cu
rren
t co
llecto
r
-
+
-
+
-
+
-
+ -
+
-
+ - +
- +
Cu
rren
t co
llecto
r
Anode Cathode Separator
Solvated Anions
Solvated Lithium ion
Solvent
graphite particle
cathode particle
P2D model – thermal behavior
• >1000 DAEs (for standard finite difference
formulation)
, rxn,i rev,i ohm,ii i
i p i i
dT TC Q Q Q
dt X X
19
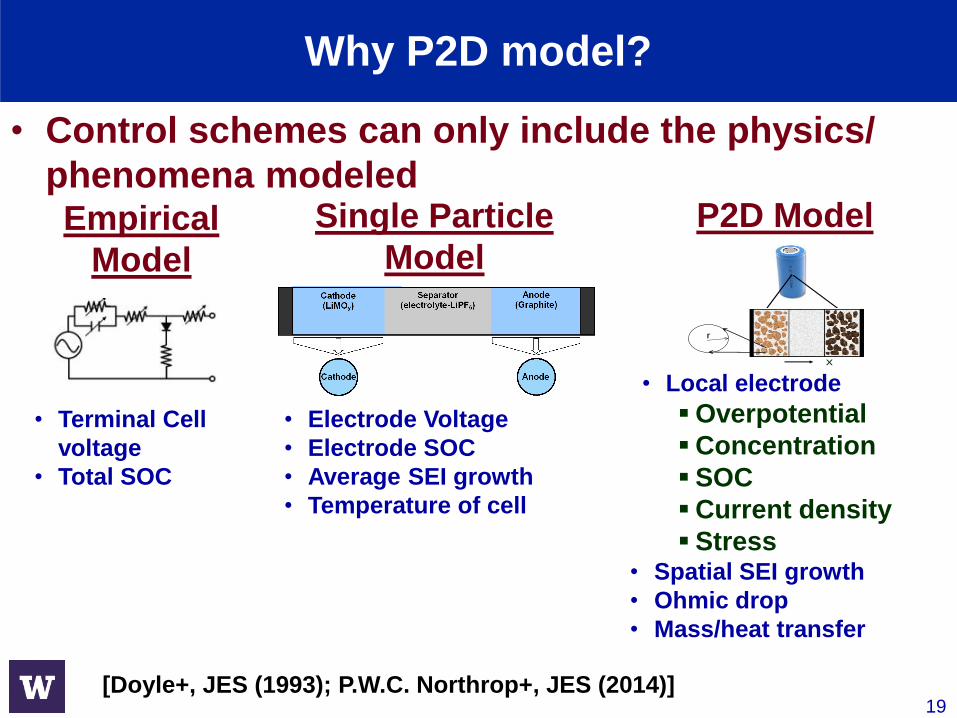
Why P2D model?
• Control schemes can only include the physics/
phenomena modeled Empirical
Model
• Terminal Cell
voltage
• Total SOC
Single Particle
Model
• Electrode Voltage
• Electrode SOC
• Average SEI growth
• Temperature of cell
P2D Model
• Local electrode
Overpotential
Concentration
SOC
Current density
Stress • Spatial SEI growth
• Ohmic drop
• Mass/heat transfer
x
r
[Doyle+, JES (1993); P.W.C. Northrop+, JES (2014)]

20
CYCLE 25
Dsn= 1.415E-13
kn = 2.503E-09
CYCLE 1
Dsn= 3.455E-13
kn = 1.207E-09
CYCLE 100
Dsn= 8.267E-14
kn = 1.213E-09
CYCLE 200
Dsn= 6.755E-14
kn = 2.035E-10
Parameter estimation
[ V. R. Subramanian+, FOCAPD 2009, V. Ramadesigan+ (ECS, 2010 )]

21
Experimental Verification – US Government Cells
[V. Ramadesigan+, ECST 2009 ]

22
Experimental Validation – US Government Cells
0
500
1000
0.20.40.60.811.21.41.61.8
x 10-13
0
5
10
15
x 1014
cycle
Dsn
(m2/s)
PD
F
[ V. Ramadesigan+, ECST 2009, V. Ramadesigan+ ECS (2010) ]

23
Bayesian Estimation
3 4 5 60
2
4
6x 10
15
Dsn
(10-14
m2/s)
PD
F
Dsn
at cycle 500
2.5 3 3.5 4 4.50
5
10x 10
15
Dsn
(10-14
m2/s)
PD
F
Dsn
at cycle 1000
4 5 6 7 80
1
2x 10
11
kn (10-11
mol/(mol/m3)1.5
)
PD
F
Kn at cycle 500
3.5 4 4.50
1
2x 10
12
kn (10-11
mol/(mol/m3)1.5
)P
DF
Kn at cycle 1000
Bayesian estimation for the solid-phase diffusion
coefficient Dsn and the reaction rate constant kn for the
negative electrode at cycle 500 and 1000

24
Bayesian Estimation
0 200 400 6000
1
2x 10
-13
cycle number (N)
Dsn,
m2/s
Dsn
=4.110-14
N-0.35
0 200 400 6000
2
4
6x 10
-9
cycle number (N)
kn,
m2/s
kn=510
-7N
-1.4
0 2500 5000 7500 100002.5
3
3.5
4
4.5
Discharge time, s
Voltage,
V
Data
Simulated
[ V. R. Subramanian+, FOCAPD 2009, V. Ramadesigan+ ECS (2010) ]

25
Outline
• Introduction
– Lithium-ion batteries and available models
Pseudo two-dimensional thermal model (P2D)
• Problems with high-rate charging
– Overpotential
– Thermal effect
– Stress-strain effect
• Model reformulation
• Optimal charging profiles
• Conclusion
Separator
Anode
Container
Anode Cathode
Anode lead

26
• Negative potential at the anode
causes lithium to plate
– Anode overpotential < 0
Lithium plating
x
r
(www.ifw-dresden.de/de)
27
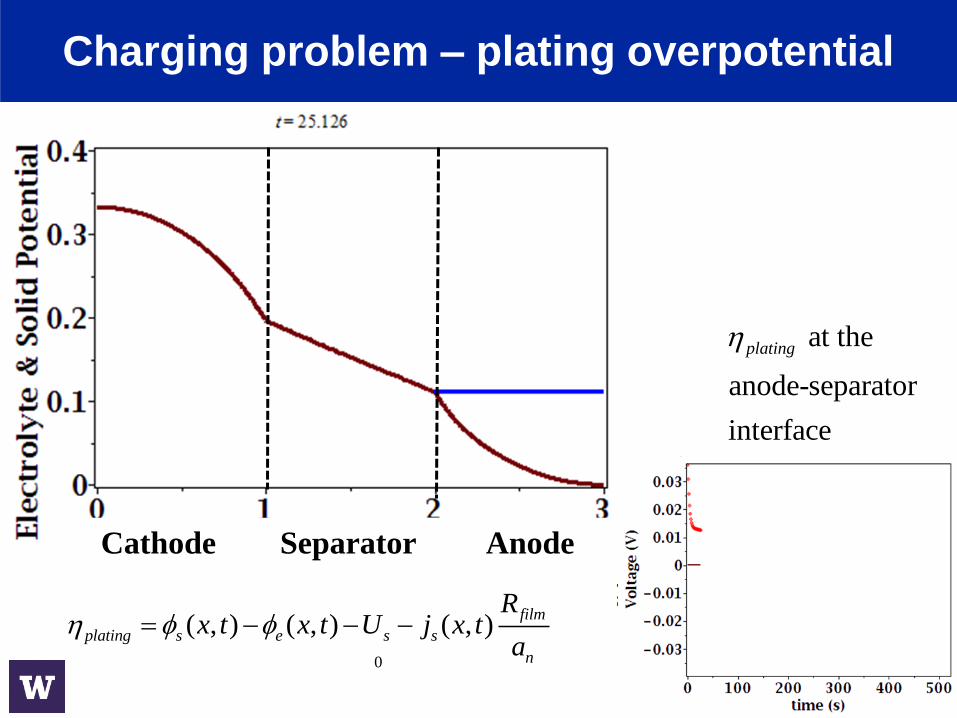
Charging problem – plating overpotential
0
( , ) ( , ) ( , )film
plating s e s s
n
Rx t x t U j x t
a
at the
anode-separator
interface
plating
Separator Cathode Separator Anode

28
Charging problem – plating overpotential
at the
anode-separator
interface
plating
0
( , ) ( , ) ( , )film
plating s s s s
n
Rx t x t U j x t
a
Cathode Separator Anode
29
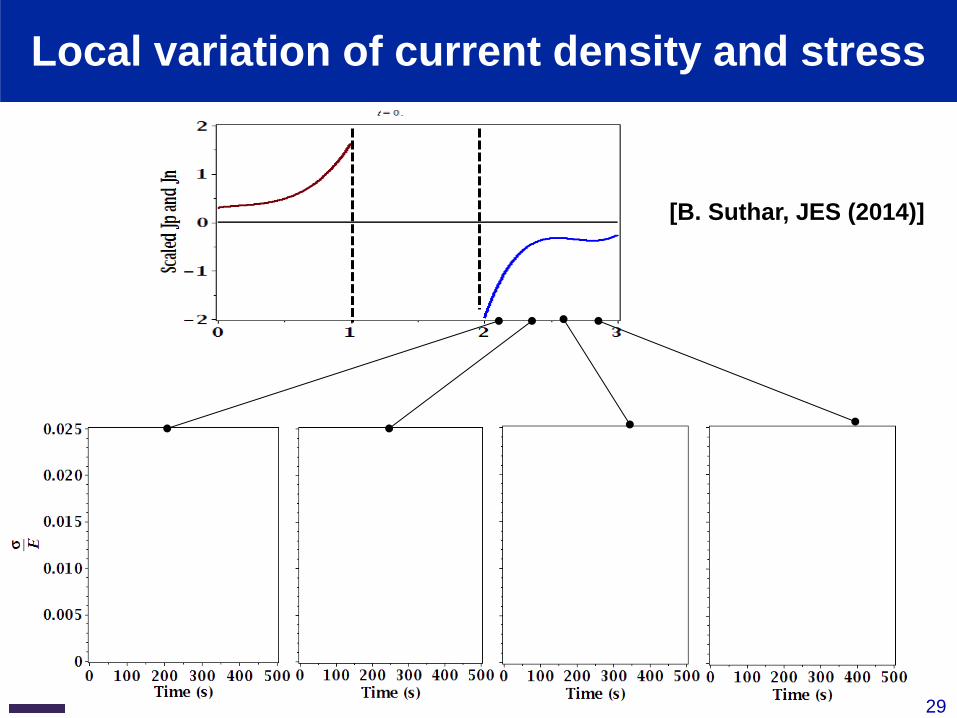
Local variation of current density and stress
[B. Suthar, JES (2014)]

30
Conventional charging (CC-CV) and
drawbacks
0
0.5
1
1.5
2
2.5
3
3.5
4
4.5
0 500 1000
Cu
rren
t (C
ra
te)
Time (Sec)
CC-CV with 3C
CC-CV with 4C
3.753.8
3.853.9
3.954
4.054.1
4.154.2
4.25
0 500 1000
Vo
lta
ge
(V)
Time (Sec)
CC-CV with 3C
CC-CV with 4C
295
300
305
310
315
320
325
0 500 1000
Tem
per
atu
re (
K)
Time (Sec)
CC-CV with 3C
CC-CV with 4C
-0.05-0.04-0.03-0.02-0.01
00.010.020.030.040.05
0 500 1000
Ov
erp
ote
nti
al
(V)
Time (Sec)
CC-CV with 3C
CC-CV with 4C

31
Silicon nano-structured electrodes
31
Cycling
Nanowires
1D electron
transport
Strain
relaxation
Good contact with current collector
Good: Use Si nano-structured
electrodes
- Relaxation of strain
- Efficient electron transport
- Good current collector
contact
- Decreases dead weight
(Chan+, Nat. Nano, 2008)
Bad: High stress development during intercalation
- Volume expansion, De-lamination from substrate

32
CC-CV charging and drawbacks
0
0.5
1
1.5
2
2.5
3
3.5
4
4.5
0 500 1000
Cu
rren
t (C
ra
te)
Time (Sec)
CC-CV with 3C
CC-CV with 4C
3.753.8
3.853.9
3.954
4.054.1
4.154.2
4.25
0 500 1000
Vo
lta
ge
(V)
Time (Sec)
CC-CV with 3C
CC-CV with 4C
0
0.01
0.02
0.03
0.04
0.05
0.06
0.07
0.08
0 500 1000
Str
ess
(sca
led
)
Time (s)
Tangential Stress (Near Separator)
CC-CV with 3C
CC-CV with 4C
0
0.005
0.01
0.015
0.02
0.025
0.03
0.035
0.04
0 500 1000
Str
ess
(sca
led
)
Time (s)
Radial Stress (Near Separator)
CC-CV with 3C
CC-CV with 4C

33
Outline
• Introduction
– Lithium-ion batteries and available models
Pseudo two-dimensional thermal model (P2D)
• Problems with High-rate charging
– Overpotential
– Thermal effect
– Stress-strain effect
• Model reformulation
• Optimal charging profiles
• Conclusion
Separator
Anode
Container
Anode Cathode
Anode lead

34
Finite difference solution
Np
Positive Electrode Separator Negative Electrode
x=0 x=lp x=lp+ls x=lp+ls+ln
Nn Ns Nr Nr
Li-ion cell pseudo-2D model
1000-10000 DAEs, Time: 1-2 min

35
• Lumped Parameter Models
– Drop the physics?
• Proper Orthogonal Decomposition
• Mathematical Reformulation
– Spectral methods + analytical solution
– OCFE
Different order reduction approaches
(L. Cai and R.E. White, JES, 2009)
(V.R. Subramanian +, ESL, 2007; ECS 2009)
(P.W.C. Northrop+, JES, 2011)

36
Mathematical reformulation
Coordinate
Transformation
Original System 3000-10000 DAEs
A
0X 1X
C A
px l
p sx l l
p s nx l l l
0x
S
C
S
-1 1 0
x
-1
1
0 f(x
)
Analytical
Solutions
Final System 30-50 DAEs
Reduces
into
Orthogonal
Collocation
(P.W.C. Northrop+, JES, 2011) (Patent US20140136169)

37
Reformulated model
Computation Details Full-order
FD model
Reformulated
model
Number of equations for charge or
discharge curve
>1000
DAEs
27 DAEs
Computation time for charge or
discharge curve
1-2 min 15-45 ms
• Memory requirement < compared to full-order finite difference (FD) models
• Reformulated model conserves mass and charge
Stabilizes coupled multiscale codes

38
Outline
• Introduction
– Lithium-ion batteries and available models
Pseudo two-dimensional thermal model (P2D)
• Problems with high-rate charging
– Overpotential
– Thermal effect
– Stress-strain effect
• Model reformulation
• Optimal charging profiles
• Conclusion
Separator
Anode
Container
Anode Cathode
Anode lead

39
Dynamic optimization methodology
• Simultaneous discretization
Large Nonlinear
Program
PDE
( , ) . ( , )nx x tt
N x t
Spatial
Discretization
Algebraic
Equations
1, , , appk k k kk
F z z y i
, , appk k kkG z y i
DAEs
'( ) , , , appz t f t z y i
0 , , , appg t z y i
Path Constraints
and Obj. Function
maxmin
maxmin
maxmin
( ) ,
( ) ,
( )
appi i k i
y y k y
z z k z
Optimal Charging/
Discharging Profile
0 0.2 0.4 0.6 0.8 10
0.5
1
1.5
2
Scaled time
Scale
d c
urr
en
t (C
Rate
)
with PID
without PID
Nonlinear
Programming
Solver
Temporal
Discretization
(L.T. Biegler, JPC, 2004)

40
Halting lithium plating
• If overpotential goes below zero,
lithium plating will occur
• Solution: Restrict overpotential
𝟎 ≤ 𝛈

41
Optimal control for charging – avoid plating
• Problem formulation
• Model description
– Reformulated model
( )( )
f
Q appapp
t
i t0
max i t dt
such that
maxapplied
plating
0 i i ;
>0
3.5C
1
,s pC 2
,s pC
1
,e pC2
,e pC1
,e sC
2
,e sC
1
,s nC 2
,s nC
1
,e nC 2
,e nC1
,e pT
2
,e nT1
,e nT
2
,e pT
2
,e sT
1
,e sT
Maximize charge stored
(Patent US20140136169, “Systems and methods for improving battery
performance;” [P.W. C. Northrop+, JES (2014)]
42
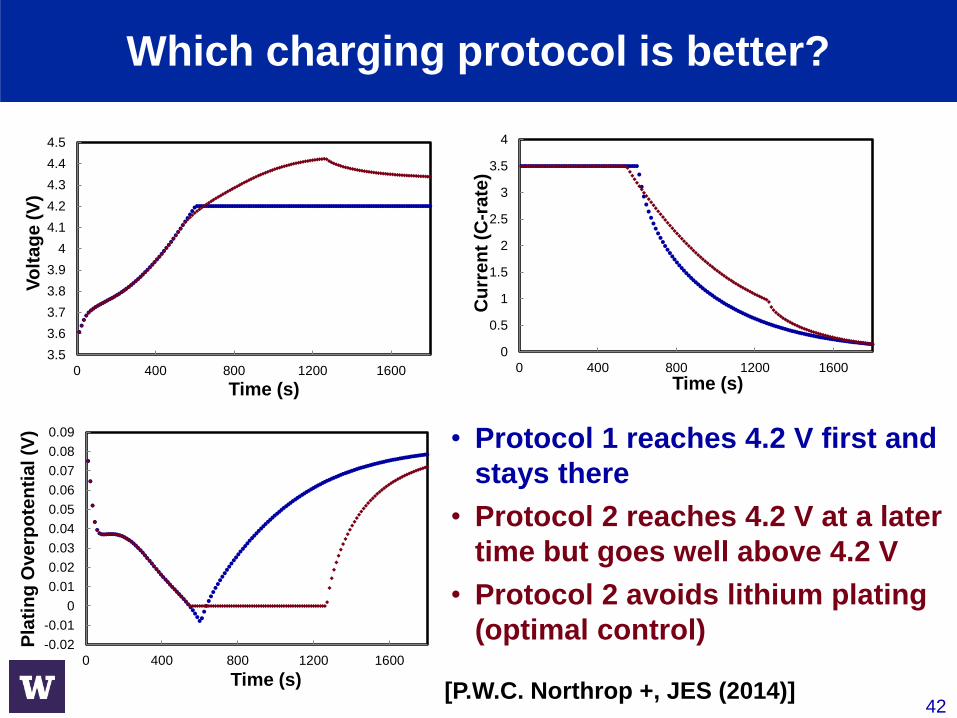
Which charging protocol is better?
• Protocol 1 reaches 4.2 V first and
stays there
• Protocol 2 reaches 4.2 V at a later
time but goes well above 4.2 V
• Protocol 2 avoids lithium plating
(optimal control)
Time (s) Time (s)
Time (s)
0
0.5
1
1.5
2
2.5
3
3.5
4
0 400 800 1200 16003.5
3.6
3.7
3.8
3.9
4
4.1
4.2
4.3
4.4
4.5
0 400 800 1200 1600
Vo
lta
ge
(V
)
Cu
rre
nt
(C-r
ate
)
Pla
tin
g O
ve
rpo
ten
tial (V
)
-0.02
-0.01
0
0.01
0.02
0.03
0.04
0.05
0.06
0.07
0.08
0.09
0 400 800 1200 1600
[P.W.C. Northrop +, JES (2014)]

43
Is avoiding plating enough?
Time (s) Time (s)
Time (s)
0
0.5
1
1.5
2
2.5
3
3.5
4
0 400 800 1200 16003.5
3.6
3.7
3.8
3.9
4
4.1
4.2
4.3
4.4
4.5
0 400 800 1200 1600
Vo
lta
ge
(V
)
Cu
rre
nt
(C-r
ate
)
Pla
tin
g O
ve
rpo
ten
tial (V
)
-0.02
-0.01
0
0.01
0.02
0.03
0.04
0.05
0.06
0.07
0.08
0.09
0 400 800 1200 1600300
305
310
315
320
325
330
335
340
0 400 800 1200 1600
Te
mp
era
ture
(K
)
Time (s)

44
Optimal control for charging – avoid plating
and temperature rise
• Problem formulation
• Model description
– Reformulated thermal P2D
( )( )
f
Q appapp
t
i t0
max i t dt
( , )
such that
maxapplied
plating
max
0 i i ;
>0;
T x t T K
3.5C
335
1
,s pC 2
,s pC
1
,e pC2
,e pC1
,e sC
2
,e sC
1
,s nC 2
,s nC
1
,e nC 2
,e nC1
,e pT
2
,e nT1
,e nT
2
,e pT
2
,e sT
1
,e sT
Maximize charge stored

45
300
305
310
315
320
325
330
335
340
0 400 800 1200 1600
3.5
3.6
3.7
3.8
3.9
4
4.1
4.2
4.3
4.4
4.5
0 400 800 1200 1600
-0.02
-0.01
0
0.01
0.02
0.03
0.04
0.05
0.06
0.07
0.08
0.09
0 400 800 1200 1600
0
0.5
1
1.5
2
2.5
3
3.5
4
0 400 800 1200 1600
Time (s) Time (s)
Time (s)
Vo
lta
ge
(V
)
Cu
rre
nt
(C-r
ate
)
Pla
tin
g O
ve
rpo
ten
tial (V
)
Time (s)
Te
mp
era
ture
(K
)
Determining optimal charge profile
Optimal fast charge yields 10.5% increase in SOC
with no lithium plating or effects from temperature rise

46
User Interface

47
Control algorithm on microcontroller

48
Optimal profiles for solar-battery hybrids
Standard Protocol N
orm
ali
ze
d C
urr
en
t
t, time of the day (hr)
0
0.2
0.4
0.6
0.8
1
1.2
1.4
1.6
4 8 12 16 20
Standard Charging
Max Charge Stored
Reduced Fade
Solar Insolation
Demand
0
0.2
0.4
0.6
0.8
1
1.2
1.4
1.6
4 8 12 16 20
Standard Charging
Max Charge Stored
Solar Insolation
Demand
0
0.2
0.4
0.6
0.8
1
1.2
1.4
1.6
4 8 12 16 20
Standard Charging
Solar Insolation
Demand
0
0.2
0.4
0.6
0.8
1
1.2
1.4
1.6
4 8 12 16 20
Solar Insolation
Demand
Optimal Energy Optimal Life
[M. Lawder+, Proc of IEEE (2014)]

49
Summary and future directions
• Summary
– Model-based optimal control leads to improved
charging profiles
Subtle differences in operating protocols correspond
to significant local variations in electrochemical,
thermal, and mechanical behaviors
– Reformulated models make the pseudo-2D model
manageable for control relevant applications

50
Acknowledgements
• Students, postdoctoral associates, and collaborators
(UW/WUStL/TTU)
• Sponsors
– NSF, DOE-ARPA-E, DOE (SERIIUS), MDA, NRO, Sun Edison, ACS PRF,
Hyundai Motor Company, NCSA, UW Clean Energy Institute
• For more info visit
depts.washington.edu/maple

51
“If you can’t model your process, you don’t
understand it. If you don’t understand it, you
can’t improve it. And, if you can’t improve it,
you won’t be competitive in the 21st century.”
Jim Trainham (RTI International)
Questions?
Thanks!

52
Multi-objective multi-disciplinary multi-scale problem
Optimal BMS
BMS based on MPC
Top Related