


Languages
Pages
Legal


Mobile Payment
Adoption During
the COVID-19
Pandemic
MASTER THESIS WITHIN: Business Administration
NUMBER OF CREDITS: 30 PROGRAMME OF STUDY: M.Sc. Digital Business AUTHOR: Niklas Herget & Philip Steinmüller Krey JÖNKÖPING May 2021
A Quantitative Study
in Germany
i
Master Thesis in Business Administration
Title: Mobile Payment Adoption during the COVID-19 Pandemic in Germany
Authors: Niklas Herget and Philip Steinmüller Krey
Tutor: Marta Caccamo
Date: 2021-05-24
Key terms: Mobile Payment Adoption, Germany, COVID-19, UTAUT, TAM, DOI, Intention
to Use, Technology Adoption, Contactless Payments, M-Commerce, Mobile Point-of-Sale,
ApplePay, Digital Wallet
Abstract
Background: Emerging in December 2019, the COVID-19 pandemic profoundly
changed consumer behaviour leading to social distancing and mitigating physical contact.
Statistics show an increased use of contactless and mobile payment usage and adoption during
the pandemic. It is unclear how valid previous models on mobile payment adoption explain
adoption behaviour in emergency situations. While there are few studies approaching the
adoption behaviour during the pandemic, there is also little previous research on mobile
payment adoption prior to the pandemic in Germany.
Purpose: The present thesis intends to advance several previously researched
technological adoption frameworks to focus on and measure consumers’ perception of mobile
payment technology adopting during the COVID-19 pandemic. Hence, our model provides a
basis to understand mobile payment adoption in Germany during the pandemic.
Method: Based on hypotheses derived from an adapted UTAUT2 model, we
conducted quantitative deductive research reaching 258 questionnaire participants based in
Germany. The empirical data was analysed through structural equation modelling.
Conclusion: The findings show that Performance Expectancy still represents the
primary driver of intention to adopt mobile payments during the pandemic, yet it is strongly
supported by the initially contextualised Contamination Avoidance element and complemented
by Habit, Effort Expectancy. Practitioners benefit from the study to better tailor campaigns in
accordance with the main driver of adoption behaviour, while our findings contribute new
insights into technology adoption in Germany during emergency situations.

ii
Table of Contents
1 Introduction ................................................................................... 1
1.1 Background ......................................................................................................... 1
1.2 Problem Discussion and Research Purpose ........................................................ 3
2 Literature Review ......................................................................... 5
2.1 Literature Research Strategy ............................................................................... 5
2.2 Introduction of Mobile Payment Services (MPS) ............................................... 6
2.2.1 Mobile Payment Services .................................................................................... 6
2.2.2 Consolidation and European Payment Initiatives ............................................... 8
2.3 Mobile Payment Research................................................................................... 9
2.3.1 Unified Theory of Acceptance and Use of Technology (UTAUT2) ................ 10
2.3.1.1 Price Value ................................................................................................................................. 11
2.3.1.2 Hedonic Motivation .................................................................................................................... 12
2.3.1.3 Habit .......................................................................................................................................... 12
2.3.1.4 Effort Expectancy ....................................................................................................................... 13
2.3.1.5 Social Influence .......................................................................................................................... 13
2.3.1.6 Performance Expectancy ............................................................................................................ 13
2.3.1.7 Facilitating Conditions ............................................................................................................... 14
2.3.1.8 Intention to Use .......................................................................................................................... 14
2.3.1.9 Moderating Factors ..................................................................................................................... 14
2.3.2 Technology Acceptance Model (TAM) ............................................................ 15
2.3.3 Diffusion of Innovation Theory (DOI) ............................................................. 16
2.4 Mobile Payment Adoption Research ................................................................ 16
2.5 Mobile Payment Research in Germany ............................................................. 19
3 Development Research Model and Hypotheses........................ 21
4 Methodology ................................................................................ 28
4.1 Research Philosophy ......................................................................................... 28
4.2 Research Approach ........................................................................................... 29
4.3 Research Strategy .............................................................................................. 30
4.4 Data Collection.................................................................................................. 30
4.4.1 Survey Design ................................................................................................... 30
4.4.2 Pre-Test ............................................................................................................. 33
4.4.3 Sampling Strategy ............................................................................................. 34

iii
4.5 Data Analysis .................................................................................................... 35
4.6 Research Quality ............................................................................................... 36
4.6.1 Validity .............................................................................................................. 36
4.6.2 Reliability .......................................................................................................... 38
4.7 Ethical Considerations ...................................................................................... 38
5 Empirical Findings ...................................................................... 41
5.1 Descriptive Analysis ......................................................................................... 42
5.1.1 Demographics ................................................................................................... 42
5.1.2 Central Tendencies ............................................................................................ 43
5.1.3 Additional Comments by Respondents ............................................................. 44
5.2 Scale Measurement ........................................................................................... 45
5.2.1 Test for Normality ............................................................................................. 45
5.2.2 Model Fit ........................................................................................................... 45
5.2.3 Outer Model Loading Factors ........................................................................... 45
5.2.4 Collinearity ........................................................................................................ 46
5.2.5 Reliability Test .................................................................................................. 47
5.2.6 Discriminant Validity ........................................................................................ 48
5.3 Structural Model................................................................................................ 50
5.3.1 Moderating Effects ............................................................................................ 52
5.3.2 Indirect Effects .................................................................................................. 53
5.3.3 Summary of the Research Model ...................................................................... 54
6 Analysis ........................................................................................ 55
6.1 Significant Towards Intention to Use ............................................................... 55
6.1.1 Hypothesis 2 CA Predicts PE & ITU ................................................................ 55
6.1.2 Hypothesis 3 PE Strongly Explains ITU ........................................................... 57
6.1.3 Hypothesis 4 EE Predicting ITU and PE .......................................................... 58
6.1.4 Hypothesis 6 HA as a Minor Predictor for ITU ................................................ 60
6.2 No Significance Towards Intention to Use ....................................................... 60
6.2.1 Hypothesis 5 SI on ITU not Significant ............................................................ 60
6.2.2 Hypothesis 7 FC on ITU not Significant........................................................... 61
6.2.3 Hypothesis 8 HM on ITU not Significant ......................................................... 62
6.2.4 Hypothesis 9 PR on ITU not Significant........................................................... 62
6.3 Moderating Factors ........................................................................................... 64

iv
6.3.1 Gender ............................................................................................................... 64
6.3.2 Age .................................................................................................................... 64
6.4 Indirect Effects .................................................................................................. 66
7 Discussion ..................................................................................... 67
7.1 Theoretical Implications .................................................................................... 67
7.2 Practical Implications ........................................................................................ 69
7.3 Limitations and Future Research ...................................................................... 70
7.3.1 Research Objective ............................................................................................ 70
7.3.2 Methodology & Data Collection ....................................................................... 71
7.3.3 Research Model ................................................................................................. 72
7.3.4 Influence of the Pandemic ................................................................................. 73
8 Conclusions .................................................................................. 74
9 Appendices ................................................................................... 76
10 References .................................................................................... 87

v
Figures
Figure 1 Evolution of Technology Acceptance Models ............................................. 10
Figure 2 UTAUT2 Model........................................................................................... 11
Figure 3 Proposed Research Model............................................................................ 21
Figure 4 Methodological Implications of Different Epistemologies.......................... 28
Figure 5 Research Model with Path Coefficients ....................................................... 54
Tables
Table 1 Survey Questions and Sources ...................................................................... 32
Table 2 Descriptive Statistics: Valid Cases, Age, and Gender .................................. 42
Table 3 Descriptive Statistics: Previous Experience with Mobile Payment Services 43
Table 4 Reliability of Latent Variables ...................................................................... 48
Table 5 HTMT Criterion for Discriminant Validity After Revision .......................... 50
Table 6 Summary of Results of Hypotheses .............................................................. 52
Table 7 Age as a Moderator ....................................................................................... 53
Table 8 Gender as a Moderator .................................................................................. 53
Table 9 Total Indirect Effects ..................................................................................... 53
Appendices
Appendix A Literature Reviews Related to Mobile Payment (m-payment) .............. 76
Appendix B Definition and Root Constructs of UTAUT........................................... 77
Appendix C Self-Administered Survey Design & Information About M-Payments . 78
Appendix D Additional Comments of Survey Participants ....................................... 79
Appendix E VIF Factors of Constructs ...................................................................... 80
Appendix F Pearson’s Correlation of Research Model .............................................. 81
Appendix G Normality and Descriptive Statistics of Items ....................................... 82
Appendix H Overview Questionnaire Answers ......................................................... 83
Appendix I LinkedIn Survey Promotion .................................................................... 86

vi
Abbreviations
#dk Germany Payment Initiative
AV Availability
AVE Average Variance Extracted
CA Contamination Avoidance
DOI Diffusion of Innovation
EE Effort Expectancy
EPI European Payment Initiative
FC Facilitating Conditions
HA Habit
HM Hedonic Motivation
HTMT Heterotrait-Monotrait Ratio
ITU Intention to Use
MPS Mobile Payment Services
NFC Near Field Communication
P27 Nordic Payment Initiative
PE Performance Expectancy
PI Personal Innovativeness
PLS-SEM Partial Least Squares Structural Equation Modelling
POS Point of Sale
PR Perceived Risk
PSD2 Payment Service Directive 2
SE Self-Efficacy
SEPA Single Euro Payments Area
SI Social Influence
SRMR Standardised Root Mean Square Residual
TAM Technology Acceptance Model
UTAUT Unified Theory of Acceptance and Use of Technology
VIF Variance Inflation Factor
WHO World Health Organisation

1
1 Introduction
This chapter aims to introduce the background to mobile payment and the adoption in
Germany during the COVID-19 pandemic. First, we provide information on the impact
of the pandemic on daily life, followed by the developments of payment methods in
Germany and the connection to the pandemic. Second, we will outline the motivation and
purpose followed by the underlying research question of our study.
1.1 Background
The adoption of smartphones has lastingly changed how consumers perform everyday
tasks. Smartphones have become omnipresent in today’s world, and people rely on
smartphones when navigating around cities, contacting friends, conducting online
shopping, or even filling out tax returns (Marques, 2016). Smartphones and digital
technology have incorporated themselves into the fabric of everyday life. Several
attempts have been made to understand consumers’ use of such novel technology,
although more research is required regarding their adoption and Intention to Use it
(McKenna et al., 2013). When considering the adoption and use intentions, it is apparent
that some consumers groups tend to have resistance to innovation and scepticism of new
technologies (Jahanmir & Lages, 2015, 2016), which can cause innovations to fail
(Heidenreich & Spieth, 2013). Talke and Heidenreich (2014) argue that consumers’
innovation resistance must be recognised to facilitate new product adoption. There was
and still is a high resistance among Germans in giving up cash, however, recent statistics
show the hesitation is softening, and more transactions are conducted cashless (Deutsche
Bundesbank, 2021; Esselink & Hernández, 2017).
The coronavirus disease 2019 (COVID-19) is a worldwide pandemic that emerged in
December of 2019 and has consequentially and profoundly changed consumer behaviour
and societal norms. As of the 24 of May 2021, nearly 3.5 million deaths and near 167
million confirmed cases of COVID-19 have been reported by the World Health
Organisation (WHO) (2021). Due to the infectiveness of the SARS-CoV-2 virus, which
causes the contagious COVID-19 disease, social distancing and mitigating physical
contact were urged by the WHO (2020). Further, in continental Europe, social distancing

2
and partial or complete lockdowns had pervasive effects on everyday life and common
everyday habits. On the one hand, the pandemic has drastically increased online
commerce within a short time; on the other hand, offline point of sale (POS) transactions
have been increasingly conducted contactless (Deutsche Bank AG, 2020a). In
conjunction with high smartphone penetration levels across Europe and an affinity for
undertaking financial transactions online, the pandemic has led to a growing potential
user-base for mobile payments (Statista, 2021c).
Mobile payments and Near Field Communication (NFC) can mitigate transmission risk
due to their contactless design and support social distancing (Celum et al., 2020).
Payments are before or afterwards approved by the consumer on their mobile device,
which is advantageous versus the sole use of the payment cards’ NFC functionality, which
requires PIN entry depending on a transaction amount threshold up to EUR 50; these
thresholds have been elevated since the pandemic and had been substantially lower before
(Weimert & Saiag, 2020). In a recent German survey, 21% of respondents reported that
they first used contactless payment in the pandemic (Deutsche Bundesbank, 2021).
Within April 2020 alone, according to a Bundesbank survey (2021), payment behaviour
changed due to COVID-19, and the share of non-cash payments increased from 25% to
43%. Further, the share of using the contactless function of Germany’s proprietary
payment card Girocard grew from 39% in January 2020 to 60.4% of all Girocard
transactions in December 2020 (RND/dpa, 2021). In addition, the support of other
payment solutions among retailers has only begun in the last few years. Despite that,
LIDL, one of Germany’s biggest retailers, has launched their mobile payment services in
2020, which gives customers coupons and other discounts in return when using their
mobile payment app (Lidl Dienstleistung GmbH & Co. KG, 2020).
Even after gradually easing social restrictions and lockdowns, consumers might stick to
these newly developed habits. However, the stickiness or longevity of these newly
acquired temporal habits is uncertain. Further, shops and businesses try to fathom how to
conduct business after COVID-19, especially the hospitality industry is expected to
undergo the most significant long-term changes (Gursoy & Chi, 2020).

3
In the long-term, there are behavioural, societal, and regulatory hurdles to reducing cash
transactions. For many consumers, cash is still viewed as more comfortable to use for
smaller purchases. In addition, older consumers may be wary of digital payment methods,
and the unbanked and lower-income consumers could be excluded from non-cash
payment solutions. Having a more physical connection to their money is often cited to
help some consumers budget and manage debt. (Weimert & Saiag, 2020)
Nonetheless, traditional banks are still among the most trusted compared to payment
service providers, retailers, big tech companies, and neobanks/FinTechs (Pratz et al.,
2020). In addition, there seem to be cultural belief differences in adopting contactless
payment methods during the COVID-19 pandemic across Europe, as adoption rates have
increased to starkly varying degrees even in countries impacted similarly severely by the
COVID-19 pandemic (Pratz et al., 2020). Nevertheless, as governments and the WHO
indirectly promote the use of contactless payment methods by recommending avoiding
physical contact, this recommendation potentially influences consumers in use and
adopting mobile payment methods (WHO, 2020).
The present thesis intends to advance several previously researched technological
adoption frameworks to measure the consumers’ perception of mobile payment
technology adopting during the COVID-19 pandemic (Venkatesh et al., 2012).
1.2 Problem Discussion and Research Purpose
As statistics show an increased use of contactless and mobile payment usage and adoption
during the pandemic, it is unclear how availability, social norms, and health mitigation
strategies influenced this behaviour (Deutsche Bundesbank, 2021; RND/dpa, 2021). Our
thesis wants to shed light on adopting mobile payment services during the COVID-19
pandemic through a quantitative research study approach to survey as a comprehensive
sample of society. Hence, we can gain insight into the payment behaviour and attitudes
towards mobile payment solutions from customers that would not have used it without
the pandemic or be confronted with contactless payment methods. Moreover, we
investigate attitudes and openness towards new solutions and innovations in Germany’s
payment landscape, as consumers in Germany have been considered as reluctant to adopt
new payment services in the past. This is exemplified by the fact that the use of invoice

4
in conjunction with traditional bank transfers is still the second most used or preferred
online payment method in Germany (Bitkom, 2020), and there are several discontinued
or failed to broadly establish mobile payment services in the past years (Humbani &
Wiese, 2018). Resulting from an extensive literature analysis, we identified that research
on mobile payment adoption in Germany as a gap, combined with the current
phenomenon of COVID-19, justifies as a relevant objective. Guided by previous research
in the domain of technology adoption, we extend the UTAUT2 framework (Venkatesh et
al., 2012), which examines antecedents of technology adoption by constructs of the TAM
and DOI models as well as further items of previous studies, which we expect capturing
effects of the COVID-19 pandemic (Baudier et al., 2021; Davis, 1989; Rogers, 2003).
Therefore, we propose the following research question guiding our research:
How is users’ intention to adopt mobile payment services in Germany determined
during the COVID-19 pandemic? Do established determinants still apply?
To examine and transfer the previous theory to the situation in Germany during the
COVID-19 pandemic we choose quantitative research approach. We approached the
research question by conducting an online survey of 258 German consumers between
March and April 2021. The questionnaire based on previous research and included a
three-item structure for each element of the research model. We obtained a total of 216
usable filled-out questionnaires for the analysis utilising structural equation modelling.

5
2 Literature Review
The purpose of this chapter is to introduce the theoretical background of our thesis. First,
we will describe our literature research strategy, followed by introducing mobile
payments as a technology. Secondly, we will introduce the unified theory of acceptance
and use of technology (UTAUT2), the technology acceptance model (TAM), and the
diffusion of innovation theory (DOI) as models that were utilised by previous literature
to explain mobile payment adoption. For reasons of clarity, if we refer to the model’s
constructs, we capitalise or abbreviate them, while behaviour is uncapitalised. Lastly, we
will outline relevant studies on mobile payment adoption prior to the pandemic, studies
focusing on adoption during the pandemic, and studies focusing on Germany.
2.1 Literature Research Strategy
We started our research by researching relevant topics due to the significant impact on
people’s everyday lives by the COVID-19 pandemic. We came across a vast array of
management and finance topics, where the pandemic offered chances in the research
because it impacted vast areas of research. The literature offers an extensive overview of
the adoption of recent technology. After a detailed examination of the data and recent
articles at hand, we defined keywords and the most important terms of our topics to get
precise searching results. We researched Web of Science, Primo, EBSCOhost, Scopus,
Google Scholar and further used Statista for our main statistics, and relevant pages of
industry associations and institutions for further information.
References for all material were saved to EndNote Web, provided by Jönköping
University, to create citations and the bibliography efficiently. Research papers, articles,
statistics, and other data have been imported into the software database DEVONthink
Pro 3. This platform allows for organising and saving articles and notes. Additionally, it
enhances searching, classifying the contents of articles, analysing similarities and
relationships between articles, and a linked and organised way of note-taking.
Primarily, there is various academic literature examining the adoption of mobile payment
services, focusing on stellar examples as the M-Pesa and its innovation trajectory across
time and place in Kenya and eastern Africa (Oborn et al., 2019), Swish of Sweden
(Rehncrona, 2018), or AliPay and WeChat Pay adoption antecedents by integrating

6
context awareness (Cao & Niu, 2019) or integrating mindfulness to mobile payment
adoption (Flavian et al., 2020). However, there is little recent research about the reasons
for mobile payment adoption in Germany as, statistically, its adoption has been increasing
at a low rate before the pandemic. Still, one relevant study has focused on mobile operator
subscriber-based payment services, which, however, today are all no longer exist (Gerpott
& Meinert, 2017).
Nonetheless, the pandemic has strongly influenced the adoption of other payment
methods in Germany, as recent statistics by the German central bank and the German
Banking Association have shown (Deutsche Bundesbank, 2021; Statista, 2021a).
Accordingly, this increase can be seen in the users’ expectations of mobile payments’
contactless characteristic in contributing to social distancing and measures and personal
contamination avoidance by limiting physical contact. Furthermore, due to the lockdown
measures, there were increased “Click & Collect” offerings introduced by businesses as
a possibility of maintaining operations and offering further social distancing, where
customers pre-ordered goods online or by phone to pick them up outside of the retail store
(ZEIT Magazin, 2021). Hence, as it was necessary to order by electronic means, this could
further have supported mobile payment adoption.
2.2 Introduction of Mobile Payment Services (MPS)
2.2.1 Mobile Payment Services
In the following, we will present definitions and a statistical overview of the development
and prediction of mobile payments in Germany in order to better understand mobile
payments as technology and provide information on its status quo in Germany, thus
present the underlying context. Mobile payment services are increasingly establishing
within our society, increasingly gain importance as a payment method, and are projected
to foster and establish further (Deutsche Bank AG, 2020b; Statista, 2021b). Looking at
the definitions of mobile payment services by Henkel (2002), Schilke, Wirtz, and Schierz
(2010), or Statista (2021a), they commonly emphasise the mobile device as a crucial key
component for the transfer of monetary value, although there are some differences in the
definition of the mobile device itself as some definitions include all mobile
communication devices and others focus on the smartphone. Additionally, the significant
difference between mobile payment services is the environment in which the payment

7
process is executed. Mobile payment services are utilised for payments between peers
(P2P) in the e-commerce field, as well as for in-store mobile point-of-sale (M-POS)
payments (Gerpott & Kornmeier, 2009; Henkel, 2002; Schilke et al., 2010).
While mobile payments in the P2P and m-commerce fields do not require any physical
contact as they usually are executed place-independently, transactions in the mobile POS
field rely on contactless interaction between a smartphone application that saved a digital
payment card in a mobile wallet and a merchant’s payment terminal (Gerpott & Meinert,
2017; Schilke et al., 2010). In this case, data is transferred through, e.g., NFC or starting
the payment by scanning a QR-code (Gerpott & Meinert, 2017; Statista, 2021d). Such
contactless payments are not only able to be executed through a mobile wallet but also
with a physical card, which is the more common use case of contactless payments but not
referred to as mobile payment (RND/dpa, 2021).
In the market of mobile payment platforms, many tech companies strive to establish their
services and offer payment platforms as an added feature to their existing service.
Established companies like PayPal, with a primary focus on offering a payment service
platform, increasingly emphasise mobile solutions, and tech companies like Apple,
Amazon, and Facebook enter the market by extending their service to an integrated
shopping ecosystem for their customers (McKinsey & Company, 2020; Statista, 2021b).
In China, mobile payments already fostered themselves as established payment mean
much more than in Europe. Social messaging services offer payment services like Alipay
and WeChat Pay which cover all of the three designated mobile payment purposes and
count 555.6 million users, of which have conducted mobile POS payments in 2021 with
an average transaction value of $ 2,060 per user and year (Statista, 2021b). The
acceptance of mobile payment solutions in European markets is projected to steadily
increase over the following years (Deutsche Bank AG, 2020b; McKinsey & Company,
2020; Statista, 2021a, 2021b). When it comes to Germany, mobile payment acceptance
is relatively low, and the most used payment means are cash and proprietary Girocard
(Deutsche Bank AG, 2020a; Statista, 2021b).
Nevertheless, growth predictions for the German market allocate a high potential for
mobile payments compared to other European countries (Statista, 2021d). The mobile

8
POS transaction value for 2021 is projected to reach € 18.961 billion and growing to
€ 55.407 billion in 2025 through an annual growth rate of 30.75%. The number of users
is projected to reach 20.6 million by 2025, representing almost 25% of the German
population (Statista, 2021d). Consequently, in a European comparison, Germany will
have a higher amount of users compared to France (13.8m), Great Britain (18.9m), and
Spain (10.2m) (Statista, 2021b). In Germany, current users of mobile payments can be
categorised by three moderating factors: income, gender, and age. A study about mobile
POS users in Germany showed that users are most frequently male (74.2%) between 25
and 44 years old (61.8%) and individuals who have a high income (47.5%) (Statista,
2021a, 2021b, 2021d). The impact of these moderating factors seems to be significantly
stronger in Germany than, e.g., in the USA and China, as income and gender of a user in
2020 were nearly equally distributed over the different categories (Statista, 2021b).
2.2.2 Consolidation and European Payment Initiatives
Several financial and digitalisation initiatives have urged and strongly advocated a
digitalisation of the European payment landscape, which can serve detrimental to the
fragmentation of the European single market and allows for the implementation of
auxiliary services such as eID and foster European-made technical services and products
(Hackl, 2020). The European Commission is poised to reap the full potential of PSD2 and
set instant payments through the SEPA Instant Credit scheme as the new standard for
commerce and intra-personal credit transfers. Nonetheless, its success depends mainly on
factors such as market readiness and consumer adoption. Concrete measures and
incentives to increase and drive the adoption rate and building the necessary infrastructure
are unclear from a consumer perspective. Current initiatives like the European Payment
Initiative (EPI) or P27 in the Nordic countries aim at providing consumers within a more
significant geographical area a consolidated payment scheme (EPI Interim Company SE,
2021; P27 Nordic Payments Platform, 2021). These schemes aim to provide a seamless
payment experience for consumers, including actions for mobile payment services. While
Europe’s current mobile payment scheme landscape is highly fragmented and
increasingly dominated by players outside the EU, the sensitisation for personal data
security and who is in control of sensitive data like financial information is increasing.
Therefore, the introduction of a consolidated payment scheme, initiated by official
European institutions and carried out by the incumbent financial institution, may impact

9
the adoption of mobile payment services within Europe. As these initiatives are still in
conception, there is no official research of how the adoption might be impacted.
Consequently, we will not focus on evaluating the success chances of the initiatives but
reflect the results with the known information about the initiatives in the discussion.
2.3 Mobile Payment Research
The adoption of mobile payments is a key theme in the existing technology adoption
research, hence, previous research investigated mobile payment adoption from various
ankles, integrating a set of theoretical frameworks and variables (Dahlberg et al., 2015;
Zhao & Bacao, 2021). Zhao and Bacao (2021) consolidated important theoretical
frameworks and the including elements applied in the mobile payment adoption context,
which can be derived from Appendix A. After investigating the existing literature, three
models distilled as commonly accepted and suitable for the objective of our study. Thus,
the Technology Acceptance Model (TAM), the Diffusion of Innovation Theory (DOI), as
well as the Unified Theory of Acceptance and Use of Technology (UTAUT) will be
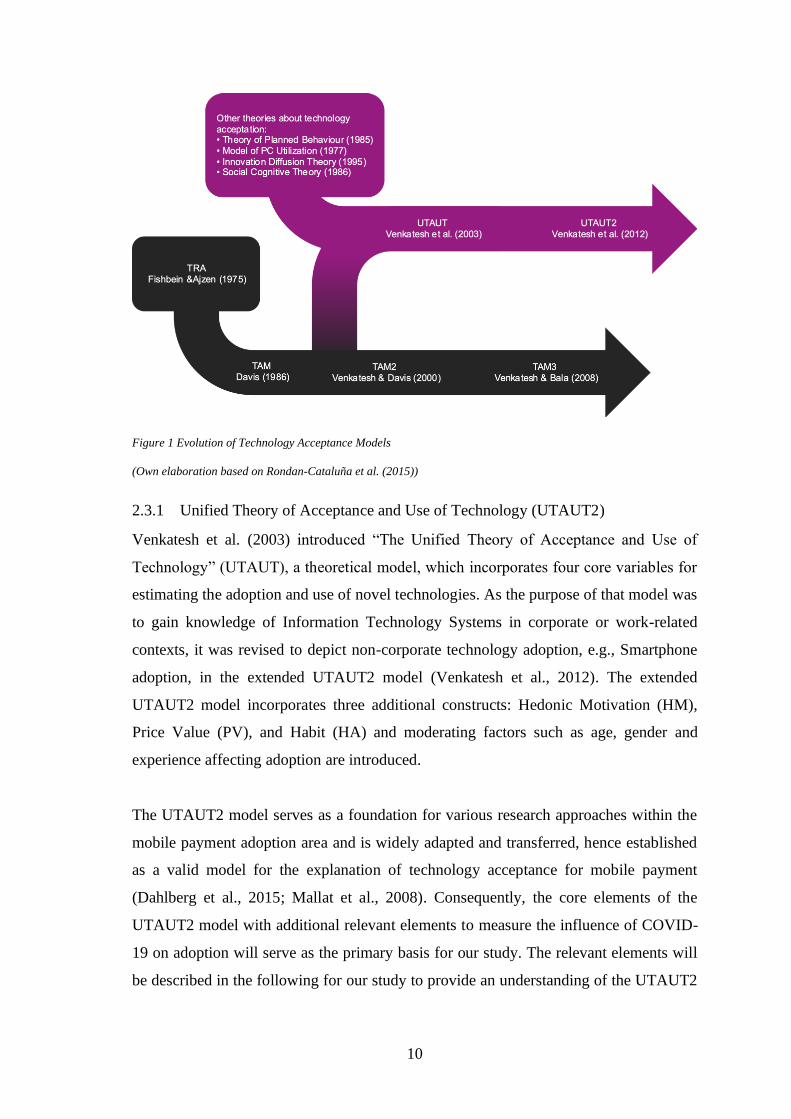
introduced in the following. Based on Rondan-Cataluña et al.(2015) Figure 1 illustrated
the evolution of the UTAUT and TAM models. While the TAM models originate in
Davis’ (Davis, 1989) adoption of the Theory of Reasoned Action (TRA) (Fishbein &
Ajzen, 1975), UTAUT stems from the combination of various models aiming to provide
an unified view (Venkatesh et al., 2003).
Relevant empirical studies investigating consumers’ mobile payment adoption behaviour
prior to and during the COVID-19 pandemic by applying these models will then be
described in the upcoming sections 2.4 and 2.5.
10
Figure 1 Evolution of Technology Acceptance Models
(Own elaboration based on Rondan-Cataluña et al. (2015))
2.3.1 Unified Theory of Acceptance and Use of Technology (UTAUT2)
Venkatesh et al. (2003) introduced “The Unified Theory of Acceptance and Use of
Technology” (UTAUT), a theoretical model, which incorporates four core variables for
estimating the adoption and use of novel technologies. As the purpose of that model was
to gain knowledge of Information Technology Systems in corporate or work-related
contexts, it was revised to depict non-corporate technology adoption, e.g., Smartphone
adoption, in the extended UTAUT2 model (Venkatesh et al., 2012). The extended
UTAUT2 model incorporates three additional constructs: Hedonic Motivation (HM),
Price Value (PV), and Habit (HA) and moderating factors such as age, gender and
experience affecting adoption are introduced.
The UTAUT2 model serves as a foundation for various research approaches within the
mobile payment adoption area and is widely adapted and transferred, hence established
as a valid model for the explanation of technology acceptance for mobile payment
(Dahlberg et al., 2015; Mallat et al., 2008). Consequently, the core elements of the
UTAUT2 model with additional relevant elements to measure the influence of COVID-
19 on adoption will serve as the primary basis for our study. The relevant elements will
be described in the following for our study to provide an understanding of the UTAUT2

11
structure. Figure 2 illustrates the UTAUT2 model and the relationships between the
elements moderated by age, gender, and experience and indicated by the numbers.
Figure 2 UTAUT2 Model
(Own elaboration based on Venkatesh et al., 2012)
2.3.1.1 Price Value
In addition to the earlier UTAUT model, the UTAUT2 incorporates the factor of PV as
in contrast to a corporate setting (Venkatesh et al., 2012), consumers usually are
personally responsible for any monetary cost of acquiring a new technological service or
product. Hence, cost and pricing structures can significantly influence consumers’
willingness to adopt or use technology. We estimate that price value will follow a
conscious or unconscious trade-off between expected value derived from a technology’s
monetary costs (Venkatesh et al., 2012). However, in the European Union, payment
surcharges are uncommon as these a mitigated by the PSD2 directive as a consumer at
online or offline POS by payment providers. However, banks can charge their customers
fees for conducting payments, as some of Germany’s smaller banks levy, thus,
influencing payment behaviour. Due to the few banks levying these fees, this factor will

12
not be relevant in the field of mobile payment services in Germany and our study, hence
is illustrated in Figure 2 with a brighter colour.
2.3.1.2 Hedonic Motivation
Hedonic motivation is the pleasure or enjoyment a consumer experiences or is expected
to experience using a specific technologic product or service, which has been an important
motivating factor for technology acceptance and use (Brown & Venkatesh 2005).
Information Systems literature has established that certain factors influence acceptance
and use of technology. Similarly, in consumer contexts, HM has been established as an
essential determinant to influence technology acceptance and use (Brown & Venkatesh
2005; Childers et al., 2001). Similarly, we expect the consumer to derive pleasure through
visual and acoustic stimuli when paying by mobile payment solutions as visual, acoustic,
and vibrotactile stimuli can nudge consumers into specific directions (Hadi & Valenzuela,
2020; Manshad & Brannon, 2021). Hence, e.g., the vibrotactile, visual, and acoustic
feedback when using Apple Pay or the Confetti Screen on PayPal could lead to greater
enjoyment of using mobile payment services.
2.3.1.3 Habit
Based on prior research on technology use, HA has been adopted in the revised UTAUT2
model. Consumers tend to habitualise and perform certain behaviours automatically
because of previous practice. There are specific distinctions to make as to when to equate
habit with automaticity according to Kim, Malhotra, & Narasimhan (2005) and Limayem,
Hirt, & Cheung (2007). On the one hand, it is derived from a continuance and temporal
aspect since technology has been used. Once it has been used for a particular passage of
time, mostly several months, individual behaviour becomes automated, thus, habituated.
On the other hand, once a consumer recognises certain practices as automatic, it becomes
a habit. Due to the operationalisation of habit as prior use, it can also factor in the
experience with technology (Kim et al., 2005). However, the experience cannot solely
develop into a Habit. Concerning payment methods, we expect habit to hinder the
adoption of mobile payment methods when it comes to micro-payments. However, as the
UTAUT primary foci are to examine consumers’ technological expectations (Venkatesh
et al., 2011), it is insufficient in explaining mental expectations of using mobile payment
services complementing its technological use intention during the COVID-19 pandemic.
13
2.3.1.4 Effort Expectancy
As part of the UTAUT2 model, Effort Expectancy (EE) describes the degree of ease of
use a person believes related to using a technological system. EE derives from the key
concept of previously researched TAM constructs such as Ease of Use as well as
Perceived Ease of Use and Complexity (Venkatesh et al., 2003; Venkatesh et al., 2012).
Drawing on previous research on EE in the field of technology acceptance and use of
technology, EE was outlined as an influencing factor for Intention to Use (ITU).
2.3.1.5 Social Influence
Social Influence (SI) in the context of the UTAUT2 model is defined as the extent to
which individuals perceive other individuals believe the according technology should be
used (Venkatesh et al., 2003). Hence, SI and analogous the TAM construct Social Norms
refer to the explicit or implicit influence of an individual’s environment and the
perception of its environment on the intention to use a certain technology. Key concepts
of SI derived from previous models incorporated in the UTAUT2 model can be described
as subjective norms, social factors, and image (Venkatesh et al., 2012). Current literature
outlines three processes of how Social influence impacts the intentional use behaviour:
compliance (comply with social pressure), internalisation (altering individual’s belief
structure), and identification (responding to potential social status gains) (Venkatesh &
Davis, 2000). Additionally, mandatory or voluntary use of technology is important in
adopting and relying on others’ opinions as, especially in mandatory situations, external
opinions are crucial (Venkatesh et al., 2012).
2.3.1.6 Performance Expectancy
Performance Expectancy (PE) describes the extent to which individuals benefit from
using technology to perform certain actions (Venkatesh et al., 2012). Venkatesh et al.
(2003) described usefulness, extrinsic motivation, job fit, relative advantage, and outcome
expectations as significant variables for PE (Venkatesh et al., 2003). Previous studies
examined especially the usefulness and rapidity of the payment process as central
variables in the PE within the context of mobile and contactless payments, hence positive
drivers for the intention to adopt mobile or contactless payments (Karjaluoto et al., 2019;
Morosan & DeFranco, 2016; Venkatesh et al., 2012).

14
2.3.1.7 Facilitating Conditions
Facilitating Conditions (FC) describes the individual’s perception of available resources
and support to perform or use a particular technology. Applied to mobile payment
services, FC define the operational infrastructure supporting the use of mobile payments
(Oliveira et al., 2016; Venkatesh et al., 2012). The higher the perceived accessibility of
the resources, the higher the intention to use that technology.
2.3.1.8 Intention to Use
Core elements of the UTAUT2 are Behavioural Intention and Use Behaviour. In line with
previous studies, we will refer to users’ intention to use mobile payments by the element
Intention to Use (ITU) that combines Behavioural Intention and Behavioural Intention to
Use from the TAM (Baudier et al., 2021; Davis, 1989; Karjaluoto et al., 2019; Venkatesh
et al., 2012). Venkatesh et al. (2012) claim that the UTAUT2 model “has distilled the
critical factors and contingencies related to the prediction of behavioral intention to use
a technology and technology use” (Venkatesh et al., 2012, p. 157). Consequently, the
UTAUT2 model and its elements aim at explaining the reason for an individual’s
intention to use and use behaviour (Venkatesh et al., 2003; Venkatesh et al., 2012).
2.3.1.9 Moderating Factors
The UTAUT2 model describes age, gender, and experience as moderating factors that
influence the model’s core elements differently (Oliveira et al., 2016; Venkatesh et al.,
2012). At the same time, the model claims age and gender to be a moderating factor for
the relationship between all of the model’s elements and behavioural Intention to Use
technology, experience moderates the impact of EE, SI, FC, HM, and HA on Behavioural
Intention to Use technology. Additionally, age and experience moderate the effect on Use
Behaviour (Oliveira et al., 2016; Venkatesh et al., 2012).
Furthermore, compared to the original UTAUT, the UTAUT2 excluded voluntariness as
moderating factor since when focusing on consumer behaviour, the mandatory adoption
of technology does not apply. Venkatesh et al. (Oliveira et al., 2016; Venkatesh et al.,
2012) describe that consumers do not inherit an organisational mandate, which provides
the basis for any mandatory use of technology. In the context of COVID-19, the absolute
mandatory use of contactless methods in Germany and the payment environment does
not apply since the usage of such technologies in terms of hygienic measures were

15
recommended but not forced (WHO, 2020). Consequently, mobile payment services,
especially in the context of contactless payments at the in-store point of sales during the
COVID-19 pandemic, did not underly any absolute mandatory character, while the social
pressure created a societal expectation for an adaption (Betsch et al., 2020). Nevertheless,
this condition is covered by the UTAUT2 elements of SI and FC. Hence voluntariness
will not be included in our study.
Additionally, recent statistics focusing on the demographic variables of POS mobile
payment usage in Germany indicate that age, gender, and income influence the adoption
of mobile payments (Statista, 2021d). Following Statista (2021d), POS mobile payment
usage is exceptionally high for individuals between 25 and 44 years old, male and with
high income.
2.3.2 Technology Acceptance Model (TAM)
The TAM has been developed and applied to study technology acceptance behaviours in
various IT contexts and sheds light on determinants on the ITU and predicting acceptance
of information systems and information technology by individuals. The TAM presents
two relevant belief variables: Perceived Ease of Use and Perceived Usefulness,
representing the primary driver of the user’s intention to technology use. Perceived
Usefulness is the degree to which a user expects a particular technology to enhance their
performance by its use; Perceived Ease of Use describes the degree to which a user
expects to use a technology free of effort (Davis, 1989). This model garnered
comprehensive support, and researchers have produced relatively consistent results on
users’ acceptance behaviour (Di Pietro et al., 2015). Consequently, Venkatesh & Davis
(2000) have further developed the TAM 2, where the factor of attitude has been removed
and added subjective norm in addition to other hypotheses such as image, job relevance,
or experience. Several additions and modifications of the original TAM model have been
proposed to examine different phenomena and antecedents for mobile payment adoption
in literature. In addition, many prior empirical studies have combined different models
such as TAM and DOI and their elements, e.g., in conducting consumers attitudes towards
mobile payment services in Sweden (Arvidsson, 2014). Since TAM and the UTAUT
theories are closely linked, the elements can also be linked to each other, hence Appendix

16
B presents a more detailed view of how the elements relate to each other and from which
theory they stem from.
2.3.3 Diffusion of Innovation Theory (DOI)
The diffusion of innovation theory (DOI) provides an understanding of how a product or
service gains traction and disperses itself throughout a population (Johnson et al., 2018).
Further, Rogers (2003) defined diffusion as a process by which an innovation spreads
across a social system over time, suggesting that compatible, simple, triable, relatively
practical, and innovative visual solutions were likely to be adopted quickly. Hence,
academic researchers have used DOI to investigate consumers’ adoption of innovation or
technology in different areas contexts such as online shopping (Bigné‐Alcañiz et al.,
2008), online banking (Van der Boor et al., 2014), or multimedia messaging services (Hsu
et al., 2007). Distinctively, Johnson et al. (2018) have examined limitations of rapid
adoption m-payment (mobile payment) services through the lens of DOI while focusing
on the impact of perceived risk. Nevertheless, the COVID-19 pandemic has been
expected to have had a significant effect on the mobile payment services’ security and
privacy concerns.
Furthermore, we expect Personal Innovativeness (PI), “the willingness of an individual
to try out any new IT” (Yi et al., 2006, p. 351), to play an essential role in determining
the outcomes of user acceptance of technology. Consequently, we will apply the construct
PI of the DOI for understanding drivers of the recent adoption of mobile payment services
in the context of our study.
2.4 Mobile Payment Adoption Research
Reviewing the relevant academic mobile payment literature, three significant research
fields that so far have been targeted for empirical studies of mobile payment services
appear. Dahlberg’s et al. (2015) literature study is focusing on mobile payment literature
from 2007 to 2014 and outlines that strategy and ecosystems, technology, and adoption
are the three major key concepts investigated, which additional studies confirm (Dahlberg
et al., 2015; Flavian et al., 2020; Schilke et al., 2010). In general, the adoption of
technology has been a phenomenon studied intensively, leading to various models such
as the previously described UTAUT2, TAM, and DOI, trying to understand the variables
of consumer adoption of technology. Screening the literature revealed that most of the

17
recent mobile payment literature follows these three themes outlined by Dahlberg et al.
(2015) and combines the themes with various models of the information system field,
hence increasingly perceive mobile payment as an interdisciplinary theme. Additionally,
social sciences and psychological aspects were added to support existing understanding
beliefs (Flavian et al., 2020; Sun et al., 2016). Hence, e.g., previous technology adoption
models are combined with elements like mindfulness to enrich the validity of the
explanation (Flavian et al., 2020; Sun et al., 2016).
Previous literature on mobile payment adoption investigated various elements, their
relationship and their impact on the adoption of mobile payment services. Oliveira et al.
(2016) proved in their study a significant impact of compatibility, perceived technology
security, performance expectations, innovativeness, and social influence on mobile
payment adoption. Additionally, they claim those elements impact the intention to
recommend the technology (Oliveira et al., 2016). Further, the study did not reveal a
statistically significant impact of EE, FC, HM and price value on the intention to adopt
mobile payment services (Oliveira et al., 2016). Karjaluoto (2021) and Slade and Dwivedi
et al. (2015) utilise similar elements, based on the UTAUT2 model explaining technology
acceptance behaviour. While Karjaluoto (2021) proved a significant impact of EE, PE,
and HA, they rejected the influence of HM on the intention to adopt mobile payment.
In contrast, Slade et al. (2015) rejected the influence of EE but integrated the elements of
Innovativeness and Perceived Risk (PR) and reveals a significant effect on ITU. They
argue that the higher the risk of using mobile payments is perceived, the lower the
intention to use and the more tech-savvy and innovation drives users to perceive
themselves, the higher the intention to adopt mobile payments (Slade, Dwivedi, et al.,
2015). While the significance of EE as determining factor for adoption behaviour differs
throughout the literature, previous research commonly highlights the major influence of
PE on the intention to use mobile payment services, even though various determinants
were investigated and different connections, e.g., to EE, SI or Risk as a determining
constructs for PE applied (Khalilzadeh et al., 2017; Oliveira et al., 2016; Slade, Dwivedi,
et al., 2015; Zhao & Bacao, 2021). Additionally, Karjaluoto (2021) integrated and
confirmed, similar to Slade et al. (2015), PR, besides items of the consumer brand
engagement model, thus confirmed the influence of users’ interaction with the mobile

18
payment service provider and the brand loyalty. As previously mentioned, Flavian et al.
(2020) emphasise mindfulness as a central factor influencing the adoption behaviour.
Additionally, the authors provide empirical data outlining Perceived Ease of Use,
Perceived Usefulness, Subjective Norms, and Attitude to significantly influencing mobile
payment adoption behaviour (Flavian et al., 2020). Mindfulness is also claimed by Sun et
al. (2016) to highly emphasise the importance of the perceived usefulness of mobile
payment services.
In reaction to the completely new circumstances driven by the COVID-19 pandemic,
mobile payment research models and models examining the impact of COVID-19 on
other technology acceptance need to be investigated for validity (Baudier et al., 2021).
As the pandemic is still ongoing, there is little academic research aiming at the impact the
pandemic has on current beliefs and existing models explaining the behaviour of mobile
payment and technology adoption in general. Some researchers aimed to provide new
insights into the impact of certain geographical areas or technologies, including mobile
payment-related fields. While Baudier et al. (2021) investigate the impact of COVID-19
on patient’s perception of teleconsultation, Zhao and Bacao (2021) investigate the
COVID-19 impact on mobile payments in China, and Flavian et al. (2020) focus on
mobile payment adoption in Spain and the USA during the pandemic. These studies
provide important insights into the impact of the pandemic on technology acceptance and
adoption but utilise a specific frame.
Consequently, they argue that further research is needed to fully understand the impact
of COVID-19 on mobile payment services and validate their results. At the same time,
Baudier et al. (2021) claim that their results might be applied “not only in a medical
context but also for the adoption of other technologies, which help to avoid direct physical
contact, such as contactless payment” (Baudier et al., 2021, p. 7), and Flavian et al. (2020)
emphasise the geographical focus of their study impacting the transferability. While
Flavian et al. (2020) base their research on the technology acceptance model (TAM),
Baudier et al. (2021) and Zhao and Bacao (2021) found their research model on the
UTAUT model complemented with specific elements. While Baudier et al. (2021) and
Zhao and Bacao (2021) commonly rejected the influence of EE on the behavioural
intention to adopt mobile payment during the pandemic, they describe different results

19
for SI as Zhao and Bacao (2021) reveal a significant prediction power of SI for ITU as
well as for the Perceived Benefits (PB) related to mobile payments while Baudier et al.
(2021) outlined no relation between SI and ITU. Additionally, Baudier et al. (2021)
introduced Contamination Avoidance (CA) initially and Availability (AV) as
determinants for PE during the pandemic, which they confirmed as an integral predictor.
Similary, Zhao and Bacao (2021) verified EE and trust as predictors for PE. Relating the
Trust and PR elements, both authors confirm that the perception of security and safety
connected to mobile payments influence the adoption behaviour (Baudier et al., 2021;
Zhao & Bacao, 2021). Furthermore, similar to Slade’s et al. (2015) and Khalilzadeh’s et
al. (2017) prior pandemic research on mobile payment adoption, Baudier et al. (2021)
confirmed the impact of SE and PI while contextualising them towards EE in regards to
telemedical technology acceptance during the pandemic. Conjointly Baudier et al. (2021)
and Zhao and Bacao (2021) confirmed the research findings before the pandemic, that PE
represents the main driver for the intention to use mobile payments, though they
integrated different first-level determinants.
2.5 Mobile Payment Research in Germany
When reviewing the literature about mobile payment services, the investigated databases
reveal that there has been little academic research on mobile payment services in
Germany. Exemplary, when executing a basic search with the term “mobile payment” on
the Web of Science database, it displays more than 2,600 results, which reduces to 12
when searched for “Germany” in any field within the search results. Additionally,
applying the same search in Scopus, using “mobile” and “payment” as search terms
included in title, abstract, or keywords, results in more than 4,600 research papers and
reduces to 61 when adding “Germany” and limit the subject to the business, management,
and accounting fields to remove technically focused research.
In the academic literature, two relevant studies investigate mobile payment services
adoption in Germany. Gerpott and Meinert (2017) investigated in their study „Who signs
up for NFC mobile payment service? Mobile network operator subscription in Germany”
how mobile payment service users differ from non-users and how this affects their actual
use behaviour. While Gerpott and Meinert (2017) investigated a sample group of mobile
payment service users by accessing data from a mobile network operator, hence relying

20
on secondary data, Schilke et al. (2010) created a sample group representative of the
German population and covering all variances. Gerpott and Meinert (2017) claim that
their study further extends mobile payment adoption research as they shifted from user
perceptions as determinants to objective user characteristics. Hence, they revealed that
early adopters of mobile payment services tend, e.g., to own a higher-priced smartphone
with a smaller screen and the intention to adopt mobile payments highly correlates with
mobile communication service subscription usage like music streaming subscriptions
(Gerpott & Meinert, 2017).
In contrast, Schilke et al. (2010) focused on understanding consumer acceptance of
mobile payment services in Germany and outline determinants that influence the
acceptance through their conceptual model based on an extension of the TAM. The
authors outline “strong effects of compatibility, individual mobility, and subjective norm”
(Schilke et al., 2010, p. 209) on the acceptance of mobile payment services. However,
they outline perceived compatibility with accounting for 82% by far as the main driver
for the intention to adopt mobile payments. Consequently, Schilke et al. (2010) and
Gerpott and Meinert’s (2017) studies differ in their research objective and research design
by first investigating acceptance determinants in the perceived interaction of the user with
the technology and the latter investigating socio-demographic characteristics as
determinants for the usage.
21
3 Development Research Model and Hypotheses
Based on the literature analysis, we present our proposed research model in this chapter,
which combines important constructs of the UTAUT2, TAM, DOI models and relevant
items derived from previous studies that are relevant within our context to explain mobile
payment adoption in Germany during the pandemic. Further, we propose hypotheses
describing the relationships of the elements.
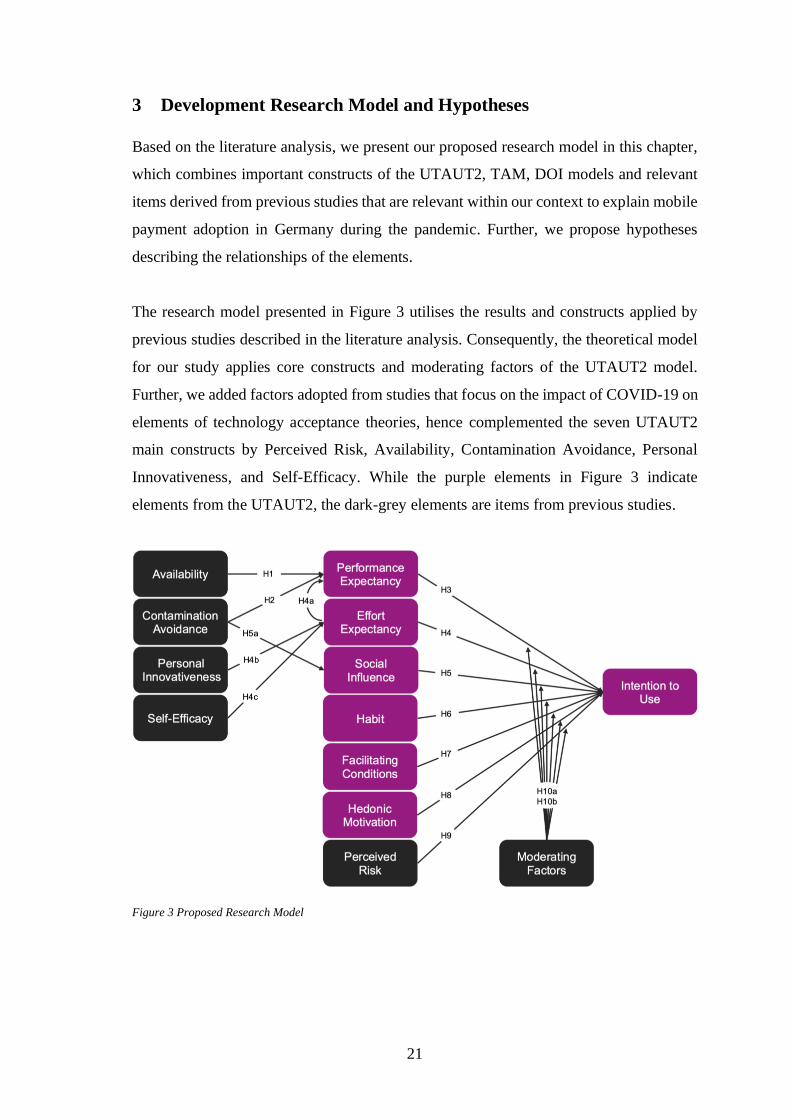
The research model presented in Figure 3 utilises the results and constructs applied by
previous studies described in the literature analysis. Consequently, the theoretical model
for our study applies core constructs and moderating factors of the UTAUT2 model.
Further, we added factors adopted from studies that focus on the impact of COVID-19 on
elements of technology acceptance theories, hence complemented the seven UTAUT2
main constructs by Perceived Risk, Availability, Contamination Avoidance, Personal
Innovativeness, and Self-Efficacy. While the purple elements in Figure 3 indicate
elements from the UTAUT2, the dark-grey elements are items from previous studies.
Figure 3 Proposed Research Model

22
Based on the extant literature on mobile payment adoption and the research approaches
to understand the impact of COVID-19 on technology adoption, we developed the
research model in Figure 3 and formulated hypotheses that describe the relationship
between the elements of the model. The hypotheses are derived from previous research
on mobile payment and technology adoption but lack proof of validity in their
transferability to understand the impact of COVID-19 on the intention to adopt mobile
payment in Germany (Baudier et al., 2021; Oliveira et al., 2016). Consequently, we
adapted relevant elements of previous studies and models, which led to twelve main
elements moderated by age and gender. The central model’s central element is Intention
to Use, as it indicates the likeliness of users to adopt mobile payments. Table 1 presents
the sources from which we derived each element, the hypothesis, and the questions
accordingly.
Similar to the study of the adoption of teleconsultation during COVID-19 of Baudier et
al. (2020), we intend to include AV as a hypothesis and factor determining the adoption
of mobile payment methods. In the context of teleconsultation, AV was tested and seen
as the possibility of individuals to use teleconsultation and the possibility to experience
medical consultation even if quarantining or other measures hinder in-person
consultation. In the field of mobile payment services, this can be seen as greater
availability of financial transactions as they do not include physical elements, which
increases the availability in an environment with restricted mobility. Further, with
increased prominence and emphasis on contactless transactions for consumers, there is a
higher perceptibility of mobile payment services, and more businesses might offer
electronic payment methods. Thus, increasing the perceived PE of mobile payment
services through AV. Therefore, we posit the following hypothesis:
H1: Availability has a positive effect on the Performance Expectancy to
adopt m-payments during the COVID-19 pandemic
Contamination Avoidance (CA) is defined as the extent to which an individual adjusts his
behaviour by adopting technology or habits. In modern society, there are many diseases
where individuals adjust their behaviour accordingly (HIV, Ebola, or other contagions)
(Celum et al., 2020). The fear of contagion can even inadvertently affect individuals’
behaviour towards objects or environments by the fear of potentially be contaminated

23
with germs, viruses, or infections (Hazée & Van Vaerenbergh, 2020). Individuals can
project disgust physical contact in various situations, such as public transport,
supermarkets, or restaurants. Thus, individuals try to mitigate such situations and take
appropriate actions. In the context of the COVID-19 pandemic, there worries about the
longevity of the infectiousness of SARS-CoV-2 virus particles on surfaces, banknotes,
and coins as several types of germs, such as the influenza virus, have been proven to be
identifiable on banknotes (Riddell et al., 2020; Thomas et al., 2008). Furthermore, when
exchanging banknotes or coins, there is the possibility of unintentional physical contact
with the cashier or waiter if exchanged directly and without a tray or similar as has been
done early during the pandemic. Therefore, the WHO and other governmental agencies
promote the use of contactless payment methods such as mobile payment. We expect that
some users might have already favoured contactless payment solutions over cash before
the pandemic because of fear or disgust but not as prominent as during the pandemic.
Hence, individuals might perceive mobile payments as a suitable payment option to
reduce fear and infections during the COVID-19 pandemic. Thus, we posit the following:
H2: Contamination Avoidance has a positive effect on the Performance
Expectancy to adopt m-payments during the COVID-19 pandemic
Performance Expectancy (PE) is defined as “the degree to which an individual believes
that using the system will help him or her to attain gains in job performance” (Venkatesh
et al., 2003, p. 447). For mobile payment services, the usefulness and swiftness of the
payment process reduces transaction time during checkout, where time efficiency could
be considered a clear performance benefit. Moreover, in direct payment situations
towards peers, it avoids the need to carry cash. Furthermore, using mobile payment
services at POS’ allows to avoid the need to verify with PIN or signature, and on e-
commerce one can refrain from checking into your bank account for transfers.
Khalilzadeh et al. (2017) examined the determinants of NFC-based contactless payment
acceptance in the restaurant industry and found that utilitarian PE has a more substantial
impact on intention to use contactless payment systems than hedonic PE does. Similarly,
Morosan and DeFranco (2016) found that PE is the strongest predictor of intention to use
NFC-based contactless payment system in hotels. In the m-banking services adoption
context, Oliveira et al. (2014) found that, inter alia, PE positively affects the behavioural
intention to adopt. In addition, Herrero and San Martín (2017) found out that one main

24
driver of users’ Intention to Use social network sites to publish content is PE. In line with
these findings, we expect PE to be the strongest predictor of Intention to Use and propose
the following hypothesis:
H3: PE has a positive relationship on the Intention to Use m-payments
during the COVID-19 pandemic
Effort Expectancy (EE) is “the degree of ease associated with consumers’ use of
technology” (Venkatesh et al., 2003, p. 450). Like PE, EE is also derived from the
traditional UTAUT model and variables. Several studies have investigated the
relationship between EE and Intention to Use information technology and systems, such
as m-banking (Alalwan et al., 2017) and mobile technologies (Oh et al., 2009).
Magsamen-Conrad et al. (2015) established that EE and Facilitating Conditions (FC)
positively predict tablet use intentions. Alalwan et al. (2017) showed that behavioural
Intention to Use m-banking services is significantly and positively affected, inter alia, by
EE. Since our study extends the original UTAUT2 model using additional constructs, we
expect the constructs Personal Innovativeness (PI) and Self-Efficacy (SE) to influence
EE positively. Rogers (2003) defined early adopters with a high degree of perceived
personal innovativeness as comfortable with high levels of unfamiliarity and willing to
experience higher levels of risk, thus, higher effort expectancy levels. In addition, SE as
construct was examined in the first UTAUT model and derived from the social cognitive
theory model SCT model (Venkatesh et al., 2003). It can be described as an individuals’
“judgments of their capabilities to organize and execute courses of action required to
attain designated types of performances ... not with the skills, one has but with judgments
of what one can do with whatever skills one possesses” (Bandura, 1986, p. 391). In prior
studies SE has been examined for predicting EE, while not continuously to be proven
(Baudier et al., 2021; Maillet et al., 2015). Therefore, we posit the following hypotheses:
H4: Effort Expectancy has a positive effect on the Intention to Use to adopt
m-payments during the COVID-19 pandemic.
H4a: Effort Expectancy has a positive effect on the Performance
Expectancy to adopt m-payments during the COVID-19 pandemic
H4b: Personal Innovativeness will positively affect Effort Expectancy
H4c: Self-Efficacy will positively influence Effort Expectancy

25
In the context of e-commerce, Guzzo, Ferri, & Grifoni (2016) have shown that Social
Influence (SI) significantly predicts the frequency of use and adoption of e-commerce
services in Italy. SI describes the effect on an individual’s behaviour after interaction with
other people, organisation, or society. In detail, it consists of the process by which
opinions can be influenced by other individuals (Friedkin & Johnsen, 2011). Thus, the
concept of SI in technology adoption indicates that the external environments determine
individuals’ perceived benefits of new technology. Conclusively, the opinion and advice
of important peers, governments, and society can play a significant role in explaining
user’s adoption of mobile payment services during the COVID-19 pandemic. Markedly,
during the COVID-19, individuals are eagerly discussing recommendations, suggestions,
and opinions from relevant persons, consequently, their opinions and recommendation
affect the individuals’ perceptions and actions. Further, in the context of protecting
oneself and the social environment, we expect an effect between CA on SI. Thus, we
propose the following hypotheses:
H5: Social Influence has a positive effect on Intention to Use m-payments
during the COVID-19 pandemic.
H5a: Contamination Avoidance has a positive effect on the Social Influence
to adopt m-payments during the COVID-19 pandemic
Habits (HA) have been considerably affected by the COVID-19 pandemic and its
restrictions on social contacts and routine procedures. In line with the UTAUT2 model,
Venkatesh et al. (2012) proposed and validated the relationship between HA and ITU. In
our context, individuals who have adopted mobile payment services prior to the pandemic
will have a higher intention to use them during the pandemic. Nonetheless, even if
consumers have not used mobile payment services before the pandemic, novel Habits
could emerge as the new behaviour adopted during the COVID-19 pandemic could stick
and displace existing habits. However, newly situation-specific adopted habits could be
only temporal if users abandon mobile payment services once the cognition of the
COVID-19 pandemic has weakened or one is immunised. We propose that HA is a
significant driver of Intention to Use in our time frame and examination. Moreover, the
effect of HA on ITU could also pose as an indicator of the strength of Habits in the context
of mobile payments, thus indicating the stickiness of the adoption. Therefore, we
hypothesise the following:

26
H6: Habit has a positive relationship with the Intention to Use.
FC refer to the potential users’ perceptions of the resources and support available to use
mobile payment services (Brown & Venkatesh 2005). They are “the degree to which an
individual believes that an organizational and technical infrastructure exists to support
the use of the system” (Venkatesh et al., 2003, p. 453). In the mobile context, facilitating
conditions characterise users with equipped skills for configuring and operating
smartphones with mobile payment applications. The consumers who possess the
operational skills and smartphone to configure and operate mobile devices will promote
the use of mobile payment services. Thus, if consumers are unaware or unfamiliar with
their mobile devices' specifications or their bank accounts do not support them, we expect
it will affect intention to use them (Slade, Williams, et al., 2015). However, the effects of
FC of mobile vary across studies in the mobile payments sector (Alalwan et al., 2017;
Slade, Williams, et al., 2015) and other technology adoption (Baudier et al., 2021). Chen
and Chang (2013) found that FC are positively associated with the behavioural intention
to use NFC mobile phone applications. However, based on the findings from Yang (2010)
and Venkatesh et al. (2012) that FC have a direct positive impact on ITU. Hence, we posit
the following hypotheses:
H7: Facilitating Conditions predict the Intention to Use m-payments during
the COVID-19 pandemic.
Research on acceptance and motivation to use information technology outlines the origin
of motivation to be of two types: intrinsic and extrinsic motivation. Intrinsic or hedonic
motivation describes enthusiasm derived from traits like satisfaction, fun, and pleasure
experienced from using technology, such as executing a payment process with a mobile
device (Allam et al., 2019). Hence, the level of fun and enjoyment that mobile payment
offers can predict hedonic motivation to use a service. In contrast, extrinsic motivation
explains motivation created by monetarily rewarding the performance of activities, such
as granting a discount for using certain payment methods. Consequently, Brown and
Venkatesh (2005) and Van der Heijden (2004) argue that HM strongly influences the
acceptance of technology and ITU. Sharif and Raza (2017) follow the argumentation and
claim HM to impact ITU positively in the case of online banking. We argue that mobile

27
payment services epitomise utilitarian and hedonic values. Thus, HM supports the
intention to use mobile payment services, and consequently, we propose the following:
H8: Hedonic Motivation predicts the Intention to Use m-payments during
the COVID-19 pandemic.
Perceived Risk (PR) is associated with perceived uncertainty and the expectation of losses
through performing actions or using products. Hence, in the case of our study, PR refers
to the perceived potential of losses and uncertainty associated with the payment process
performed with a mobile device. Within digital retail contexts, PR negatively influenced
ITU (Marriott & Williams, 2018). Applied to mobile payments ensuring safe procedures
requires security protocols to be implemented and prevent security vulnerabilities.
Common security aspects that might lower users’ trust in mobile payment services are
that the transaction is performed through a mobile device, including another party in the
transaction process other than the financial institution, which is the most visible
participant for a user within a transaction process. More relevant aspects are the
transaction authentication through the mobile device’s PIN code, which might be a
vulnerability, and risks related to the NFC as a relatively new technology might arise.
Hence, we posit the following:
H9: Perceived Risk has a negative relationship with the Intention to Use.
As included by Venkatesh et al. (2012) in the UTAUT2 or the Karjaluoto et al. (2019),
usage intention of contactless payment systems in Finland examined the effect of gender
and age on ITU with unclear significance levels. However, there is predominant support
regarding previous research that male individuals are more likely than their female
counterparts to use mobile payment methods (Gerpott & Meinert, 2017; Ginner, 2018).
In addition, technology acceptance studies have found negative relationships between age
and the inclination to use and adopt new technologies (Morris & Venkatesh, 2000; Morris
et al., 2005). Thus, to test the moderating effect of gender and age we propose the
following hypotheses:
H10a: Gender moderates the relationships among the constructs of the
model.
H10b: Age moderates the relationship among the constructs of the model.

28
4 Methodology
In the following chapter, we outline our research method and motivate the choices.
Accordingly, we describe overall concepts of research philosophies, followed by
explaining our research approach and strategy. Further, we describe the applied methods
for our data collection and data analysis. Lastly, we describe how we ensure the quality
of the research and the measures taken to respect ethical considerations.
4.1 Research Philosophy
The research philosophy investigates and clarifies the relationship between the gathered
data and the theory. There are several reasons why research philosophy has to be
considered in a research study. Researchers get an understanding of the role and
significance of their research methods. Furthermore, the research philosophy supports the
researchers in finding and defining the right research design and guiding the research
design choices (Easterby-Smith et al., 2018).
Figure 4 Methodological Implications of Different Epistemologies
(Own elaboration based on Easterby-Smith et al. (2018))
Within the research philosophy framework by Easterby-Smith et al. (2018), two primary
constructs, ontology, and epistemology play a significant role. The ontology explains the
view onto the reality, whereas epistemology refers to the surrounding, the nature of the
world, finding out what is knowledge and what we do know. The ontologies differ from
another, and one can distinguish between realism, internal realism, relativism, and
nominalism. The differences are the understanding of the truth and facts. Regarding

29
epistemologies, there are four categories: strong positivism, positivism, constructionism,
and strong constructionism. Derived from Easterby-Smith et al. (2018), Figure 4
describes the methodological implications of the different epistemologies referred to the
ontologies, methodologies and applied techniques. Primary criteria for positivism are that
the researcher has to be independent, based upon hypotheses and deductions, based on
defined concepts that can be measured, and the sampling includes a random number of
cases. Within constructionism, the researcher is included in the observations, is based
upon human interest, considers stakeholder perspectives, and is only implemented in
particular cases suitable for the research.
After reviewing the relevant literature in the field of technology and payment method
adoption across different countries, we proposed a research model, hypotheses, and a
questionnaire that is commonly based on existing technology acceptance models
constructs in the field of mobile payments. This approach is in line with the ontology of
realism and positivistic epistemology construct as our model aims to explore the
phenomenon externally and from an observing perspective, thus allowing us to
quantitatively test our hypothesis and its significance, direction, and strength (Bryman &
Bell, 2015). In line with our realist ontology and positivistic epistemology, we decided to
apply a quantitative study design. Further, statistically analysing our numerical empirical
data enables us to draw conclusions that can be generalised to a larger sample since our
conclusions base on data objectively collected and analysed. Utilising the validated Likert
scale, taking various measures to omit data altering possibilities, and respect the reliability
and validity of the data aims to generate results that most objectively represent mobile
payment behaviour within the context of COVID-19 (Easterby-Smith et al., 2018).
4.2 Research Approach
As we use existing models combined with other existing constructs, we follow an
epistemological deductive approach because this study’s basis is derived from an existing
framework from previous academic research by Venkatesh et al. (2012), Davis (1989),
and Rogers (2003). The quantitative data collection follows a mono-method approach.
The quantitative research design ensures that the research problem and purpose will be
addressed within our chosen framework and a priori established hypothesis derived from

30
theory and literature. Thus, deductively examining the reality of the adoption of mobile
payment services of German consumers due to the COVID-19 pandemic (Easterby-Smith
et al., 2018). Through using a questionnaire, we gain numerically analysable data to test
the deductive theory.
Further, it allows for measuring the deducted concepts’ strength and significance
(Bryman & Bell, 2015). The questionnaire, derived from previous technology adoption
studies, was tested with a sample group before collecting quantitative. Our goal is to attain
a broad population diversity regarding rurality, gender, age to allow a higher
generalisability for our results in Germany (Easterby-Smith et al., 2018).
4.3 Research Strategy
To delineate the basis and establish a suitable research design for answering the research
problem and purpose, we methodologically link the research philosophy, data collection
method, and analysis (Easterby-Smith et al., 2018). A deductive approach to validate and
test existing constructs of our framework (Figure 3) is adopted as previously defined. This
research strategy goes in hand with academic literature using surveys as a qualified tool
for examination (Easterby-Smith et al., 2018). Moreover, by administering self-
completion questionnaires via the specialised online tool Qualtrics, we time-efficiently
and cost-efficient access a broad population. Moreover, an online distributable
questionnaire was even more suitable due to the COVID-19 pandemic.
4.4 Data Collection
Our target population comprised of diversely mobile payment experienced German
consumers and distributed across all age groups. The primary data collection process is
administered by employing self-completion questionnaires using the online questionnaire
software, Qualtrics. There are advantages and disadvantages which apply to specific
methods of data collection. Consequently, it is necessary to carefully consider which data
collection method best suits the research question and goal.
4.4.1 Survey Design
In order to validate the proposed theoretical framework and examine our hypotheses, an
online questionnaire survey was designed and applied to data collection. The
development of the questionnaire and the survey questions have been guided by
31
Venkatesh’s et al. (2012) original UTAUT2 questionnaire, as well as by prior research by
Baudier et al. (2021), Zhao and Bacau (2021) and Karjaluoto et al. (2019), who examined
the technology adoption of telemedicine in the context of COVID-19, the adoption of a
mobile payment service in China during the COVID-19 pandemic and mobile payment
adoption prior to the pandemic in Finland. The references to each item of the
questionnaire can be found in Table 1. Specifically, the questionnaire was structured into
two sections. The first part was developed by implementing constructs and items from
previous hypotheses, consisting of 36 items to explain the various variables: Effort
Expectancy, Social Influence, Habit, Performance Expectancy, Facilitating Conditions,
perceived risk, Self-Efficacy, Personal Innovativeness, and Contamination Avoidance. A
comprehensible five-point Likert scale (from 1 to 5, representing “strongly agree” to
“strongly disagree”) was used for the particular questions of each variable. The second
part contained respondents’ demographic data with close-ended questions, consisting of
gender, age, and mobile payment experience.
This research’s main survey target was smartphone users in Germany who conducted
mobile payments or have already heard about them during the COVID-19 pandemic. The
questionnaire was translated to German to mitigate understanding and language barriers
as the target population are consumers in Germany. Survey questions and their
measurements were based and adapted from prior research by Karjaluoto et al. (2019),
Baudier et al. (2021), Zhao and Bacao (2021), and Venkatesh et al. (2012).

32
Table 1 Survey Questions and Sources
Constructs Items References
[Experience]
How much previous experience
do you have with
mobile payment services?
A great deal // A lot // A moderate amount // A litttle // Note at all
[Usage]
For which reason did you use
mobile payment services?
Sending money to other people // Mobile online shopping,M-Commerce
// Mobile wallet,In-store PoS payment (e.g. Apple Pay) // I did not use it
1. [ITU1—You think it is a good idea to use mobile payment services] Venkatesh et al. (2012), Baudier et al. (2021),
Karjaluoto et al. (2019), Zhao & Bacau (2021)
2. [ITU2—You will always use mobile payment services in the near future
for payment]
Venkatesh et al. (2012), Baudier et al. (2021),
Karjaluoto et al. (2019), Zhao & Bacau (2021)
3. [ITU3—You plan to use mobile payment services in the future] Venkatesh et al. (2012), Baudier et al. (2021),
Karjaluoto et al. (2019), Zhao & Bacau (2021)
4. [PE1—I feel mobile payment services are a useful way of payment during
the pandemic.]
Venkatesh et al. (2012), Baudier et al. (2021),
Karjaluoto et al. (2019), Zhao & Bacau (2021)
5. [PE2—Using mobile payment services makes the handling of payments
easier during the pandemic.]
Zhao & Bacau (2021)
6. [PE3—Using mobile payment services improves my payment efficiency
during the pandemic.]
Venkatesh et al. (2012), Baudier et al. (2021),
Karjaluoto et al. (2019), Zhao & Bacau (2021)
7. [EE1—Learning how to use mobile payment services is easy for me] Venkatesh et al. (2012), Baudier et al. (2021),
Karjaluoto et al. (2019), Zhao & Bacau (2021)
8. [EE2—Your interaction with mobile payment services is clear and
understandable]
Venkatesh et al. (2012), Baudier et al. (2021),
Karjaluoto et al. (2019), Zhao & Bacau (2021)
9. [EE3—You find mobile payment services easy to use] Venkatesh et al. (2012), Baudier et al. (2021),
Karjaluoto et al. (2019), Zhao & Bacau (2021)
10. [EE4—It is easy for you to become skilful at using mobile payment
services]
Venkatesh et al. (2012), Baudier et al. (2021),
Karjaluoto et al. (2019), Zhao & Bacau (2021)
11. [SI1—Recommend me using mobile payment services during the
pandemic.]
Venkatesh et al. (2012), Baudier et al. (2021),
Zhao & Bacau (2021)
12. [SI2—View mobile payment services as beneficial during the pandemic.] Zhao & Bacau (2021)
13. [SI3—Support me to use mobile payment services during the pandemic.] Venkatesh et al. (2012), Baudier et al. (2021),
Zhao & Bacau (2021)
14. [HA1—Using mobile payment services could become a habit for you] Venkatesh et al. (2012), Baudier et al. (2021),
Karjaluoto et al. (2019)
15. [HA2—You could become “addicted” to the use of mobile payment
services]
Venkatesh et al. (2012), Baudier et al. (2021),
Karjaluoto et al. (2019)
16. [HA3—You could use mobile payment services often] Venkatesh et al. (2012), Baudier et al. (2021),
Karjaluoto et al. (2019)
17. [HA4—Using mobile payment services could become natural to you] Venkatesh et al. (2012), Baudier et al. (2021),
Karjaluoto et al. (2019)
18. [HM1—Using mobile payments is fun] Venkatesh et al. (2012), Karjaluoto et al. (2019)
19. [HM2—Using mobile payments is enjoyable] Venkatesh et al. (2012), Karjaluoto et al. (2019)
20. [HM3—Using mobile payments is very entertaining] Venkatesh et al. (2012), Karjaluoto et al. (2019)
21. [PR1—The use of mobile payment services would result in a loss of
confidentiality, because the information could be used without your
knowledge]
Baudier et al. (2021), Karjaluoto et al. (2019),
Zhao & Bacau (2021)
22. [PR2—You feel that using and signing up for mobile payment services is
financially and technically risky]
Karjaluoto et al. (2019), Zhao & Bacau (2021)
23. [PR3—Mobile payment services are dangerous to use] Karjaluoto et al. (2019), Zhao & Bacau (2021)
24. [PR4—Using mobile payment services would add great uncertainty in my
payment transactions]
Karjaluoto et al. (2019), Zhao & Bacau (2021)
25. [FC1—I have the resources necessary to use mobile payment services] Venkatesh et al. (2012), Baudier et al. (2021)
26. [FC2—I have the knowledge necessary to use mobile payment services] Venkatesh et al. (2012), Baudier et al. (2021)
27. [FC3—I can get help from others when I have difficulties using mobile
payment services]
Venkatesh et al. (2012), Baudier et al. (2021)
28. [CA1—By avoiding touching contaminated cash] Baudier et al. (2021)
29. [CA2—By avoiding physical contact with the cashier or waiter] Baudier et al. (2021)
30. [CA4—By avoiding touching contaminated payment devices (pin pads,
etc.)]
Baudier et al. (2021)
31. [PI1—You like to experiment with technological innovations] Baudier et al. (2021)
32. [PI2—If you hear about a new technology, you want to try it] Baudier et al. (2021)
33. [PI3—In your community, you are usually the first to try new technology] Baudier et al. (2021)
34. [SE1—Being able to call someone for support in case of problems.] Baudier et al. (2021)
35. [SE2—Someone else had helped to get started.] Baudier et al. (2021)
36. [SE3—someone showing me how to do it first.] Baudier et al. (2021)
[AGE—How old are you?; Age as a decimal]
[GENDER—Please select your gender; Female, Male, Non-binary / third
gender]
[OTHER—Anything you would like to add?]
[Intention to Use]
In the recent pandemic situation…
[Performance Expectancy]
You think that…
[Effort Expectancy]
You have the impression that…
[Social Influence]
You have the impression that
people who are important to me
(e.g., family members, friends)…
[Habit]
You would say…
[Demographics & Comments]
[Hedonic Motivation]
You think that…
[Perceived Risk]
You think that…
[Facilitating Conditions]
You have the impression that…
[Contamination Avoidance]
Do you think that using mobile
payment solutions can prevent you
from being contaminated by germs
and viruses…
[Personal Innovativeness]
You would say about you that…
[Self-Efficacy]
You are convinced that you can
use mobile payment services even
without…

33
We made adjustments to the moderating factors during the sampling process, which were
recommended to be answered before submitting, to a requirement, as we noticed some
forms with missing values, even as the participants were reminded to select missing
answers before completing the survey. Initially, we designed these questions as voluntary,
but with notification if answers were missing when submitting to get as many submitted
answers as possible, thus avoiding the risk of participants cancelling the survey through
being forced to answer. For participants, there is the option to download their answers for
their purpose or if they want to reach out to us to rectify anything or to withdraw their
participation.
4.4.2 Pre-Test
Once the initial questionnaire was constructed, it was pre-tested among 15 respondents
from the study population to assess the reliability of the measurement scales and the
understanding of the questions, thus, ensuring the explanatory value of our survey results.
The pre-test participants included several German students. On the one hand, this is to
ensure we have a knowledgeable pre-test audience with a background in research and
survey design and, on the other hand, an understanding of the state of mobile payments
in Germany. Further, close acquaintances, especially senior acquaintances, who were less
proficient in technology use or did not use mobile payment services, also participated in
the pre-test and were asked for their feedback. As we derived the questions for the survey
from studies written in English, our German translation may inherit the risk of leading to
a different understanding of the question, which might limit the comparability with the
studies conducted in English. Thus, some of the pre-tests were done with the researchers
assisting the participants while they saw the questions for the first time and asked the
participants for how they perceived and understood the questions. Consequently, we
adapted questions to support a clear understanding as intended.
Based on the feedback received, minor changes were made to the wording of some
questions to better reflect the study’s context. As we expect most participants to fill out
our questionnaire to at least use a smartphone, we anticipate a high proportion of mobile
devices to fill out the questionnaire. Consequently, we eliminated the previously used
single choice matrix to have the multiple questions together and ensure the end of the

34
questions match the beginning of the sub-questions. Hence, this increases the easiness to
read, question compactness, and a more responsive design when filling out the
questionnaire on mobile devices. Further, we decided to exclude the Availability
construct from the questionnaire, as participants of the pre-test noted that they perceive
this construct very similarly to Facilitating Conditions. Additionally, other payment
methods, such as cash or credit cards, have not been curtailed at offline POS or online
compared to before the pandemic.
Further, an additional page was added, including explanations and illustrations, such as
the different types of mobile payment services, which only appears if participants rate
their experience with mobile payment services as very little. Hence, this should ensure
that respondents with a low experience level have a sufficient understanding of mobile
payment services. Further, we added two questions to see whether the respondents used
mobile payment services and for which purposes. Furthermore, we enabled the possibility
to download the provided answers after the participants completed the questionnaire.
Additionally, we pre-tested our model in conjunction with the questionnaire with four
different professors or researchers who have previously advised or researched in
connection with the UTAUT2 model. After that, the questionnaire was fielded as
presented in Appendix C.
4.4.3 Sampling Strategy
Initially, the questionnaire was distributed through our LinkedIn study (see Appendix I)
and work-related networks. We used a mixed-methods sampling approach to acquire
participants for the questionnaire using snowballing, convenience, and purposive
sampling. Furthermore, we also had the idea to distribute our questionnaire offline at
shops or other places where consumers use varying payment methods. However, we
dropped this approach because of COVID-19 restrictions, low frequency of shoppers, and
Contamination Avoidance. Further, we also expected a lower willingness to participate
than a non-pandemic situation due to social distancing recommendations. Nonetheless,
we are aware of the disadvantages associated with this approach.
Throughout the data collection period, answers were preliminarily monitored and
evaluated to prevent skewing or disproportionally sampling specific age groups. High
35
saturation of younger participants or higher responsiveness [aged 18-29] was noticeable
during the questionnaire's early fielding. Therefore, we shifted the communication
channels to target a more senior population actively. Hence, public social media sites,
such as Twitter, Facebook or LinkedIn, were no longer focused on recruiting participants;
instead, we employed direct communication channels through colleagues or
acquaintances over Germany’s most used messaging service WhatsApp (Statista, 2020).
Further, we applied snowball sampling, especially when targeting more senior
participants, to share the questionnaire within their organic social networks. Thus, we
consider our sampling approach appropriate given the circumstances of this analysis's
pandemic, scope, and time frame.
4.5 Data Analysis
To draw conclusions from the raw data collected through the questionnaire, a two-step
approach as proposed by Easterby-Smith et al. (2018) is applied. Firstly, the collected
data is summarised, and answers are recoded accordingly on an integer scale. The data is
subjected to a plausibility check to examine any unrealistic outliers, answers, or
answering patterns in the next step. Afterwards, the data is transformed to a machine-
readable format (1 to 5, representing “strongly agree” to “strongly disagree”) to be
processed in statistical data analysis software to visualise and calculate patterns, strength,
and significance. As for the constructs, we only use close-ended questions, thus we do
not have to manually code and review open answers by participants, which allows for
higher objectivity. We calculate a set of descriptive statistics, such as standard deviation,
variance, median, mean, maximum, minimum, and count, to create a first overview of the
collected answers and constructs. These different factors allow for a deeper understanding
of the present data, for instance, a mean with a high standard deviation depicts a construct
means there is, ceteris paribus, greater variability in the collected answers, thus more
unique answers.
For visualisation and more swift apprehension, the results were visualised in diagrams
where suitable (Appendix H). Further, Box-Plots, by depicting at a glance: minimum,
maximum, median, first-, and third quartile, is suitable in visualising our items thanks to
the five-point Likert scale for our constructs. Additionally, reliability tests are conducted
by testing the data with Cronbach’s alpha for internal reliability (Bryman & Bell, 2015).
36
As for the validity of our data and the formulated questions, the questionnaire was pre-
tested with a small number of respondents, the feedback was used to reformulate
questions and adding additional information for a clearer understanding. Furthermore, we
expect that construct validity is given as our constructs and hypotheses are based upon
previous research in reputable journals (Bryman & Bell, 2015). In the last step of our
result analysis, structural equation modelling is applied with specialised software to test
our model’s relationships.
4.6 Research Quality
Across the research process steps, there are many places where methodical weaknesses
and subjective views could find their way into the research. Therefore, researchers have
to implement quality insurance mechanisms in order to counter such impurities. Research
of high quality should be relevant, credible and attractive. Transparency about approaches
and methods used by the researchers is essential to assess the quality of the work.
Researchers should be wary about what kind of data they collect and what was not
collected, as this might be essential if there are other causes for the complex phenomena
analysed by the researchers. Sampling strategies and their potential biases can introduce
distortions into the collected data. Therefore, our sampling choices have to be carefully
examined, and potential advantages (e.g. speed) juxtaposed to potential disadvantages
(e.g. biases) (Easterby-Smith et al., 2018; Guba, 1981). They enable a high-quality
evaluation of quantitative research, verifying and assuring the validity and reliability of
the research data and process (Bryman & Bell, 2015; Saunders et al., 2012). While
validity “is concerned with whether the findings are really about what they appear to be
about.” (Saunders et al., 2012, p. 157), reliability is described as “the degree to which an
instrument will produce similar results at a different period” (Gray, 2017, p. 780).
4.6.1 Validity
The validity of quantitative research ensures the integrity of the conclusions and
implications that are drawn from the study. While the internal validity aspects describe
the researcher’s confidence in drawing causal inferences from the data and generating
credibility, external validity aspects focus on the relevance of the findings in an extended
frame, hence their transferability and generalisability (Saunders et al., 2012). To assure
that “the measurement questions actually measure the presence of those constructs you
intended them to measure” (Saunders et al., 2012, p. 373), the validity of the

37
questionnaire, thus, construct validity is required. In the context of this study, construct
validity refers to the formulation of the hypotheses, constructs, and their individual
questions also referred to as items. Since both of those elements were derived from
previous reliable research, established and relevant literature, we could expect construct
validity of this work should be given, yet as we transferred constructs and items in our
context and translated it to German, it makes an analysis salient. Thus, to ensure construct
validity of the measurement instruments, the research follows Bryman & Bell (2015),
who recommend assuring construct validity by investigating relationships between
independent variables. Consequently, we will examine our construct validity with Cross-
Loading and HTMT analysis in section 5.2. The HTMT examines the amount of variance
indicated by the construct related to the consolidated variance through measurement
errors and the Cross-Loadings indicate the relationship strength of items towards other
constructs.
Nevertheless, we expect the internal validity and the underlying theorems of this research
to be valid as we adopted previous established and acknowledged theoretical models as
the foundation for this study Bryman & Bell (2015). Since the UTAUT2, TAM and DOI
model represent established models within the field of mobile payments, the causal
relationships of this work should be valid. However, persons who are interested in mobile
payment services might be more likely to participate in our study and dilute the internal
validity, yet we seek to mitigate this through our sampling strategy. Furthermore, external
validity, which aims at generalisability, was respected in the generation of the
questionnaire in terms of replacing irrelevant questions leading to a seamless user
experience of the participants and preventing lower response and submissions rates.
Additionally, the questionnaire bases on the common Likert-scale, to support the
feasibility of the results (Saunders et al., 2012).
Furthermore, as described in section 4.4.2 a pre-test with 15 participants was conducted
to gather feedback about the formulations and understandability of the questionnaire. The
questionnaire was modified accordingly, hence the pre-test ensured to avoid ambiguity
and supported the questionnaire to be easy to understand and answered correctly
(Easterby-Smith et al., 2018; Gray, 2017).

38
4.6.2 Reliability
Reliability refers to the consistency of results and their dependability, hence allowing to
replicate results. Bryman & Bell’s (2015) description of internal reliability applied to this
research implicates that the items per element asked in the questionnaire are connected in
order to guarantee internal reliability. The suggested measurement and statistical analysis
for internal reliability is Cronbach’s alpha, which was executed, and the results presented
in section 5.2.5 (Bryman & Bell, 2015). Cronbach’s alpha test indicates internal reliability
and is represented by a value between 1 and 0. If Cronbach’s alpha value is 0, the
measurement instrument does not embrace internal reliability, while the value of 1
indicates complete internal reliability. In general, values from 0.7 and above indicate an
acceptable level of internal reliability, which this research also approaches (Bryman &
Bell 2015; Easterby-Smith et al. 2012; Gray 2017).
To further examine the convergent reliability and validity, the average variance extracted
(AVE) is used in section 5.2.5. Convergent validity is the degree to which, in this case,
the construct comes together to explain the variance of the items. It is especially relevant
especially for factor-based structural equation models, which fits the design of this study.
For the metric AVE to prove convergent reliability and validity values above the threshold
of 0.5 should be achieved in the frame of this research. Thus, the construct explains at
least 50% of the variance of the items. A high value shows that the items are related to
each other. (Bryman & Bell, 2015; Hair, Risher, et al., 2019).
4.7 Ethical Considerations
Research can profoundly affect individuals and society, as has been exceedingly
exemplified during the COVID-19 pandemic. Therefore, researchers must adhere to
fundamental principles for their research ethics that are appropriate for the type of study.
In the following, the fundamental principles in research ethics will be discussed in the
objective of this research:
1. Ensuring no harm comes to participants.
2. Respecting the dignity of research participants.
3. Ensuring a fully informed consent of research participants.
4. Protecting the privacy of research participants.
5. Ensuring the confidentiality of research data.

39
6. Protecting the anonymity of individuals or organisations.
7. Avoiding deception about the nature or aims of the research.
8. Declaration of affiliations, funding sources, and conflicts of interest.
9. Honesty and transparency in communicating about the research.
10. Avoidance of any misleading or false reposting of research findings.
(Bell & Bryman, 2007)
In order to ensure the ten principles of research ethics, we took the following measures:
Prior to the data collection, the JIBS data consent form was filled out and submitted, in
which we committed to comply with JU’s approved guidelines for the data collection and
processing as well as to delete any personal data after finishing the thesis. Only after
clearance, we fielded our questionnaire. Before starting to answer the questions, we
provided information for the participants about the nature and aims of the research as well
as clearly communicated that the provided data will be collected anonymously and how
it will be processed. We clearly stated that the users provide their consent by proceeding
to the questions. For our study, we only collect little personal data as the questionnaire
itself is anonymous. Nonetheless, solely the participants’ age and gender shared in the
collected data could allow us to draw statistical inferences, but we do not expect to
identify individuals by the data given. Furthermore, participants engage with the
questionnaire by clicking on a public link. Hence, we do not know if a certain person
clicked on the link to the questionnaire, ensuring the participant’s privacy.
Hypothetically, we could derive information through the temporal sequence, but this is
diluted as it is unclear when someone completes a questionnaire.
After submission, in the unlikely event, a participant wants to withdraw, the data could
only be deleted if participants know the exact submission time or if they downloaded the
respective questionnaire. In this case, he knows the exact identifier of his submission.
However, if that is not the case and there are multiple datasets in that timeframe,
additional information might be needed. After ethical considerations, we concluded that
this approach is in the best interest of our participants as it ensures high anonymity and
few identifying components for all participants and does not collect additional identifiers
for the unlikely event of a withdrawal, as the tool provided by JIBS does not offer
additional measures for the participant to self-withdraw his submission.

40
Additionally, we provided our contact information to the participants to ensure that any
concerns regarding the data collection, processing or topic related questions can be
answered transparently and ensure that participants are fully informed.
Moreover, we conducted a pre-test of the questionnaire with a selected sample to
reconcile the questions do not generate any harm to the participants and information on
research aim, reason, and the processing steps are sufficiently and transparently
presented.

41
5 Empirical Findings
The following chapter covers the statistical findings of the empirical data collected
through our online survey. According to the methods described in the previous chapter,
we will start with the descriptive analysis of the data set covering the demographics,
central tendencies and additional comments on the survey. Next, we outline the scale
measurements, including the structural equation modelling to test the proposed
hypotheses’ significance, complemented by a multi-group analysis to examine
moderating effects.
Through the survey tool Qualtrics employed, the questionnaire’s answers were pre-coded
from 1 to 5 according to the respective answer on the Likert-scale. After the data
collection and the questionnaire were closed, a machine-readable dataset in .csv and .sav
data formats were downloaded for statistical processing. As our dataset includes 258
responses in total statistical software effectively allows for efficient processing of the
data. Employed statistical software by researchers’ include SPSS, R, STATA, and
Mathlab and for modelling SPSS Amos and SmartPLS. Further, extensions, scripts and
other packages can be used for higher user-friendliness. We employed SPSS 27 for
statistical analyses and intended to use SPSS Amos for structural equation modelling
(SEM) for our quantitative research model analysis. After retrieving initial results in
SPSS Amos in due course, we instead continue our analysis in SmartPLS 3.3.3 due to its
greater user-friendliness and compatibility with Macintosh OS (Ringle et al., 2015).
Moreover, besides other advantages, PLS is especially well suited for our analysis due to
its robustness of non-normal, skewed, kurtotic, possibly interrelated observations and
smaller sample sizes (Hair et al., 2014; Sarstedt et al., 2016).
Phenomena can be described and explained by calculating specific measurements through
numerical, ordinal, or nominal data (Babbie, 2013). However, the collected data and its
instances must be checked for authenticity and completeness. Disqualifying instances
include missing ages data, as some participants submitted the questionnaire without
answering the requested age field, and there were some instances where answers indicated
a invariant item selection pattern. Hence, implying that the respondents did not read or
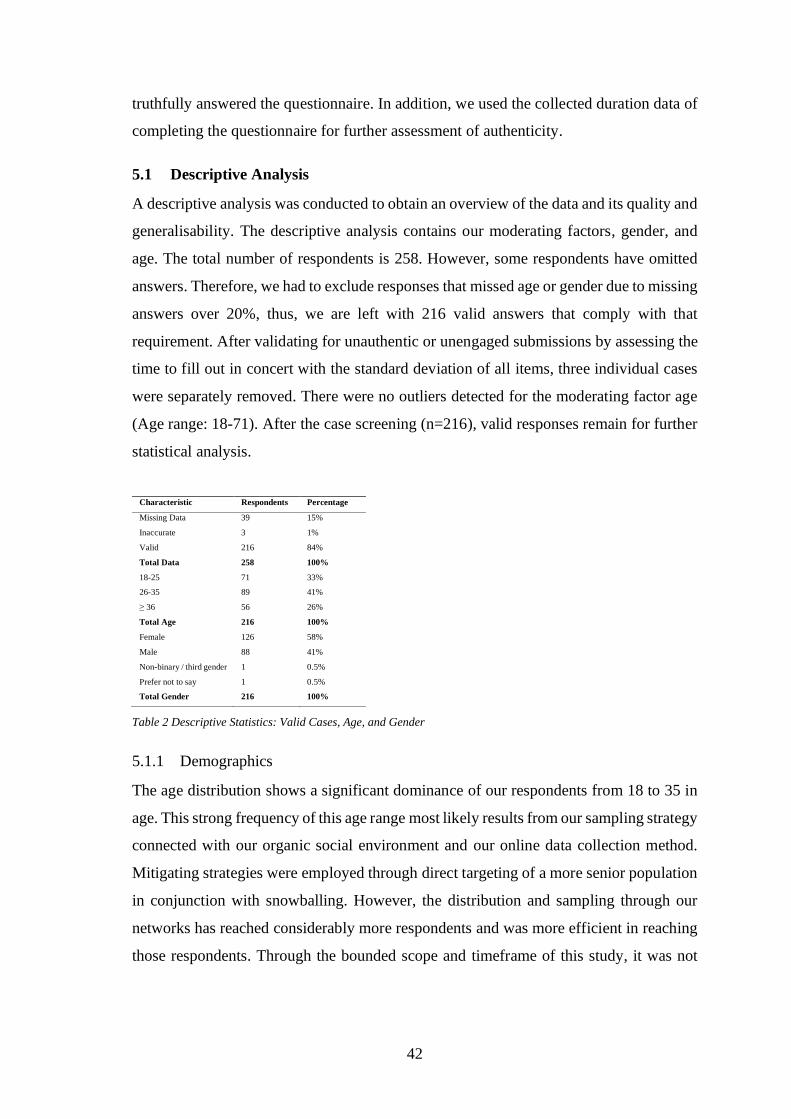
42
truthfully answered the questionnaire. In addition, we used the collected duration data of
completing the questionnaire for further assessment of authenticity.
5.1 Descriptive Analysis
A descriptive analysis was conducted to obtain an overview of the data and its quality and
generalisability. The descriptive analysis contains our moderating factors, gender, and
age. The total number of respondents is 258. However, some respondents have omitted
answers. Therefore, we had to exclude responses that missed age or gender due to missing
answers over 20%, thus, we are left with 216 valid answers that comply with that
requirement. After validating for unauthentic or unengaged submissions by assessing the
time to fill out in concert with the standard deviation of all items, three individual cases
were separately removed. There were no outliers detected for the moderating factor age
(Age range: 18-71). After the case screening (n=216), valid responses remain for further
statistical analysis.
Characteristic Respondents Percentage
Missing Data 39 15%
Inaccurate 3 1%
Valid 216 84%
Total Data 258 100%
18-25 71 33%
26-35 89 41%
≥ 36 56 26%
Total Age 216 100%
Female 126 58%
Male 88 41%
Non-binary / third gender 1 0.5%
Prefer not to say 1 0.5%
Total Gender 216 100%
Table 2 Descriptive Statistics: Valid Cases, Age, and Gender
5.1.1 Demographics
The age distribution shows a significant dominance of our respondents from 18 to 35 in
age. This strong frequency of this age range most likely results from our sampling strategy
connected with our organic social environment and our online data collection method.
Mitigating strategies were employed through direct targeting of a more senior population
in conjunction with snowballing. However, the distribution and sampling through our
networks has reached considerably more respondents and was more efficient in reaching
those respondents. Through the bounded scope and timeframe of this study, it was not

43
expedient to increase the number of respondents by the distinctive sampling of senior
samples.
The gender distribution is relatively equal, with 40.7% of the respondents identifying as
female and 58.3% identifying as male. We have intentionally designed our questionnaire
as inclusive as possible, thus having two cases not in the binary category or preferred not
to say. When analysing the effects of the moderating factor Gender, after thorough
consideration, we had to omit the non-binary values as they would otherwise be treated
as statistical outliers in modelling the moderating effect due to the small frequency. For
every other analysis and the explanatory power of the other variables, the instances are
included. In future studies, the ethical implications of the moderating factor Gender and
the malpractice of mostly excluding non-binary responses should be considered. In our
questionnaire, we also asked for the level of prior experience with mobile payments.
Eighty-seven per cent of our respondents had at least “A moderate amount” of experience
with mobile payment services.
How much previous experience do you have with mobile payment services?
Answer Frequency Percent Valid Percent Cumulative Percent
A great deal 78 36.1 36.1 36.1
A lot 67 31.0 31.0 67.1
A moderate amount 43 19.9 19.9 87.0
A little 16 7.4 7.4 94.4
None at all 12 5.6 5.6 100.0
Total 216 100.0 100.0
Table 3 Descriptive Statistics: Previous Experience with Mobile Payment Services
5.1.2 Central Tendencies
Appendix G shows the means and standard deviation for each item of the variables.
Whereas the min. 1 represent “Strongly agree” and max. 5 represents “Strongly disagree”
on the 5-point Likert Scale. One can observe that the means vary between 1.51 to 3.53.
One can see, for example, that for most Variables, the items have a similar mean, meaning
that respondents did see the different items similarly. However, some noticeable
discrepancies for the items HA2, HM3, PR1 and FC3 and their respective other variable
items are observable. These deviations could have implications for testing our model and
might need adjustments, or individual items eventually have to be dropped.

44
5.1.3 Additional Comments by Respondents
In our questionnaire, we included a voluntary open field for any additional information
respondents wanted to share relating to the topic, we did not expect to receive much
through this open question. Nonetheless, we received eight meaningful and valuable
comments that could add value to this study, however, seven of those were written in
German and, thus, have been translated accordingly to the respondents’ intention. A list
of the comments is provided in Appendix D.
One participant mentioned that their answer depended on the service in mind and stated
that it was difficult to answer in general, while another participant similarly claimed to
distinguish between the gained value of the different use cases, hence there is further
research required to investigate the behaviour for the distinct use cases of mobile
payments. Furthermore, two participants described the difficulty to differentiate between
behaviour before and during the pandemic for some questions, since the participant
intensively used mobile payments already before the pandemic, thus the impact of
COVID-19 could not clearly be traced. Following this statement, we suggest future
research on mobile payment adoption during emergency situations building upon our
study to integrate previous experience further and differ between the previous usage
behaviour. Additionally, two comments highlighted that higher age and related no
familiarisation with technology impacts the adoption behaviour through raising
unawareness and uncertainty about it, hence impede a greater penetration. However, our
study included these aspects through Personal Innovativeness and Facilitating Conditions.
Additionally, a comment described that rather the circumstances caused by the pandemic
led to the increased usage of mobile shopping and mobile take-out food orders. Lastly,
one comment described that the amount to be paid is important for the willingness to pay
mobile, which is in contrast to the literature screening which led us to remove the element
price value, originally part of the UTAUT2 model. Concluding, the additional comments
provide interesting approaches to be pursued by future researchers while others exemplify
personal opinions that should be taken into account for future research after examining
representativeness.
45
5.2 Scale Measurement
5.2.1 Test for Normality
A skewness-kurtosis method was adopted in Appendix G to test univariate normality for
each of the variables to observe the distribution of answer values (Kline, 2011). Using
SPSS 27, the statistical values of skewness and kurtosis, the sharpness of the peak of a
frequency-distribution curve, are assessed and were found for most latent variables as
recommend (Kline, 2011). ITU, PE, and EE exceed the acceptable range of ± 1 for both
skewness and kurtosis, additionally, FC slightly exceeds the level for kurtosis. The
variables showed exceptionally high frequencies of the “Strongly Agree” Likert-level 1,
this can be caused by many of our respondents being familiar with mobile payment
solutions. Hence, as most of the variables do not follow a normal distribution in
conjunction with the study focusing on the prediction of Intention to Use in an novel
setting with the COVID-19, however, the PLS-SEM is a suitable choice, especially in the
context of not normal distributed items (Karjaluoto et al., 2019).
5.2.2 Model Fit
A frequent criticism in the literature is that PLS-SEM does not provide a sufficient
measure of model fit (Hulland, 1999). However, Henseler et al. (2015) propose model fit
as a basis for the model assessment. Among the most common and suitable criteria
implemented in PLS-SEM path modelling is the Standardised Root Mean Square
Residual (SRMR), which determines the fit of data and model and, thus, provides a
preventive tool for model misspecification (Henseler et al., 2015; Hu & Bentler, 1999).
An SRMR value of 0 would imply a perfect model fit, whereas academically broadly
accepted, an SRMR value of less than 0.10 or more conservatively 0.08 indicates a good
fit (Henseler et al., 2015; Hu & Bentler, 1999). In our case, the calculated SRMR value
of our model is 0.052, indicating a good model fit.
5.2.3 Outer Model Loading Factors
The outer model, also described as the measurement model, indicates the predictive
relationship between the latent variables and their measured indicators (Hair et al., 2011).
The adequacy of the outer model can be assessed by testing reliability and validity, which
involves assessing the indicators’ internal consistency and reliability. As it forms the basis
for the assessment of the inner model and the relationship between the latent and

46
dependent variables, moving from the outer to the inner model ensures that the latent
variables are correctly assessed and represented (Hair et al., 2014). For the reliability
assessment, the loading factors are a suitable indicator for assessing the relation between
the observed items and the latent variable. For example, Hedonic Motivation is measured
by the three items HM1, HM2, and HM3 together, and their strength of explanation or
measurement accuracy is indicated by the correlation or and loading factor. Items with
loading factors above 0.7 are, perceived as valid and generally included in an outer model
(Hulland, 1999). Items with lower loading factors do not necessarily have to be dropped,
however, in new contexts, some measurement items could lack adequate accuracy.
Transferred to our study, it means that the questionnaire’s sub-questions might be viewed
differently in the new context of mobile payment services.
Nonetheless, loading factors below 0.4 could weaken the latent variables and should be
dropped if possible. However, the number of items should only be dropped in exceptional
cases below three items if it significantly improves the model (Hulland, 1999). In our
model, HA2 = 0.461, FC3 = 0.356, and HM3 = 0.578 fall short of the 0.7 loading factor,
with FC3 even falling short of the 0.4 threshold, thus, being dropped immediately.
After further assessment and improvement to the model fit, HA2 has been additionally
dropped. The low loading factors confirm that the two items had little explanatory and
measurable value for latent variable. This low accuracy most likely is caused by the low
transferability of the questions, which we adapted from Baudier et al. (2021) from their
context of teleconsultation to mobile payment services. Both HA2— “You could become
‘addicted’ to the use of mobile payment services” and FC3— “I can get help from others
when I have difficulties using mobile payment services” was perceived differently in this
context by our respondents.
5.2.4 Collinearity
In structural equation models, the variance inflation factor (VIF) is often used to evaluate
collinearity (Hair, Risher, et al., 2019). Collinearity or multicollinearity is the case when
two or more variables are exactly correlated. The VIF value evaluation is done to ensure
that collinearity does not bias the regression results. In SmartPLS 3.3.3 (Ringle et al.,
2015), the latent variable scores of the predictor constructs are used to calculate the VIF

47
values. VIF values above 5 indicate potential collinearity issues among the predictor
constructs. Nonetheless, collinearity problems can also be found at lower VIF values of
3 to 5 (Becker et al., 2015; Mason & Perreault, 1991). Preferable VIF values should be
close to 3 or lower (Hair, Risher, et al., 2019). Depending on the context, some researchers
describe the VIF value of 5 as a conservative threshold and 10 as the maximum threshold
(Hsu et al., 2007; Venkatesh et al., 2012). If there are signs found for collinearity, a
frequently used solution is to create higher-order models or constructs that are supported
by theory.
Nevertheless, we calculated the VIF-values for our predictor constructs, see Appendix E,
and formative indicators. Only the HA predictor construct was slightly above the most
conservative threshold value of 3. For our formative indicators, none was above the cut-
off threshold value of 5, and more than 60% were below the more conservative threshold
value of 3. Hence, we do not expect multicollinearity to pose a threat to the validity of
our study results.
5.2.5 Reliability Test
Further, the constructs’ reliability and validity were tested using Partial Least Squares
(PLS) analysis. Cronbach’s alpha was used to examine the internal consistency and
Composite Reliability and Average Variance Extracted (AVE) to assess the convergent
validity.
Table 4 shows the Cronbach’s alpha values of latent variables and were analysed for
values greater than 0.7, confirming construct reliability. Except for Facilitating Condition,
which was removed as the Cronbach’s alpha (0.654) is below 0.7, all other variables were
above the recommended threshold (Hair, Risher, et al., 2019), thus, confirming construct
reliability. The low Cronbach’s alpha for Facilitating Condition could stem from FC3 “I
can get help from others when I have difficulties using mobile payment services”, which
has a noticeable lower loading factor than the other two items. After removing FC3 from
the model, the latent variable FC the Cronbach’s alpha increases to 0.793 and is above
the recommended threshold. Hence, confirming the low accuracy of FC3 previously
recognised. Therefore, we proceed with FC3 excluded from our model. Convergent
reliability was confirmed by the AVE, which indicates how much explanatory value a
construct incorporates towards the variance of the items. A value of 1.0 would mean that

48
a construct explains 100% of the variance of the item, e.g., age and gender would have a
value of 1.0 as there is only a single item. AVE values ranged from the min. 0.599 to the
max. 0.902, which is above the recommended threshold of 0.5 (Hair, Risher, et al., 2019).
In conclusion, we can assume that our constructs and remaining items show an acceptable
degree of accuracy in our research setting.
Constructs Cronbach’s
Alpha
rho_A Composite
Reliability
Average Variance
Extracted (AVE)
CA 0.912 0.915 0.945 0.851
EE 0.916 0.917 0.941 0.800
FCrevised 0.793 0.825 0.905 0.827
HA 0.946 0.946 0.965 0.902
HM 0.787 0.823 0.874 0.699
ITU 0.909 0.910 0.943 0.846
PE 0.860 0.866 0.915 0.783
PI 0.902 0.906 0.939 0.836
PR 0.898 0.899 0.929 0.767
SE 0.883 0.886 0.928 0.811
SI 0.812 0.817 0.888 0.726
Table 4 Reliability of Latent Variables
5.2.6 Discriminant Validity
In addition, discriminant validity is assessed to ensure that the respective constructs in
our model differ significantly from other measured items of other constructs in our model.
For PLS-SEM, a replacement for the Fornell-Larcker criterion is proposed by Henseler
et al. (2015). The Heterotrait-Monotrait (HTMT) ratio of the correlations is defined “as
the mean value of the item correlations across constructs relative to the geometric mean
of the average correlations for the items measuring the same construct” (Hair, Risher, et
al., 2019, p. 9). High HTMT values indicate discriminant validity problems. Thus,
Henseler et al. (2015) propose a threshold value of 0.90 for structural models with
constructs that are conceptually very similar, however, in the technology adoption setting,
a lower, more conservative 0.85 threshold is recommended (Kline, 2011). In this context,
an HTMT value above 0.85 would suggest that discriminant validity is not present.
Nonetheless, in our model, it could be possible that HA is very similar to ITU as both
constructs assess the usage or adoption of the technology itself, with only being
temporally differentiated.
Through the bootstrapping process, we can test whether the HTMT values are
significantly different from 1.00 (Henseler et al., 2015) or at lower threshold values such
as 0.85 (Kline, 2011) or 0.90 (Henseler et al., 2015), which vary by the study context

49
(Franke and Sarstedt, 2019). We intend to use the 0.90 level as we have conceptually
similar constructs in our model. In our model, PE → ITU (0.943) and ITU → HA (0.864)
have an HTMT value that exceeds the recommended threshold. Nonetheless, as
ITU → HA is only slightly above the more conservative threshold of HTMT.85 we assume
discriminant validity. For PE → ITU discriminant validity is violated as it is noticeable
above HTMT.90.
A violation of the discriminant validity would be problematic for the validity of our model
as it could lead to distortions and misrepresentation of the effects. Subsequently, we
thoroughly analysed what could have caused the violation of the discriminant validity.
The cross-loadings of the items, which indicates how much the individual questions of a
construct have explanatory value for another construct, indicate an issue with ITU1
towards PE. Looking into the raw data, one can observe a relatively large number of
respondents with a low or variance of zero across the items ITU1, ITU2, ITU3, PE1, PE2,
and PE3. However, in context, this only led to one other identified unengaged respondent
with low variance in the answers across all 34 items.
Further, another factor that could have caused a similar response behaviour across the
ITU and PE items could have been that these two constructs were one after another in the
questionnaire. Moreover, when examining the wording of the individual questions, we
notice a semantic similarity in ITU1 and PE. With the discriminant validity violated, we
evaluate the HTMT and the cross-loadings when excluding ITU1. Within our
expectations, the HTMT values decrease below the HTMT.90 threshold, and no individual
cross-loading of items is higher with no other than their distinct constructs.
In contrast to the other SEM methods, PLS-SEM is better suited and can process
constructs with fewer than three items or even a single item without compromising the
validity of the analysis (Hair et al., 2011). Further, Worthington & Whittaker (2006) argue
that it is viable to use a construct with only two items if they a highly correlated (<0.7)
and relatively uncorrelated to other constructs. However, it still holds that, in general, it
is desirable to have more items for adequate construct representation and higher
reliability, only if the research design or, in this case, due to poor item fit (Eisinga et al.,
2013). The scope and timeframe of our study did not allow for a re-fielding of a revised

50
questionnaire with more precise wording and intent. Thus, we decided to proceed and
exclude ITU1 from our model.
Constructs CA EE FC HA HM ITU PE PI PR SE SI
CA
EE 0.209
FC 0.139 0.772
HA 0.264 0.750 0.728
HM 0.296 0.715 0.513 0.747
ITU 0.267 0.718 0.621 0.850 0.691
PE 0.496 0.631 0.559 0.782 0.594 0.897
PI 0.245 0.705 0.702 0.682 0.603 0.595 0.530
PR 0.245 0.594 0.598 0.653 0.506 0.624 0.604 0.520
SE 0.144 0.579 0.595 0.496 0.299 0.351 0.371 0.532 0.387
SI 0.356 0.319 0.259 0.358 0.519 0.478 0.516 0.229 0.138 0.109
Table 5 HTMT Criterion for Discriminant Validity After Revision
5.3 Structural Model
After the assessment and robustness of our measurement model and the explanatory
accuracy of our items, we test our structural model and hypotheses by assessing the
predictive power of the model and the relationships between the constructs. Our study
employed the SmartPLS 3.3.3. (Ringle et al., 2015) Bootstrapping algorithm with 5,000
subsamples to evaluate our structural model and the statistical significance of our paths
and hypotheses. Therefore, we assess our results presented in Table 6. We first analyse
the R2-Values of the structural model, the R2 denotes the proportion of variance for the
dependent variable explained by the independent variable ranging from 0 to 1 with higher
values implying stronger predictive accuracy (Hair, Risher, et al., 2019). Exemplified, an
R2 value of 0.5 for a dependent variable means that roughly half of the variance can be
explained by the input of the independent variables. Our model has four dependent
variables with Intention to Use having an R2 of 0.740, thus indicating high predictive
power of the input variables. For Effort Expectancy (R2 = 0.475) and Performance
Expectancy (R2 = 0.434), more than 40% of their variance are explained by their input
variables. The R2 for Social Influence is 0.095, which is relatively low, meaning that
much of the variance is not explained by Contamination Avoidance.
Next, we analyse the path coefficient of the structural model in conjunction with the t-
and p-values of the path coefficients to test whether the hypotheses are statistically

51
significant. Path coefficients are used to measure the strength and direction of the
relationship between independent and dependent variables (Hair et al., 2014). The
standardised path coefficients range from –1 to +1, with values close to –1 show a robust
negative relationship between dependent and independent variables, whereas coefficients
close to +1 indicate a robust positive relationship (Hair et al., 2014).
The path coefficients estimates are tested using the path coefficient estimate, its t-value,
and p-value. In general, relationships are significant when a t-value is greater than 1.96,
and a p-value is smaller than 0.05 (Hair, Risher, et al., 2019). In the model summary in
Table 6, the hypotheses and their support are presented. Through the model results, we
derive conclusions about the support of our proposed hypotheses and their relationships.
H4 is, in this case, supported as significant at the weaker p = 0.1 significance level. H2,
H3, H4a, H4b, H4c, and H6 are supported at the p = 0.01 significance level. Hypotheses
H5, H7, H8, and H9 are not significant and thus not supported. The results allow us to
support eight of the twelve hypotheses.
Personal Innovativeness (PI) on Effort Expectancy (EE) and EE on Performance
Expectancy (PE) both have the most robust of our hypotheses, meaning that PI is a strong
predictor of a respondents’ EE and thus PE. Further, the respondents’ Self-Efficacy (SE)
with mobile payment services also predicts the EE, yet less strongly. Contamination
Avoidance (CA) is a medium strong predictor on both PE and Social Influence (SI),
indicating that strong CA predicts the presence of SI and the individual PE of mobile
payment services. Habit (HA) and PE are strong predictors of Intention to Use (ITU),
with EE also predicting ITU but on a lower and less significant level. The structural model
with the path-coefficients is as well depicted in Figure 5.

52
Variable Predictor construct Construct R2 ß-Value t-Value p-Value Hypothesis test
Effort Expectancy 0.475
Personal Innovativeness PI > EE 0.509 8.507 <0.001*** H4b X
Self-Efficacy SE > EE 0.280 4.304 <0.001*** H4c X
Intention to Use 0.740
Effort Expectancy EE > ITU 0.124 1.911 0.056* H4 X
Habit HA > ITU 0.326 3.694 <0.001*** H6 X
Performance Expectancy PE > ITU 0.407 5.555 <0.001*** H3 X
Perceived Risk PR > ITU (–0.057) 1.045 0.296 H9 O
Social Influence SI > ITU 0.066 1.291 0.197 H5 O
Facilitating Condition FC > ITU (–0.013) 0.211 0.833 H7 O
Hedonic Motivation HM > ITU 0.052 1.060 0.289 H8 O
Social Influence 0.095
Contamination Avoidance CA > SI 0.309 4.253 <0.001*** H5a X
Performance
Expectancy
0.434
Availability1 –
Effort Expectancy EE > PE 0.495 8.409 <0.001*** H4a X
Contamination Avoidance CA > PE 0.350 6.155 <0.001*** H2 X
Table 6 Summary of Results of Hypotheses
(X=Supported, O=not supported; 1: Availability was dropped after pre-test)
5.3.1 Moderating Effects
The Multi-Group Analysis process of SmartPLS 3.3.3. was employed to assess the
moderating effects of age and gender (Ringle et al., 2015). Therefore, three different
groups similarly large age groups were formed and grouped accordingly in SmartPLS.
Similar to the previous analysis bootstrapping method was used to analyse and assess the
moderated constructs by path coefficients, t-value and p-value. Four relationships of our
research model were moderated by age.
Further, there are some differences in the total indirect effect between the moderating
demographic groups. Four relationships were moderated by age:
o Contamination Avoidance (CA) on Social Influence (SI) was supported for the
18-25 years old and ≥ 36 years old and rejected for the 26-35 old
o Effort expectancy (EE) on Intention to Use (ITU) was only validated by
respondents between 26-35 years old
o Habit (HA) on Intention to Use was only supported by the respondents of 36 years
and older
o Self-Efficacy (SE) on Effort Expectancy was supported for the 26-35 and ≥ 36
years old and rejected by the younger respondents 18-25

53
Construct ß18-25 t-Value p-Value ß26-35 t-Value p-Value ß≥ 36 t-Value p-Value
EE > PE 0.378 3.751 <0.001*** 0.274 2.202 0.028** 0.656 8.251 <0.001***
CA > PE 0.362 3.551 <0.001*** 0.473 4.672 <0.001*** 0.262 2.842 0.005***
PI > EE 0.471 3.518 <0.001*** 0.533 5.629 <0.001*** 0.476 5.265 <0.001***
SE > EE 0.103 0.790 0.430 0.214 2.132 0.033** 0.444 5.204 <0.001***
CA > SI 0.299 2.520 0.012** 0.162 1.301 0.193 0.516 4.112 <0.001***
EE > ITU 0.081 0.590 0.556 0.290 3.121 0.002*** (–0.024) 0.171 0.864
HA > ITU 0.185 1.310 0.190 0.283 1.890 0.059* 0.346 2.020 0.043**
PE > ITU 0.432 3.715 <0.001*** 0.546 3.845 <0.001*** 0.390 2.267 0.023**
Table 7 Age as a Moderator
Between the gender groups, male respondents solely rejected the relationship of Social
Influence on Intention to Use, whereas both Habit on Intention to Use and Self-Efficacy
on Effort Expectancy were validated by males and rejected by females.
In addition, between the age groups, there are significant differences in the path
coefficients of (H4a) Effort Expectancy on Performance Expectancy growing in path
weight the older the group, Self-Efficacy on Effort Expectancy (H4c) being significantly
higher for the ≥ 36 year old respondents than 18-25 (ß∆=0.342), and Contamination
Avoidance on Social Influence (H5a) being stronger for ≥ 36 year old respondents.
Construct Female t-Value p-Value Male t-Value p-Value
EE > PE 0.397 3.751 <0.001*** 0.274 2.202 0.028**
CA > PE 0.473 5.708 <0.001*** 0.257 3.452 0.001***
PI > EE 0.580 6.641 <0.001*** 0.464 5.894 <0.001***
SE > EE 0.177 1.613 0.107 0.347 4.511 <0.001***
CA > SI 0.284 2.569 0.010** 0.325 3.392 0.001***
SI > ITU 0.191 2.084 0.037** (-0.031) 0.759 0.448
HA > ITU 0.211 1.613 0.166 0.361 3.572 <0.001***
PE > ITU 0.353 3.198 0.001*** 0.474 4.979 <0.001***
Table 8 Gender as a Moderator
5.3.2 Indirect Effects
Further, we analysed the total indirect effects meaning the total moderated effect a
construct has on the ITU construct with moderating constructs in its path. When a direct
path is insignificant and the indirect effect is significant, it is considered as a full
mediation if both are significant, it is a partial mediation.
Total Indirect
Effects
ß-Value t-Value p-Value
CA > ITU 0.163 4.789 <0.001***
EE > ITU 0.202 4.694 <0.001***
PI > ITU 0.166 3.980 <0.001***
SE > ITU 0.091 2.866 0.004***
PI > PE 0.252 6.654 <0.001***
SE > PE 0.139 3.308 0.001***
Table 9 Total Indirect Effects

54
Even as the effect of SI on ITU is unsignificant, the indirect effect of CA is partially
mediated by PE in and has thus an indirect mediated effect on ITU. Another observation
is that even if we would reject H4: EE > ITU at the 0.05 significance level the indirect
effects of PI and SE on ITU would be significant. Thus, it can be concluded that all three
variables have an indirect effect on ITU, with PE and EE partially mediating.
5.3.3 Summary of the Research Model
In the following Figure 5, we summarise the most important empirical results based on our
extended UTAUT2 model. This allows us to interpret the results and the relationships
between the constructs swiftly. The model shows the standardised path-coefficients with the
corresponding p-values on the connections. The strength of the effect is also indicated by the
width of the relationships. The thicker the connection, the stronger the effect. Further, one
can see all the items used in our final model.
Figure 5 Research Model with Path Coefficients

55
6 Analysis
This chapter presents the results' analysis, hence discussing the findings by referring them
to the extant literature outlined in the literature analysis. Thereby, we discuss the
hypotheses examining their consistency with previous studies and approach reasons for
certain behaviour in the context of our study.
Through a systematic analysis, we were able to test our theorised model. We
incrementally adapted and revised our model to increase fit and validity using several
numerical indicators, such as SRMR, Latent Variable Correlations, t-values and F-
Square. As results of the pre-test, we dropped Hypothesis 1, which contextualising
Availability, due to redundancy issues, thus tested and analysed twelve hypotheses. Based
on the data analysis results, eight of the twelve hypotheses and the moderating effect of
age and gender were confirmed in this study, which to a limited degree validates the
proposed adoption model to explain determinants of user adoption intentions of mobile
payment services during pandemic times. In the following, our results will be discussed
with previous research to generate a deeper understanding of the supported and rejected
effects. The discussion will mainly focus on the direct effects between the elements.
6.1 Significant Towards Intention to Use
6.1.1 Hypothesis 2 CA Predicts PE & ITU
As presented in the results section, Hypothesis 2 was confirmed, hence Contamination
Avoidance (CA) shows a significant effect on Performance Expectancy by the values β =
0.385 and p < 0.001. Consequently, this research provides proof for the influence of
mobile payments enabling users to avoid physical contact with the cashier or waiter and
touching contaminated cash or payment devices, such as pin pads, to impact the user’s
Performance Expectancy (PE) of mobile payment services. Referring to the underlying
principles of PE, which claim it to be the degree to which individuals benefit from using
technology for performing specific actions, the results indicate CA to be a central factor
for increasing the perceived benefit from performing mobile payments (Venkatesh et al.,
2012; Venkatesh et al. (2003). Usefulness, rapidity, or compatibility of technology, which
focus on the technology and its application characteristics, are already common predictors
for PE of mobile payment adoption (Karjaluoto et al., 2019; Morosan & DeFranco, 2016;

56
Oliveira et al., 2016; Venkatesh et al., 2012). In contrast to those common predictors, the
evidence of CA to determine PE adds a predictive element that supports physical health
and protects users from physical threats by technology application. Hence, the constructs
not only are enabling predictors but also protective predictors that impact PE of mobile
payment adoption during the pandemic.
Comparably to Baudier’s et al. (2021) Zhao and Bacao (2021) confirmed the impact of
Perceived Benefits (PB) on the intention to adopt mobile payments during the pandemic.
Hence, Zhao and Bacao (2021) argue as well that “users’ mental expectations are
satisfied by perceiving more reliability and safety of using contactless payment to reduces
contacts among people and maintains social distancing to decrease the COVID-19
transmission risk” (Zhao & Bacao, 2021, p. 14). Thus, the authors claim mental cognition
of the benefits enabled by mobile payments represents a significant determinant for
adoption behaviour, which our study confirmed by the strong effect of CA. Baudier et al.
(2021) firstly developed, tested, and validated the construct of CA in the context of
technology acceptance during pandemic times on the basis of the concept of
contamination concerns. This thesis supports their findings and extends the measurement
on a geographical level since they claim the effect of CA being stronger in the UK and
France than in Italy and China while explaining the variances with differences in culture
and governmental handling of the pandemic (Baudier et al., 2021). Our results confirm
the element’s validity in Germany. CA helps to better understand the mobile payment
adoption during pandemic times and arose as a central element through the health threats
from physical interaction caused by the transmission of contaminations, hence we claim
its relevance might be of temporary character since user sensitivity for avoiding physical
contact will decrease as soon as measures like vaccination penetrated the society. If CA
will still be applicable to explain mobile payment adoption behaviour when those
measures are lifted requires further longitudinal studies in the future.
Additionally, the investigation of indirect effects between the elements revealed that CA
significantly impacts the user’s Intention to Use (ITU) mobile payment services during
the pandemic, which supports the strong position of the element for the overall model.
57
6.1.2 Hypothesis 3 PE Strongly Explains ITU
As presented in the results section, Hypothesis 3 was confirmed, hence PE shows a strong
significant effect on Intention to Use by the values β = 0.644 and p < 0.001. Consequently,
we support previous research that outlines PE as the main driver for users’ intention to
use mobile payment technology independently as well as during a pandemic environment
(Karjaluoto et al., 2019; Oliveira et al., 2016; Zhao & Bacao, 2021). Proofing the
consistency of the impact reveals the strong prediction character of PE and shows that
even if the environment and outer circumstances affect the daily life to be very different
and less comfortable, the main driver for adopting mobile payment services is the user’s
expectancy of it to be useful, easing the payment process, and increasing the efficiency
of the process. Even though user’s strong orientation on the performance benefits from
using mobile payment services, the revealed significance of Hypothesis 2 shows that PE
is driven by the enabling for process optimisation and the protection of health threats
enabled by the performance. Consequently, the significance of Hypothesis 3 generates
supporting evidence for Zhao and Bacao (2021), who argue, utility and practicability of
mobile payments enhance users’ payment efficiency under emergency situations.
Accordingly, during the pandemic mobile payments are perceived as an increasingly
useful and reliable payment method especially through the process being fast and
enabling to avoid any direct and indirect contact among people (Zhao & Bacao, 2021).
Additionally, previous research on mobile payments highlights the importance of its trait
compatibility, which not only applies to studies in Europe but also empirical studies
aiming at Germany (Oliveira et al., 2016; Schilke et al., 2010). Schilke et al. (2010)
provided evidence in their study for perceived compatibility with a factor of 0.82 being
the most important predictor for mobile payment adoption in Germany, supported by
perceived usefulness and perceived ease of use with an effect of 0.02 each. Concluding,
these numbers emphasise that PE epitomises the primary driver of mobile payment
adoption during the pandemic and non-pandemic times in Germany, both with a strong
significant impact. While PE during non-pandemic times mainly is driven by
compatibility, usefulness, and ease of use, during pandemic times, these determinants are
enriched with the contamination avoiding trait of mobile payments, hence the impact on
the intention to adopt mobile payment services enhanced.

58
6.1.3 Hypothesis 4 EE Predicting ITU and PE
Based on previous research on mobile payment adoption, the theoretical model
investigated in this study included Effort Expectancy (EE) as an element expected to
positively influence the elements ITU (H4) and PE (H4a), while being determined by the
elements Personal Innovativeness (PI) (H4b) and Self-Efficacy (SE) (H4c).
This study revealed that EE does significantly impact ITU, hence Hypothesis 4 was
supported, although the effect was relatively low. The explanatory power of H4 includes
a p-value of 0.056, hence 5.6% randomisation affects the relationship of EE and ITU
within our model, which is the highest value among the accepted hypotheses. However,
we found evidence with stronger significances that the Hypotheses 4a, 4b, and 4c are
supported, hence EE does influence ITU directly at a lower lever in Germany during a
pandemic, while the results reveal that it impacts PE at a higher significance level and is
determined by user’s PI and SE.
When comparing our results with previous research, the impact of EE appears to be
influenced by the circumstance of a pandemic as well as the geographic focus of the study.
While previous research on mobile payment adoption during non-pandemic times in other
European countries outlines perceived effort expectancy to significantly affecting
Intention to Use, research investigating the effect of the COVID-19 pandemic on
technology acceptance within the telemedicine, as well as mobile payment adoption in
China rejects hypotheses explaining an effect of EE on ITU (Baudier et al., 2021;
Karjaluoto et al., 2019; Oliveira et al., 2016; Zhao & Bacao, 2021).
Existing research investigating the impact of EE on mobile payment adoption shows
different significances. While Karjaluoto’s et al. (2019) study on mobile payment
adoption in Finland reveals a significance between EE and ITU, Oliveira’s et al. (2016)
study on mobile payment adoption in Portugal rejects the proposed relationship.
Additionally, Baudier et al. (2021) evaluated the relationship in the context of
telemedicine technology adoption during the pandemic to be not significant, just like
Zhao and Bacao (2021), who revealed no significance in their study executed in China
during the pandemic. While Baudier et al. (2021) argue that the not validated relationship
is consistent with previous studies in the healthcare sector, Zhao and Bacao (2021) claim
the reason to be the establishment of smartphone functionalities within user’s daily life,
thus a higher skill level of users in the smartphone utilisation through other applications

59
(Zhao & Bacao, 2021). Additionally, the authors claim the importance of Effort
Expectancy to be low during pandemic times, as, e.g., personal safety and reliability
becoming predominant determinants (Zhao & Bacao, 2021). Nevertheless, the reason for
EE within the frame of this study being significant might originate in the geographical
focus of Germany. As introduced, cash is still the dominant payment mean in Germany,
and the adoption of mobile applications for finance-related matters is relatively low.
Therefore, Germans might perceive the effort for adoption and applying mobile payments
higher than, e.g., people in China, where not only mobile payments established already
on a much larger scale and integrated into applications like the messenger services
WeChat, but smartphone integration into daily life in general. However, the effect shows
the lowest power of explanation of the supported hypotheses, and the effect of EE on PE
revealed values of β = 0.494, p < 0.001, hence stronger. This relationship being
significant is in accordance with the evidence from previous studies on mobile payment
adoption during the pandemic (Zhao & Bacao, 2021), while the relationship was rarely
investigated in mobile payment research prior to the pandemic nor part of the original
UTAUT2 model (Baudier et al., 2021; Karjaluoto et al., 2019; Oliveira et al., 2016;
Venkatesh et al., 2011; Zhao & Bacao, 2021). Consequently, this study provides new
evidence for EE significantly influencing users’ performance expectance towards mobile
payments during the pandemic.
Moreover, this study initially validated the effects of PI (H4b) and SE (H4c) on EE under
the COVID-19 pandemic. Previously Baudier et al. (2021) validated these Hypotheses
within the adoption of telemedicine consultation during the pandemic and initially
implemented the elements as patient traits within the theory of technology adoption in
healthcare (Fan et al., 2018; Wu et al., 2011). In accordance with Baudier et al. (2021)
and previous research in the respective field, users with a higher perceived PI have a
tendency to adopt technological applications regardless of the perceived complexity with
less effort, hence the higher the perceived personal innovativeness, the lower the
perception of the effort caused by the adoption of mobile payment services.
Simultaneously to PI, the SE was adapted from Baudier’s et al. (2021) research on
telemedicine consultation during the pandemic, while additionally it was part of the initial
UTAUT model but was removed in the transition of the UTAUT2 as the direct effect on
the intention to use technology was not significant (Venkatesh et al., 2003; Venkatesh et

60
al., 2012). However, this study revealed that SE significantly impacts EE, since users with
previous experience with technology and the ability to independently adapt complex
technological solutions tend to perceive the required effort of adopting and the complexity
of mobile payment services as less complicated, hence are confident to adopt mobile
payment services self-reliant.
6.1.4 Hypothesis 6 HA as a Minor Predictor for ITU
Previous studies on mobile payment adoption excluded Habit (HA) in their framework,
while Baudier et al. (2021) newly integrated the element in their study on medical
teleconsultation during the COVID-19 pandemic (Karjaluoto et al., 2019; Oliveira et al.,
2016; Schilke et al., 2010; Zhao & Bacao, 2021). However, we found evidence for HA
significantly, although on a lower level, influences the Intention to Use mobile payment
services in Germany during the pandemic (H6). Consequently, we argue that the
increasing integration of smartphones into daily activities supported that using the device
itself becomes a habit. Likewise, we argue that when users initially adopt mobile
payments, hence experience the benefits of the faster and contactless payment process,
people tend to use it regularly as a preferred payment method. In combination with the
pandemic, the perceived benefits of mobile payments increase, hence the tendency of it
becoming a habit gets supported. Nevertheless, the results also reflect that HA has
significant but limited influence since the degree to which users become addicted to using
mobile payments is low. We argue that this limitation originates in conducting payments,
which people perceive as a necessary act connected with spending money.
6.2 No Significance Towards Intention to Use
6.2.1 Hypothesis 5 SI on ITU not Significant
The applied theoretical model included Social Influence (SI) as a determinant for the
intention to use mobile payments (H5) while being reinforced by CA (H5a). The results
reveal no general significant evidence for the impact of SI on ITU during the pandemic,
while CA significantly impacts SI. Previous research outlined a significant effect of SI
on ITU mobile payment services during non-pandemic and pandemic times in other
Countries. Likewise, studies conducted in Germany before the pandemic support
subjective norms, which can be referred to as SI, to be a significant determinant (Oliveira
et al., 2016; Schilke et al., 2010; Zhao & Bacao, 2021). These studies argue that users

61
trust the opinions of the closer environment, hence trust their recommendations, which in
emergency situations assumingly increases while being accelerated by word-of-mouth
and social pressure that influence user’s mental tendency towards mobile payment
adoption (Zhao & Bacao, 2021).
Nevertheless, Baudier et al. (2021) rejected their hypothesis of SI impacting ITU medical
teleconsultation during the pandemic. The authors assume that the impact of SI applies
more significantly to an innovative solution, hence argue medical teleconsultation being
perceived as a videoconference, which would not be new to patients (Baudier et al., 2021).
Similarly, we assume that mobile payment’s characteristics of a contactless payment
process resemble contactless paying with a card and using smartphones to execute actions
related to daily life. Nevertheless, taking a closer look at the moderating factors, this study
reveals a difference in SI’s impact between the male and female participants, which will
be further described in the moderating factors section.
Additionally, the results reveal a significant relationship between CA and SI. We argue
that CA supports SI as the higher users perceive the avoidance of health threats enabled
through mobile payments, the more likely they tend to trust on their social environments
recommendation to use mobile payments since the perceived benefit of mobile payments
and the general attitude towards the technology is already on a higher level.
6.2.2 Hypothesis 7 FC on ITU not Significant
Facilitating Conditions (FC), defined as users' perceptions of the available resources and
the support accessible to perform mobile payments, do not show a direct significant
influence on the ITU in Germany during the pandemic (Venkatesh et al., 2012). The
findings coincide with previous research, which either excluded FC or revealed a non-
significant relationship towards ITU in the context of mobile payment adoption
(Khalilzadeh et al., 2017; Oliveira et al., 2016; Slade, Dwivedi, et al., 2015). Previous
research justified the non-significance through FC rather impacting the actual usage of
users instead of their ITU (Baptista & Oliveira, 2015; Khalilzadeh et al., 2017). We follow
this argumentation since we assume especially support matters are more relevant during
the actual usage of mobile payments instead of the prior adoption intention. Nevertheless,
we expect FC to be increasingly relevant for the intentional adoption behaviour of users

62
that are less technology experienced and digitalised in their daily life as those users might
reflect on the FC of the adoption more likely through increased entrance barriers.
Nevertheless, as this study did focus on Intention to Use as central element, we provide
evidence for FC not significantly influencing the users’ intention to use mobile payments
in Germany during the pandemic.
6.2.3 Hypothesis 8 HM on ITU not Significant
Similar to FC, this study does not reveal a direct and significant impact of Hedonic
Motivation (HM) on ITU mobile payments in Germany during the pandemic. Rejecting
the impact of HM matches previous research on mobile payment adoption (Karjaluoto et
al., 2019; Oliveira et al., 2016). We follow the argumentation of the authors who claim
that the utilitarian character of mobile payments leads to users precepting it as a necessity.
Consequently, the instrumental value of executing transactions mobile does limit the
degree to which enjoyment, having fun, or get entertained through mobile payments,
hence pleasant stimulation predicts ITU. Additionally, during the pandemic, reliability,
speed of the payment process, and risk avoidance gained more relevance for payment
processes compared to the pleasure the execution creates. By looking at the raw data and
the items of the construct, it is worth pointing out that our respondents perceive mobile
payment services as rather enjoyable. Nonetheless, it does not trigger fun or entertainment
and is instead a mean to an end. We may conclude that the often very brief interactions
with mobile payment services and the fact that payments themselves are mostly not
necessarily enjoyable but rather the product and services one gets in return mitigate the
effect of HM on ITU.
6.2.4 Hypothesis 9 PR on ITU not Significant
In contrast to other previous studies, this study does not confirm Hypothesis 9 that
Perceived Risk (PR) has a statistically significant negative effect on ITU. The
respondents’ intention to use might not have been impacted by risks associated with
mobile payment services. This is often one of the arguments stated by vocal proponents
of cash, however, this hypothesis could be influenced by our means of sampling through
digital channels. Interestingly, the 26–35-year-old perceive less risk than the younger and
older respondents this could be rooted in an increasing data protection awareness among
younger people. As expected, older respondents perceive a higher risk related to mobile
payment services, however across all age groups their perception of risk does not affect

63
their usage. Nonetheless, the perceived risk of mobile payment services is a very
polarising topic as the construct has the highest standard deviation STDEV 1.153 among
the constructs and a platykurtic distribution. The respondents worry less about risks and
reap more benefits from the service (Tan et al., 2014). Moreover, one possible explanation
is that electronic payments, in general, are to some extent perceived a risky from a
financial and privacy perspective. However, these risks might be associated with
electronic and card payments in general and not exclusive to mobile payment services.
Further, despite a Perceived Risk, users overcame the fear when they first try using a
service (Iconaru et al., 2012). Consequently, perceptions of risk diminish over time as
personal and others’ experience accumulate. The intense use of mobile and other
electronic devices might have helped to diminish the effect of PR on ITU and resulted in
its insignificance. As a result, this finding demonstrates PR did not significantly
determine users’ use intentions of m-payments during the pandemic.

64
6.3 Moderating Factors
6.3.1 Gender
Our results show that SE has no significant effect for females on EE. Thus, this finding
indicates that females are less likely to expect a higher effort when being in a situation
where direct help might be unavailable. In situations where initial help is needed with
new technology, this does not lead to a higher EE for females. Hence, becoming skilful
and learning how to use that technology is not altered by the need for initial help. This is
similar to previous research, which reported a lower effect of SE on EE (Wang & Wang,
2010). This difference could stem from women being more open in asking for assistance
than men, who often do not want to acknowledge having difficulties with technology.
Whereas, for male respondents with less SE, in other words, the need for help or
assistance for set-up is a predictor of a higher EE. Another relationship that is not
validated for females is the effect of HA on ITU. Accordingly, this means that the
previous usage of mobile payment solution is no sufficient predictor of ITU for females.
This indicates the possibility that females are less prone to be influenced by previous
behaviour and more pragmatic when adopting mobile payment services (Venkatesh et al.,
2012).
In contrast, in between the gender groups, only the effect of SI on ITU is not validated
for male respondents. The difference between male and female respondents is in line with
previous research, according to which males tend to be less susceptible to
recommendations or social influence by close relatives when adopting technology,
whereas females give more value to recommendations by persons close to them
(Bhatiasevi, 2016; Morris & Venkatesh, 2000). Thus, the high number of male
respondents make this effect in the general model with both groups insignificant.
6.3.2 Age
The moderating effect of age is quite unintuitive for the relationship of CA on PE as its
path coefficient is strongest in the 26–35-year-old age group and lowest in the ≤ 36 year
old group (ß18-25 =0.362, ß26-35 =0.473, ß ≤36 =0.262). This finding could be explained by,
on the one hand, the higher risk the middle age group has in comparison to the younger
respondents. On the other hand, it is unexpected for the older age group to have a lower
effect of CA as they are more at risk in case of an infection. Older respondents probably

65
prefer the use of cash, especially for smaller sums, which is confirmed by the greater and
more significant effect of HA on ITU by the oldest age group. The vaccination effort at
the time of our study could have also affected concerns of contamination among the older
age group as older people were preferentially vaccinated in Germany. Similar to
Venkatesh et al. (2012), age and gender alongside each moderate the relationship between
HA and ITU, showing a greater effect of HA with older men. This effect is supposed to
be caused by differences in the processing of information between females and males,
and the differences intensify over time. According to Venkatesh et al. (2012, p.165), “As
age increases, gender differences in learning about technologies from experience become
more pronounced”.
SE on EE is only validated for the middle and stronger for the older age groups similar to
Khalilzadeh et al. (2017) which also reported no significant effect of this hypothesis in
the adoption of NFC payments across respondents younger than 25 year old. This could
be induced from a higher self-efficacy of younger persons, and having grown up with
mobile technology lets younger persons perceive handling mobile systems as more
convenient and natural, thus explaining the insignificance of this relationship for younger
respondents. Nonetheless, the individuals in the older age group, which think they have
higher expertise in mobile payment systems, will perceive the expected effort to adopt
mobile payment solutions as lower. However, this effect is more substantial for the ≥ 35
age group. Regarding the effect of Effort Expectancy on Intention to Use, this is only
validated for the 26-35 Age group, which indicates that for the younger and older group,
there are other factors to explain their Intention to Use mobile payment services. The
effect of PE highest for the 26-35 Age group, which indicates that in their perception, the
performance increase through mobile payments is the strongest predictor of mobile
payment adoption. As the path coefficients tend to be lower in general and less significant,
the adoption behaviour of the younger age group 18-25 is more diffuse. Consequentially,
possibly indicating that mobile payment behaviour might already be normal for this group
and there is an “automatic” adoption. Nonetheless, younger respondents perceive mobile
payment services as more enjoyable than older ones.

66
6.4 Indirect Effects
Analysing the indirect effects allows us to see if second-order constructs are indirectly
significant, thus fully or partially mediated by one or more of the first-order constructs:
PE, EE, and SI in their path on ITU. In this case, we can observe that the indirect effect
of EE on ITU is mediated stronger than unmediated. Thus, it is partially mediated.
Nevertheless, assuming that we would not have classified it as significant at the 0.1 p-
value, the indirect effect of EE would be fully mediated. With the mediating effect of PE,
the strength of the total effect on ITU stronger than directly. Hence, one can observe that
the respondents expected effort and performance interact in explaining adoption
intention.
The constructs CA, PI, and SE have no direct relationship to ITU in our structural model.
By definition, their effects cannot be mediated by other constructs. However, the
constructs present significant indirect effects that might be influenced in their paths
towards ITU. Nonetheless, their indirect effects are important for explaining the
individual intention to use mobile payment services and thus help in increasing reliability.
Even if the constructs directly would not be significant in their relation to ITU. However,
with interdependencies in their path CA, PI and SE have medium strong effects on ITU
and thus are important for understanding mobile services adoption. Accordingly, the
COVID-19 related construct CA, in interaction with other variables, influences mobile
payment adoption behaviour during the pandemic. Similarly, this is true for the other
constructs PI and SE.

67
7 Discussion
In this chapter, we discuss the implications of our results for the extant literature as well
as for practitioners in the field of mobile payments. Further, we outline limitations
inherent in our study, followed by future research suggestions that arise from our findings.
7.1 Theoretical Implications
This study provides empirical insights about critical factors that affect the intention to
adopt mobile payments in Germany during the COVID-19 pandemic, which is due to the
recent characteristic of the pandemic, a limited researched phenomenon. Therefore, our
study contributes to the literature on technology adoption during pandemic times.
Additionally, the literature analysis revealed little research on mobile payment adoption
in Germany, which our study enriches with its empirical analysis.
Moreover, this study introduced a research model, which integrates the elements PE,
Effort Expectancy, HA, HM, FC, SI, ITU, and the moderating factors age and gender of
the UTAUT2 model with the additional elements of PR, CA, SE, PI, and
Availability (AV) that were derived from research targeting mobile payments and
technology acceptance during the COVID-19 pandemic. Hence, our study significantly
contributes to the theoretical development of the emerging literature on mobile payment
and technology acceptance. The introduced research model proposed 13 Hypotheses,
combining the 12 elements. While AV was excluded due to the unattached connection to
the context and redundancy to the FC elements after the pre-test, 12 main elements and
11 Hypotheses were applied and tested, complemented by the moderating factors. While
eight of the Hypotheses were supported, four were rejected on a general level. Namely,
the impact of SI, FC, and HM on ITU mobile payment services during the pandemic was
not proven to be significant. However, our research revealed that PE, similar to previous
research on mobile payment adoption intention, was confirmed to be the main driver of
Intention to Use mobile payments during a pandemic.
Additionally, the UTAUT2 elements EE and HA were confirmed to significantly impact
ITU, albeit the effect was on a low level. The moderating effect of age and gender that
were proposed to moderate the relationships between the elements of the research model
was only partly significant. Along with previous research, we confirmed that age and

68
gender moderate the relationship between Habit and technology adoption. Nonetheless,
there is some incongruity in the relationship strength of CA, the middle aged respondents
have a distinctly higher effect strength of CA while older respondents have a path-
coefficient as the young group. While albeit having a statistically higher risk of
hospitalisation and higher case-fatality rate (Rommel et al., 2021). At the same time, this
finding is comparable to the usage intention of teleconsultation among older persons
(Baudier et al., 2021). It would be interesting for future research to produce insights into
the reluctance of CA of older persons despite higher fatality risks.
Furthermore, this study initially investigated the intention to adopt mobile payments
during the COVID-19 pandemic in Germany, hence provides initial empirical research
data on the impact of the pandemic on the mobile payment adoption behaviour. Therefore,
the conducted research approach can serve as a foundation for further research aiming to
understand Germany's mobile payment adoption intention behaviour during emergency
situations.
Additionally, the proposed research model includes the elements of CA, AV, which
initially were adopted from the medical teleconsultation field and transferred the context
of mobile payment adoption. While AV was excluded, CA was confirmed to significantly
influencing the central driver of the adoption behaviour, PE. Thereby, we confirmed that
mental cognition of the benefits enabled by mobile payments represent a significant
determinant for adoption behaviour, while the majority of previous research focused on
users’ technological perceptions, convenience and utility. Consequently, the elements
enrich the understanding of adoption behaviour during pandemic times, adding a new
perspective on the reasons for PE to be the central determinant.
Moreover, the elements PR, SE, PI completed our research model. While SE and PI
revealed significance towards EE, hence confirmed previous research, PR was not
confirmed to significantly influence ITU mobile payment during the pandemic in
Germany. Specifically, the rejected influence of PR provides new insights into the
geographic influence towards mobile payment adoption. Since Germans are generally
known for cautiousness towards technology and risk avoidance, our results do not
confirm this statement as well as previous research results that have proved the impact of

69
PR on mobile payment adoption conducted in other countries during non-pandemic times.
Consequently, our research provides a basis for further investigation on the role of PR
within technology acceptance intentions in Germany.
7.2 Practical Implications
The study identified areas that may influence mobile payment services adoption by users
and have implication for businesses and payment processing related industries. A primary
contribution is that the main reason for users to adopt mobile payment services, even
during the pandemic, is the performance improvement users expect to derive from the
services. For users, it is vital that the services are perceived as beneficial for their
everyday life. Recognising the moderating role of the demographics is especially crucial
when advertising the services and choosing communication channels. The effect of SI
and the indirect effect of CA on ITU is significant and stronger with females compared
to males. The more socially accepted and its use is proposed by others mobile payment
services are, the more they are adopted by females. Mobile payment service could exploit
this relationship when targeting women, using well respected or relatable female
testimonials might achieve a first step of convincing them to use and adopt the service.
The ITU of males is stronger affected by the PI and SE than by females. Hence, it might
be easier to convince less tech-savvy females to use mobile payment than males.
Also, for mobile payments providers, age differences require a more nuanced approach
to make their services appealing to older customers. To convince older people, their
expected effort they associate with mobile payment services have to be taken into
consideration. One possible solution might be to actively assist those customers in setting
up and how to use the service and ensuring that there is assistance if difficulties occur.
Pointing out service commitment might persuade the older demographic group to adopt
mobile payments and decrease the expected effort involved in using mobile payment
services.
Furthermore, as HA is a good predictor for ITU possible new solutions by banks such as
the European Payment Initiative (EPI), the German ‘#dk’ or the Nordic P27 initiatives
must make a transitioning for older users as seamless as possible and only incrementally

70
change the way to use such services. Otherwise, older persons might have difficulties
adopting potential new services due to the stronger effect of Habit.
Further, persons are critical and perceive some risk related to mobile payment services,
nonetheless, this has no significant effect on actual ITU, rather, promotional campaigns
should emphasise the usefulness of mobile payment services, specifically the faster
transactions, the widespread anytime and anywhere acceptability, secure transactions,
security gains in case of pickpocketing and oversight through the transaction statements.
When considering P2P aspects of the payment services, the network effects should not be
underestimated as the main predictor is PE and a more widespread AV of using the
services helps increase the value for the consumer. Another point contributing to the
usefulness is the integration of the service into a persons’ routine payment behaviour
services are preferable that are directly connected or can directly transfer from and to
bank accounts, thus mobile wallets which are topped up manually are only suitable few
enthusiastic users as they come with high effort expectancy.
7.3 Limitations and Future Research
Even though we intend our research to be as holistic as possible, some aspects limit the
quality of the research, which need to be acknowledged, thus provide a basis for future
research. Besides the choice of the research objective, the applied method, including the
data collection and the proposed research model, the ongoing character of the COVID-19
pandemic impacts the results of our study.
7.3.1 Research Objective
First, our research objective does not distinguish between the three main use case of
mobile payments of POS, P2P, and m-commerce, which differ in their characteristics
tremendously. Since the use case of mobile payments for point-of-sale transactions is
through the physical interaction context especially relevant and assumingly, a vast
majority of the survey participants connected their answers primarily to POS mobile
payments. However, there is only limited research focusing on mobile payment adoption
behaviour in one specific use case. Hence, for further research, we propose to distinguish
between the use cases and investigate the differences in the adoption behaviour
separately. Additionally, we assume the impact of the initially introduced CA element
will show lower significances when focusing on mobile P2P and m-commerce payments
71
through less physical interaction among people. Hence our model requires further
investigation for explaining adoption behaviour for those use cases valid.
Moreover, our study focused on contactless payments utilising a mobile device. Since
mobile POS payments and contactless NFC payments utilising banking cards equal in
many aspects, we suggest investigating the difference in the adoption behaviour between
the two payment methods as we expect similarities, especially regarding the perceived
benefits and PE, while the mobile device as technological enabler might raise the
obstacles. Providing further insights into the obstacles generated through the mobile
device integration enables to better understand the practical requirements for mobile
wallet provider.
7.3.2 Methodology & Data Collection
Our sampling strategy causes limitations that could have altered our research results or
generalisability. Especially as our sampling strategy was conducted using social media
and communication platforms. Firstly, this led to a predominantly young population, and
due to our organic social environment and higher utilisation of mobile or online payment
services by men can lead to a higher interest in the questionnaire, thus, resulting in a
higher participation rate of male respondents. Our respondents were more than 81.9%
aged 45 or younger and 58.1% male. The overall results are consequently skewed towards
male respondents and young respondents. Due to the scope of our study, our sample is
limited in size and not representation a population sample. In our questionnaire, we
explicitly stated that one should only participate if one either lives in Germany or has his
or her habitual residence there, however, we cannot ensure that this is true for every
response.
The questionnaire for our study was adopted from the research by Baudier et al. (2021)
and Venkatesh et al. (2013) and developed in English and translated to Germany. There
can be small, nuanced differences in the perception of the questions by the respondents.
Only 12.5% of our questionnaires were answered using the English version, and the
language was also preselected by our research tool depending on the language settings of
the respondents’ devices. As we used a self-administered online questionnaire, a limited
technical understanding was required to participate. Thus, participants might have

72
different perception towards mobile payment services in comparison to the general
public. An additional disadvantage of a self-administered questionnaire is reduced
objectivity by the self-assessment of their behaviour. Additionally, further demographic
or moderating factors could be included in a future study, which might include factors
such as household income, education, and the urbanity of participants.
Hence, the findings of our study should be viewed with caution and interpretations, and
generalisation should bear this in mind. Future research could turn more focus on the
reasons for the technology adoption of more senior people. For our study, the little
research of payment methods adoption reduces our comparability with the situation
before the pandemic, thus, our conclusions might be limited in explaining a shift in
adoption during the pandemic. Nonetheless, we expect the pandemic to have increased or
even created the effect of Contamination Avoidance in relation to mobile or contactless
payment solutions.
7.3.3 Research Model
In our research model, the number of items per construct was intentionally relatively low
to increase participation and the number of fully completed questionnaires, however, this
can lead to inaccuracies (Hair, Black, et al., 2019). Our model is adjusted to the introduced
constructs by Baudier et al. (2021) to measure new technology adoption precedents due
to the pandemic. As a consequence, this reduces comparability to previous UTAUT
studies and deducing changes in adoption due to the limited number of payment method
adoption studies in Germany. A qualitative study would be more appropriate to deepen
our understanding of the effect mechanism between CA and personal behavioural
changes during the pandemic. Accordingly, we cannot reliably explain reasons or
underlying factors to explain adoption. Other perspectives, such as psychological or
social sciences, could provide a more holistic picture of the antecedents of mobile
payment adoption and why for example, there are differences in the relationship of SI on
ITU. The focus on Intention to Use and not actual use might limits the explanatory value
of our constructs as some technology adoption studies include a second adoption
construct use behaviour, for example, other studies found a significant effect of FC on
actual use behaviour instead of ITU (Alalwan et al., 2017). Similarly, structural and
73
objective elements such as usage frequency and other factors could be incorporated in
future research to increase the objectivity of the answers. As PE is the strongest predictor
of ITU, a more detailed analysis or a subset of this construct might add explanatory value.
Indirect interactions and effects of the construct have not been deeper analysed in this
study and could add additional value as the total indirect effects, meaning the total effect
of a construct on a second-order construct moderated by the construct in its path, are
significant. A follow-up study post-COVID-19 pandemic would contribute to a better
understanding of the effect of the pandemic. Otherwise, a longitudinal evaluation of the
adoption behaviour throughout and after the pandemic would be suitable as well.
7.3.4 Influence of the Pandemic
Furthermore, the results of our research are limited through the external circumstances of
the ongoing COVID-19 pandemic. As we investigated the intentional behaviour towards
mobile payment adoption during the COVID-19 pandemic, the results provide an
approach to understand the behaviour during pandemic emergency situations in a certain
area. As emergency situations differ from another, e g., through the contamination
transmission, our proposed model has limited explanation power for emergency situations
with characteristics other than the COVID-19 pandemic. Additionally, the data collection
was conducted while the pandemic was ongoing, the restrictions rapidly changed over
time, and more information on the virus itself was published. Hence, our results capture
the behaviour for a certain time span during the pandemic and variance in the behaviour
if conducted at a later stage could not be excluded. Similarly, our results do not reflect
the stickiness of the outlined behaviour patterns after the pandemic, hence research is
required to investigate if the outlined impact of the pandemic is long-lasting.
Additionally, measures corresponding to the pandemic differed between each country. As
our study was conducted in Germany, the results have limited explanation power on the
behaviour in other countries, as the context the users’ experience varies, hence the
situation and consequently the items of the model are perceived differently. We
recommend future research to test the model in other countries during emergency
situations to check the cross-national validity of the results.

74
8 Conclusions
This chapter presents the conclusions of our research by summarising the key findings
and implications referring to the initially proposed research question.
Mobile payment services increasingly became beneficial during the COVID-19
pandemic, which turned around everyday life worldwide, and people were advised to
reduce contact among each other to a minimum. However, we identified a lack of research
focusing on mobile payment adoption in Germany and the adoption behaviour during the
pandemic. Accordingly, we identified the specific research gap, formulated the research
questions “How is users’ intention to adopt mobile payment services in Germany
determined during the COVID-19 pandemic? Do established determinants still apply?”
and built a research model utilising ITU as the central element and PE, EE, HM, HA, SI,
and FC as determining elements derived from the UTAUT2 model. We combined the
determining elements of the UTAUT2 with CA, AV, SE, PI, and PR, which we derived
from relevant studies examining mobile payments and die impact of the COVID-19
pandemic and initially proposed 13 Hypotheses describing the relationships and
explaining the intention to adopt mobile payment during the pandemic. After adapting
the model corresponding to pre-test results, thus, excluding Availability, the proposed
research model was tested in a quantitative study in Germany reaching 258 respondents
in total. Analysing the results through a multigroup analysis revealed that eight
Hypotheses were supported and four rejected, hence the explanatory power of the model
is limited. We identified PE as a major predictor for the ITU in the context of mobile
payments, which corresponds with previous research on mobile payment adoption
independent from the pandemic. Furthermore, the initially in the context of mobile
payments introduced element of CA revealed significant prediction power on PE as well
as Intention to Use indirectly. While the influence of Effort Expectancy and Habit was
confirmed, albeit to a low level, the influence of FC, SI, HM, and PR on ITU was not
supported within our study. Additionally, analysing age and gender as moderating factors
revealed a minor impact on the mobile payment adoption behaviour. The moderating
effect of age has been confirmed for some paths. In our study, the most noticeable
differences, similarly to previous research, is that older participants have a lower effect
of CA on PE than younger persons during the pandemic. As expected, female participants

75
revealed a significant impact of SI on their adoption intention and no significant effect of
HA and SE. Hence, we can conclude, that most established determinants relevant for
understanding intentional behaviour to use mobile payments prior to the pandemic also
apply during the pandemic, while significantly supported by contamination avoidance.
For researchers our study provides a basis to understand technology behaviour during
emergency times. However, transferability of the results could be increased by more
respondents and comprehensive population sampling. Additionally, there is further
qualitative research required to understand the relationships between the elements more
in depth as well as the model’s robustness and lasting outside the pandemic. In addition,
we recommend practitioners to investigate deeper into the interdependencies between the
variables. Further, it would be interesting to qualitatively investigate the age dependent
difference in the effect of CA, which findings are matching other COVID-19 related
research but rather unintuitive.

76
9 Appendices
Appendix A Literature Reviews Related to Mobile Payment (m-payment)
Source: Zhao & Bacao (2021)

77
Appendix B Definition and Root Constructs of UTAUT
Source: Oye et al. (2014)

78
Appendix C Self-Administered Survey Design & Information About M-Payments
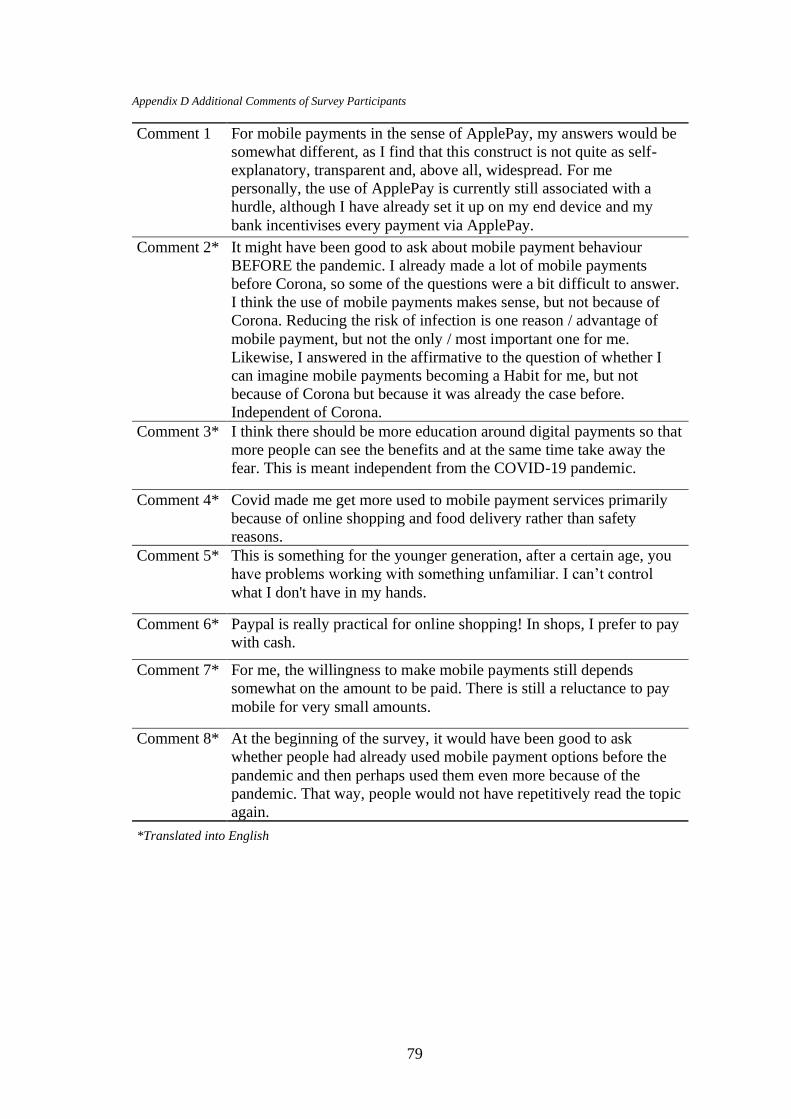
79
Appendix D Additional Comments of Survey Participants
Comment 1 For mobile payments in the sense of ApplePay, my answers would be
somewhat different, as I find that this construct is not quite as self-
explanatory, transparent and, above all, widespread. For me
personally, the use of ApplePay is currently still associated with a
hurdle, although I have already set it up on my end device and my
bank incentivises every payment via ApplePay.
Comment 2* It might have been good to ask about mobile payment behaviour
BEFORE the pandemic. I already made a lot of mobile payments
before Corona, so some of the questions were a bit difficult to answer.
I think the use of mobile payments makes sense, but not because of
Corona. Reducing the risk of infection is one reason / advantage of
mobile payment, but not the only / most important one for me.
Likewise, I answered in the affirmative to the question of whether I
can imagine mobile payments becoming a Habit for me, but not
because of Corona but because it was already the case before.
Independent of Corona.
Comment 3* I think there should be more education around digital payments so that
more people can see the benefits and at the same time take away the
fear. This is meant independent from the COVID-19 pandemic.
Comment 4* Covid made me get more used to mobile payment services primarily
because of online shopping and food delivery rather than safety
reasons.
Comment 5* This is something for the younger generation, after a certain age, you
have problems working with something unfamiliar. I can’t control
what I don't have in my hands.
Comment 6* Paypal is really practical for online shopping! In shops, I prefer to pay
with cash.
Comment 7* For me, the willingness to make mobile payments still depends
somewhat on the amount to be paid. There is still a reluctance to pay
mobile for very small amounts.
Comment 8* At the beginning of the survey, it would have been good to ask
whether people had already used mobile payment options before the
pandemic and then perhaps used them even more because of the
pandemic. That way, people would not have repetitively read the topic
again.
*Translated into English

80
Appendix E VIF Factors of Constructs
Constructs CA EE FC HA HM ITU PE PI PR SE SI
CA 1.038 1.000
EE 2.701 1.038
FC 2.101
HA 3.585
HM 2.205
ITU
PE 2.384
PI 1.295
PR 1.796
SE 1.295
SI 1.400

81
Appendix F Pearson’s Correlation of Research Model
Correlations
AGE GENDER ITU PE SI EE HA HM PR FC CA PI
GENDER Pearson Correlation -.036
Sig. (2-tailed) .601
ITU Pearson Correlation .271** .072
Sig. (2-tailed) .000 .292
PE Pearson Correlation .218** .044 .827**
Sig. (2-tailed) .001 .519 .000
SI Pearson Correlation -.030 -.047 .428** .422**
Sig. (2-tailed) .663 .492 .000 .000
EE Pearson Correlation .382** .072 .663** .563** .274**
Sig. (2-tailed) .000 .293 .000 .000 .000
HA Pearson Correlation .406** .074 .761** .679** .315** .692**
Sig. (2-tailed) .000 .277 .000 .000 .000 .000
HM Pearson Correlation .256** .030 .581** .485** .412** .603** .707**
Sig. (2-tailed) .000 .659 .000 .000 .000 .000 .000
PR Pearson Correlation -.240** -.102 -.577** -.530** -.117 -.543** -.560** -.424**
Sig. (2-tailed) .000 .134 .000 .000 .086 .000 .000 .000
FC Pearson Correlation .354** .068 .492** .438** .269** .650** .575** .449** -.474**
Sig. (2-tailed) .000 .319 .000 .000 .000 .000 .000 .000 .000
CA Pearson Correlation .000 -.044 .288** .420** .306** .183** .278** .254** -.214** .115
Sig. (2-tailed) 1.000 .520 .000 .000 .000 .007 .000 .000 .002 .092
PI Pearson Correlation .316** .245** .555** .461** .193** .637** .659** .507** -.465** .563** .222**
Sig. (2-tailed) .000 .000 .000 .000 .004 .000 .000 .000 .000 .000 .001
SE Pearson Correlation .337** .067 .330** .322** .086 .520** .443** .247** -.345** .491** .123 .475**
Sig. (2-tailed) .000 .324 .000 .000 .207 .000 .000 .000 .000 .000 .072 .000
**. Correlation is significant at the 0.01 level (2-tailed).

82
Appendix G Normality and Descriptive Statistics of Items
Variable Items Mean STDEV Skewness Kurtosis
Intention to Use ITU1 1.60 .862 1.528 2.126
ITU2 1.82 1.025 1.179 .751
ITU3 1.67 .939 1.551 2.141
Performance Expectancy PE1 1.51 .759 1.609 2.695
PE2 1.64 .867 1.323 1.228
PE3 1.88 .979 1.135 1.004
Effort Expectancy EE1 1.65 .881 1.523 2.330
EE2 1.86 .885 1.016 .867
EE3 1.77 .818 1.007 1.193
EE4 1.75 .871 1.117 1.024
Social Influence SI1 2.83 .920 .084 -.247
SI2 2.23 .836 .697 .793
SI3 2.66 .966 .203 -.126
Habit HA1 1.80 1.068 1.364 1.158
HA2 3.51 1.181 -.538 -.471
HA3 1.84 .990 1.192 .922
HA4 1.86 1.088 1.207 .512
Hedonic Motivation HM1 2.54 1.086 .332 -.349
HM2 1.79 .879 1.300 2.070
HM3 3.40 1.025 -.154 -.179
Perceived Risk PR1 2.93 1.216 -.007 -.976
PR2 3.36 1.087 -.363 -.630
PR3 3.55 1.020 -.671 .284
PR4 3.47 1.153 -.538 -.583
Facilitating Conditions FC1 1.56 .764 1.583 2.895
FC2 1.70 .923 1.448 1.835
FC3 2.21 1.011 .663 -.173
Contamination Avoidance CA1 2.40 1.231 .626 -.627
CA2 2.25 1.147 .738 -.380
CA3 2.14 1.116 .938 .183
Personal Innovativeness PI1 2.10 1.047 .727 -.342
PI2 2.39 1.111 .384 -.778
PI3 3.13 1.178 -.151 -.929
Self-Efficacy SE1 1.89 .896 1.113 1.293
SE2 1.88 .879 .850 .295
SE3 1.85 .873 .937 .306

83
Appendix H Overview Questionnaire Answers
Demographics
Intention to Use
Performance Expectancy
Effort Expectancy
0
10
20
30
40
50
60
70
80
90
1 2 3 4 5
EXP
0
20
40
60
80
100
120
140
male female
GENDER
0
5
10
15
20
25
30
18 22 26 30 34 38 42 46 50 54 58 62 66 70
Fre
qu
en
cy
Age
AGE
0
20
40
60
80
100
120
140
1 2 3 4 5
ITU3
0
20
40
60
80
100
120
140
1 2 3 4 5
ITU2
0
20
40
60
80
100
120
140
1 2 3 4 5
ITU1
0
20
40
60
80
100
120
140
1 2 3 4 5
PE2
0
20
40
60
80
100
120
140
1 2 3 4 5
PE1
0
20
40
60
80
100
120
140
1 2 3 4 5
PE3
0
20
40
60
80
100
120
1 2 3 4 5
EE4
0
20
40
60
80
100
120
1 2 3 4 5
EE1
0
20
40
60
80
100
120
1 2 3 4 5
EE2
0
20
40
60
80
100
120
1 2 3 4 5
EE3

84
Social Influence
Habit
Hedonic Motivation
Perceived Risk
0
20
40
60
80
100
120
1 2 3 4 5
SI1
0
20
40
60
80
100
120
1 2 3 4 5
SI2
0
20
40
60
80
100
120
1 2 3 4 5
SI3
0
20
40
60
80
100
120
1 2 3 4 5
HA1
0
20
40
60
80
100
120
1 2 3 4 5
HA2
0
20
40
60
80
100
120
1 2 3 4 5
HA3
0
20
40
60
80
100
120
1 2 3 4 5
HA4
0
10
20
30
40
50
60
70
80
90
100
1 2 3 4 5
HM1
0
10
20
30
40
50
60
70
80
90
100
1 2 3 4 5
HM2
0
10
20
30
40
50
60
70
80
90
100
1 2 3 4 5
HM3
0
10
20
30
40
50
60
70
80
90
100
1 2 3 4 5
PR1
0
10
20
30
40
50
60
70
80
90
100
1 2 3 4 5
PR2
0
10
20
30
40
50
60
70
80
90
100
1 2 3 4 5
PR3
0
10
20
30
40
50
60
70
80
90
100
1 2 3 4 5
PR4

85
Facilitating Conditions
Contamination Avoidance
Personal Innovativeness
Self-Efficacy
0
20
40
60
80
100
120
1 2 3 4 5
FC1
0
20
40
60
80
100
120
1 2 3 4 5
FC2
0
20
40
60
80
100
120
1 2 3 4 5
FC3
0
10
20
30
40
50
60
70
80
90
100
1 2 3 4 5
CA1
0
10
20
30
40
50
60
70
80
90
100
1 2 3 4 5
CA2
0
10
20
30
40
50
60
70
80
90
100
1 2 3 4 5
CA3
0
10
20
30
40
50
60
70
80
90
100
1 2 3 4 5
PI1
0
10
20
30
40
50
60
70
80
90
100
1 2 3 4 5
PI2
0
10
20
30
40
50
60
70
80
90
100
1 2 3 4 5
PI3
0
10
20
30
40
50
60
70
80
90
100
1 2 3 4 5
SE1
0
10
20
30
40
50
60
70
80
90
100
1 2 3 4 5
SE2
0
10
20
30
40
50
60
70
80
90
100
1 2 3 4 5
SE3

86
Appendix I LinkedIn Survey Promotion
87
10 References
Alalwan, A. A., Dwivedi, Y. K., & Rana, N. P. (2017). Factors influencing adoption of
mobile banking by Jordanian bank customers: Extending UTAUT2 with trust.
International Journal of Information Management, 37(3), 99-110.
Allam, H., Bliemel, M., Spiteri, L., Blustein, J., & Ali-Hassan, H. (2019). Applying a
multi-dimensional hedonic concept of intrinsic motivation on social tagging tools:
A theoretical model and empirical validation. International journal of information
management, 45, 211-222. https://doi.org/10.1016/j.ijinfomgt.2018.11.005
Arvidsson, N. (2014). Consumer attitudes on mobile payment services – results from a
proof of concept test. International journal of bank marketing, 32(2), 150-170.
https://doi.org/10.1108/IJBM-05-2013-0048
Babbie, E. R. (2013). The practice of social research (13. , International ed.).
Wadsworth/Cengage Learning.
Bandura, A. (1986). Social foundations of thought and action : a social cognitive theory.
Prentice-Hall.
Baptista, G., & Oliveira, T. (2015). Understanding mobile banking: The unified theory of
acceptance and use of technology combined with cultural moderators. Computers
in human behavior, 50, 418-430. https://doi.org/10.1016/j.chb.2015.04.024
Baudier, P., Kondrateva, G., Ammi, C., Chang, V., & Schiavone, F. (2021). Patients’
perceptions of teleconsultation during COVID-19: A cross-national study.
Technological forecasting & social change, 163, 120510-120510.
https://doi.org/10.1016/j.techfore.2020.120510
Becker, J.-M., Ringle, C. M., Sarstedt, M., & Völckner, F. (2015). How collinearity
affects mixture regression results. Marketing letters, 26(4), 643-659.
https://doi.org/10.1007/s11002-014-9299-9
Bell, E., & Bryman, A. (2007). The Ethics of Management Research: An Exploratory
Content Analysis. British journal of management, 18(1), 63-77.
https://doi.org/10.1111/j.1467-8551.2006.00487.x
Betsch, C., Korn, L., Sprengholz, P., Felgendreff, L., Eitze, S., Schmid, P., & Böhm, R.
(2020). Social and behavioral consequences of mask policies during the COVID-
19 pandemic. Proceedings of the National Academy of Sciences, 117(36), 21851-
21853. https://doi.org/10.1073/pnas.2011674117
Bhatiasevi, V. (2016). An extended UTAUT model to explain the adoption of mobile
banking. Information development, 32(4), 799-814.
https://doi.org/10.1177/0266666915570764
Bigné‐Alcañiz, E., Ruiz‐Mafé, C., Aldás‐Manzano, J., & Sanz‐Blas, S. (2008). Influence
of online shopping information dependency and innovativeness on internet
shopping adoption. Online Information Review, 32(5), 648-667.
https://doi.org/10.1108/14684520810914025
Bitkom. (2020). Wie wollen Sie beim Online-Shopping bezahlen? [Graph].
Brown, S. A., & Venkatesh , V. (2005). Model of Adoption of Technology in Households:
A Baseline Model Test and Extension Incorporating Household Life Cycle. MIS
quarterly, 29(3), 399-426. https://doi.org/10.2307/25148690
Bryman, A., & Bell, E. (2015). Business research methods (4. ed. ed.). Oxford Univ.
Press.
Cao, Q., & Niu, X. (2019). Integrating context-awareness and UTAUT to explain Alipay
user adoption. International journal of industrial ergonomics, 69, 9-13.
https://doi.org/10.1016/j.ergon.2018.09.004

88
Celum, C., Barnabas, R., Cohen, M. S., Collier, A., El-Sadr, W., Holmes, K. K., Johnston,
C., & Piot, P. (2020). Covid-19, Ebola, and HIV — Leveraging Lessons to
Maximize Impact. New England Journal of Medicine, 383(19), e106.
https://doi.org/10.1056/NEJMp2022269
Chen, K.-Y., & Chang, M.-L. (2013). User acceptance of ‘near field
communication’mobile phone service: an investigation based on the ‘unified
theory of acceptance and use of technology’model. The Service Industries
Journal, 33(6), 609-623. https://doi.org/10.1080/02642069.2011.622369
Childers, T. L., Carr, C. L., Peck, J., & Carson, S. (2001). Hedonic and utilitarian
motivations for online retail shopping behavior. Journal of retailing, 77(4), 511-
535. https://doi.org/10.1016/S0022-4359(01)00056-2
Dahlberg, T., Guo, J., & Ondrus, J. (2015). A critical review of mobile payment research.
Electronic commerce research and applications, 14(5), 265-284.
https://doi.org/10.1016/j.elerap.2015.07.006
Davis, F. D. (1989). Perceived Usefulness, Perceived Ease of Use, and User Acceptance
of Information Technology. MIS quarterly, 13(3), 319-340.
https://doi.org/10.2307/249008
Deutsche Bank AG. (2020a). The Future of Payments: Part I. Cash: the Dinosaur Will
Survive … For Now. https://www.dbresearch.com/PROD/RPS_EN-
PROD/PROD0000000000504353/The_Future_of_Payments_-
_Part_I__Cash%3A_the_Dinosau.pdf?undefined&realload=d2sL~86Zz/qpsKIW
P6C5RRR3VtPPmyAMYzoWPJ9IRZp2ujeS~koiEFat2yffiEfQPt2Eq8xsk4KEH
LT2KXO4dQ==
Deutsche Bank AG. (2020b). The Future of Payments: Part II. Moving to Digital Wallets
and the Extinction of Plastic Cards. D. B. AG.
https://www.dbresearch.com/PROD/RPS_EN-
PROD/PROD0000000000504508/The_Future_of_Payments_-
_Part_II__Moving_to_Digita.pdf?undefined&realload=lqrOA51wXo2dq2pIEU
VF7Fe2PNRlMllf5miWouvSJfZGkr2X0Io3YHzxQ6GP~DThNttVtYSeuHy8/q
Sn0E1Jpg==
Deutsche Bundesbank. (2021). Zahlungsverhalten in Deutschland 2020 – Bezahlen im
Jahr der Corona-Pandemie
https://www.bundesbank.de/resource/blob/855642/cabf0971e0f0697d688dcc57c
0cb65d3/mL/zahlungsverhalten-in-deutschland-2020-data.pdf
Di Pietro, L., Guglielmetti Mugion, R., Mattia, G., Renzi, M. F., & Toni, M. (2015). The
Integrated Model on Mobile Payment Acceptance (IMMPA): An empirical
application to public transport. Transportation Research Part C: Emerging
Technologies, 56, 463-479.
https://doi.org/https://doi.org/10.1016/j.trc.2015.05.001
Easterby-Smith, M., Thorpe, R., Jackson, P. R., & Jaspersen, L. J. (2018). Management
& business research (6th edition. ed.). London : SAGE.
Eisinga, R. N., Grotenhuis, H. F. t., & Pelzer, B. J. (2013). The reliability of a two-item
scale: Pearson, Cronbach or Spearman-Brown? International journal of public
health, 58(4), 637-642. https://doi.org/10.1007/s00038-012-0416-3
EPI Interim Company SE. (2021, 2021/05/03/). Creating a comprehensive payment
solution for Europe. Retrieved 24.04.2021 from https://www.epicompany.eu
Esselink, H., & Hernández, L. (2017). The use of cash by households in the euro area.
ECB Occasional Paper(201). https://doi.org/10.2866/377081
89
Fan, W., Liu, J., Zhu, S., & Pardalos, P. M. (2018). Investigating the impacting factors
for the healthcare professionals to adopt artificial intelligence-based medical
diagnosis support system (AIMDSS). Annals of operations research, 294(1-2),
567-526. https://doi.org/10.1007/s10479-018-2818-y
Fishbein, M., & Ajzen, I. (1975). Belief, attitude, intention and behavior : an introduction
to theory and research. Addison-Wesley.
Flavian, C., Guinaliu, M., & Lu, Y. (2020). Mobile payments adoption – introducing
mindfulness to better understand consumer behavior. International journal of
bank marketing, 38(7), 1575-1599. https://doi.org/10.1108/IJBM-01-2020-0039
Friedkin, N. E., & Johnsen, E. C. (2011). Social influence network theory a sociological
examination of small group dynamics. Cambridge University Press.
Gerpott, T. J., & Kornmeier, K. (2009). Determinants of customer acceptance of mobile
payment systems. International Journal of Electronic Finance, 3(1), 1-30.
https://doi.org/10.1504/IJEF.2009.024267
Gerpott, T. J., & Meinert, P. (2017). Who signs up for NFC mobile payment services?
Mobile network operator subscribers in Germany. Electronic Commerce
Research and Applications, 23, 1-13.
https://doi.org/https://doi.org/10.1016/j.elerap.2017.03.002
Ginner, M. (2018). Akzeptanz von digitalen Zahlungsdienstleistungen. Springer.
Gray, D. E. (2017). Doing research in the business world. SAGE.
Guba, E. (1981). Criteria for assessing the trustworthiness of naturalistic inquiries. ECTJ,
29(2), 75-91. https://doi.org/10.1007/BF02766777
Gursoy, D., & Chi, C. G. (2020). Effects of COVID-19 pandemic on hospitality industry:
review of the current situations and a research agenda. Journal of Hospitality
Marketing & Management, 29(5), 527-529.
https://doi.org/10.1080/19368623.2020.1788231
Guzzo, T., Ferri, F., & Grifoni, P. (2016). A model of e-commerce adoption (MOCA):
consumer's perceptions and behaviours. Behaviour & Information Technology,
35(3), 196-209. https://doi.org/10.1080/0144929X.2015.1132770
Hackl, K. (2020). Bitkom Position Paper on the Retail Payments Strategy for the
EU https://www.bitkom.org/Bitkom/Publikationen/Bitkom-Position-Paper-on-
the-Retail-Payments-Strategy-for-the-EU
Hadi, R., & Valenzuela, A. (2020). Good Vibrations: Consumer Responses to
Technology-Mediated Haptic Feedback. Journal of Consumer Research, 47(2),
256-271. https://doi.org/10.1093/jcr/ucz039
Hair, J. F., Black, W. C., Babin, B. J., & Anderson, R. E. (2019). Multivariate data
analysis (Eighth Edition ed.). Cengage.
Hair, J. F., Ringle, C. M., & Sarstedt, M. (2011). PLS-SEM: Indeed a Silver Bullet.
Journal of marketing theory and practice, 19(2), 139-152.
https://doi.org/10.2753/MTP1069-6679190202
Hair, J. F., Risher, J. J., Sarstedt, M., & Ringle, C. M. (2019). When to use and how to
report the results of PLS-SEM. European business review, 31(1), 2-24.
https://doi.org/10.1108/EBR-11-2018-0203
Hair, J. F., Sarstedt, M., Hopkins, L., & G. Kuppelwieser, V. (2014). Partial least squares
structural equation modeling (PLS-SEM): An emerging tool in business research.
European business review, 26(2), 106-121. https://doi.org/10.1108/EBR-10-
2013-0128
Hans van der, H. (2004). User Acceptance of Hedonic Information Systems. MIS
quarterly, 28(4), 695-704. https://doi.org/10.2307/25148660
90
Hazée, S., & Van Vaerenbergh, Y. (2020). Customers' contamination concerns: an
integrative framework and future prospects for service management. Journal of
Service Management, 32(2), 161-175. https://doi.org/10.1108/JOSM-04-2020-
0129
Heidenreich, S., & Spieth, P. (2013). Why innovations fail—The case of passive and
active innovation resistance. International Journal of Innovation Management,
17(05), 1350021. https://doi.org/10.1142/S1363919613500217
Henkel, J. (2002). Mobile Payment. In G. Silberer, J. Wohlfahrt, & T. Wilhelm (Eds.),
Mobile Commerce: Grundlangen, Geschäftsmodelle, Erfolgsfaktoren (pp. 327-
351). Gabler Verlag. https://doi.org/10.1007/978-3-322-90464-5_18
Henseler, J., Ringle, C. M., & Sarstedt, M. (2015). A new criterion for assessing
discriminant validity in variance-based structural equation modeling. Journal of
the Academy of Marketing Science, 43(1), 115-135.
https://doi.org/10.1007/s11747-014-0403-8
Hsu, C.-L., Lu, H.-P., & Hsu, H.-H. (2007). Adoption of the mobile Internet: An empirical
study of multimedia message service (MMS). Omega, 35(6), 715-726.
https://doi.org/10.1016/j.omega.2006.03.005
Hu, L.-t., & Bentler, P. M. (1999). Cutoff criteria for fit indexes in covariance structure
analysis: Conventional criteria versus new alternatives. Structural equation
modeling, 6(1), 1-55. https://doi.org/10.1080/10705519909540118
Hulland, J. (1999). Use of Partial Least Squares (PLS) in Strategic Management
Research: A Review of Four Recent Studies. Strategic management journal,
20(2), 195-204. https://doi.org/10.1002/(SICI)1097-
0266(199902)20:2<195::AID-SMJ13>3.0.CO;2-7
Humbani, M., & Wiese, M. (2018). A Cashless Society for All: Determining Consumers’
Readiness to Adopt Mobile Payment Services. Journal of African business, 19(3),
409-429. https://doi.org/10.1080/15228916.2017.1396792
Iconaru, C., Perju, A., & Macovei Octav, I. (2012). THE INFLUENCE OF PERCEIVED
RISK ON CONUMERS' INTENTION TO BUY ONLINE: A META-
ANALYSIS OF EMPIRICAL RESULTS. Journal of Information Systems &
Operations Management, 6(1), 1.
Jahanmir, S. F., & Lages, L. F. (2015). The lag-user method: Using laggards as a source
of innovative ideas. Journal of Engineering and Technology Management, 37, 65-
77. https://doi.org/10.1016/j.jengtecman.2015.08.002
Jahanmir, S. F., & Lages, L. F. (2016). The late-adopter scale: A measure of late adopters
of technological innovations. Journal of Business Research, 69(5), 1701-1706.
https://doi.org/10.1016/j.jbusres.2015.10.041
Johnson, V. L., Kiser, A., Washington, R., & Torres, R. (2018). Limitations to the rapid
adoption of M-payment services: Understanding the impact of privacy risk on M-
Payment services. Computers in Human Behavior, 79, 111-122.
https://doi.org/10.1016/j.chb.2017.10.035
Karjaluoto, H., Shaikh, A. A., Leppäniemi, M., & Luomala, R. (2019). Examining
consumers’ usage intention of contactless payment systems. International journal
of bank marketing, 38(2), 332-351. https://doi.org/10.1108/IJBM-04-2019-0155
Khalilzadeh, J., Ozturk, A. B., & Bilgihan, A. (2017). Security-related factors in extended
UTAUT model for NFC based mobile payment in the restaurant industry.
Computers in human behavior, 70, 460-474.
https://doi.org/10.1016/j.chb.2017.01.001

91
Kim, S. S., Malhotra, N. K., & Narasimhan, S. (2005). Research note—two competing
perspectives on automatic use: A theoretical and empirical comparison.
Information systems research, 16(4), 418-432.
https://doi.org/10.1287/isre.1050.0070
Kline, R. B. (2011). Principles and practice of structural equation modeling (3rd ed. ed.).
Guilford Press.
Lidl Dienstleistung GmbH & Co. KG. (2020). Lidl Plus für alle: Die digitale
Kundenkarte geht bundesweit an den Start
https://unternehmen.lidl.de/pressreleases/2020/200911_lidl-plus
Limayem, M., Hirt, S. G., & Cheung, C. M. (2007). How habit limits the predictive power
of intention: The case of information systems continuance. MIS quarterly, 705-
737. https://doi.org/10.2307/25148817
Maillet, É., Mathieu, L., & Sicotte, C. (2015). Modeling factors explaining the
acceptance, actual use and satisfaction of nurses using an Electronic Patient
Record in acute care settings: An extension of the UTAUT. International journal
of medical informatics, 84(1), 36-47.
https://doi.org/10.1016/j.ijmedinf.2014.09.004
Mallat, N., Ondrus, J., Zmijewska, A., & Dahlberg, T. (2008). Past, present and future of
mobile payments research: A literature review. Electronic commerce research
and applications., 7(2), 165-181. https://doi.org/10.1016/j.elerap.2007.02.001
Manshad, M. S., & Brannon, D. (2021). Haptic-payment: Exploring vibration feedback
as a means of reducing overspending in mobile payment. Journal of Business
Research, 122, 88-96.
https://doi.org/https://doi.org/10.1016/j.jbusres.2020.08.049
Marques, O. (2016). Innovative Technologies in Everyday Life (1st 2016. ed.). Springer
International Publishing. https://doi.org/10.1007/978-3-319-45699-7
Marriott, H. R., & Williams, M. D. (2018). Exploring consumers perceived risk and trust
for mobile shopping: A theoretical framework and empirical study. Journal of
retailing and consumer services, 42, 133-146.
https://doi.org/10.1016/j.jretconser.2018.01.017
Mason, C. H., & Perreault, W. D. (1991). Collinearity, Power, and Interpretation of
Multiple Regression Analysis. Journal of marketing research, 28(3), 268-280.
https://doi.org/10.1177/002224379102800302
McKenna, B., Tuunanen, T., & Gardner, L. (2013). Consumers’ adoption of information
services. Information & Management, 50(5), 248-257.
https://doi.org/10.1016/j.im.2013.04.004
McKinsey & Company. (2020). The 2020 McKinsey Global Payments Report. M.
Company.
https://www.mckinsey.com/~/media/McKinsey/Industries/Financial%20Services
/Our%20Insights/Accelerating%20winds%20of%20change%20in%20global%2
0payments/2020-McKinsey-Global-Payments-Report-vF.pdf?shouldIndex=false
Morosan, C., & DeFranco, A. (2016). It's about time: Revisiting UTAUT2 to examine
consumers’ intentions to use NFC mobile payments in hotels. International
journal of hospitality management, 53, 17-29.
https://doi.org/10.1016/j.ijhm.2015.11.003
Morris, M. G., & Venkatesh, V. (2000). AGE DIFFERENCES IN TECHNOLOGY
ADOPTION DECISIONS: IMPLICATIONS FOR A CHANGING WORK
FORCE. Personnel psychology, 53(2), 375-403. https://doi.org/10.1111/j.1744-
6570.2000.tb00206.x

92
Morris, M. G., Venkatesh, V., & Ackerman, P. L. (2005). Gender and age differences in
employee decisions about new technology: an extension to the theory of planned
behavior. IEEE transactions on engineering management, 52(1), 69-84.
https://doi.org/10.1109/TEM.2004.839967
Oborn, E., Barrett, M., Orlikowski, W., & Kim, A. (2019). Trajectory Dynamics in
Innovation: Developing and Transforming a Mobile Money Service Across Time
and Place. Organization science (Providence, R.I.), 30(5), 1097-1123.
https://doi.org/10.1287/orsc.2018.1281
Oliveira, T., Thomas, M., Baptista, G., & Campos, F. (2016). Mobile payment:
Understanding the determinants of customer adoption and intention to
recommend the technology. Computers in human behavior, 61, 404-414.
https://doi.org/10.1016/j.chb.2016.03.030
Oye, N. D., A.Iahad, N., & Ab.Rahim, N. (2014). The history of UTAUT model and its
impact on ICT acceptance and usage by academicians. Education and information
technologies, 19(1), 251-270. https://doi.org/10.1007/s10639-012-9189-9
P27 Nordic Payments Platform. (2021). Making the future ofpayments come true.
Retrieved 2021-05-23 from https://nordicpayments.eu/
Pratz, A., Koller, M., Gärtner, J., & Klebe, L. (2020). European Open Banking: only
slightly ajar (Strategy& Payments and Open Banking Survey, Issue.
https://www.strategyand.pwc.com/de/de/studien/2020/open-banking-and-
payments-survey/open-banking-and-payments-survey.pdf
Rehncrona, C. (2018). Young consumers’ valuations of new payment services.
International Journal of Quality and Service Sciences.
https://doi.org/10.1108/IJQSS-11-2017-0111
Riddell, S., Goldie, S., Hill, A., Eagles, D., & Drew, T. W. (2020). The effect of
temperature on persistence of SARS-CoV-2 on common surfaces. Virology
journal, 17(1), 1-7. https://doi.org/10.1186/s12985-020-01418-7
Ringle, C. M., Wende, S., & Becker, J.-M. (2015). SmartPLS 3. In SmartPLS GmbH.
http://www.smartpls.com.
RND/dpa. (2021). Girocard mit Rekordzahlen: Deutlicher Schub für kontaktloses
Bezahlen. https://www.rnd.de/wirtschaft/girocard-mit-rekordzahlen-deutlicher-
schub-fur-kontaktloses-bezahlen-DMUI7FE2CK4DYN6NAWRTE3JWTY.html
Rogers, E. M. (2003). Diffusion of innovations (5. ed. ed.). Free press.
Rommel, A., von der Lippe, E., Plaß, D., Ziese, T., Diercke, M., Haller, S., & Wengler,
A. (2021). COVID-19-Krankheitslast in Deutschland im Jahr 2020.
https://doi.org/https://doi.org/10.3238/arztebl.m2021.0147
Rondan-Cataluña, F. J., Arenas-Gaitán, J., & Ramírez-Correa, P. E. (2015). A comparison
of the different versions of popular technology acceptance models: A non-linear
perspective. Kybernetes, 44(5), 788-805. https://doi.org/10.1108/K-09-2014-
0184
Sarstedt, M., Hair, J. F., Ringle, C. M., Thiele, K. O., & Gudergan, S. P. (2016).
Estimation issues with PLS and CBSEM: Where the bias lies. Journal of business
research, 69(10), 3998-4010. https://doi.org/10.1016/j.jbusres.2016.06.007
Saunders, M., Lewis, P., Thornhill, A., & Dawson, B. (2012). Research methods for
business students (6th edition. ed.). Pearson.
Schilke, O., Wirtz, B. W., & Schierz, P. G. (2010). Understanding consumer acceptance
of mobile payment services: An empirical analysis. Electronic commerce
research and applications., 9(3), 209-216.
https://doi.org/10.1016/j.elerap.2009.07.005

93
Sharif, A., & Raza, S. (2017). The influence of hedonic motivation, self-efficacy, trust
and habit on adoption of internet banking: A case of developing country.
International Journal of Electronic Customer Relationship Management, 11, 1.
https://doi.org/10.1504/IJECRM.2017.086750
Slade, E., Dwivedi, Y., Piercy, N., & Williams, M. (2015). Modeling Consumers’
Adoption Intentions of Remote Mobile Payments in the United Kingdom:
Extending UTAUT with Innovativeness, Risk, and Trust: CONSUMERS’
ADOPTION INTENTIONS OF REMOTE MOBILE PAYMENTS. Psychology
& marketing, 32(8), 860-873. https://doi.org/10.1002/mar.20823
Slade, E., Williams, M., Dwivedi, Y., & Piercy, N. (2015). Exploring consumer adoption
of proximity mobile payments. Journal of Strategic Marketing, 23(3), 209-223.
https://doi.org/10.1080/0965254X.2014.914075
Statista. (2020). Welche Instant-Messaging-Dienste haben Sie gestern genutzt?
https://de.statista.com/statistik/daten/studie/777771/umfrage/tagesreichweite-
von-instant-messaging-diensten-in-deutschland/
Statista. (2021a). Cashless Society in Europe: A Winding Road. A Statista DossierPlus
on Europe's Transition from Cash Money to Cards and Mobile Payments. Statista.
https://www.statista.com/study/79347/cashless-society-in-europe-a-winding-
road/
Statista. (2021b). FinTech Report 2021 – Digital Payments: Statista Digital Market
Outlook – Segment Report. Statista.
https://www.statista.com/study/41122/fintech-report-digital-payments/
Statista. (2021c). Forecast of the smartphone penetration in Europe from 2010 to 2025.
https://www.statista.com/forecasts/1147144/smartphone-penetration-forecast-in-
europe
Statista. (2021d). Mobile POS Payments - Germany.
https://www.statista.com/outlook/dmo/fintech/digital-payments/mobile-pos-
payments/germany?currency=EUR
Sun, H., Fang, Y., & Zou, H. (2016). Choosing a Fit Technology: Understanding
Mindfulness in Technology Adoption and Continuance. Journal of the
Association for Information Systems, 17(6), 377-412.
https://doi.org/10.17705/1jais.00431
Talke, K., & Heidenreich, S. (2014). How to Overcome Pro‐Change Bias: Incorporating
Passive and Active Innovation Resistance in Innovation Decision Models. The
Journal of product innovation management, 31(5), 894-907.
https://doi.org/10.1111/jpim.12130
Tan, G. W.-H., Ooi, K.-B., Chong, S.-C., & Hew, T.-S. (2014). NFC mobile credit card:
The next frontier of mobile payment? Telematics and informatics, 31(2), 292-307.
https://doi.org/10.1016/j.tele.2013.06.002
Thomas, Y., Vogel, G., Wunderli, W., Suter, P., Witschi, M., Koch, D., Tapparel, C., &
Kaiser, L. (2008). Survival of influenza virus on banknotes. Applied and
environmental microbiology, 74(10), 3002-3007.
https://doi.org/10.1128/AEM.00076-08
Van der Boor, P., Oliveira, P., & Veloso, F. (2014). Users as innovators in developing
countries: The global sources of innovation and diffusion in mobile banking
services. Research Policy, 43(9), 1594-1607.
https://doi.org/10.1016/j.respol.2014.05.003

94
Venkatesh, V., & Davis, F. D. (2000). A Theoretical Extension of the Technology
Acceptance Model: Four Longitudinal Field Studies. Management science, 46(2),
186-204. https://doi.org/10.1287/mnsc.46.2.186.11926 (Management Science)
Venkatesh, V., Morris, M. G., Davis, G. B., & Davis, F. D. (2003). User Acceptance of
Information Technology: Toward a Unified View. MIS quarterly, 27(3), 425-478.
https://doi.org/10.2307/30036540
Venkatesh, V., Thong, J. Y. L., Chan, F. K. Y., Hu, P. J. H., & Brown, S. A. (2011).
Extending the two‐stage information systems continuance model: incorporating
UTAUT predictors and the role of context. Information systems journal (Oxford,
England), 21(6), 527-555. https://doi.org/10.1111/j.1365-2575.2011.00373.x
Venkatesh, V., Thong, Y. L. T., & Xu, X. (2012). Consumer Acceptance and Use of
Information Technology: Extending the Unified Theory of Acceptance and Use
of Technology. MIS quarterly, 36(1), 157-178. https://doi.org/10.2307/41410412
Wang, H.-Y., & Wang, S.-H. (2010). User acceptance of mobile internet based on the
Unified Theory of Acceptance and Use of Technology: Investigating the
determinants and gender differences. Social behavior and personality, 38(3), 415-
426. https://doi.org/10.2224/sbp.2010.38.3.415
Weimert, M., & Saiag, A. (2020). COVID-19 AND EUROPEAN RETAIL PAYMENTS.
https://www.oliverwyman.com/our-expertise/insights/2020/jun/covid-19-and-
european-retail-payments.html
WHO. (2020). Erklärung – Verhaltensbezogene Erkenntnisse sind wertvoll für die
Planung angemessener Maßnahmen für die Pandemiebekämpfung. In.
WHO. (2021). WHO Coronavirus Disease (COVID-19) Dashboard.
https://covid19.who.int
Wu, I.-L., Li, J.-Y., & Fu, C.-Y. (2011). The adoption of mobile healthcare by hospital's
professionals: An integrative perspective. Decision Support Systems, 51(3), 587-
596. https://doi.org/10.1016/j.dss.2011.03.003
Yi, M. Y., Jackson, J. D., Park, J. S., & Probst, J. C. (2006). Understanding information
technology acceptance by individual professionals: Toward an integrative view.
Information & management, 43(3), 350-363.
https://doi.org/10.1016/j.im.2005.08.006
ZEIT Magazin. (2021). Corona-Maßnahmen: Zu, aber nicht geschlossen. In: ZEIT
Magazin.
Zhao, Y., & Bacao, F. (2021). How Does the Pandemic Facilitate Mobile Payment? An
Investigation on Users' Perspective under the COVID-19 Pandemic. International
journal of environmental research and public health, 18(3), 1016.
https://doi.org/10.3390/ijerph18031016
Top Related