


Languages
Pages
Legal

0
Mitchell’s Musings
Second Quarter 2013
For the Employment Policy Research Network – EPRN
www.employmentpolicy.org
Format may differ from originals
1
Mitchell’s Musings 4-1-2013: Meany’s Political Boiden
Daniel J.B. Mitchell
In earlier musings, we have looked at the political influence of organized labor during the 1960s
and 1970s using various surreptitious presidential tape and other recordings. In the 1960s,
during the Kennedy-Johnson era, labor figures such as AFL-CIO president George Meany had
access to the White House despite conflict with unions over the official anti-inflation wage-price
guideposts. After the 1968 election of Richard Nixon, a Republican, the linkage continued but
through George Shultz who played various roles including Secretary of Labor, Director of the
Office of Management and Budget, and Secretary of the Treasury. President Nixon viewed
Meany as unreasonable – particularly in the context of his mandatory wage-price controls
program. Nixon hoped to appeal to union workers directly, bypassing Meany, particularly as
the 1972 elections approached.
As it turned out, after the Democrats chose George McGovern as their 1972 nominee – largely
due to the divisive Vietnam War issue – the AFL-CIO and Meany did not endorse any candidate
and Nixon was re-elected in a landslide. Apart from the Vietnam issue, however, another
background factor was that the political parties in the early 1970s were not anywhere near as
polarized as they are today. Meany disliked both Nixon and McGovern but there were
Republicans in that period he could support. And Nixon’s labor record included such actions as
signing the Occupational Health and Safety Act of 1970. Later Nixon would espouse an
employer mandate for providing health insurance – an effort that did not succeed; in
September 1974 he signed the Employee Retirement Income Security Act which protected and
insured defined-benefit pension plans.
By 1974, however, Nixon was becoming enmeshed in the Watergate scandal. Conceivably, that
scandal could have chipped away at voter support for Republicans in the House and Senate. In
New York State, Republican Senator Jacob Javits was running for re-election against Democrat
Ramsey Clark (who had been U.S. Attorney General under Lyndon Johnson) and Conservative
Party candidate Barbara Keating. A Conservative in the race could have peeled off Republican
votes, throwing the election to Clark. However, Meany and the national AFL-CIO supported
Republican Javits as a friend of labor. You can hear a five-minute radio ad that I have posted in
which Meany himself as the spokesperson runs through labor’s agenda and concludes with an
endorsement of Javits: http://www.youtube.com/watch?v=L-pO6pI0jCw. Clark – who Meany
would have regarded as a detested McGovern-style Democrat – is not mentioned.1
1 Clark at the time was an anti-Vietnam War Democrat as was McGovern. Subsequently, Clark moved
further and further to the left.
2
It is hard to assess how effective the support of Meany for Javits was in that election. Meany’s
accent (“earl” companies, tax “boiden”) would clearly have labeled him as a genuine New
Yorker – at least from the City if not the state. And the agenda he espoused – taxes on the
wealthy, worker safety, universal health care, full employment - in the first part of the ad would
generally have appealed to a liberal electorate that might otherwise have tended to vote
Democratic. The ad essentially ties Javits to that agenda. In the end, Javits won with a plurality
of the votes – 45% - with Clark receiving 38% and Keating 16%.
Of course, organized labor still plays a role in national, state, and local political campaigns –
although five-minute radio ads – as opposed to 30-60 second TV and radio soundbites – would
be unusual today. The difference is that although its percentage of the workforce was already
noticeably eroding by the 1970s, a major union leader – particularly the AFL-CIO president –
would have been understood by listeners as an important figure. His personal endorsement of
Javits would have carried weight.
Some radio listeners in 1974 may have been influenced in their voting behavior by the Meany
endorsement – either positively or negatively. It would be hard to achieve the same effect
today if, say, the current AFL-CIO president – Richard Trumka – transcribed a similar campaign
endorsement.2 The name recognition for the president of the AFL-CIO would not be there
today. And, of course, in today’s more polarized political climate, it would be hard to find a
significant Republican office seeker that Trumka would or could endorse or who would want
such an endorsement. In the words of the old Dylan song, the times, they are a-changin’.
2 Trumka claimed that unions played an important role in the Obama reelection of 2012:
http://www.salon.com/2012/11/12/labor_chief_richard_trumka_we_wont_be_taken_for_granted/. But the
impact was through money and mobilization rather than reliance on a recognized personal endorsement. And he
has expressed concern about the degree to which Obama backs labor’s agenda:
http://expressmilwaukee.com/article-20785-the-newsmaker-memo-an-interview-with-afl-cio-president-richard-
trumka.html.
3
Mitchell’s Musings 4-8-13: Seeing Through Transparency and Other Buzzwords
Daniel J.B. Mitchell
If there is one word that has acquired a halo recently, it is “transparency.” Transparency is said to be a
Good Thing for the public sector to have. You should have access to public documents, right down to
individual checks written from public entities to outside suppliers. Oddly, no one seems to argue that
such transparency would be good for the private sector. Thus, as pointed out in prior musings, public
sector workers’ salary information is now often posted on newspaper websites (despite the possible risk
of identity theft or other harassment that might result). Exam scores of individual teachers on value
added tests have also been reported to the general public. The same newspapers that post such
information would not think of posting their own payroll schedules on the web or the performance
appraisals of their own employees.
Emails of faculty at public universities have been sought through state equivalents of the Freedom of
Information Act. Such emails are not, however, available to outsiders for similar private universities.
But there seem to be some limits on such transparency. For example, records of patients at hospitals –
public or private – are supposed to be kept confidential and various penalties can be imposed for
disclosure. Student records at both public and private universities are also supposed to be kept
confidential. So apparently, some constraints on the goodness of transparency are recognized.
The issue with transparency and other motherhood-and-apple-pie words is that the words become the
goals rather than the goals determining what instruments to use. I recently came across a rating of
various states’ degree of transparency on their budgetary websites.3 My home state of California came
out near the bottom. The report’s authors want state budget websites to get down to the micro details,
showing – as noted above - canceled checks by public agencies and the like. If you are trying to ferret
out corruption, such minute records could be useful. If you are trying to evaluate or make state fiscal
policy, however, looking at canceled checks won’t be of much help.
The biggest problem state governments have faced in recent years was a big drop in tax revenue as a
result of the Great Recession, an event which public-sector transparency could not avert. The state-and-
local aftermath of the Great Recession remains a drag on the economy, nationally and here in California.
Employment in the private sector has been recovering, albeit modestly, and with no transparency
applied. But employment at the state and local level has at best been flat.
California certainly does have problems in its state fiscal affairs and, indeed, in its basic bookkeeping. As
I have noted in earlier musings and through other forums, a major problem is that commonly-
understood words such as “surplus” and “deficit” are misused at the state and local levels. Time periods
3 The report by the CalPIRG Education Fund is available at:
http://www.calpirgedfund.org/sites/pirg/files/reports/CA_Following_the_Money_screen_final.pdf. California had
a transparency website http://www.transparency.ca.gov/default.aspx but it was shut down, ostensibly for budget
reasons.
4
over which the concepts are applied vary. Flow measures are confused with stocks. (Deficit and debt
are not the same thing.) Vague terms such as budget “gaps,” ”shortfalls,” or “holes” are utilized without
clear definition. And it appears that California is not alone in exhibiting such deficiencies –fuzzy usage
seems common in state and local governments more generally.
But looking at canceled checks wouldn’t help to remedy sloppy terminology. On the other hand,
California has had some recent scandals in which more detailed information might have helped. One
state agency running public parklands, for example, turned out after the fact to have reserves that could
have been used in cushioning the fiscal crisis caused by the Great Recession. But agency heads seemed
unaware of their own money. A better information system would have helped both managers and – if
incompetence or corruption were involved – journalists looking for evidence.
The key problem is that phrases and words can inadvertently set agendas. Another study was produced
recently about public higher education.4 There is much Good Government lingo included in the study
about such concepts as “performance metrics.” The report covered all higher ed across the nation from
community colleges to state colleges to major public research universities. But the problem is that
when you get to quantifiable “metrics” in higher ed, you tend to look at such things as dollars/student. I
don’t have data for research universities generally but I can tell you that in the case of the University of
California (UC), roughly one dollar in ten in the UC budget comes from the state.
The state’s one tenth contribution to UC basically is designated for what is described as the “core”
educational program, mainly degree production. The one dollar from the state is roughly matched by
another dollar from student tuition. But that leaves another eight dollars for all the other activities that
go on at UC. In other words, much of what a major research university does is research – surprise! -
which pulls in grants from the federal government and other sources. Several UC campuses have
medical centers with considerable patient revenues and much of the medical faculty is paid out of those
funds and out of medical research funds rather than state appropriations. In short, if you apply the
kinds of metrics proposed, the bulk of the activity goes unmeasured or, worse, the tail ends up wagging
the dog.
Indeed, metrics such as graduation rates – particularly if linked to budget formulas – can produce
perverse results (a general problem with all incentive systems). Tell higher ed administrators that they
will be rewarded for high student success (graduation) rates, or penalized for low ones, and they will
tend to “cream,” i.e., set admissions standards or take other steps to exclude risky students. Would you
really want that approach to be taken by community colleges? In California, public policy has always
assumed that community colleges are to be the higher ed institutions of last resort; anyone with a high
school diploma (or even a dropout) could enroll. If the goal is providing a last chance, high risk students
4 The report by the National Association of State Budget Officers can be found at:
http://www.nasbo.org/sites/default/files/pdf/Improving%20Postsecondary%20Education%20Through%20the%20
Budget%20Process-Challenges%20and%20Opportunities.pdf.

5
will inevitably enroll and many will drop out. Changing the metric and reward could inadvertently and
perversely obstruct the goal of providing that last chance.
We already have prominent examples of school administrators and teachers falsifying student test
scores at the K-12 level when the reward and punishment budgetary consequences were large. Do you
think such improper activities couldn’t occur in higher ed? They already do. There have been
prominent cases of data falsification by admissions officers and others at big-name schools to improve
university magazine rankings. I know that True Believers will argue that transparency would foil
cheating but, as Yogi Berra is supposed to have said, “If the world were perfect, it wouldn’t be.”
Many readers will be familiar with George Orwell’s novel, 1984, in which one of the goals of the
totalitarian state he envisioned was the promotion of a new language with constrained and prescribed
words known as “Newspeak.” It turns out that Orwell’s fiction was more real than he knew. I recently
attended a seminar at UCLA given by two historians of the Stalinist period in the Soviet Union. With the
collapse of the Soviet state, various secret files relating to Stalin, including personal papers, have
become available to scholars. One discovery from this material was that Stalin had a great interest in
defining what words and terms should and should not be used in the Soviet version of Newspeak.
Words and phrases, he understood, can control behavior and thinking. The control of words, however,
did not prevent the Soviet system from ultimately collapsing despite the utopian ideological aspirations
of communism. Let that history be a lesson to those who seek perfection through transparency and
performance metrics.
Orwell
6
Mitchell’s Musings 4-22-13: Does the CPI Have an Unchained Malady?
Daniel J.B. Mitchell
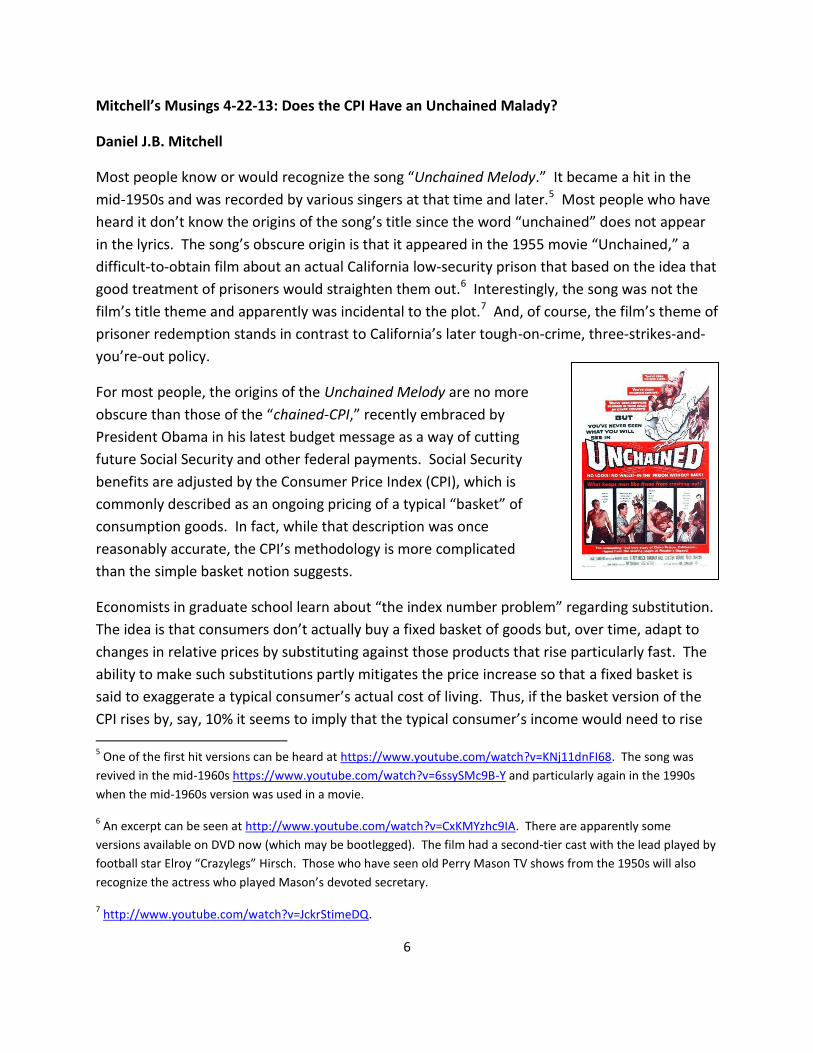
Most people know or would recognize the song “Unchained Melody.” It became a hit in the
mid-1950s and was recorded by various singers at that time and later.5 Most people who have
heard it don’t know the origins of the song’s title since the word “unchained” does not appear
in the lyrics. The song’s obscure origin is that it appeared in the 1955 movie “Unchained,” a
difficult-to-obtain film about an actual California low-security prison that based on the idea that
good treatment of prisoners would straighten them out.6 Interestingly, the song was not the
film’s title theme and apparently was incidental to the plot.7 And, of course, the film’s theme of
prisoner redemption stands in contrast to California’s later tough-on-crime, three-strikes-and-
you’re-out policy.
For most people, the origins of the Unchained Melody are no more
obscure than those of the “chained-CPI,” recently embraced by
President Obama in his latest budget message as a way of cutting
future Social Security and other federal payments. Social Security
benefits are adjusted by the Consumer Price Index (CPI), which is
commonly described as an ongoing pricing of a typical “basket” of
consumption goods. In fact, while that description was once
reasonably accurate, the CPI’s methodology is more complicated
than the simple basket notion suggests.
Economists in graduate school learn about “the index number problem” regarding substitution.
The idea is that consumers don’t actually buy a fixed basket of goods but, over time, adapt to
changes in relative prices by substituting against those products that rise particularly fast. The
ability to make such substitutions partly mitigates the price increase so that a fixed basket is
said to exaggerate a typical consumer’s actual cost of living. Thus, if the basket version of the
CPI rises by, say, 10% it seems to imply that the typical consumer’s income would need to rise
5 One of the first hit versions can be heard at https://www.youtube.com/watch?v=KNj11dnFI68. The song was
revived in the mid-1960s https://www.youtube.com/watch?v=6ssySMc9B-Y and particularly again in the 1990s
when the mid-1960s version was used in a movie.
6 An excerpt can be seen at http://www.youtube.com/watch?v=CxKMYzhc9IA. There are apparently some
versions available on DVD now (which may be bootlegged). The film had a second-tier cast with the lead played by
football star Elroy “Crazylegs” Hirsch. Those who have seen old Perry Mason TV shows from the 1950s will also
recognize the actress who played Mason’s devoted secretary.
7 http://www.youtube.com/watch?v=JckrStimeDQ.
7
by 10% to offset the impact fully. Maybe only an 8% increase in income would be needed to
offset the measured 10% CPI increase.
In fact, the U.S. Bureau of Labor Statistics (BLS) has published a version of the CPI that purports
to account for the substitution effect, C-CPI-U or “chained-CPI.” As an empirical matter, it
seems generally to rise more slowly than “regular” CPI. Thus, over time, adopting the chained-
CPI would reduce the cost of Social Security payments. The President included the chained-CPI
in his budget as an offering to Republicans in Congress as part of ongoing budget negotiations.
The proposal was immediately criticized by Democrats as a de facto Social Security cut.
It is easy to see the political case for making a reduction in Social Security via a technical
adjustment which is based on the economic rationale that the chained-CPI is a more accurate
measure of inflation. Changing the formula changes the dollars without explicitly doing so. In
that sense, if the President ever gets his budgetary “Grand Bargain” with Republicans, the deal
might be more palatable to Democrats than an overt cut in Social Security. On the other hand,
the descriptor “chained” was probably not the best word from a PR perspective – who wants to
be chained? And the concept readily subject to parody:
https://www.facebook.com/photo.php?v=10151641531311522.
We’ll look more closely at the substitution idea in a moment. But note that if you really push
economists, they would have to admit that except in very unusual circumstances, you can’t
really measure the “utility” (happiness) or the change in “utility” of a diverse group. If you are a
teetotaler and the price of beer goes up, it doesn’t matter to you. If you are an alcoholic, it
matters a lot. And most people are somewhere in the middle.
Without weighting each person’s happiness – how do you do that? – you can’t say precisely
what has happened to group welfare when relative prices shift And, of course, all Social
Security recipients – including those who have yet to become recipients – is a very large and
diverse group. So the notion that a refinement in the CPI formula is making the index more
accurate is questionable. At best, you are seeking a refinement of a very fuzzy concept. Critics
of this particular refinement note that doing it right would require a study of consumer habits
of the elderly and the CPI is not based on such age-specific habits. But even if there were an
elderly CPI, refining it to the chained-CPI notion is a quest for a Holy Grail that doesn’t exist.
However, let’s ignore the non-existence problem and play the game. It should be the case that
if all prices rise at exactly the same rate (so no relative price changes), an index that correct for
the substitution effect should move the same as an index without such a correction. In such a
case, the “basket” CPI needs no correction. So if in period A and period C, relative prices are
exactly the same (although all prices have risen from A to C), we need no correction. Now let’s
8
assume there is an interim period B in which there was a relative shift in prices (some prices
rose faster than others from A to B). And let’s assume that from B to C, the relative price shift
was undone so that the goods with rapidly-rising prices in the A to B period were the goods
with slowly-rising prices in the B to C period. If you had an index which supposedly corrected
for inflation from A to B and from B to C, it should come out exactly the same over the entire A-
to-C period as an index that had no such correction.
Let’s take a concrete example. Suppose there are two goods: apples and oranges. Let’s assume
that in period A, both sell for $1 each. And let’s assume that with that array of relative prices, a
“typical” consumer buys 50 apples and 50 oranges at a cost of $100. In period B, the price of an
apple goes to $1.50 and the price of an orange goes to $1.10. With a fixed basket of
consumption, the 50-50 consumption pattern would cost $130 dollars ($75 for apples; $55 for
oranges). So we would have to raise the consumer’s income by 30% to allow the basket to be
purchased unchanged.
But at this point, the economist says “ahah!”; you have neglected the substitution effect
between A and B. The consumer could buy more oranges and few apples and offset some of
the price effect. For example, if the consumer changed the basket to, say, 40 apples and 60
oranges (which would cost $128), we could compensate for inflation by raising income by only
28%.
Suppose now in period C, the apple price and the orange price have both risen to $1.80.
Relative prices are again 1-to-1 (one apple exchanges for one orange) as they were in period A.
So compared to period A, there should be no substitution effect and if fully compensated, the
consumer would buy 50 apples and 50 oranges at a cost of $180. Put another way, the typical
consumer would need an 80% increase in income relative to period A to be equally well off in
period C as in A.
It may well be that, as an empirical matter, BLS’ chained-CPI has risen more slowly than regular
CPI over the period in which the agency began to compute its chained-CPI. But to say that
chained-CPI will always rise more slowly over very long periods is immediately suspect. More
than the substitution effect must be involved if that projection is definitely true or there must
be an over-correction; you cannot say with certainty that over decades and decades, relative
prices in some sense won’t realign compared to some base period. If chained-CPI rose more
slowly than regular CPI from A to B and again from B to C, something is wrong since regular CPI
is correct from A to C.
Of course, over very long periods, tastes could change, new products could be invented, and
folks might become happier or sadder for reasons unrelated to prices. But all of that is simply
9
the reason why we can’t really go on a quest to measure changes in happiness precisely. Are
people today happier or unhappier than they were, say, 30 years ago?
Note that there are folks on Social Security today who were alive and who were on Social
Security 30 years ago. It’s probably the case that a 95 year old Social Security recipient might
well be less happy for health reasons than she (it is very likely to be a she) was at age 65. Do we
really want to have a Social Security reduction, therefore, that chips away year-by-year on her
income? If we were going to cut Social Security benefits, couldn’t a case be made for taking
more away from younger recipients than older ones? Absent some complicated correction,
chained-CPI works in the opposite direction.
There are many other considerations in a switch to chained-CPI for Social Security indexing. BLS
makes corrections in the CPI’s various components (whether those components go into
chained-CPI or regular CPI) for product “quality.” Consumer products such as computers, cell
phones, etc., improve over time but valuing that improvement and factoring it into the CPI is a
complicated matter; reasonable alternative methodologies could produce alternative results.
To be clear, there is no implication here that BLS is somehow cheating. It is just that there is a
range of options. It’s likely that the range of reasonable quality-adjustment options could
produce alternative price measures that in either direction (more or less measured inflation)
would be larger than the projected gap between regular CPI and chained-CPI.
In the end, what we have in a switch to chained-CPI for Social Security is a political decision, not
a scientific one. Once we make the change, it will be in effect for decades and touch the
welfare of many people. As the lyrics to Unchained Melody suggest, “time goes by so slowly,
and time can do so much...”
10
Mitchell’s Musings 4-29-13: The Appealing Macro-Masochism of Austerity
Daniel J.B. Mitchell
No, this musing is not about the now famous (infamous?) Excel sheet error in the article by Kenneth
Rogoff and Carmen Reinhart, the article that supported the kind of austerity policy favored in the euro-
zone and elsewhere. If you don’t know about that tale of error, check out the many web references.8
Or watch the Colbert send ups.9 Instead, this musing is about the interesting question of why austerity
has political appeal. Many economics papers are written by academics which have policy implications
that do not catch on, even if no errors are involved. Moreover, in the case of the austerity policies that
followed the financial crisis of 2008, it is clear that those policies were independently developed; their
advocates subsequently referenced whatever academic support they could find.
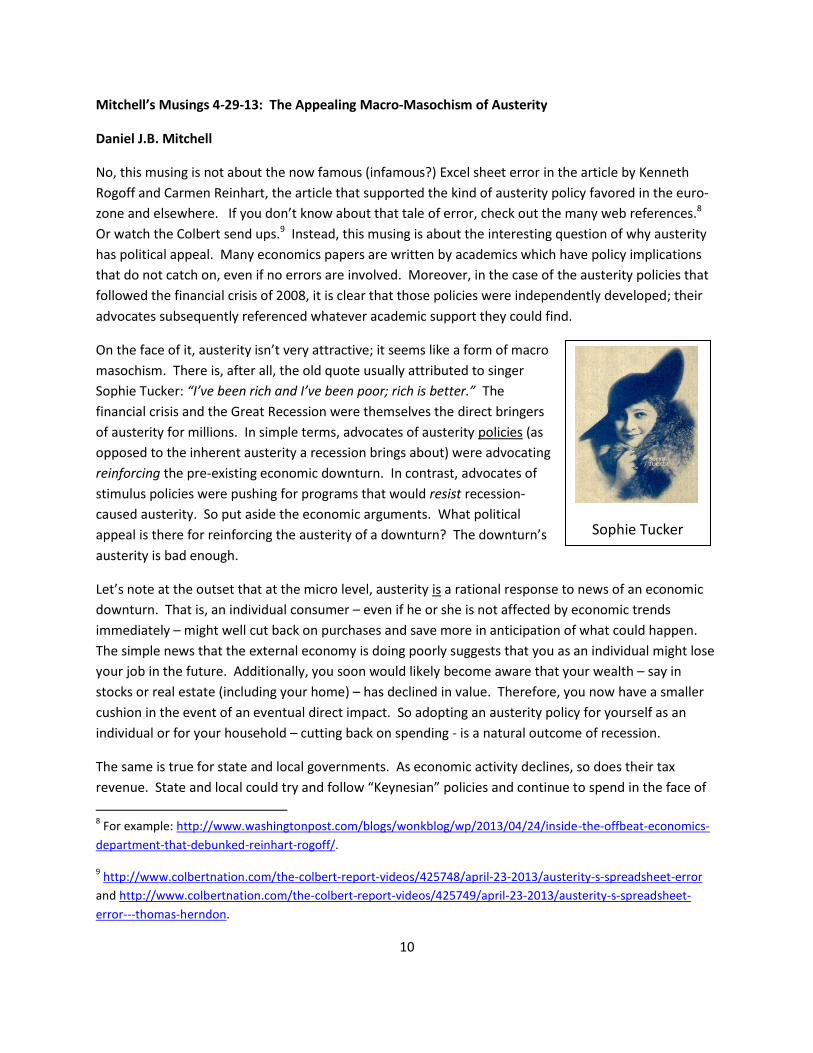
On the face of it, austerity isn’t very attractive; it seems like a form of macro
masochism. There is, after all, the old quote usually attributed to singer
Sophie Tucker: “I’ve been rich and I’ve been poor; rich is better.” The
financial crisis and the Great Recession were themselves the direct bringers
of austerity for millions. In simple terms, advocates of austerity policies (as
opposed to the inherent austerity a recession brings about) were advocating
reinforcing the pre-existing economic downturn. In contrast, advocates of
stimulus policies were pushing for programs that would resist recession-
caused austerity. So put aside the economic arguments. What political
appeal is there for reinforcing the austerity of a downturn? The downturn’s
austerity is bad enough.
Let’s note at the outset that at the micro level, austerity is a rational response to news of an economic
downturn. That is, an individual consumer – even if he or she is not affected by economic trends
immediately – might well cut back on purchases and save more in anticipation of what could happen.
The simple news that the external economy is doing poorly suggests that you as an individual might lose
your job in the future. Additionally, you soon would likely become aware that your wealth – say in
stocks or real estate (including your home) – has declined in value. Therefore, you now have a smaller
cushion in the event of an eventual direct impact. So adopting an austerity policy for yourself as an
individual or for your household – cutting back on spending - is a natural outcome of recession.
The same is true for state and local governments. As economic activity declines, so does their tax
revenue. State and local could try and follow “Keynesian” policies and continue to spend in the face of
8 For example: http://www.washingtonpost.com/blogs/wonkblog/wp/2013/04/24/inside-the-offbeat-economics-
department-that-debunked-reinhart-rogoff/.
9 http://www.colbertnation.com/the-colbert-report-videos/425748/april-23-2013/austerity-s-spreadsheet-error
and http://www.colbertnation.com/the-colbert-report-videos/425749/april-23-2013/austerity-s-spreadsheet-
error---thomas-herndon.
Sophie Tucker
11
recession, or even ramp up spending, through deficit fiscal policy. But the smaller the jurisdiction, the
less would be the stimulatory effect within its borders. Much of the stimulus would spill over into other
jurisdictions. And continued deficits, not to mention deliberately enhanced deficits, would raise the
issue of credit risk. Credit ratings would decline. The cost of borrowing would rise. Eventually
borrowing would become difficult, even at high interest rates.
At the national level, the calculus is – or should be – different, especially for large countries such as the
U.S. which borrow in currencies that they themselves issue. Large countries inherently have fewer
spillover issues; the stimulus tends to stay within their borders. And countries that borrow in their own
currencies can always pay off their debts, unless they make a political decision not to do so.
Note, however, that within the euro-zone, member nations have made a decision not to have their own
currencies and thus not to have independent monetary policies. They made that decision within an
economic union – the EU - that really has no central government that is analogous to the U.S. federal
government. Individual nations that joined the euro-zone have maintained their military and social
insurance programs and obligations. But they have turned monetary policy over to a semi-autonomous
European Central Bank. Absent guarantees for their borrowing from that central bank, austerity policies
were rational for individual euro countries, just as they were for state and local governments within the
U.S. (which also have no independent currencies or monetary policies).
In theory, the various nations within the euro-zone could have negotiated an arrangement whereby
they all followed coordinated stimulatory policies which the European Central Bank would undertake to
support. But such negotiations are easier to postulate in the abstract than to effect in reality. There are
complicated distributional and re-distributional conflicts to work out that are difficult to resolve in
practice. Even in the U.S., there were no coordinated compacts among state and local governments in
the aftermath of the Great Recession. Essentially, to the extent there was coordination, it consisted of
handouts to state and local governments from the federal government. And the stimulus from
Washington was not fine tuned to favor the state and local jurisdictions that were most adversely
affected by the downturn. Any such fine tuning would have entailed the kind of deal making in Congress
that was so difficult for the euro-zone countries.
In the end, there was enough in the way of stimulus and bailouts from Washington to keep the
economic ship afloat, but that left it still listing badly. The Federal Reserve, which is somewhat
politically insulated, might have gone the way of the European Central Bank and favored austerity. But
it didn’t, largely because of leadership of Fed Chair Ben Bernanke who had studied the sorry impact of
Fed austerity in the 1930s. Even with such leadership, however, there are legal constraints on what the
Fed can do. The one advantage the Fed has is that it doesn’t have to cope with regional distributional
negotiations. If the Fed cuts short-term interest rates to near-zero, the rates are near-zero everywhere.
12
Nonetheless, there is more to the appeal of austerity policies than just negotiating difficulties. The fact
that austerity is rational at the micro level creates a potential fallacy of composition.10 What may be
rational for you as an individual or for your household – or even for your city or state – is not rational for
the collectivity. Yet if someone wants to argue for austerity, it is easy to argue by analogy. If you as an
individual have tightened your belt, why shouldn’t your city be doing the same? (And, as noted, your
city acting rationally probably should.) Why shouldn’t your state? (And, as noted, your state probably
should.) Why shouldn’t the federal government? There, however, the economic argument breaks down
– but not the appeal of the argument. Human beings reason by analogy so the appeal of the austerity
argument is evident; you shouldn’t run a deficit during Hard Times so why should the federal
government? You cut back on spending and saved more; let the federal government do the same.
Note, however, that the idea of belt tightening in the face of falling tax revenue has a political appeal in
some quarters that goes beyond the simple analogy. If you think your city engages in wasteful spending
and social programs, recession is a good time to argue that such spending should be curtailed. If you
think your state engages in wasteful spending and social programs, again, recession is an opportune
time to make the case for cuts. And the same is true at the federal level. If you think the federal
government is too big, recession is a golden opportunity for reducing its size – even if the macro
arguments run in the reverse at that level. If you can find an academic paper that seems to support your
call for austerity – even at the federal level – so much the better.
It is important to emphasize that there was no grand conspiracy entailed in the politics of austerity
policy advocacy. That is, no cabal decided to have a financial crisis and Great Recession just in order to
promote government downsizing. But the financial crisis and Great Recession created the opportunity
to make the austerity argument and the crisis was an opportunity too good to miss. To the extent there
was a cabal, it was in the setting up of such artifacts as debt ceilings and fiscal cliffs. The crisis helped
make the argument against welfare-state programs.
The result in the U.S. has been a sluggish recovery that might have been more robust had alternative
policies been seen as politically possible. The result in the euro-zone has been a kind of stalemated non-
recovery. If some negative economic shock were to occur in the near future – some kind of double dip
recession – it is not clear that the kind of temporary unity that enabled the limited U.S. stimulus of 2008-
2009 to be developed could again be replicated. And that fact means that from the viewpoint of
individuals, households, localities, and states, austerity still has a rational appeal, even in the fourth year
of recovery. In a rudderless boat, everyone needs a life preserver.
10
“The fallacy of composition is the fallacy of inferring from the fact that every part of a whole has a given
property that the whole also has that property... A clear case of the fallacy of composition is this: (1) Every song on
the album lasts less than an hour. Therefore, (2) the album lasts less than an hour...” Source:
http://www.logicalfallacies.info/relevance/composition/.
13
Mitchell’s Musings 5-6-13: Should You Join the So’ing Circle?
Daniel J.B. Mitchell
If you are a diligent reader of these musings – and who wouldn’t be? – you will recall that back
last June 25th, we dealt with problems of undergraduate writing. For that small minority of
readers who can’t recall the piece, the link is:
http://www.employmentpolicy.org/sites/www.employmentpolicy.org/files/field-content-
file/pdf/Daniel%20J.B.%20Mitchell/MitchellMusings%206-25-12.pdf
At the tail end of that musing, we got into the issue of oral presentation as opposed to writing:
...(W)e find that some students are afflicted with “uptalk,” a malady not well
suited to job interviews or the workplace that seemed to arise in the 1980s. It is
more unkindly is known as the moronic interrogative:
Moronic interrogative: Raising your voice at the end of a statement to turn it into
a question as typified by valley girls but has spread far beyond to both sexes and
even beyond the U.S.11
That definition is reasonably accurate but true practitioners of uptalk actually
insert the questioning tone in the middle of their statements as well as the end.
A good start in alerting students to avoid uptalk is to play the YouTube video I
have embedded on the subject on the EPRN website. Click on
http://www.employmentpolicy.org/topic/403/blog/avoiding-uptalk.12 None of
the remedial efforts described [in the musing] are cure-alls. But they help and
may be of use to other college and university instructors. They might even help,
like, your students? find, you know, a job? in today’s difficult labor market?
The implication of the earlier musing was that poor writing and odd speech patterns could be a
hindrance in the job market. It’s hard to imagine that poor writing could ever be a help in job
search. But what about speech patterns that may seem odd but in fact are carefully tailored for
specific audiences?
11
http://www.urbandictionary.com/define.php?term=moronic%20interrogative.
12 If it loads slowly, go directly to http://www.youtube.com/watch?v=SCNIBV87wV4. And if you enjoyed that
video, you might also enjoy http://www.youtube.com/watch?v=if5XbL2I1Ic.

14
When I was growing up in New York City in the 1950s, you could hear Dr. Carlton Fredericks on
the radio giving seemingly erudite advice about nutrition. He sounded very authoritative but
his name wasn’t actually Carlton Fredericks and his doctoral degree wasn’t in medicine or really
directly in nutrition.13 Nonetheless, Dr. Fredericks spoke on the radio with an educated accent
that he definitely did not pick up in his native Brooklyn: [Click below for a sampling.]
http://www.youtube.com/watch?v=6xG2c3sEjCg
So... that observation suggests that speaking in patterns that differentiate you from the hoi
poloi could be an advantage in certain segments of the labor market. Indeed, it might even
become a quasi-necessity. I have noticed in seminars at UCLA, starting maybe a couple of years
ago, that when asked questions, the presenters started their answers with “So...” And since we
were referring to radio above, as it turned out, radio commentator Harry Shearer recently
noted the same thing. Experts now begin their answers to questions with what is called by
linguistic specialists the “initial so.” So Shearer has started a segment of his “Le Show” program
on the “So’s of the Week”: [Click below so you can practice and polish your so’s.]
https://www.facebook.com/photo.php?v=10151664032996522
According to the Chronicle of Higher Education (which noticed the phenomenon about when I
did), the “initial so” – while now so prominent in academia – may have begun with nerd-talk at
Microsoft.14 So, whatever the origins, budding academics should seriously consider joining the
so’ing circle, if they already haven’t do so. Otherwise, their responses to questions will likely be
viewed as just so-so.
13
Some details are in his obituary: http://www.nytimes.com/1987/07/31/obituaries/carlton-fredericks-76-host-of-
radio-program-on-health.html
14 http://chronicle.com/blogs/linguafranca/2011/12/02/so-it-turns-out-that-everyones-starting-sentences-with-
so/
15
Mitchell’s Musings 5-13-13: The Soft Takeoff
Daniel J.B. Mitchell
Back in 1969, when the Nixon administration first took office, there was concern among the incoming
policy makers about accelerating inflation. It was hoped that a slight touch on the macroeconomic
brakes would slow the economy sufficiently to deal with the inflation problem without tipping it into a
full blown recession. The phrase “soft landing” came into widespread use to describe such a carefully
crafted outcome. In fact, the application of the brakes produced a recession – a hard landing. Soft
landings have generally proved to be elusive.
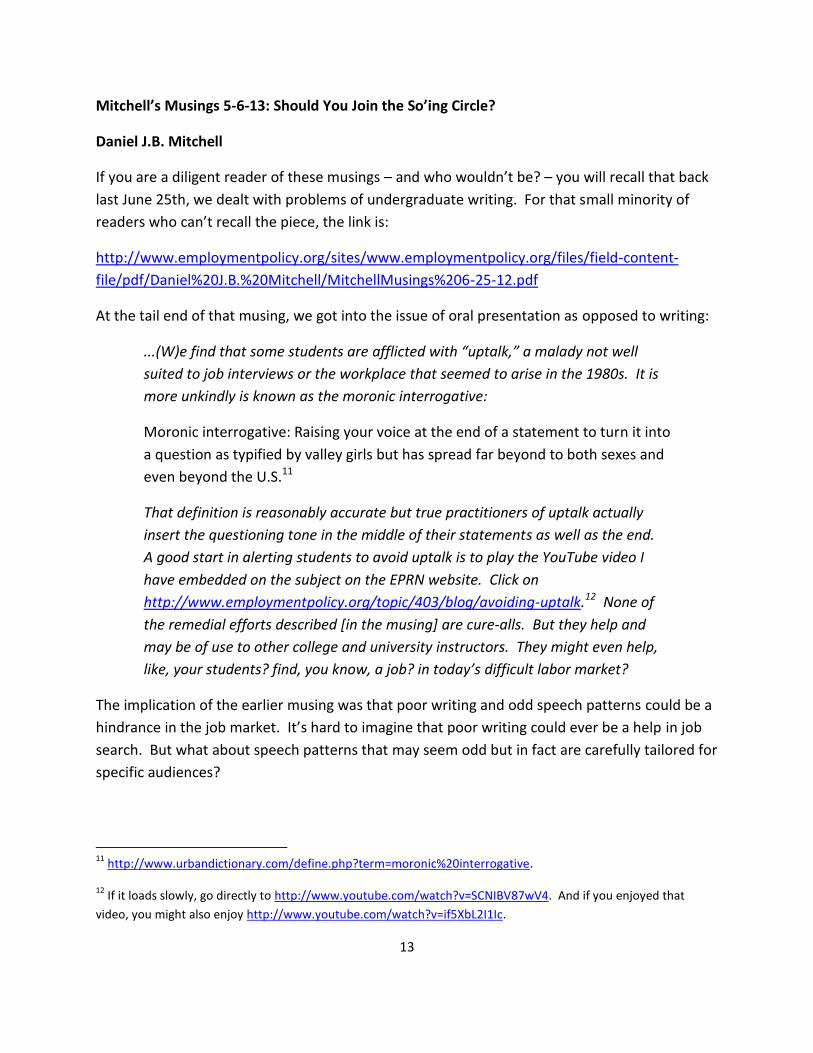
A soft takeoff after a recession seems to be easier to achieve. In fact, since 2009, we have been
expanding at a lazy pace. As the chart below shows, we have yet even to bring employment back to its
previous peak. And as the headline below from the LA Daily News of May 10th shows, the job market –
as a consequence - remains soft.
Nonfarm Payroll Employment, Seasonally Adjusted
16
The article under the headline notes that when there are many applicants for available positions, the
natural result is some form of job rationing by employers. Such rationing shows up in elaborate hiring
processes:
..."It's really frustrating for people," said Cynthia Shapiro, a Woodland Hills-based career
strategist and author of the book, 'What Does Somebody Have to Do to Get a Job Around
Here?'... Candidates are often forced to endure multiple interviews - sometimes as many as
eight - in their quest to land a job, according to Shapiro. "They'll go through a real stringent HR
screening, a technical screening, aptitude testing, and then they'll be interviewed by a variety of
employees and executives," she said. "They may be asked to do business presentations and even
solve problems that can sometimes take weeks to put together."... [http://business-
news.thestreet.com/daily-news/story/job-seekers-face-tough-hiring-process-picky-market/1]
It might be noted that while all of this sifting of applicants does succeed in rationing the jobs, it is less clear that all of the hoops that job seekers are put through really accomplish much more than simple rationing. Who knows if the “right” person is ultimately chosen? And maybe the main result of the elaborate process is to create jobs – albeit for those personnel managers in charge of hiring.
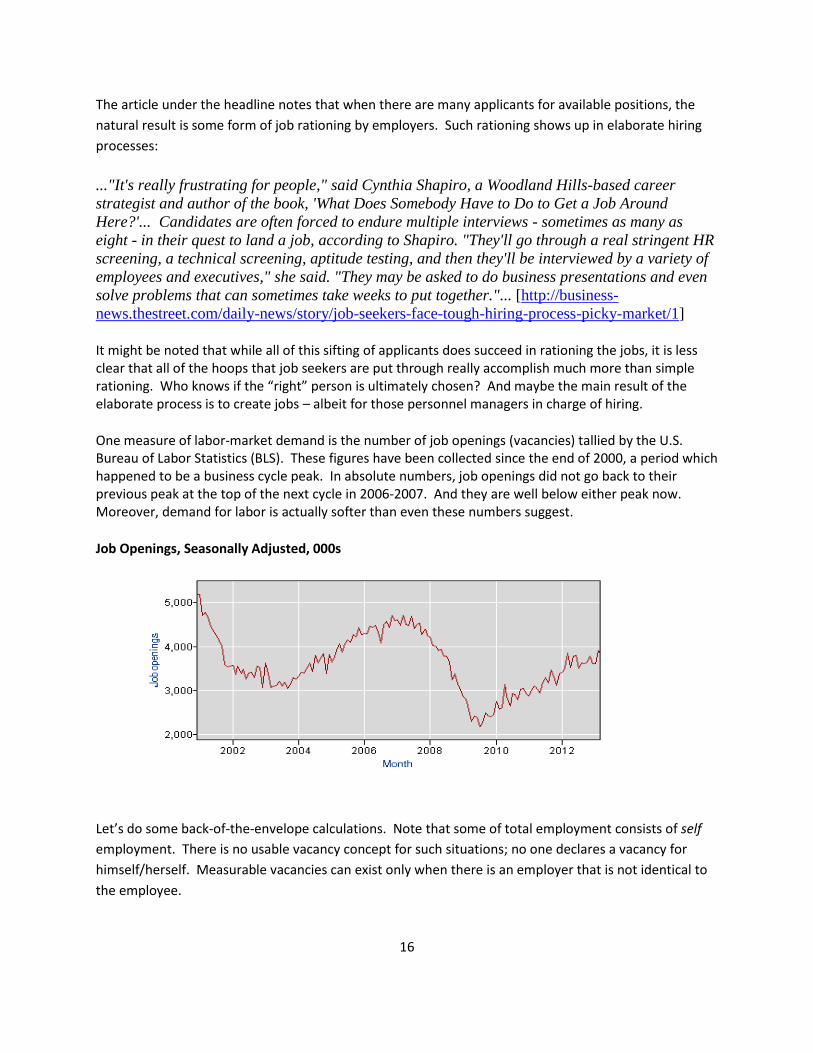
One measure of labor-market demand is the number of job openings (vacancies) tallied by the U.S. Bureau of Labor Statistics (BLS). These figures have been collected since the end of 2000, a period which happened to be a business cycle peak. In absolute numbers, job openings did not go back to their previous peak at the top of the next cycle in 2006-2007. And they are well below either peak now. Moreover, demand for labor is actually softer than even these numbers suggest.
Job Openings, Seasonally Adjusted, 000s
Let’s do some back-of-the-envelope calculations. Note that some of total employment consists of self
employment. There is no usable vacancy concept for such situations; no one declares a vacancy for
himself/herself. Measurable vacancies can exist only when there is an employer that is not identical to
the employee.
17
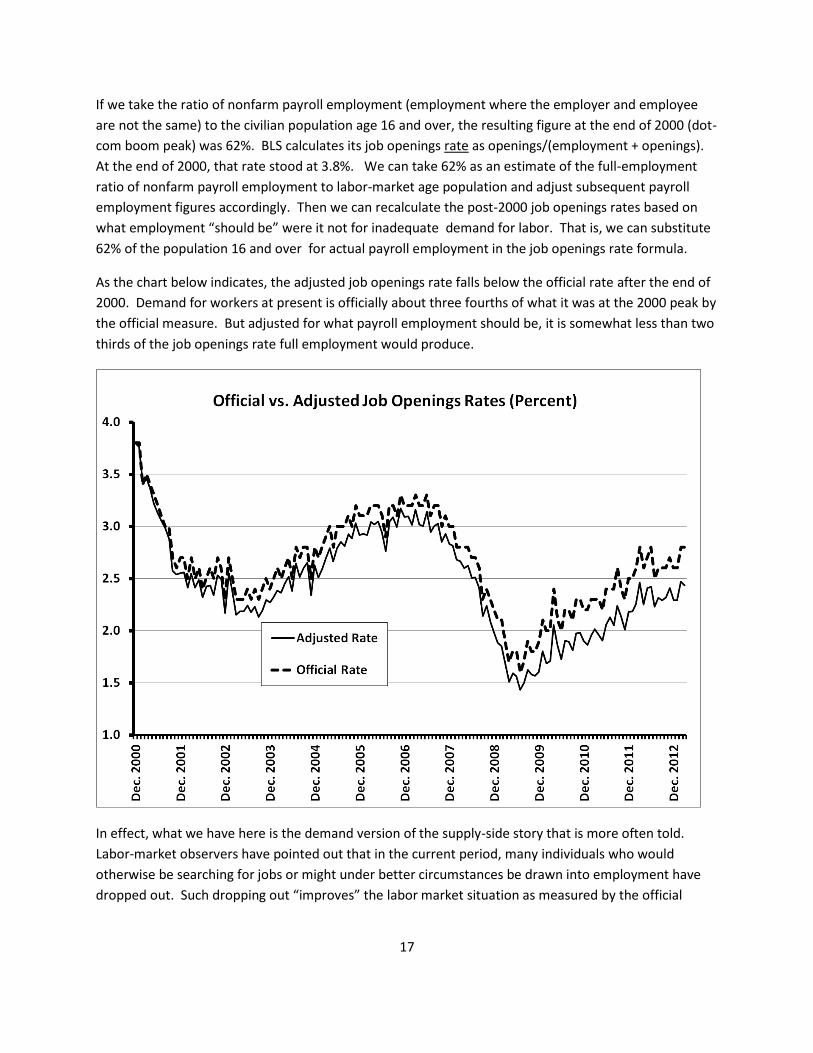
If we take the ratio of nonfarm payroll employment (employment where the employer and employee
are not the same) to the civilian population age 16 and over, the resulting figure at the end of 2000 (dot-
com boom peak) was 62%. BLS calculates its job openings rate as openings/(employment + openings).
At the end of 2000, that rate stood at 3.8%. We can take 62% as an estimate of the full-employment
ratio of nonfarm payroll employment to labor-market age population and adjust subsequent payroll
employment figures accordingly. Then we can recalculate the post-2000 job openings rates based on
what employment “should be” were it not for inadequate demand for labor. That is, we can substitute
62% of the population 16 and over for actual payroll employment in the job openings rate formula.
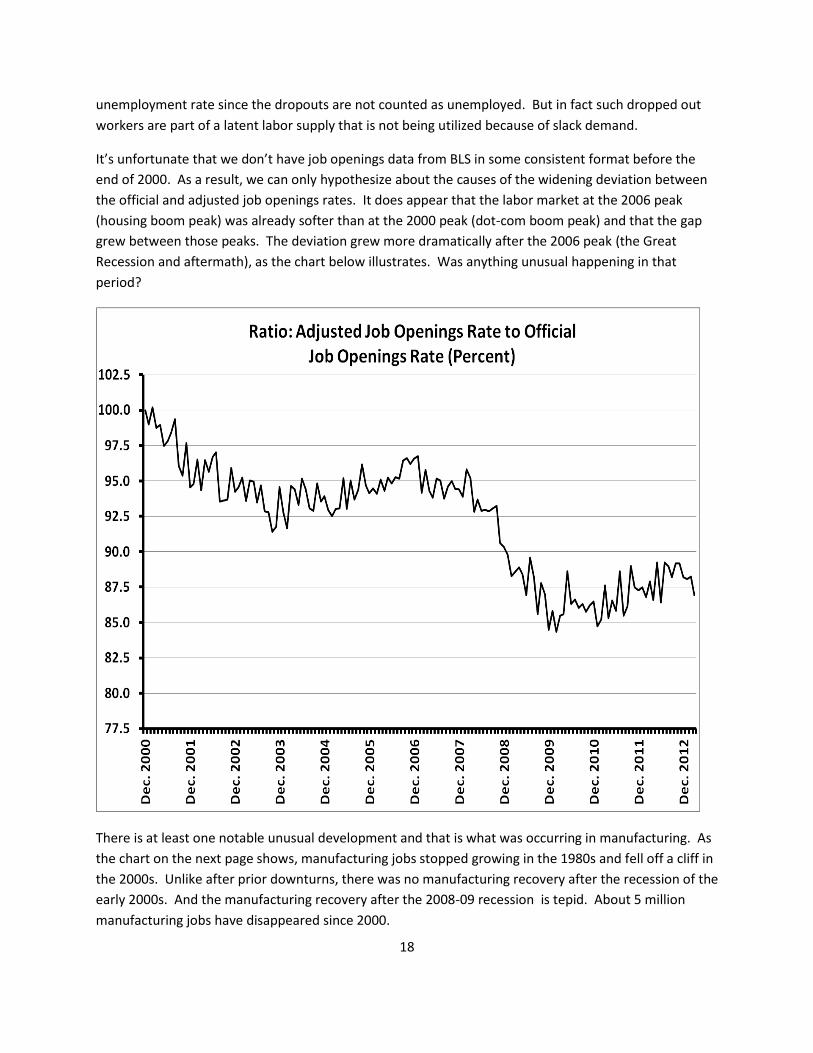
As the chart below indicates, the adjusted job openings rate falls below the official rate after the end of
2000. Demand for workers at present is officially about three fourths of what it was at the 2000 peak by
the official measure. But adjusted for what payroll employment should be, it is somewhat less than two
thirds of the job openings rate full employment would produce.
In effect, what we have here is the demand version of the supply-side story that is more often told.
Labor-market observers have pointed out that in the current period, many individuals who would
otherwise be searching for jobs or might under better circumstances be drawn into employment have
dropped out. Such dropping out “improves” the labor market situation as measured by the official
18
unemployment rate since the dropouts are not counted as unemployed. But in fact such dropped out
workers are part of a latent labor supply that is not being utilized because of slack demand.
It’s unfortunate that we don’t have job openings data from BLS in some consistent format before the
end of 2000. As a result, we can only hypothesize about the causes of the widening deviation between
the official and adjusted job openings rates. It does appear that the labor market at the 2006 peak
(housing boom peak) was already softer than at the 2000 peak (dot-com boom peak) and that the gap
grew between those peaks. The deviation grew more dramatically after the 2006 peak (the Great
Recession and aftermath), as the chart below illustrates. Was anything unusual happening in that
period?
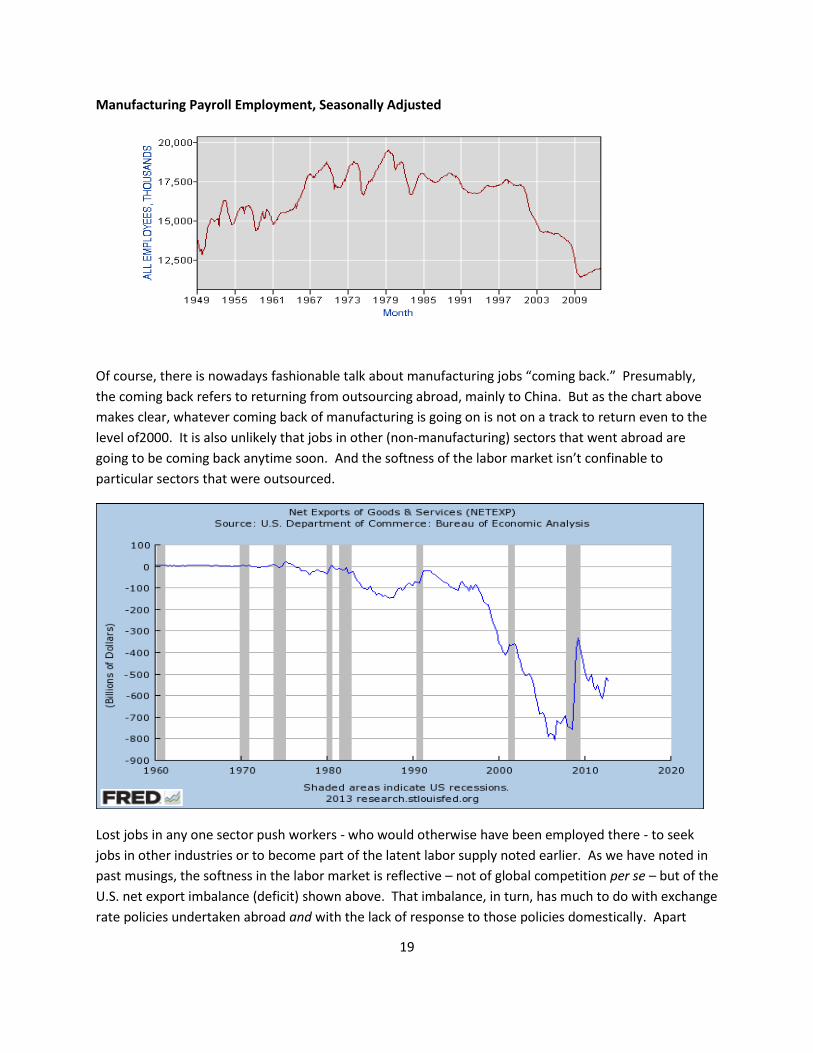
There is at least one notable unusual development and that is what was occurring in manufacturing. As
the chart on the next page shows, manufacturing jobs stopped growing in the 1980s and fell off a cliff in
the 2000s. Unlike after prior downturns, there was no manufacturing recovery after the recession of the
early 2000s. And the manufacturing recovery after the 2008-09 recession is tepid. About 5 million
manufacturing jobs have disappeared since 2000.
19
Manufacturing Payroll Employment, Seasonally Adjusted
Of course, there is nowadays fashionable talk about manufacturing jobs “coming back.” Presumably,
the coming back refers to returning from outsourcing abroad, mainly to China. But as the chart above
makes clear, whatever coming back of manufacturing is going on is not on a track to return even to the
level of2000. It is also unlikely that jobs in other (non-manufacturing) sectors that went abroad are
going to be coming back anytime soon. And the softness of the labor market isn’t confinable to
particular sectors that were outsourced.
Lost jobs in any one sector push workers - who would otherwise have been employed there - to seek
jobs in other industries or to become part of the latent labor supply noted earlier. As we have noted in
past musings, the softness in the labor market is reflective – not of global competition per se – but of the
U.S. net export imbalance (deficit) shown above. That imbalance, in turn, has much to do with exchange
rate policies undertaken abroad and with the lack of response to those policies domestically. Apart

20
from some Congressional grumbling, no real steps have been taken to address what is ultimately a drag
on the labor market and on the recovery of the labor market. The numbers are there; the political will
to respond to those numbers isn’t there.
The flip side of the net export imbalance is a rising national net debt to foreigners
which ultimately is unsustainable. If you keep spending more abroad on imports
than you earn in exports, net debt piles up. It seems evident that eventually, there
will be some “correction.” Until then, we may be condemned to soft takeoffs.
However, when the correction occurs, the landing may well be hard. You didn’t
read it here first; many others have said the same. But nonetheless, you did read
it here.
21
Mitchell’s Musings 5-20-2013: Consistency May Be a Hobgoblin We Need to Mind
Daniel J.B. Mitchell
The usual quote from Ralph Waldo Emerson is, “A foolish consistency is the hobgoblin of little minds,
adored by little statesmen and philosophers and divines.”15 But consistency has its virtues, especially in
presenting economic statistics that are commonly used for time-series analysis. In past musings, I have
noted the change in behavior of employment after the dot-com bust of the early 2000s. The ratio of
employment to labor-force- age population began to slip. After the Great Recession, employment fell
dramatically and has yet to return to its prior peak, let alone catch up with the underlying population
growth.
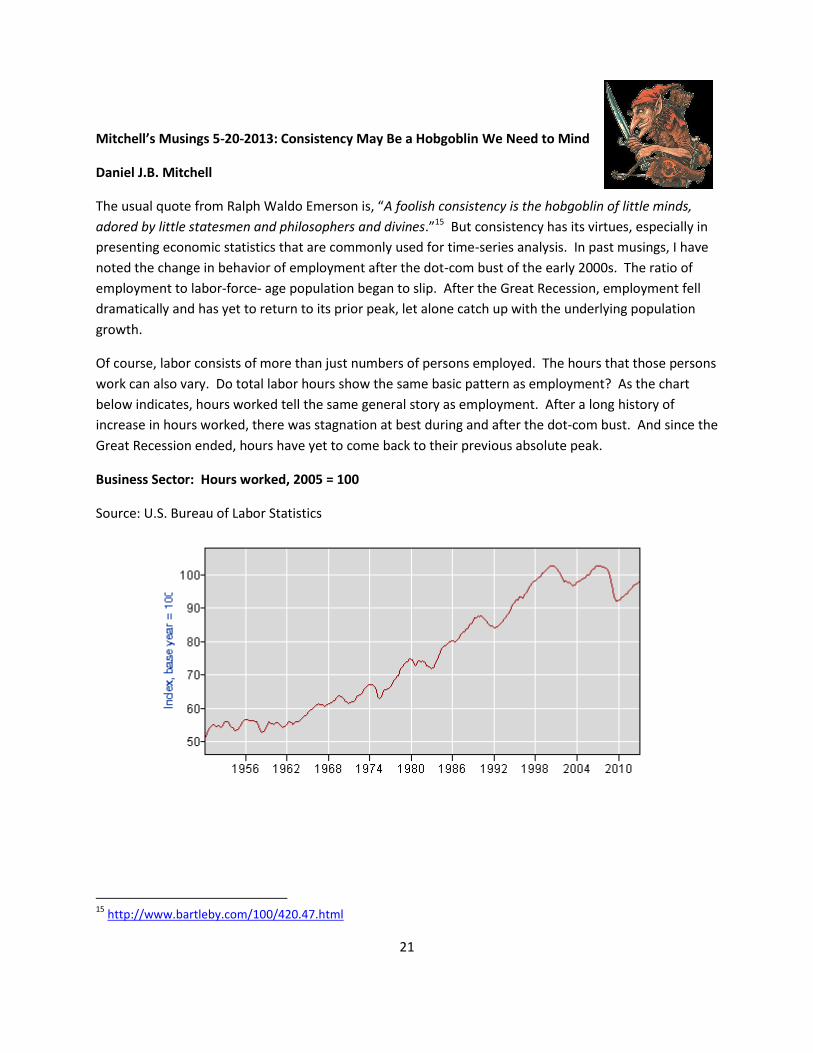
Of course, labor consists of more than just numbers of persons employed. The hours that those persons
work can also vary. Do total labor hours show the same basic pattern as employment? As the chart
below indicates, hours worked tell the same general story as employment. After a long history of
increase in hours worked, there was stagnation at best during and after the dot-com bust. And since the
Great Recession ended, hours have yet to come back to their previous absolute peak.
Business Sector: Hours worked, 2005 = 100
Source: U.S. Bureau of Labor Statistics
15
http://www.bartleby.com/100/420.47.html

22
We have also previously noted the development of an even weaker picture for manufacturing-based
employment. In that sector, the stagnation began in the 1990s. After the dot-com bust, employment in
manufacturing fell off a cliff and showed no recovery. The Great Recession caused a further drop in
manufacturing jobs with only a mild recovery thereafter. Looked at from the perspective of worker
hours, the same pattern is found, as shown on the chart below. Sadly, we don’t have a continuous
series before 1987, unlike the data we have for the total business sector, because of a shift from SIC to
NAICS industrial coding . That is one of those nasty inconsistencies noted at the outset.
Manufacturing: Hours Worked, 2005 = 100
Source: U.S. Bureau of Labor Statistics
Let’s just focus on the period since the peak of the dot-com boom/bust episode, 2000-2012. According
to the official measures, over that period, real output in the business sector rose at an annual rate of
1.7%. (That figure is an average over the booms and busts). But productivity (output per hour) rose at
2.2% per annum. So hours worked dropped at a rate of 0.4%. (These numbers are rounded.) The
official story is thus that the rapid pace of productivity outweighed the growth in real output, thus
dropping the demand for labor hours. The popular version of the story is that “technology” displaced
workers who might otherwise have been employed.
What about in manufacturing? There the story is that real output was essentially flat from 2000 to 2012
(with bumps in the middle). But productivity (output per hour) grew 3.0% per annum so that hours
worked fell at a rate of 2.9% per annum. It’s the same story as for the business sector but with more
“technology” plus outsourcing abroad holding back real output domestically. In both cases, there is a
puzzle of weak labor demand which is “resolved” by a tale of a technology boom.
23
Is there any problem with this story? There is at least a question. In the abstract, real output is an easy
concept to understand. But in terms of measurement there are complex issues. Basically, nominal
dollar values must be deflated by price indexes - which can be composed in various ways – and then the
results must be aggregated using a weighted formula. The real output numbers used for productivity
calculations essentially come from the national income (GDP) accounts so let’s start there.
Many changes have been made over the last couple of decades in how price indexes are formulated,
how they are adjusted for quality, etc. So let’s go back to the 1980s and look at how growth in real GNP
(the standard used at the time was Gross National Product rather than Gross Domestic Product) was
depicted.16 We can then compare that earlier view to what we now say happened.
For the earlier view, I went back to the Economic Report of the President for 1983. According to the data
in the statistical appendix to that Report, real GNP rose at the following rates over the decades shown
below:
1940s: 4.5%/annum
1950s: 3.3%/annum
1960s: 3.9%/annum
1970s: 3.1%/annum
But if we look at that same history as measured under current methodology (data obtained from the
U.S. Bureau of Economic Analysis website, 5-16-2013), we find that the history has been somewhat
altered:
1940s: 5.6%/annum
1950s: 3.5%/annum
1960s: 4.2%/annum
1970s: 3.2%/annum
Note that for each period, the pace of real output is higher as it is measured now than it was in the early
1983. The differences on a per annum basis are not huge. But over a four decade period, they
cumulate. Statisticians in the early 1980s would have said that real output in 1980 was 4.3 times what it
was in 1940. Now we would say it was 5.0 times higher. Folks in 1980, of course, didn’t know about this
retroactive jump in their prosperity!
When you look at the history of statistical measurement since the early 1980s, you will find that there
was increasing concern about the official figures missing the “quality” improvements in computer-
16
GNP = GDP + net receipts of income from abroad.
24
related products. The idea is that if a computer over time gets better, the effective price of a computing
unit is becoming lower. It is safe to say, however, that some of the concern was not simply focused
narrowly on the quality issue. There was a wider issue related to the measurement of inflation and its
impact on such programs as Social Security which are indexed to the trend in (officially-measured)
prices. The more that adjustments for improvements in quality were made in the official indexes of
prices, the slower those price indexes would rise. As a result, the less expensive, other things equal,
Social Security would be going forward.
One byproduct of a more slowly-measured rate of inflation was that since the price deflators used to
adjust nominal values to real values would rise more slowly, the real measures would rise faster. It is
likely that the impact of the various changes in methodology that occurred would have a more dramatic
effect – again, other things equal –as computers became more important in businesses and households.
Computers barely existed in the 1940s but by the 1970s their use was becoming more common. It was
really in the 1980s and thereafter when computers, computer-related items, and other high-tech
products, e.g., cell phones, took off.
Sadly, we cannot know what the indexes of real output for the 1980s and beyond would have looked
like had output been measured using the methodology of the early 1980s. The keepers of the
measurement grail could in principle produce such indexes – that is one of the benefits of the vaunted
advance in computer technology – but they don’t do so. Suppose, however, we look at the
measurement of productivity for the business sector in the 1980s as it was seen in the early 1990s (using
the Economic Report of the President of 1993) versus current figures for that period. In the early 1990s,
productivity was said to have risen in the 1980s by 0.9% per annum. But as seen in the latest figures,
the rise in the 1980s was actually 1.6%. Note that the difference over a ten-year period is roughly 7%.
Constant fiddling with key measurements – whatever the motivation – makes it hard to interpret events
that take place over time. Let’s take a simple example. Suppose a widget costs $1 and a factory makes
100 widgets in a given time period – period 1 - using 100 worker hours. The gross value produced is
thus $100. In a later period 2, we observe the factory producing 75 widgets at $1 per widget using 75
worker hours. The gross nominal value of the output is now $75. We would seem to have a simple
story. Demand for widgets fell for some reason and so the demand for worker hours fell in step.
Now suppose someone decides that widgets produced in period 2 were in fact better in quality than
those produced in period 1. Suppose the effective price – adjusted for quality – is said to be only 75
cents per widget. When we divide the nominal value of output in period 2 by .75 we get a real value
estimate of $100. [$75/.75 = $100.] Another way of putting it is that each widget in period 2 is one third
“better” than a period-1 widget. In any event, it now appears that the same real value of output that we
had in period 1 is being produced in period 2 but using 25% fewer worker hours. Our story has changed;
it appears that the demand for (effective) widgets was unchanged between period 1 and period 2 but
that “technology” has displace one quarter of the worker hours.
25
Economic policy will be different depending on which story is told. The deficient demand tale suggests
that boosts in demand would be the remedy. The technology story suggests we need to have worker
retraining programs to deal with structural displacement. We can’t make a judgment as to which story
might be correct unless we have details about how and why the quality adjustments to widget price
measures were made.
Of course, back in the early 1980s or early 1990s, some adjustments were being made for quality to
price indexes and to indexes of real value. But now we are apparently using more aggressive methods
to seek out quality improvements. And the methodology in use regularly changes. It would be helpful
to keep producing figures using the old and new approaches for those who want to understand changes
in labor market demand for workers. The comparison would help users make their own interpretations
of what is occurring and what policies are appropriate. The policy decision should not be made for
them indirectly by changes in statistical methodology.
Consistency may be the hobgoblin of little minds in the opinion of some people. But when it comes to
economic statistics, that view doesn’t mean we should pay consistency no mind at all.

26
Mitchell’s Musings 5-27-13: Change is Hard or False Positives from a Negative
Daniel J.B. Mitchell
About a month ago, I mused about the appeal of austerity at the macro level. Macroeconomic
policy in parts of the world – particularly in the euro-zone – has tilted toward belt-tightening
austerity which makes an already soggy economic condition worse.17 Why are such painful
policies being followed? One answer, I suggested, was a fallacy of composition coming up from
the micro level.18 It is rational for individuals and households to cut back expenditures during
recessions since they are threatened with unemployment and lost income. But collectively,
such cutbacks exacerbate the situation. The same is true for local jurisdictions such as states
and municipalities within the U.S. A downturn cuts back on their tax revenue and, since state
and local governments cannot create money, they must trim their spending – again
exacerbating the economic situation. Firms also rationally cut back on investment and
production in the face of these reductions in demand by individuals, households, and state and
local governments.
It is very difficult for individuals and business executives to get away from the idea that since
they are tightening their belts, the central government should be doing the same. The idea that
what makes sense individually does not make sense collectively has proven to be a tough sell.
Thus, the only macro actor in the U.S. at present that is actively trying to stimulate the
economy is the Federal Reserve, an agency which is somewhat insulated from politics. And
even the Fed has to keep reassuring the Congress that once it is sure the recovery is solid, it will
cease holding down interest rates.
A seemingly-unrelated event has suggested to me that there may be even more to the micro
pressure for austerity than just a tough-to-overcome fallacy of composition. I have long
followed the radio broadcasts of comedian Harry Shearer which originate at our local Santa
Monica public radio station, KCRW. A few weeks ago, Shearer’s program – Le Show – was
abruptly taken off the air by the station, although it was continued as a podcast while
paradoxically being sent to other stations around the country that have continued to broadcast
it. When local listeners protested the decision to drop the program, they received a response
from the station manager saying that “change is hard.” [See
http://www.youtube.com/watch?v=iBMbHUHxSGc.] 17
http://www.employmentpolicy.org/sites/www.employmentpolicy.org/files/field-content-
file/pdf/Daniel%20J.B.%20Mitchell/MitchellMusings%204-29-13.pdf
18 The fallacy of composition is the fallacy of inferring from the fact that every part of a whole has a given property
that the whole also has that property. Source: http://www.logicalfallacies.info/relevance/composition/.
27
The idea that “change is hard” is a variant on “no-pain/no gain” and numerous other bits of folk
wisdom. Within firms and organizations, imposed changes often are hard and do cause pain.
Mergers, downsizing, introduction of new technology, and other changes in policy implemented
at the top, all cause discomfort and resistance of varying intensity. It is worth noting, however,
that the discomfort falls on those who are the recipients or targets of the change, typically rank-
and-file employees. The discomfort may also extend up to management executives lower in
the hierarchy than those at the top who are decreeing the change.
For those at the top, change may not be hard at all. Indeed, there may be rewards for change.
And even if there are no explicit rewards, a top manager who simply continues the status quo –
even if all is well – might ultimately be seen as uncreative. If anything, therefore, change at the
top may be seen as a necessity, even if no change is actually warranted. Incoming top
managers are especially subject to pressures to change things in order to show they have new
ideas.
Folks in the medical area will be familiar with the idea that tests for diseases sometimes yield
“false positives.” That is, such tests may - with some frequency - suggest the presence of
disease where none exists. Similarly, use of the “change-is-hard” idea in the organizational
context risks producing false positives. Even if change is hard, there is nothing in that
observation that differentiates good change from bad. Rationalizing after the fact that a
decision to impose a change was needed because it produced pain and resistance can easily
lead to a false positive. At best, the pain and resistance are necessary, but not sufficient,
conditions for demonstrating the implementation of a good change.
The common use of change-is-hard as an indicator of good change can easily translate into the
misleading idea that if we observe any circumstance where pain is being felt and complaints are
being heard, change for the good is therefore underway. Moved to the macro level, the
change-is-hard idea seems to suggest that because the Great Recession was deep and because
the recovery is slow (and painful), underlying the process is a necessary and good change. In
short, there is a natural, but often fallacious, drift from change-is-hard to hard-change-is-good-
change to hardness-means-a-necessary-and-good-change-is-occurring.
What we have from this chain of illogic is the ultimate false positive. Pain, a negative, is taken
to be an indicator of a positive – a needed change that will eventually produce something
better in the economy. In the macroeconomic context, such changes are often labeled
“structural” although it is never clear why structural forces would have suddenly made
themselves felt at the end of 2007. The essence of structural problems is that they are slow to
develop. They don’t suddenly emerge.

28
Call this fallacy what you will, but in the macroeconomic context – whatever you call it – the
fallacy is particularly appealing to those who observe others in pain but who are not in pain
themselves.
29
Mitchell’s Musings 6-3-13: One of US?
Daniel J.B. Mitchell
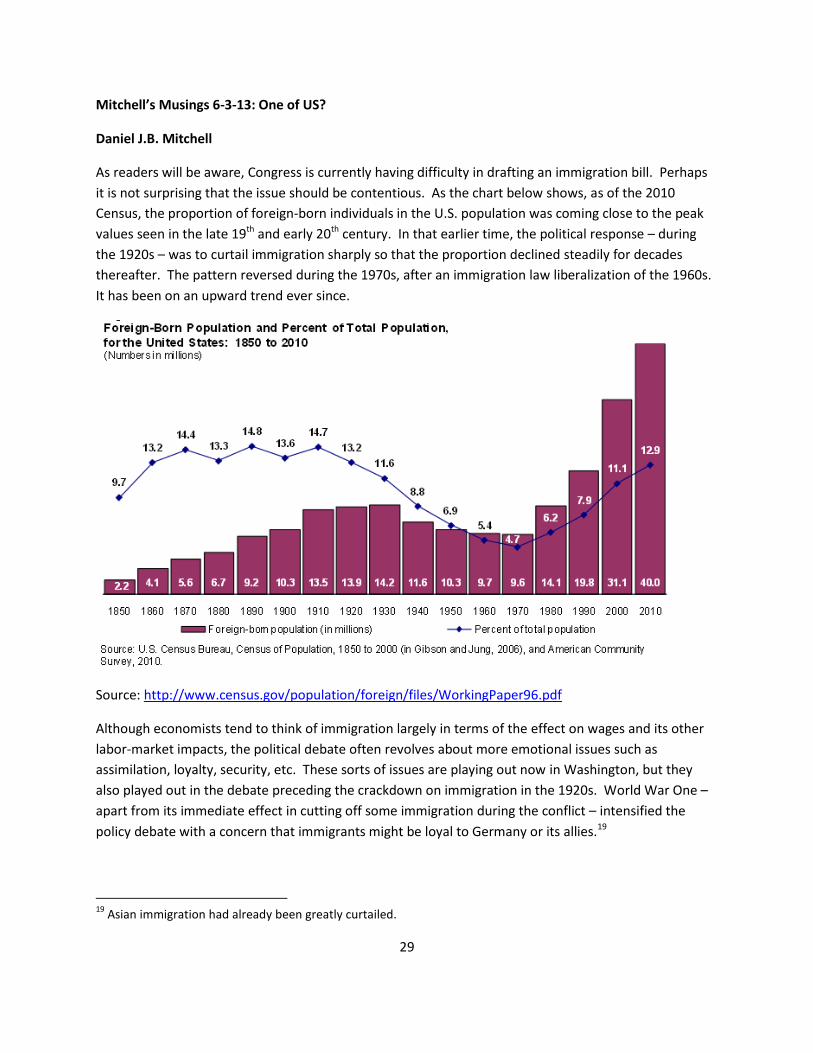
As readers will be aware, Congress is currently having difficulty in drafting an immigration bill. Perhaps
it is not surprising that the issue should be contentious. As the chart below shows, as of the 2010
Census, the proportion of foreign-born individuals in the U.S. population was coming close to the peak
values seen in the late 19th and early 20th century. In that earlier time, the political response – during
the 1920s – was to curtail immigration sharply so that the proportion declined steadily for decades
thereafter. The pattern reversed during the 1970s, after an immigration law liberalization of the 1960s.
It has been on an upward trend ever since.
Source: http://www.census.gov/population/foreign/files/WorkingPaper96.pdf
Although economists tend to think of immigration largely in terms of the effect on wages and its other
labor-market impacts, the political debate often revolves about more emotional issues such as
assimilation, loyalty, security, etc. These sorts of issues are playing out now in Washington, but they
also played out in the debate preceding the crackdown on immigration in the 1920s. World War One –
apart from its immediate effect in cutting off some immigration during the conflict – intensified the
policy debate with a concern that immigrants might be loyal to Germany or its allies.19
19
Asian immigration had already been greatly curtailed.
30
What brings that episode to mind was a collection of phonograph records from World War One that I
accumulated in the late 1950s at around age 15 and which I am scheduled to donate shortly to the
national World War One museum in Kansas City. (Long story.) These disks are acoustical (non-
electronic) recordings20 designed to drum up support for the war effort. They provide an insight into the
atmosphere of that era including the concern of potential immigrant disloyalty and potential lack of
assimilation.21 Most notably, the song “Let’s All Be Americans Now” is quite explicit:
https://www.youtube.com/watch?v=VWnlrc2FNX8
Peace has always been our prayer
Now there’s trouble in the air
War is [awesome (?)] everywhere
Still in God we trust
We’re not look for
Any kind of war
But if fight we must.
It’s up to you
What will you do?
England or France may have your sympathy
Or Germany
20
Acoustical = recorded directly through a horn rather than through an electrical microphone.
21 The complete set is available at
http://archive.org/details/WorldWarIPatrioticAcousticalPhonographRecordingsPart1
http://archive.org/details/WorldWarIPatrioticAcousticalPhonographRecordingsPart2
http://archive.org/details/WorldWarIAcousticalRecordingsPart3
Listeners may find the lightheartedness and naïveté of the songs to be disconcerting. Their tone is somewhat
surprising since, despite the shorter life expectancies of that era, there were still plenty of Civil War veterans
around who were aware of what a major war entailed. When World War Two rolled around, the songs tended to
be more restrained. World War One was a fresher memory.
31
But you’ll agree
That now is the time
To fall in line
This war [must be won (?)]
So be true to your vow
Let’s all be Americans now.
Lincoln, Grant, and Washington
They were peaceful men each one
Still they took the sword and gun
When real trouble came.
And I think somehow
They are wondering now
If we’ll do the same.
It’s up to you...
The fears stirred up by World War One were enhanced by a byproduct of the war – the creation of the
Soviet Union – and concerns about communism and importation of radical, foreign ideologies into the
U.S. Among the results were the “Palmer Raids” that followed heightened anxiety about domestic
subversion and terrorism.22 [See http://www.youtube.com/watch?v=Ap-KKWoiIk0.] There are at least
some parallels with current concerns about immigrant terrorists that arose after the attacks of
September 11, 2001 and more recently after the Boston Marathon bombings.
The media of the World War One era promoted such concerns. For example, the plot of the 1919-1920
silent film “Dangerous Hours” revolves around a naïve “true” American who is tricked by stealthy
immigrants into involvement in their nefarious activities. He discovers they are involved in a bombing
plot which he attempts to stop:
22
http://chnm.gmu.edu/courses/hist409/red.html.
32
https://www.youtube.com/watch?v=nUCTE3KDAjw
What seems different now is that Congress will either ultimately do nothing on immigration due to
gridlock or it will enact some version of liberalization. Congress does not seem destined to produce
some counterpart of the 1920s’ barriers to immigration although some increased border enforcement
may well be part of a deal (if there is a deal). Being perceived as anti-immigrant seems now to have
political penalties that did not exist in the earlier period.
That shift in public attitudes has characterized California politics and appears to have had more general
spillover effects. In 1994, incumbent Republican Governor Pete Wilson faced running for re-election in
the context of a depressed state economy and years of chronic state budget problems. He built a
campaign based on support for Proposition 187, a ballot initiative that would have cut state services to
illegal immigrants. TV ads for Wilson’s re-election can be seen at:
https://www.youtube.com/watch?v=o0f1PE8Kzng
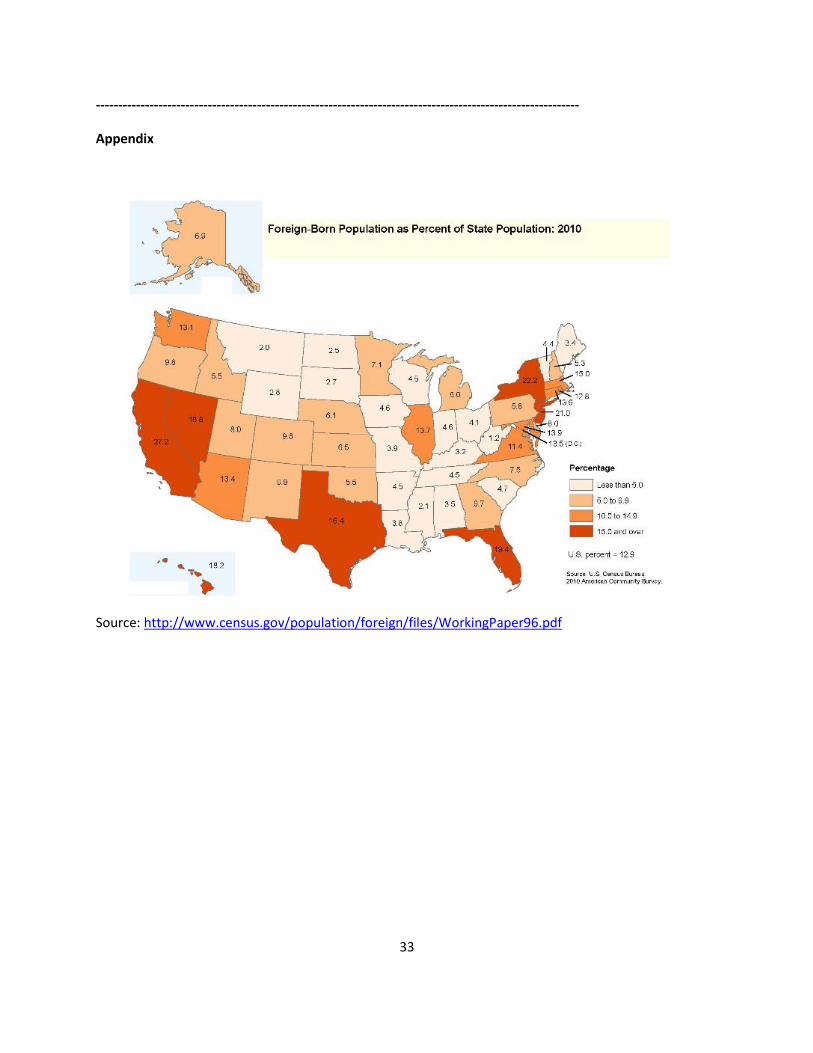
Wilson won in 1994, as did Prop 187 (although the latter was largely voided through litigation). But
thereafter, Republicans in California came to be seen as anti-immigrant and therefore anti-Latino. But
Latinos constituted a fast growing voting bloc in the state. As the chart in the Appendix to this musing
shows, California now has the highest percentage of foreign-born residents of any state (and the largest
absolute number).
By 2010, Republican gubernatorial candidates in California were trapped by the necessity of being tough
on immigration in their party’s primary and then trying to shift to a more centrist position in the general
election. In that year, Republican Meg Whitman and her chief opponent in the primary competed in
being tough on immigration. But when Whitman subsequently ran in the general election against
Democrat Jerry Brown, she had trouble trying to shift her position as this confrontation with two AM
talk-radio hosts illustrates:
https://www.youtube.com/watch?v=pXX46O7QE8k
Ultimately, Whitman lost (badly) to Brown, enmeshed in a controversy over her firing of an illegal
immigrant Latina housekeeper. At present, there are no statewide Republican officeholders in California
and Democrats control the legislature.
In 2012, Republican presidential candidate Mitt Romney ran into similar immigration issue problems in
his attempt to unseat incumbent Barack Obama. In that sense, the national political atmosphere on
immigration is different today than what it was in the 1920s. The issues driving the immigration debate
may be similar then and now, but the consequences seem different. On immigration policy this time
around, it isn’t back to the future.
33
------------------------------------------------------------------------------------------------------------
Appendix
Source: http://www.census.gov/population/foreign/files/WorkingPaper96.pdf

34
Mitchell’s Musings 6-10-13: Remarks on Getting LERA’s Lifetime Achievement Award at the St. Louis
meetings, June 8, 2013
Daniel J.B. Mitchell
Supposedly, everyone gets 15 minutes of fame.23 But at LERA on this occasion, the award recipients get
5. I wasn’t actually told about the 5 until yesterday; indeed, until yesterday I thought all I had to do was
say thank you to LERA and to my wife who has put up with a lot. But given the 5, I think the best way to
use them is to talk about history. LERA has always had an appreciation for history and my favorite
personal work has been my articles and books in which use of history played an important role. I’ll
come back to the uses of history in a moment but I grew up with an appreciation for artifacts of the past
that told a story of what things were like.
When I was 15, I inadvertently engaged in historic preservation. I found in a junk shop in Queens, NY,
near my home, a pile of old phonograph records from World War One – essentially patriotic songs
designed to encourage recruitment of soldiers and public support for the war effort. These were
acoustical recordings made through a horn – no electronics. Over a period of weeks, I bought them all
for 5 cents a piece. Just this past Wednesday, I took them to Kansas City on the way to the LERA
meetings. Kansas City has the national World War One museum there and I donated the collection. Of
course, I had earlier put digital recording of the records on YouTube and elsewhere on the web before
donating the physical copies. Anyone can now hear them.
What would you learn from these recordings that you would not find in a book? What stands out is the
incredible naïveté of that period about what modern war entailed. For example, one song – presumably
meant to encourage recruitment – has a soldier cheerfully reporting that he is glad he got shot in the
war because he is now being taken care of by a beautiful nurse. His friend happily signs up so he also
can also get shot and be attended by a beautiful nurse. [http://www.youtube.com/watch?v=-
HxRy7FIkwc – 3rd song: minute 6:10] The puzzle presented by that song (and others in the collection) is
that even though life expectancy was shorter then than now, there were plenty of Civil War veterans
around who could have told anyone who asked what a real war was like. Apparently, no one wanted to
ask. So the first lesson to be learned is that there are dangers of neglecting history.
Another lesson – very important if you teach young students – is that issues that we think of as unique
to our time in fact had counterparts earlier. Another old phonograph record I have – older than the
World War One collection – is a demonstration disk meant to promote the sale of two-sided
phonograph records. [http://www.youtube.com/watch?v=jxhavkZtosE] In case you are not aware of it,
the earliest disks were one sided; the flip side was blank or had a design but no recording on it. As you
may know, there is continuing controversy today about how to adjust the Consumer Price Index for new
products and technological improvements in quality. The old demonstration record claims you get two-
for-one with a double-sided record. So – I have asked classes - if you were doing the CPI back then –
23
The actual talk was a bit more informal than the written remarks.
35
essentially in the period when the CPI itself was being invented - should you treat the invention of a
two-sided record as a cutting of the price in half? That might seem a simple solution but if you are old
enough to remember phonograph records, you know that typically the hit song was on the A side and
the B side usually contained something less popular. It really wasn’t two-for-one in quality. So what
should the price adjustment be? The demo record also claims advances in sound quality – and there
were advances even in the acoustical era. How would you adjust for better sound quality? The second
lesson from history is that tech change has long been with us and is not something that just arrived
with laptops, tablets, and iPhones.
Let me mention a third lesson; there are lots of things about the past which we know to be true but
aren’t. My stepfather had been a union organizer and business agent for a union in the 1930s and after
he died, I came across a contract he had negotiated back then. Now we all “know” that modern
collective bargaining begins with the UAW-GM contract in the late 1940s with a multiyear duration, built
in wage increases for each year, and an escalator clause geared to the CPI. The only problem is that the
contract I found from the 1930s had a multiyear duration, specified yearly wage increases, and
contained an escalator clause. That discovery led to a project with my UCLA colleague, Sandy Jacoby, in
which we collected pre-World War Two contracts and created a database of their provisions. It turned
out that much of what we think of as post-World War Two contract innovations existed earlier, in some
cases much earlier. Sadly, I have to report, I have no idea of what became of our contract collection.
I could go on with history. For example, I have put on YouTube a variety of materials from news reports
and “secret” presidential recordings from the Nixon, Johnson, and Kennedy White Houses that illustrate
the labor relations issues of those periods and related economic concerns. I do a weekly column for
LERA’s EPRN. Some of those Mitchell’s Musings are devoted to discussion of those recordings. Many of
our ideas about macroeconomic policy in fact evolved during that era and are present on those
recordings. But some of these ideas mistakenly continue to influence contemporary policy even though
key economic institutions have changed since the 1960s and 1970s. The fourth and final lesson I would
like to impart is that sometimes we learn too much from history and don’t recognize obsolete notions.
So in thanking LERA for this recognition, let me urge the up-and-coming scholars in our midst not to
neglect history but also not assume that the past is always a foolproof guide to the future. And if you
are interested in the recordings I have mentioned, feel free to contact me for references and links.
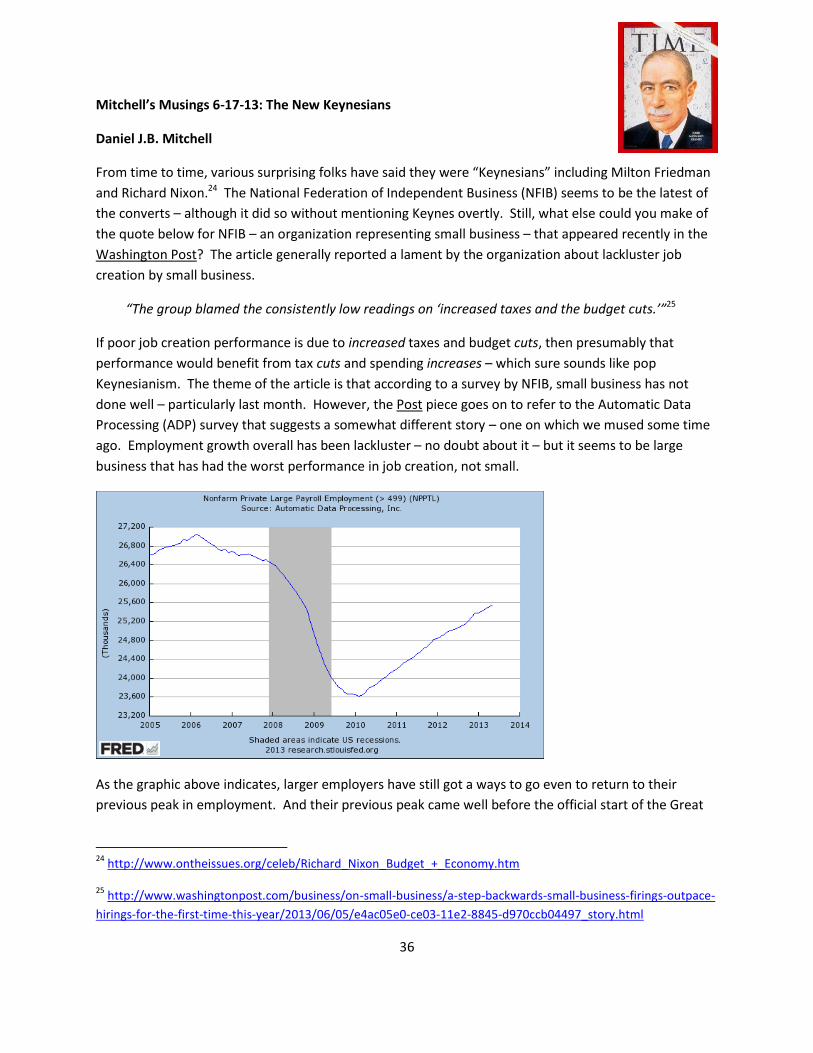
36
Mitchell’s Musings 6-17-13: The New Keynesians
Daniel J.B. Mitchell
From time to time, various surprising folks have said they were “Keynesians” including Milton Friedman
and Richard Nixon.24 The National Federation of Independent Business (NFIB) seems to be the latest of
the converts – although it did so without mentioning Keynes overtly. Still, what else could you make of
the quote below for NFIB – an organization representing small business – that appeared recently in the
Washington Post? The article generally reported a lament by the organization about lackluster job
creation by small business.
“The group blamed the consistently low readings on ‘increased taxes and the budget cuts.’”25
If poor job creation performance is due to increased taxes and budget cuts, then presumably that
performance would benefit from tax cuts and spending increases – which sure sounds like pop
Keynesianism. The theme of the article is that according to a survey by NFIB, small business has not
done well – particularly last month. However, the Post piece goes on to refer to the Automatic Data
Processing (ADP) survey that suggests a somewhat different story – one on which we mused some time
ago. Employment growth overall has been lackluster – no doubt about it – but it seems to be large
business that has had the worst performance in job creation, not small.
As the graphic above indicates, larger employers have still got a ways to go even to return to their
previous peak in employment. And their previous peak came well before the official start of the Great
24
http://www.ontheissues.org/celeb/Richard_Nixon_Budget_+_Economy.htm
25 http://www.washingtonpost.com/business/on-small-business/a-step-backwards-small-business-firings-outpace-
hirings-for-the-first-time-this-year/2013/06/05/e4ac05e0-ce03-11e2-8845-d970ccb04497_story.html
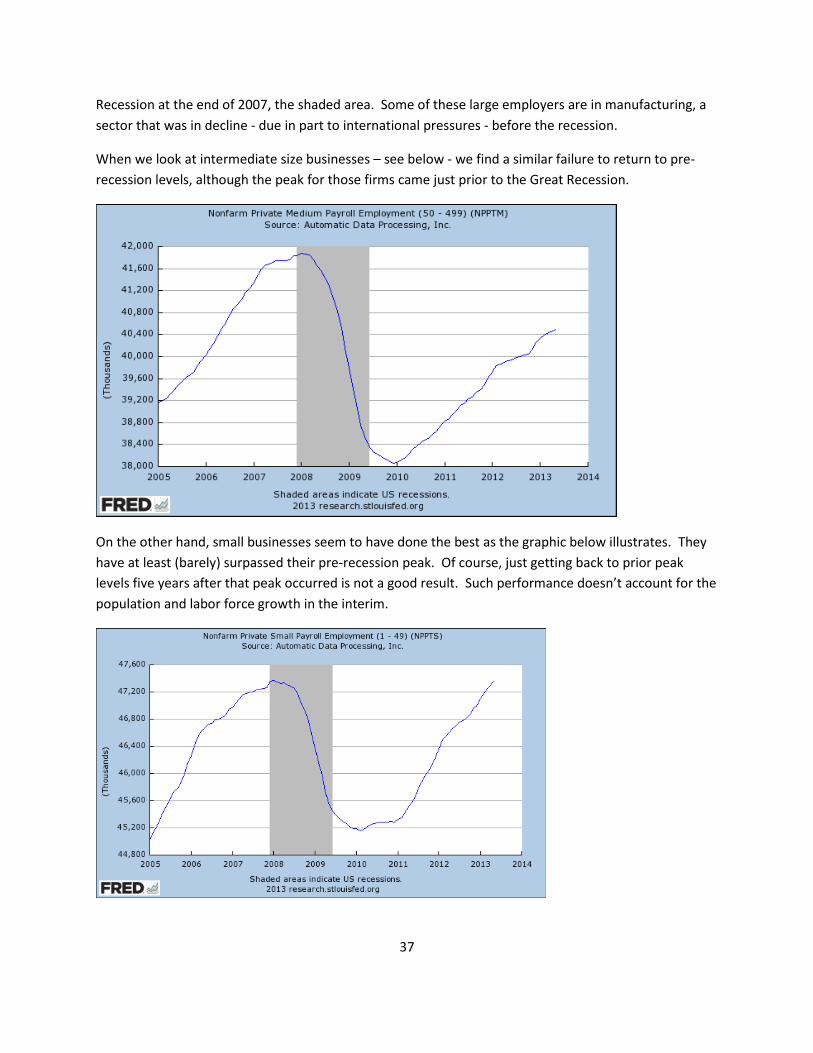
37
Recession at the end of 2007, the shaded area. Some of these large employers are in manufacturing, a
sector that was in decline - due in part to international pressures - before the recession.
When we look at intermediate size businesses – see below - we find a similar failure to return to pre-
recession levels, although the peak for those firms came just prior to the Great Recession.
On the other hand, small businesses seem to have done the best as the graphic below illustrates. They
have at least (barely) surpassed their pre-recession peak. Of course, just getting back to prior peak
levels five years after that peak occurred is not a good result. Such performance doesn’t account for the
population and labor force growth in the interim.
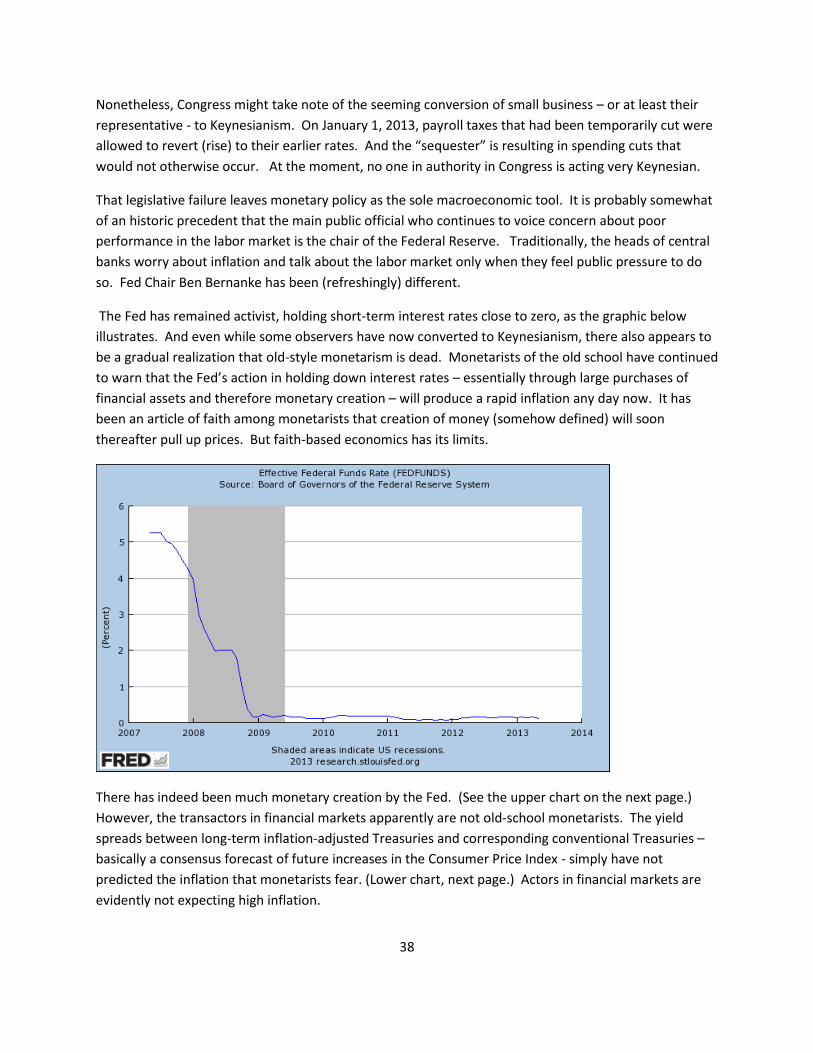
38
Nonetheless, Congress might take note of the seeming conversion of small business – or at least their
representative - to Keynesianism. On January 1, 2013, payroll taxes that had been temporarily cut were
allowed to revert (rise) to their earlier rates. And the “sequester” is resulting in spending cuts that
would not otherwise occur. At the moment, no one in authority in Congress is acting very Keynesian.
That legislative failure leaves monetary policy as the sole macroeconomic tool. It is probably somewhat
of an historic precedent that the main public official who continues to voice concern about poor
performance in the labor market is the chair of the Federal Reserve. Traditionally, the heads of central
banks worry about inflation and talk about the labor market only when they feel public pressure to do
so. Fed Chair Ben Bernanke has been (refreshingly) different.
The Fed has remained activist, holding short-term interest rates close to zero, as the graphic below
illustrates. And even while some observers have now converted to Keynesianism, there also appears to
be a gradual realization that old-style monetarism is dead. Monetarists of the old school have continued
to warn that the Fed’s action in holding down interest rates – essentially through large purchases of
financial assets and therefore monetary creation – will produce a rapid inflation any day now. It has
been an article of faith among monetarists that creation of money (somehow defined) will soon
thereafter pull up prices. But faith-based economics has its limits.
There has indeed been much monetary creation by the Fed. (See the upper chart on the next page.)
However, the transactors in financial markets apparently are not old-school monetarists. The yield
spreads between long-term inflation-adjusted Treasuries and corresponding conventional Treasuries –
basically a consensus forecast of future increases in the Consumer Price Index - simply have not
predicted the inflation that monetarists fear. (Lower chart, next page.) Actors in financial markets are
evidently not expecting high inflation.
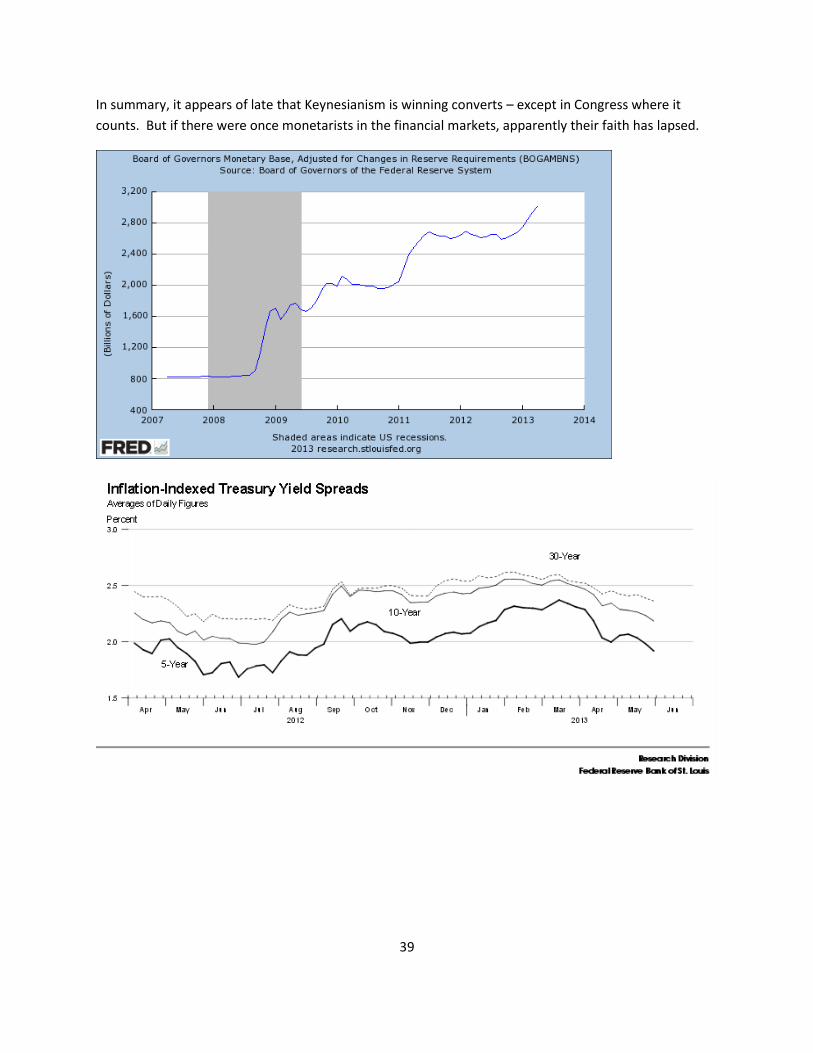
39
In summary, it appears of late that Keynesianism is winning converts – except in Congress where it
counts. But if there were once monetarists in the financial markets, apparently their faith has lapsed.
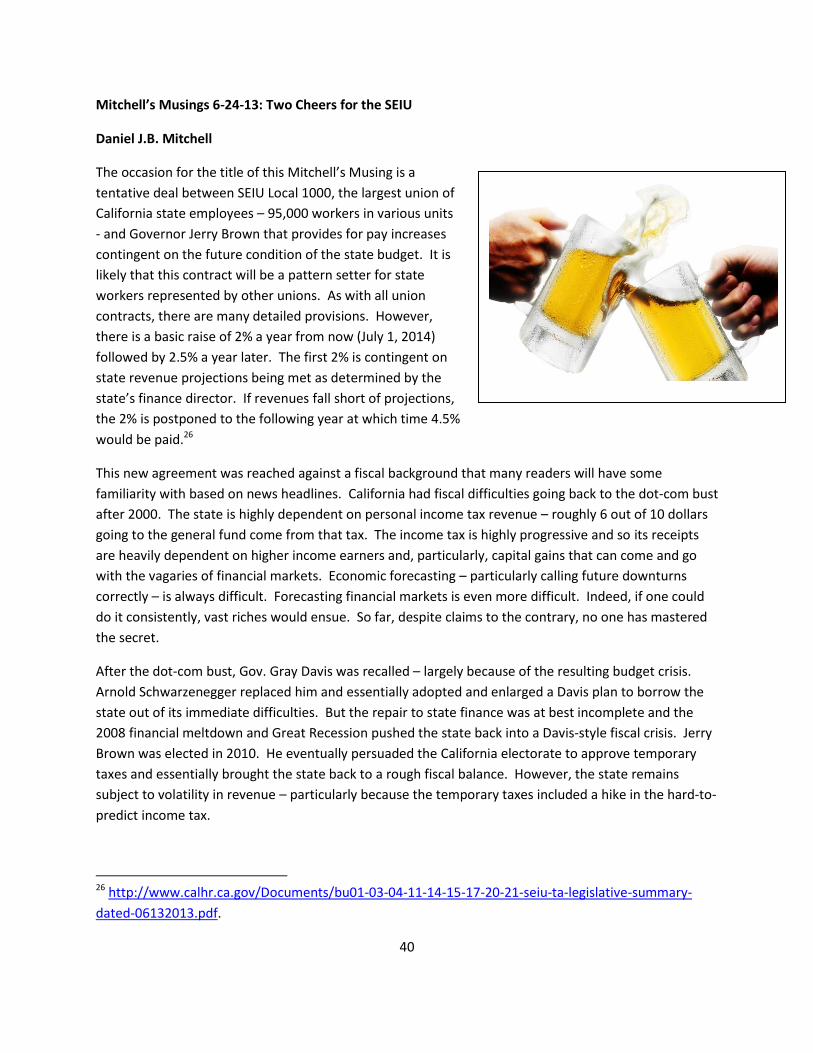
40
Mitchell’s Musings 6-24-13: Two Cheers for the SEIU
Daniel J.B. Mitchell
The occasion for the title of this Mitchell’s Musing is a
tentative deal between SEIU Local 1000, the largest union of
California state employees – 95,000 workers in various units
- and Governor Jerry Brown that provides for pay increases
contingent on the future condition of the state budget. It is
likely that this contract will be a pattern setter for state
workers represented by other unions. As with all union
contracts, there are many detailed provisions. However,
there is a basic raise of 2% a year from now (July 1, 2014)
followed by 2.5% a year later. The first 2% is contingent on
state revenue projections being met as determined by the
state’s finance director. If revenues fall short of projections,
the 2% is postponed to the following year at which time 4.5%
would be paid.26
This new agreement was reached against a fiscal background that many readers will have some
familiarity with based on news headlines. California had fiscal difficulties going back to the dot-com bust
after 2000. The state is highly dependent on personal income tax revenue – roughly 6 out of 10 dollars
going to the general fund come from that tax. The income tax is highly progressive and so its receipts
are heavily dependent on higher income earners and, particularly, capital gains that can come and go
with the vagaries of financial markets. Economic forecasting – particularly calling future downturns
correctly – is always difficult. Forecasting financial markets is even more difficult. Indeed, if one could
do it consistently, vast riches would ensue. So far, despite claims to the contrary, no one has mastered
the secret.
After the dot-com bust, Gov. Gray Davis was recalled – largely because of the resulting budget crisis.
Arnold Schwarzenegger replaced him and essentially adopted and enlarged a Davis plan to borrow the
state out of its immediate difficulties. But the repair to state finance was at best incomplete and the
2008 financial meltdown and Great Recession pushed the state back into a Davis-style fiscal crisis. Jerry
Brown was elected in 2010. He eventually persuaded the California electorate to approve temporary
taxes and essentially brought the state back to a rough fiscal balance. However, the state remains
subject to volatility in revenue – particularly because the temporary taxes included a hike in the hard-to-
predict income tax.
26 http://www.calhr.ca.gov/Documents/bu01-03-04-11-14-15-17-20-21-seiu-ta-legislative-summary-
dated-06132013.pdf.
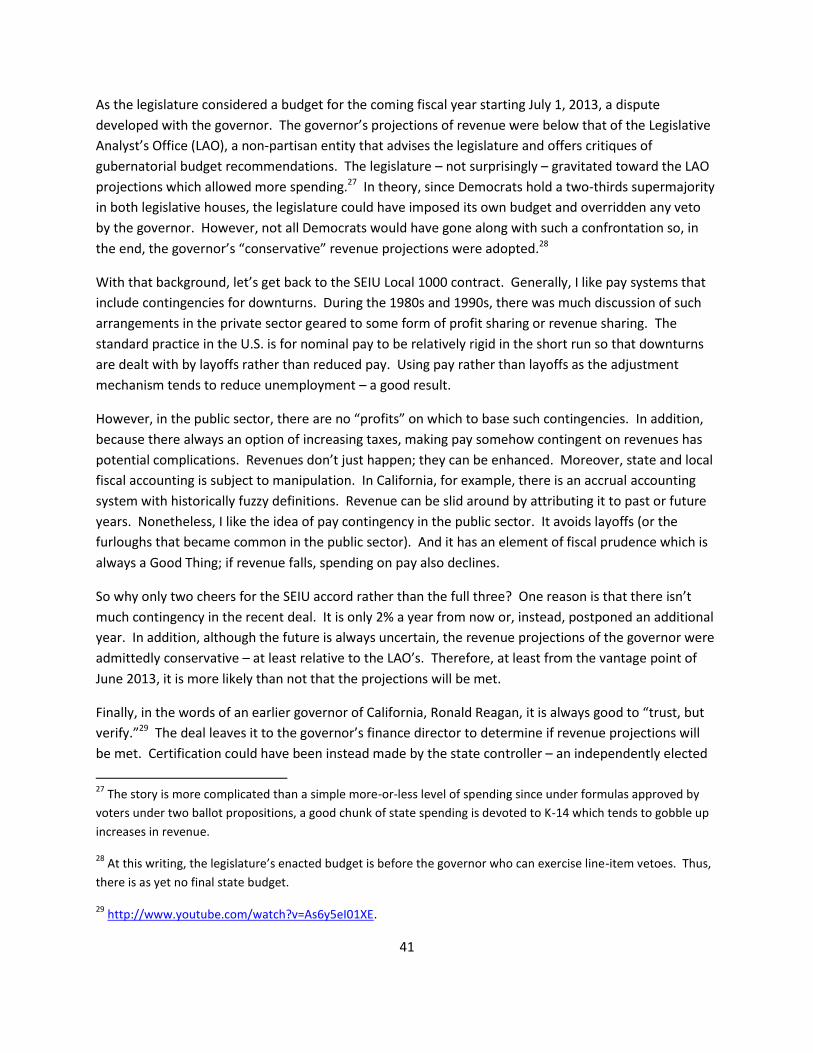
41
As the legislature considered a budget for the coming fiscal year starting July 1, 2013, a dispute
developed with the governor. The governor’s projections of revenue were below that of the Legislative
Analyst’s Office (LAO), a non-partisan entity that advises the legislature and offers critiques of
gubernatorial budget recommendations. The legislature – not surprisingly – gravitated toward the LAO
projections which allowed more spending.27 In theory, since Democrats hold a two-thirds supermajority
in both legislative houses, the legislature could have imposed its own budget and overridden any veto
by the governor. However, not all Democrats would have gone along with such a confrontation so, in
the end, the governor’s “conservative” revenue projections were adopted.28
With that background, let’s get back to the SEIU Local 1000 contract. Generally, I like pay systems that
include contingencies for downturns. During the 1980s and 1990s, there was much discussion of such
arrangements in the private sector geared to some form of profit sharing or revenue sharing. The
standard practice in the U.S. is for nominal pay to be relatively rigid in the short run so that downturns
are dealt with by layoffs rather than reduced pay. Using pay rather than layoffs as the adjustment
mechanism tends to reduce unemployment – a good result.
However, in the public sector, there are no “profits” on which to base such contingencies. In addition,
because there always an option of increasing taxes, making pay somehow contingent on revenues has
potential complications. Revenues don’t just happen; they can be enhanced. Moreover, state and local
fiscal accounting is subject to manipulation. In California, for example, there is an accrual accounting
system with historically fuzzy definitions. Revenue can be slid around by attributing it to past or future
years. Nonetheless, I like the idea of pay contingency in the public sector. It avoids layoffs (or the
furloughs that became common in the public sector). And it has an element of fiscal prudence which is
always a Good Thing; if revenue falls, spending on pay also declines.
So why only two cheers for the SEIU accord rather than the full three? One reason is that there isn’t
much contingency in the recent deal. It is only 2% a year from now or, instead, postponed an additional
year. In addition, although the future is always uncertain, the revenue projections of the governor were
admittedly conservative – at least relative to the LAO’s. Therefore, at least from the vantage point of
June 2013, it is more likely than not that the projections will be met.
Finally, in the words of an earlier governor of California, Ronald Reagan, it is always good to “trust, but
verify.”29 The deal leaves it to the governor’s finance director to determine if revenue projections will
be met. Certification could have been instead made by the state controller – an independently elected
27
The story is more complicated than a simple more-or-less level of spending since under formulas approved by
voters under two ballot propositions, a good chunk of state spending is devoted to K-14 which tends to gobble up
increases in revenue.
28 At this writing, the legislature’s enacted budget is before the governor who can exercise line-item vetoes. Thus,
there is as yet no final state budget.
29 http://www.youtube.com/watch?v=As6y5eI01XE.

42
official – who keeps track of cash inflows and outflows. Basing the contingent clause on actual cash
receipts rather than fuzzy accrual revenues would have been a sounder methodology. The SEIU deal in
short has more trust than verification.
Top Related