


Languages
Pages
Legal


@mnhealth #2016MNCHC
WELCOME!From Principle to Practice:
Walk the Talk for Health Equity
2016

Craig HelmstetterWilder Research
Community Health Conference, September 30, 2016
Minnesota’s Aging
Population

The collaborative of foundations behind Minnesota Compass…
Mardag Foundation
The McKnight Foundation
The Minneapolis Foundation
Northwest Minnesota Initiative Foundation
The Saint Paul Foundation
Wells Fargo Foundation Minnesota
Amherst H. Wilder Foundation
3M Foundation
Blue Cross and Blue Shield of Minnesota Foundation
Boston Scientific
Otto Bremer Trust
Bush Foundation
Greater Twin Cities United Way
Initiative Foundation
The Jay & Rose Phillips Family
Foundation of Minnesota

MNCompass.org
Which is the best metaphor for Aging in MN?

Which is the best metaphor for Aging in MN?
#1
#2
#3

270,000730,000
806,000
1,320,000

1990
1995
2000
2005
2010
2015
2020
2025
2030
2035
2040
2045
2050
2055
2060
2065
2070
0
200,000
400,000
600,000
800,000
1,000,000
1,200,000
1,400,000
1,600,000
Age 65+93% growth
2010-2035
Age 85+125%
growth 2020-2045

The population of what age group is growing most rapidly in Minnesota?
A) Children (age 0-17)
B) Working age adults (18-64)
C) Older Adults (65+)
D) None. All groups are shrinking.
QUIZ QUESTION #1

The population of what age group is growing most rapidly in Minnesota?
A) Children (age 0-17)
B) Working age adults (18-64)
C) Older Adults (65+)
D) None. All groups are shrinking.
QUIZ QUESTION #1

The population of what age group is projected to barely grow in the next quarter century?
A) Children (age 0-17)
B) Working age adults (18-64)
C) Older Adults (65+)
D) None. All groups will grow rapidly.
QUIZ QUESTION #2

The population of what age group is projected to barely grow in the next quarter century?
A) Children (age 0-17)
B) Working age adults (18-64)
C) Older Adults (65+)
D) None. All groups will grow rapidly.
QUIZ QUESTION #2

Minnesota’s population by age
Older adults (65+)
Working age (18-64)
Children (0-17)
Total population
64%
4%
3%
13%
47%
28%
10%
25% 1990-2015
2015-2040
GrowthToday (2015)
5.5 Million
1.3 Million
3.4 Million
806,000

0
200,000
400,000
600,000
800,000
1,000,000
1,200,000
1,400,000
1,600,000
Age 0- 4
Age 5-17
Age 65+
Minnesota’s population2020
Older Adults outnumber
school aged kids
2050Older Adults outnumberall children

0
500,000
1,000,000
1,500,000
2,000,000
2,500,000
3,000,000
3,500,000
4,000,000
Age 18-64
Age 65+
Minnesota’s population


Digital (age 0-19)
Millennial (age 19-35)
Generation X (age 36-51)
Baby Boom (age 52-70)
Silent (age 71-88)
Greatest (age 89+)
1,282,000(23%)
1,254,000(23%)
1,104,000(20%)
1,286,000(24%)
436,000(8%)
93,000(2%)
Minnesota’s population by generation
What generation are you in?
(Note: it is OK to lie in this case)

Digital (age 0-19)
Millennial (age 19-35)
Generation X (age 36-51)
Baby Boom (age 52-70)
Silent (age 71-88)
Greatest (age 89+)
1,282,000(23%)
1,254,000(23%)
1,104,000(20%)
1,286,000(24%)
436,000(8%)
93,000(2%)
Minnesota’s population by generation

Workforce shortage!
Loss of workplace leadership & expertise!
The “Silver Tsunami” =

The relationship between Health and Age is…
A) Linear
B) Curvilinear
C) Neither
QUIZ QUESTION #3

The relationship between Health and Age is…
A) Linear
B) Curvilinear
C) Neither
D) Honestly I’m not completely sure, but for many Health gets worse with Age
QUIZ QUESTION #3

20%
1%

65%
1%

Vision
Cognitive
Self care
Hearing
Independent living
Ambulatory
0% 5% 10% 15% 20% 25% 30% 35% 40% 45% 50%
85+75-8465-7418-64
Disability by type by age, Minnesota 2014

More health difficulties for individuals!
More pressure on care givers!
More pressure on health care systems!
The “Silver Tsunami” =

Are you ready for some beautiful butterflies?
A) YesB) Yes pleaseC) YES!!!
QUIZ QUESTION #4

Some good news about aging in Minnesota

Among lowest disability rates nation-wide!

The prevalence of some health conditions may improve with age

Our nation has figured out how to provide at least some level of health insurance to older adults, even prior to Affordable Care Act
Age 65+
Under 18
18-64

Older adults will help address Minnesota’s projected workforce shortage
22% 27%Age 65-74Age 75+
Age 55-64
Age 25-44

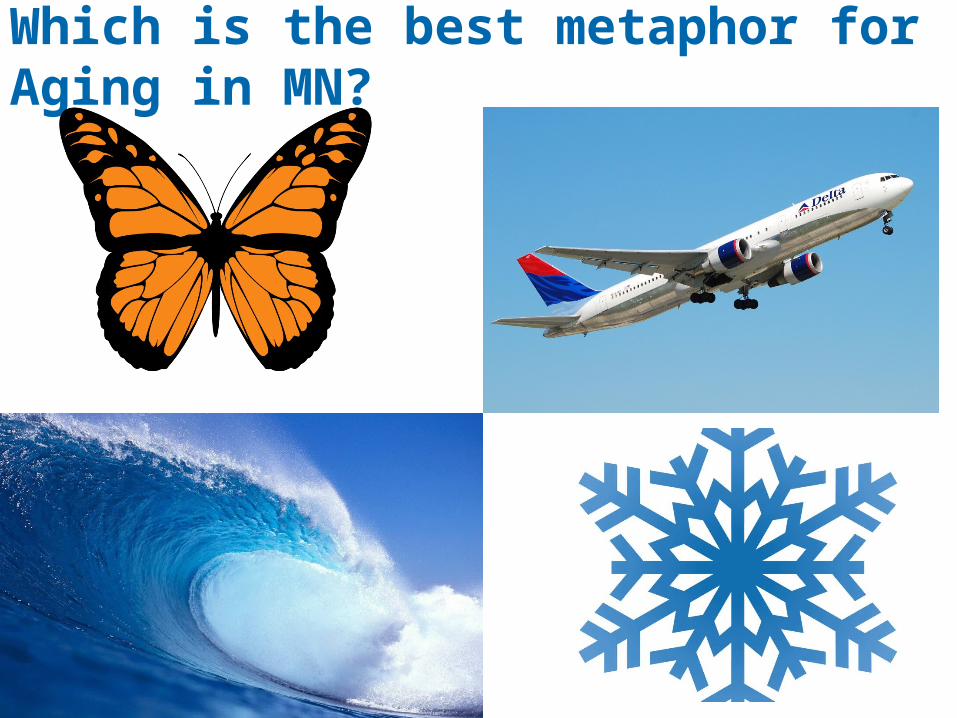
Among the highest levels of civic engagement!

What sort of asset will older adult volunteers
be for Minnesota by 2040?

Aging is impacting all areas of our state

Where can we learn how to best address an aging population?
What have we learned?

Stay in touch…
www.MNCompass.org
Text MNCOMPASS to 22828 to sign up for our e-newsletter
Follow us on Twitter @MNCompass @c_helmstetter
Connect with MN Compass on Facebook
Top Related