


Languages
Pages
Legal

2
Millenium Development Goals: Progress
• 2002 World Summit on Sustainable Development (South Africa)– promised to halve the number of people without clean water
and sanitation by 2015• 2003 World Water Summit (Kyoto, Japan)
– same goal reiterated• 2004 UN Commission on Sustainable Development
(New York)– found there had been no progress
• “If the world continues at this snail’s pace, billions of people will remain without access to safe water or basic sanitation, with little prospect of escaping poverty.”– Ravi Narayanan, Water Aid
Pearce, Keepers of the Spring
Water for… revealing the mystery of language and awakening the soul
We walked down the path to the well-house, attracted by the fragrance of the honeysuckle with which it was covered. Some one was drawing water and my teacher placed my hand under the spout.
As the cool stream gushed over one hand she spelled into the other the word water, first slowly, then rapidly. I stood still, my whole attention fixed upon the motions of her fingers.
Suddenly I felt a misty consciousness as of something forgotten — a thrill of returning thought; and somehow the mystery of language was revealed to me.
I knew then that "w-a-t-e-r" meant the wonderful cool something that was flowing over my hand. That living word awakened my soul, gave it light, hope, joy, set it free!– Helen Keller, The Story of My Life (1903)
http://en.wikiquote.org/wiki/Helen_Keller
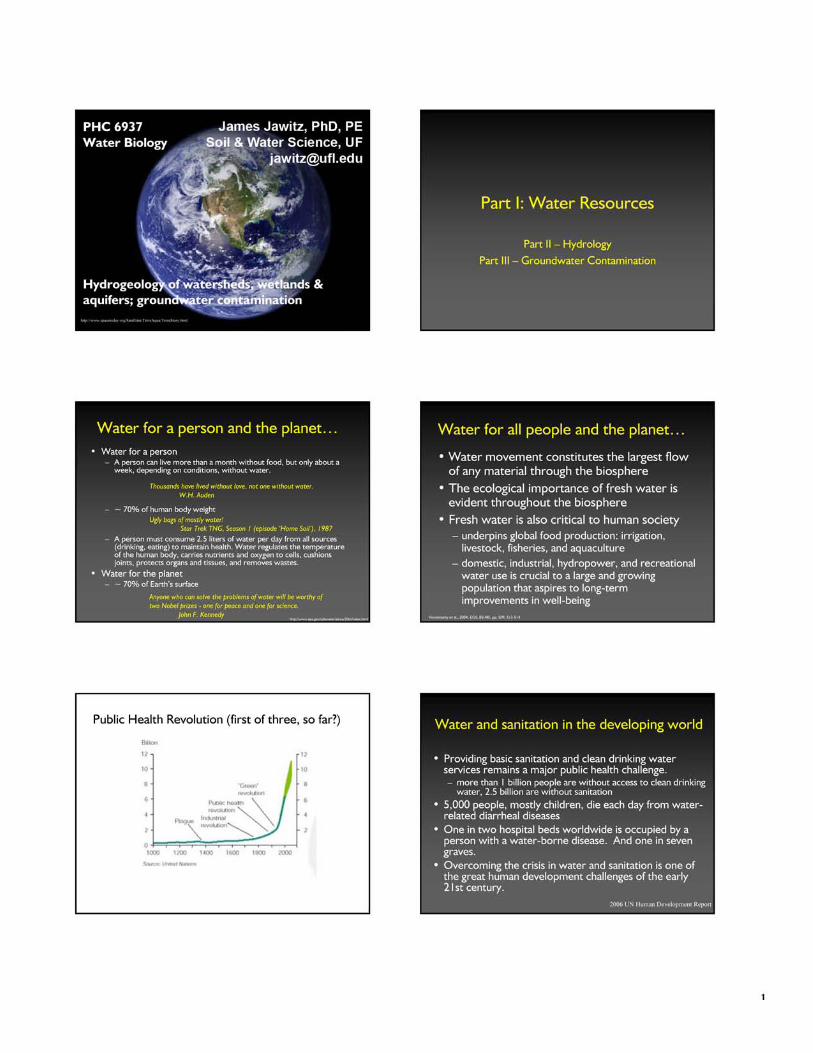
The water issue today… and yesterday
Out
side
Mag
azin
e, A
ug 2
003
http
://ou
tsid
e.aw
ay.c
om/o
utsi
de/t
oc/2
0030
8.ht
ml
Spor
ts Il
lust
rate
d, 1
2 M
arch
200
7ht
tp://
spor
tsill
ustr
ated
.cnn
.com
/si_
onlin
e/co
vers
/issu
es/2
007/
0312
.htm
l
US
New
s &
Wor
ld R
epor
t, 4
June
200
7ht
tp://
ww
w.u
snew
s.co
m/u
snew
s/iss
ue/0
7052
7/
Tim
e M
agaz
ine,
1 O
ctob
er 1
965
http
://w
ww
.tim
e.co
m/t
ime/
cove
rs/0
,166
41,1
9651
001,
00.h
tml
Tim
e M
agaz
ine,
22
Sept
embe
r 19
80ht
tp://
ww
w.ti
me.
com
/tim
e/co
vers
/0,1
6641
,198
0092
2,00
.htm
l
Earth systems are often studied as Hydrosphere, Atmosphere, Geosphere, Biosphere
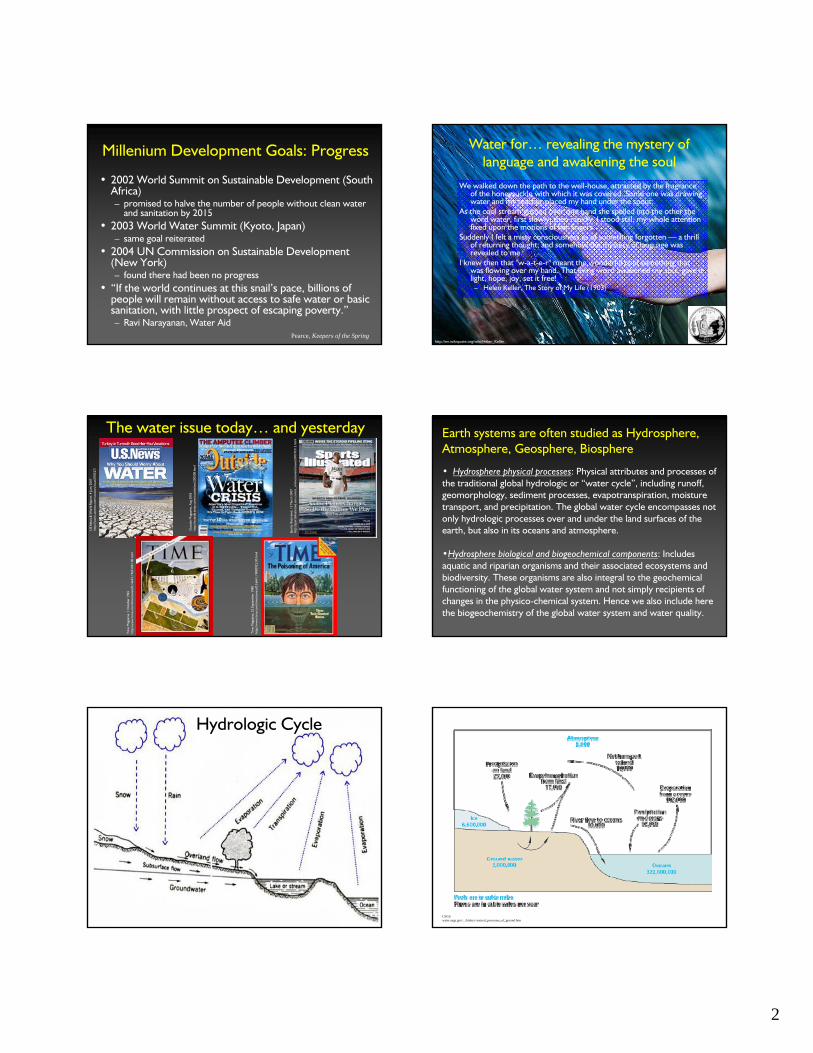
• Hydrosphere physical processes: Physical attributes and processes of the traditional global hydrologic or “water cycle”, including runoff, geomorphology, sediment processes, evapotranspiration, moisture transport, and precipitation. The global water cycle encompasses not only hydrologic processes over and under the land surfaces of the earth, but also in its oceans and atmosphere.
•Hydrosphere biological and biogeochemical components: Includes aquatic and riparian organisms and their associated ecosystems and biodiversity. These organisms are also integral to the geochemical functioning of the global water system and not simply recipients of changes in the physico-chemical system. Hence we also include here the biogeochemistry of the global water system and water quality.
Hydrologic Cycle
USGSwater.usgs.gov/.../htdocs/ natural_processes_of_ground.htm

3
What about humans?
• We left humans out of the Earth systems above (except in the biosphere):
• Human intervention in the hydrologic cycle defines water resources• Corollary to the hydrologic cycle: Hydraulic cycle
• The sum of water-related organizations, engineering works, and water use sectors. Society is not only a component of the global water system but also a significant agent of change within the system. Society is not only exposed to changes in water availability but also takes actions to mitigate or adapt to these changes.
Hydraulic cycle
• Source• Treatment• Distribution• Use• Collection• Treatment• Disposal
Chadwick and Moffett, 1998. Hydraulics in Civil and Environmental Engineering
Water SourceSurface WaterGroundwater
Water Treatment
Withdrawal
Distribution
Water UsePublic, Commercial,
Industrial, Institutional
Wastewater Treatment
WastewaterCollection
Disposal
Fresh Water Withdrawal
• Importance of agricultural use• Regional effects
Fraction of annual
renewable water resources
withdrawn (%)
Domestic Use (%)
Industrial Use (%)
Agricultural Use (%)
World 8 8 23 69 Egypt 97 7 5 88 Libya 404 15 10 75 United States 19 12 46 42
Gleick, 1993 or online version at http://worldwater.org
Earth’s Water Resources
Everything else (2.80%)
Oceans (97.20%)
Hydrosphere
All water in the atmosphere, soil, rivers, lakes, and wetlands: 0.03% of total on Earth.
Groundwater (0.62)
Everything else (0.03)
Glaciers (2.15)
Non-Ocean Components
4
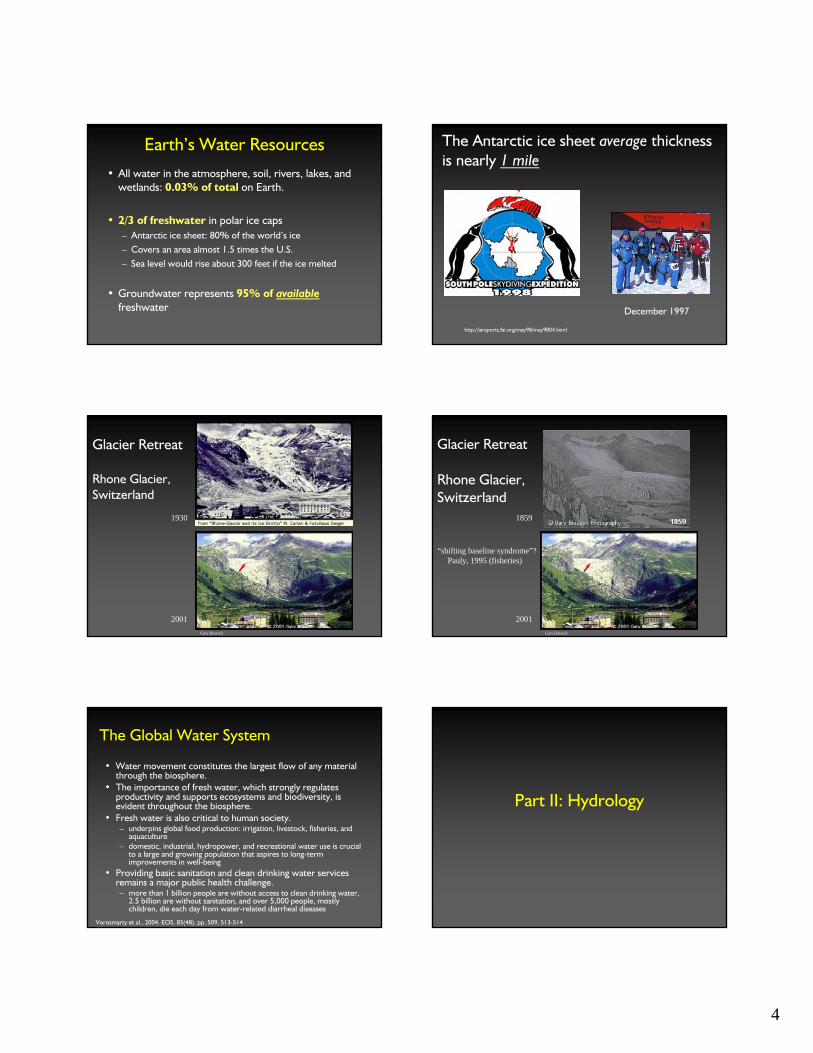
Earth’s Water Resources• All water in the atmosphere, soil, rivers, lakes, and
wetlands: 0.03% of total on Earth.
• 2/3 of freshwater in polar ice caps– Antarctic ice sheet: 80% of the world’s ice– Covers an area almost 1.5 times the U.S. – Sea level would rise about 300 feet if the ice melted
• Groundwater represents 95% of availablefreshwater
The Antarctic ice sheet average thickness is nearly 1 mile
December 1997
http://airsports.fai.org/may98/may9804.html
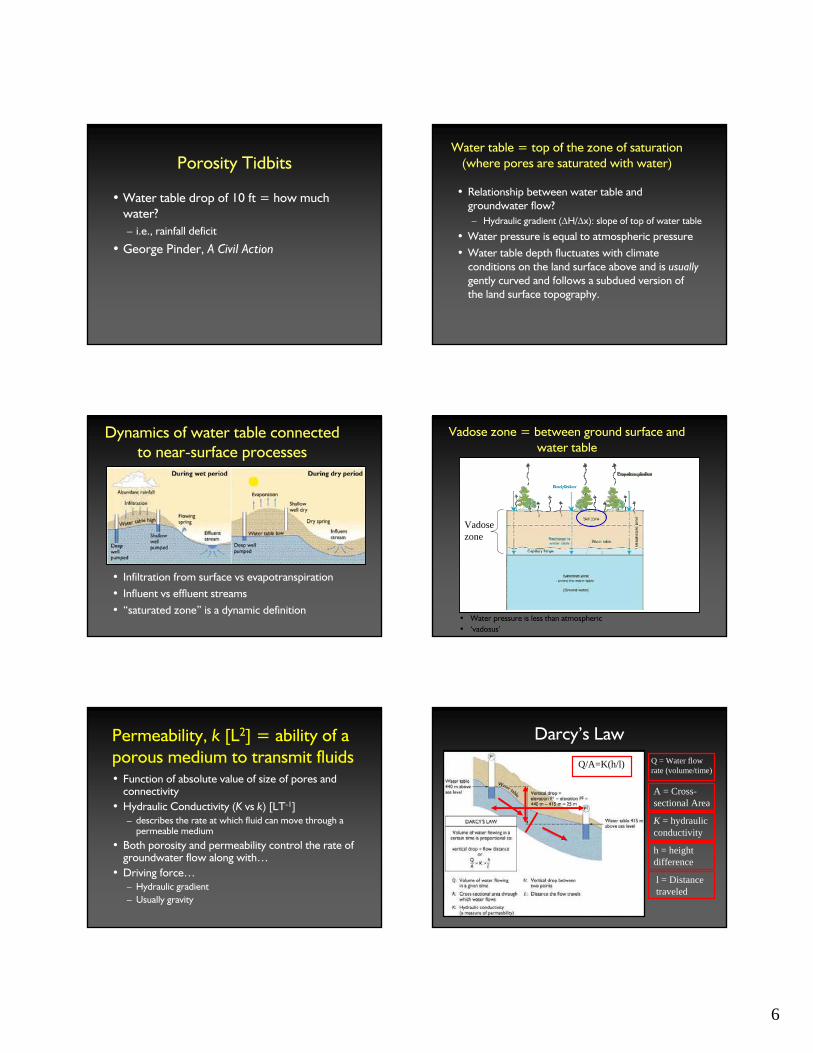
Glacier Retreat
Rhone Glacier,Switzerland
2001
1930
Gary Braasch
Glacier Retreat
Rhone Glacier,Switzerland
2001Gary Braasch
1859
“shifting baseline syndrome”?Pauly, 1995 (fisheries)
The Global Water System
• Water movement constitutes the largest flow of any material through the biosphere.
• The importance of fresh water, which strongly regulates productivity and supports ecosystems and biodiversity, is evident throughout the biosphere.
• Fresh water is also critical to human society.– underpins global food production: irrigation, livestock, fisheries, and
aquaculture– domestic, industrial, hydropower, and recreational water use is crucial
to a large and growing population that aspires to long-term improvements in well-being
• Providing basic sanitation and clean drinking water services remains a major public health challenge. – more than 1 billion people are without access to clean drinking water,
2.5 billion are without sanitation, and over 5,000 people, mostly children, die each day from water-related diarrheal diseases
Vorosmarty et al., 2004. EOS, 85(48), pp. 509, 513-514
Part II: Hydrology

5
Who uses groundwater?
Ref 3.1, Alley, W.M., Reilly, T.E., and O.L. Franke, 1999, Sustainability of Ground-Water Resources. United States Geological Survey Circular 1186, USGS: Denver, CO. http://water.usgs.gov/pubs/circ/circ1186
Why do people use groundwater?
• Local springs• Not enough rainfall• Abundant supply• Water quality
Suwannee River State Park, FLPhoto by me.
Aquifer: n. body of permeable rock able to hold or transmit water [Latin: aqua + fer]
• Confined aquifer – Wedged between layers of relatively impermeable
materials and consequently under pressure.
• Unconfined aquifer – Water table is the upper boundary. Because the aquifer
is not under pressure the water level in a well is the same as the water table outside the well. An unconfined aquifer is near the earth's surface causing it to be easily recharged locally as well as contaminated.
Unconfined vs Confined
• Contamination issues?
Porosity = …
• Ratio of void spaces in a geologic formation to the total volume of the formation.
• Intergranular vs intragranular (also interparticle/intraparticle)
• Primary vs secondary
T
v
VV
=η
Intergranular Porosity
6
Porosity Tidbits
• Water table drop of 10 ft = how much water? – i.e., rainfall deficit
• George Pinder, A Civil Action
Water table = top of the zone of saturation (where pores are saturated with water)
• Relationship between water table and groundwater flow?– Hydraulic gradient (ΔH/Δx): slope of top of water table
• Water pressure is equal to atmospheric pressure• Water table depth fluctuates with climate
conditions on the land surface above and is usuallygently curved and follows a subdued version of the land surface topography.
Dynamics of water table connected to near-surface processes
• Infiltration from surface vs evapotranspiration• Influent vs effluent streams• “saturated zone” is a dynamic definition
Vadosezone
Vadose zone = between ground surface and water table
• Water pressure is less than atmospheric• ‘vadosus’
Permeability, k [L2] = ability of a porous medium to transmit fluids• Function of absolute value of size of pores and
connectivity• Hydraulic Conductivity (K vs k) [LT-1]
– describes the rate at which fluid can move through a permeable medium
• Both porosity and permeability control the rate of groundwater flow along with…
• Driving force…– Hydraulic gradient– Usually gravity
Darcy’s Law
Q/A=K(h/l) Q = Water flow rate (volume/time)
A = Cross-sectional Area
K = hydraulic conductivity
h = height difference
l = Distance traveled

7
Specific discharge (Darcy velocity) not the same as porewater velocity
• Darcy’s Law
• Porewatervelocity (for saturated porous media)
qQA
Kddl
= = −φ
vq
=η
Kk g
=ρμ
But, unsaturated more tricky…
Hydraulic Gradient
• Natural groundwater flow• Groundwater is not sitting still!
– But is moving slowly…– Travel time for 10 m vs 1 km?
Definition of residence time
• The period of time that water remains in a system
τ = V/Q• How long does groundwater spend in an
aquifer• Turnover time is inverse of residence time
Residence Time and Vulnerability• Ocean
– P = 92,000 mi3/yr; Runoff = 10,000 mi3/yr– V = 322,600,000 mi3
– Average residence time = 3,100 years (or total turnover once in that time)
• Similar analysis for GW– P = 27,000 mi3/yr, ET = 17,000 mi3/yr– Roughly estimate that 10,000 mi3 infiltrates– World groundwater reservoir = 2,000,000 mi3– Average residence time = 200 years (or total turnover
once in that time)– Of course not uniform (25,000 yr old water under
Saudi Arabia = Pleistocene ice age)
Residence Time and Vulnerability
Tarbuck and Lutgens, Physical Geology Wat
er R
esou
rces
Atla
s of F
orid
a, F
erna
ld a
nd P
urdu
m, 1
998,
p. 5
0ht
tp://
ww
w.e
verg
lade
svill
age.
net/a
tlas_
of_f
la/a
tlas.h
tml
Floridan Aquifer System: Thickness in Feet
8
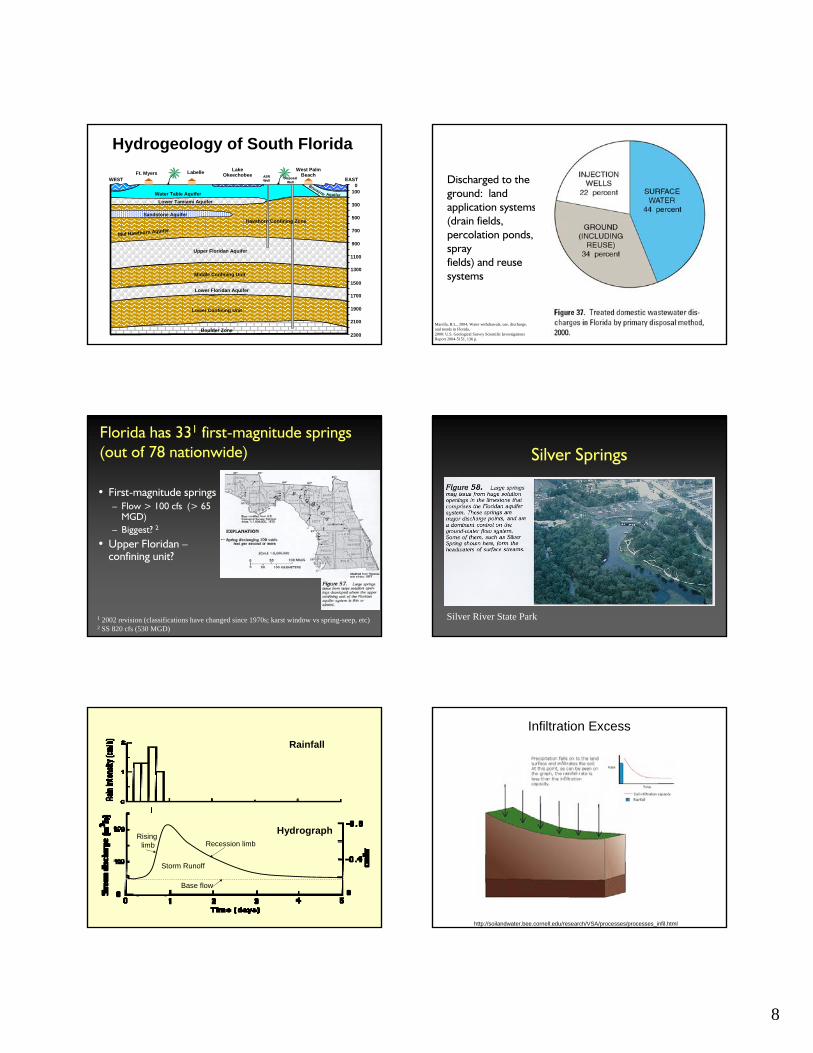
Hydrogeology of South FloridaWest Palm
BeachLake
OkeechobeeFt. Myers Labelle
2300
2100
1900
1700
1500
1300
1100
900
700
500
300
1000
Water Table Aquifer
Lower Confining Unit
Boulder Zone
Lower Floridan Aquifer
Middle Confining Unit
Upper Floridan Aquifer
Mid Hawthorn Aquifer
Lower Tamiami Aquifer
Biscayne
Sandstone Aquifer
Aquifer
WEST EASTDisposal Disposal WellWell
ASR ASR WellWell
Hawthorn Confining Zone
Discharged to the ground: landapplication systems (drain fields, percolation ponds, sprayfields) and reuse systems
Marella, R.L., 2004, Water withdrawals, use, discharge, and trends in Florida,2000: U.S. Geological Survey Scientific Investigations Report 2004-5151, 136 p.
Florida has 331 first-magnitude springs (out of 78 nationwide)
• First-magnitude springs– Flow > 100 cfs (> 65
MGD)– Biggest? 2
• Upper Floridan –confining unit?
1 2002 revision (classifications have changed since 1970s; karst window vs spring-seep, etc)2 SS 820 cfs (530 MGD)
Silver Springs
Silver River State Park
Hydrograph
Storm Runoff
Rising limb Recession limb
Base flow
Rainfall
Infiltration Excess
http://soilandwater.bee.cornell.edu/research/VSA/processes/processes_infil.html

9
Infiltration Excess
http://soilandwater.bee.cornell.edu/research/VSA/processes/processes_infil.html
Saturation Excess
http://soilandwater.bee.cornell.edu/research/VSA/processes/processes_sat.html
Saturation Excess
http://soilandwater.bee.cornell.edu/research/VSA/processes/processes_sat.html
Undeveloped Watershed
• Pervious surface
• Depressions in landscape
• Vegetated “rough”surface
DryRainEvent
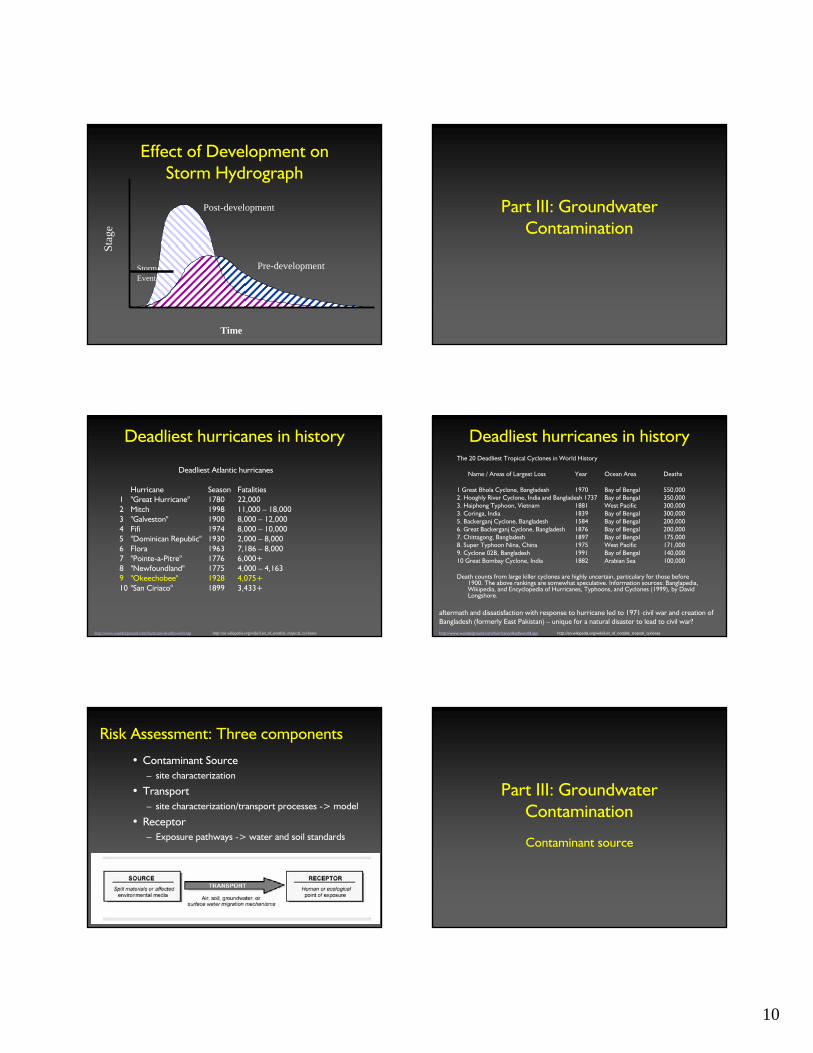
Effect of Development on Storm Hydrograph
Pre-development
Time
Stag
e
Storm Event
Developed Watershed• Impervious surfaces
increase • Depressions in
landscape drained• Vegetated “rough”
surfaces decrease and become smooth with quicker runoff.
• Culverts, swales, and ditches move water off the landscape quickly.
RainEvent
10
Effect of Development on Storm Hydrograph
Pre-development
Post-development
Time
Stag
e
Storm Event
Part III: Groundwater Contamination
Deadliest hurricanes in history
Deadliest Atlantic hurricanes
Hurricane Season Fatalities1 "Great Hurricane" 1780 22,0002 Mitch 1998 11,000 – 18,0003 "Galveston" 1900 8,000 – 12,0004 Fifi 1974 8,000 – 10,0005 "Dominican Republic" 1930 2,000 – 8,0006 Flora 1963 7,186 – 8,0007 "Pointe-a-Pitre" 1776 6,000+8 "Newfoundland" 1775 4,000 – 4,1639 "Okeechobee" 1928 4,075+10 "San Ciriaco" 1899 3,433+
http://www.wunderground.com/hurricane/deadlyworld.asp http://en.wikipedia.org/wiki/List_of_notable_tropical_cyclones
Deadliest hurricanes in history
aftermath and dissatisfaction with response to hurricane led to 1971 civil war and creation of Bangladesh (formerly East Pakistan) – unique for a natural disaster to lead to civil war?http://www.wunderground.com/hurricane/deadlyworld.asp http://en.wikipedia.org/wiki/List_of_notable_tropical_cyclones
The 20 Deadliest Tropical Cyclones in World History
Name / Areas of Largest Loss Year Ocean Area Deaths
1 Great Bhola Cyclone, Bangladesh 1970 Bay of Bengal 550,0002. Hooghly River Cyclone, India and Bangladesh 1737 Bay of Bengal 350,0003. Haiphong Typhoon, Vietnam 1881 West Pacific 300,0003. Coringa, India 1839 Bay of Bengal 300,0005. Backerganj Cyclone, Bangladesh 1584 Bay of Bengal 200,0006. Great Backerganj Cyclone, Bangladesh 1876 Bay of Bengal 200,0007. Chittagong, Bangladesh 1897 Bay of Bengal 175,0008. Super Typhoon Nina, China 1975 West Pacific 171,0009. Cyclone 02B, Bangladesh 1991 Bay of Bengal 140,00010 Great Bombay Cyclone, India 1882 Arabian Sea 100,000
Death counts from large killer cyclones are highly uncertain, particulary for those before 1900. The above rankings are somewhat speculative. Information sources: Banglapedia, Wikipedia, and Encyclopedia of Hurricanes, Typhoons, and Cyclones (1999), by David Longshore.
Risk Assessment: Three components
• Contaminant Source– site characterization
• Transport – site characterization/transport processes -> model
• Receptor– Exposure pathways -> water and soil standards
Part III: Groundwater Contamination
Contaminant source

11
Sources of groundwater contamination
• Point source – Gas station– Dry cleaner– Landfill– Deep-well injection– Other spills and disposal sites
• Nonpoint source– Agriculture– Wastewater
• Leaky sewers• Septic tanks
– Other wide-area sprays… (mosquito control; Goshutes)
Point source
Agricultural surface water drainage in the Everglades Agricultural Area (EAA) –nutrients (C, N, P), pesticides (photo from SFWMD)
Non-point source
In July 1945, DDT was widely (and mistakenly) hailed as a progressive measure to eradicate disease-bearing mosquitoes without posing a risk to human health. In this photo from a beach on Long Island, New York, a new insecticide-spraying machine is tested as beachgoers play in the mist. Although this chemical contact is obvious, many other sources of environmental chemical exposure are more difficult to identify.
Sext
on, K
. et a
l., 2
004.
Hum
an b
iom
onito
ring
of e
nviro
nmen
tal c
hem
ical
s, A
mer
ican
Sc
ient
ist,
92 (1
), p.
38,
doi
: 10.
1511
/200
4.1.
38
DDTPowerful InsecticideHarmless to Humans
Applied byTODD Insect Fog Applicator
Groundwater Contaminants
• Solutes– Organic– Inorganic
• salt
• Others?– Sediment– Biological (bacteria, viruses)
Contaminant Source Zone• Nonaqueous phase liquid (NAPL) contamination of groundwater
– immiscible with water – but enough dissolves to contaminate
DNAPL
GW Flow
Residual & Separate Phase Material

12
Part III: Groundwater Contamination
Contaminant transport
Solute Transport in One Slide
• Advection – physical mechanism by which pollutants are transported along with the flow of subsurface water
• Dispersion – spreading caused by ‘differential advection’
• Reactions– Sorption/desorption– Degradation
Dispersion conceptualized as differential advection
Part III: Groundwater Contamination
Receptors and case studies
Chess-based alternatives for dealing with groundwater contamination
• When in check, four alternatives:– Check mate
– Move the king out of check
– Block the attack
– Remove the attacker
Alternate water supply
Source management (Containment)Plume management (PAT)
Source removal
Illinois and Michigan Canal
• Constructed 1836 - 1848 for transportation of goods, 100 miles• 1871 cut deeper to convey wastewater away from Chicago
13
Selected events in the history of Chicago
• 1673 - Louis Joliet and voyageurs• 1848 sugar from New Orleans passed through
I&M Canal• 1849 first of annual cholera outbreaks• 1871 I&M Canal deepened and Chicago River flow
reversed for wastewater• 1900 Chicago Sanitary and Ship Canal• 1922 Cal-Sag Canal (the third major canal)• 1933 Illinois Waterway Channelized
What is cholera?
• Acute, diarrheal illness caused by infection of the intestine with the bacterium Vibrio cholerae.
• The infection is often mild or without symptoms, but sometimes it can be severe.
• Approximately one in 20 infected persons has severe disease characterized by profuse watery diarrhea, vomiting, and leg cramps.
• In these persons, rapid loss of body fluids leads to dehydration and shock.
• Without treatment, death can occur within hours.
http://www.cdc.gov/ncidod/dbmd/diseaseinfo/cholera_g.htmhttp://www.cdc.gov/ncidod/dbmd/diseaseinfo/cholera_g.htm
The Hall of Forgotten Presidents
• James K. Polk, President 1845 - 1849• “President Polk worked extremely hard during his
term and at the end of it, suffering from exhaustion, decided to return to private life even though he remained popular and probably could have won a second term. He also felt he had achieved what he had set out to do, and simply didn't need to return to the office. At the age of only 53, he died at his Nashville home a mere three months after leaving office.”
http://www.paulsilhan.com/hallpres.htmhttp://www.paulsilhan.com/hallpres.htm
Cholera epidemic origins in early 1800s• 1816-1826 - First pandemic: Previously restricted, the pandemic began in
Bengal, then spread across India by 1820. It extended as far as China and the Caspian Sea before receding.
• 1829-1851 - Second pandemic reached Europe– London in 1832 - at least 3000 victims– Also in 1832 Russia, Quebec, New York– By 1834, the Pacific coast of North America
• 1849 - An outbreak in North America took the life of U.S. President James K. Polk
• 1852-1860 - Third pandemic mainly affected Russia, with over a million deaths.• 1863-1875 - Fourth pandemic spread mostly in Europe and Africa.• 1866 - Outbreak in North America.• 1899-1923 - Sixth pandemic had little effect in Europe because of advances in
public health, but Russia was badly affected again.• 1961-1970s - Seventh pandemic began in Indonesia, called El Tor after the
strain, and reached Bangladesh in 1963, India in 1964, and the USSR in 1966. From North Africa it spread into Italy by 1973. In the late 1970s there were small outbreaks in Japan and in the South Pacific.
• January 1991 to September 1994 - Outbreak in South America, apparently initiated by discharged ballast water. Beginning in Peru there were 1.04 million identified cases and almost 10,000 deaths.
http://en.wikipedia.org/wiki/Cholerahttp://en.wikipedia.org/wiki/Cholera
Cholera today
• Developing world • WHO alerts (screen
capture from January 2006)
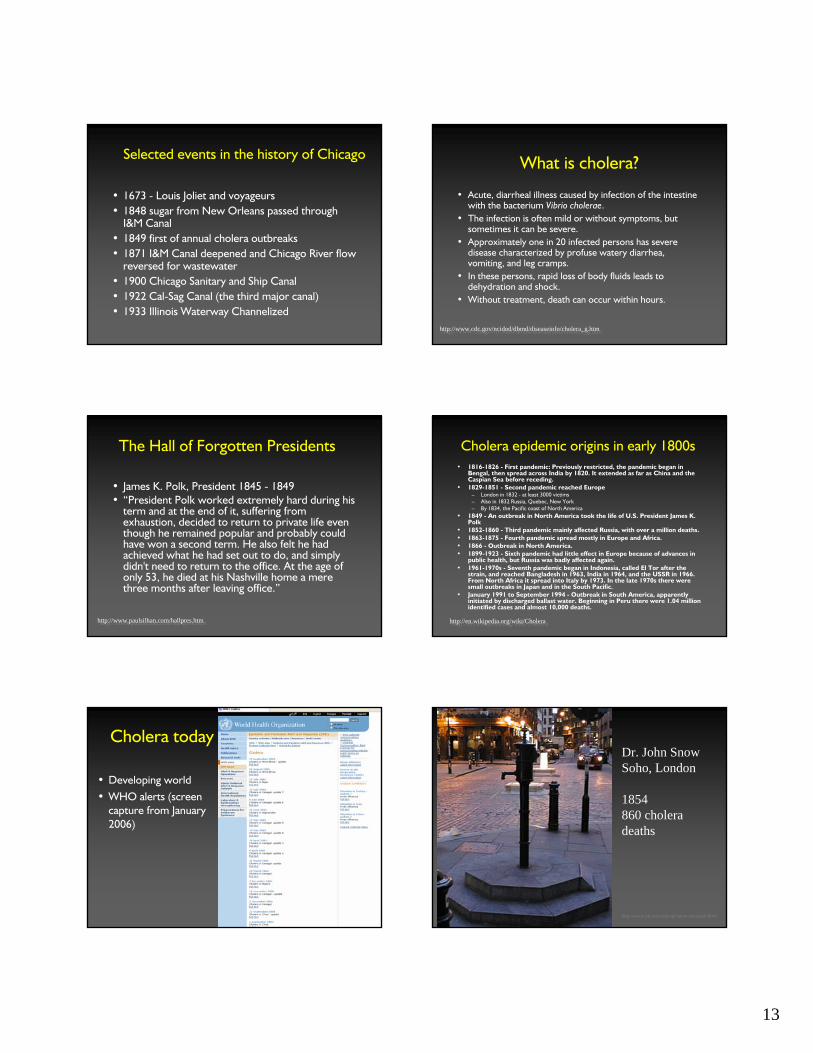
http://www.ph.ucla.edu/epi/snow/snowpub.html
Dr. John SnowSoho, London
1854860 cholera deaths

14
Data map(see Edward Tufte)
www.nationalgeographic.com www.nationalgeographic.com
Plaque photo byJohn White, May 2004
By the 1880s, Chicago's sewage flowed from the Chicago River past the Two Mile Crib, the source of Chicago's drinking water in Lake Michigan. Epidemics of typhoid and other diseases led to the establishment, in 1889, of the Sanitary District of Chicago (nowMetropolitan Water Reclamation District).
While the Sanitary and Ship Canal resulted in 91% drop in the rate of typhoid deaths in Chicago by 1908, Chicago's water supply was not truly safe until the addition of chlorine to the water in 1912. By 1917 Chicago's typhoid death rate had fallen to lowest of any major city in the nation.
Chicago Public Libraryhttp://www.chipublib.org/digital/sewers/history4.html
1995 Motor vehicle accident deaths17 per 100,000

15
World Human Population Growth West Bengal/Bangladesh
• About 10% of global population lives in the Ganges-Brahmaputra delta
• Sediments carried by the rivers transformed the landscape to one of the most fertile lands of the world
Arsenic in Groundwater• What is the source?• What are the pathways?• What is the remedy?
http://international.usgs.gov/projects/bg_arsenic.htm
Woburn, MA• Leukemia cluster• People did not realize the water
was contaminated
http
://w
ww
.geo
logy
.ohi
o-st
ate.
edu/
cour
troom
/ani
mat
ions
.htm
http
://w
ww
.geo
logy
.ohi
o-st
ate.
edu/
cour
troom
/ani
mat
ions
.htm

16
http
://w
ww
.geo
logy
.ohi
o-st
ate.
edu/
cour
troom
/ani
mat
ions
.htm
A personal history of encounters with DNAPL doubters
1995 – Can’t find it
• and even if you could, can’t remove it1998
– Ok, maybe you can remove it– but still can’t find it
• and even if you could, too expensive2001
– Ok, maybe you can find it and even remove (most of) it
– but no benefit from partial source removal• and even if there was some benefit, it’s not
enough to reach MCL2005
– hmm, maybe you can find it, remove it, and even accrue benefits
• but back-diffusion will kill you
Hill AFB 1994-1996; Dover AFB 1997-1999Rao et al. (WRR, 1997); Jawitz et al. (EST, 1998); McCray and Brusseau (EST, 1998); Faltaet al. (WRR, 1999); Brooks et al. (JCH, 2004); Childs et al. (JCH, 2006)
Sages (FL) 1998; Bachman Road (MI) 2000Jawitz et al. (EST, 2000); Mravik et al.(EST, 2003); Ramsburg et al. (EST, 2005)
Partial source removal debate: TheorySale and McWhorter (WRR, 2001); Raoand Jawitz (WRR, 2003); Parker and Park (WRR, 2004); Jawitz et al. (WRR, 2005)
Partial source removal and flux: Lab and field dataFure et al. (JCH, 2006)Brooks et al. (in prep)
WRR = Water Resources Research; EST = Environmental Science & Technology; JCH = J. Contaminant Hydrology
Historical summary related to present and future trends
• In summary– What was once scoffed at as unreasonable, too extreme, too
expensive is now recognized as necessary (although perhaps not quite “standard”)
– Practitioner community has caught up with research community on many fronts
• Current research says extensive characterization provides best chance of remedial success– But still many projects underspend on characterization– Investment in characterization predicted to grow
substantially
In situ flushing source zone remediation: Injection and extraction of chemical additives to solubilize(or mobilize) NAPLs from the subsurface
GW Flow
Injection WellRecoveryWell
2 PV 4 PV1 PV 9 PV6 PV
Jawitz et al., 1998. ES&T, 32(4).
Mass Reduction: SPME at Hill AFB
Triangles (red) = PCESquares (blue) = Ethanol
0
40
80
120
160
200
PCE
(mg/
L)
0
4
8
12
16
20
Etha
nol (
%)
0 5 10 15 20 25 30 35 0
200
400
600
800
1000
1200
PCE
(mg/
L)
0
20
40
60
Etha
nol (
%)
0 10 20 30 40 50 0
100
200
300
400
500
PCE
(mg/
L)
0
10
20
30
40
50
Etha
nol (
%)
0 10 20 30 40 50 60
0
2
4
6
8
10
PCE
(mg/
L)
0
2
4
6
8
10
Etha
nol (
%)
0 10 20 30 40 0
100
200
300
400
500
600
700
PCE
(mg/
L)
0
5
10
15
20
Etha
nol (
%)
0 20 40 60 80 100 0
200
400
600
800
1000
1200
1400
PCE
(mg/
L)
0
5
10
15
20
25
30
Etha
nol (
%)
0 20 40 60 80 100
RW 2 RW 3 RW 4
RW 5 RW 6 RW 7
Volume (kL)
Mass Reduction: Jacksonville, FL Site
Jawitz et al., 2000. ES&T, 34(17).

17
Remediation Performance Evaluation: Mass Removal
Hill AFB cosolvents (1994-1995) ~82%Hill AFB microemulsions (1996) ~90%CFB Borden cosolvents (1997) ~70%Dry cleaner site, Jacksonville, FL (1998) ~64%Dover AFB cosolvents (1998-1999) ~62%Dover AFB surfactants (2000) ~68%
Fraction of mass removed
Contaminant flux = f (HS, DS)HS - hydrodynamic structureDS – DNAPL architecture
Most contaminated
Least contaminated
ContaminantFlux (Jc)
ControlPlane
ContaminantFlux (Jc)
ControlPlane
B’
Source Zone B
A’
A
Post-Remediation:Source Zone
Pre-Remediation:
B
A’
A
B’
Source, Plume, Compliance PlanePre-Remediation:
DissolvedPlume
Control Plane Compliance Plane
DNAPL SourceZone
Dissolved
Partial Mass Removal + Enhanced Natural Attenuation:DNAPL SourceZone
Control Plane Compliance Plane
Plume
Dissolved
Partial Mass Removal:
DNAPL SourceZone
Control Plane Compliance Plane
Plume
Groundwater Protection Zone
(Wellhead protection)
Nitrate contaminants stored in the subsurface
• Potential long-term internal load
• McMahon et al., 2006 WRR
Top Related