


Languages
Pages
Legal

Tumor and Stem Cell Biology
Microfluidic-Based Multiplex qRT-PCR Identifies Diagnosticand Prognostic microRNA Signatures in the Sera of ProstateCancer Patients
Felix Moltzahn1–3, Adam B. Olshen4,6, Lauren Baehner1–3, Andrew Peek8, Lawrence Fong6,7,Hubert St€oppler6, Jeffry Simko5,6, Joan F. Hilton4,6, Peter Carroll3,6, and Robert Blelloch1–3,5,6
AbstractRecent prostate-specific antigen–based screening trials indicate an urgent need for novel and noninvasive
biomarker identification strategies to improve the prediction of prostate cancer behavior. Noncoding micro-RNAs (miRNA) in the serum and plasma have been shown to have potential as noninvasive markers forphysiologic and pathologic conditions. To identify serummiRNAs that diagnose and correlate with the prognosisof prostate cancer, we developed a multiplex quantitative reverse transcription PCR method involving thepurification of multiplex PCR products followed by uniplex analysis on a microfluidics chip to evaluate 384human miRNAs. Using Dgcr8 and Dicer knockout (small RNA-deficient) mouse ES cells as the benchmark, weconfirmed the validity of our technique and uncovered a considerable lack of accuracy in previously publishedmethods. Profiling 48 sera from healthy men and untreated prostate cancer patients with differing CAPRAscores, we identified miRNA signatures that allow us to diagnose cancer patients and correlate with a prognosis.These serum signatures include oncogenic and tumor-suppressive miRNAs, suggesting functional roles inprostate cancer progression. Cancer Res; 71(2); 550–60. �2010 AACR.
Introduction
One of 6 men will be diagnosed with prostate cancerduring their lifetime (1). However, using current risk stra-tification strategies, it is still difficult to separate patientswith rapidly progressing tumors, which require aggressivetreatment, from those with indolent tumors. The result isovertreatment, leading to undesirable side effects for a largepopulation of men and unnecessary consequential healthcare costs (2). Therefore, it is essential that new biomarkersare uncovered, which can predict the outcome of the diseasemore accurately and, hence, enable better individual treat-ment decisions.
Cancer biomarkers provide a potentially powerful tool inthe diagnosis/prognosis of cancer patients. In prostatecancer, the commonly used biomarker is prostate-specific
antigen (PSA), which is measured in the blood and showselevated levels in prostate cancer. Unfortunately, PSA aloneis a poor predictor of disease outcome (3). Recently, micro-RNAs (miRNA) have been found in serum and have beenproposed as potential biomarkers of normal physiology anddisease (4). MiRNAs are short (18–24 nucleotides), non-coding RNAs that regulate gene expression posttranscrip-tionally by both destabilizing messenger RNAs (mRNA) andinhibiting their translation. Canonical miRNAs derive fromlonger polymerase II transcripts called pri-miRNAs. Acomplex consisting of the proteins DGCR8 and Droshaprocess the pri-miRNAs to pre-miRNAs, which are thenexported to the cytoplasm and cleaved by the protein Dicerto mature miRNAs. Exceptions to this processing includenoncanonical miRNAs that bypass DGCR8/Drosha but arestill being processed by Dicer. Knockout models of Dgcr8and Dicer have been developed that remove only canonicalmiRNAs or both canonical and noncanonical miRNAs,respectively (5–7).
For prostate cancer tissue, there have been very few studiesthat compared miRNA expression levels in more than 10benign and malignant samples (8–11). Noticeably, there isno overlapping subset between the down- or upregulatedmiRNAs (12, 13). Mitchell et al. (14) were the first to showa correlation between miRNAs found in plasma and thepresence of prostate cancer. They showed that miRNAs ori-ginating from human prostate cancer xenografts can enter thecirculation, be measured in plasma, and can robustly distin-guish xenografted mice from controls. Furthermore, theyfound that serum levels of miR-141 distinguished patients
Authors' Affiliations: 1The Eli and Edythe Broad Center of RegenerationMedicine and Stem Cell Research, 2Center for Reproductive Sciences,Departments of 3Urology, 4Epidemiology and Biostatistics, and 5Pathol-ogy, 6UCSF – Helen Diller Family Comprehensive Cancer Center, and7Division of Hematology and Oncology, Department of Medicine, Univer-sity of California San Francisco, San Francisco, California; and 8RocheMolecular Diagnostics, Pleasanton, California
Note: Supplementary data for this article are available at Cancer ResearchOnline (http://cancerres.aacrjournals.org/).
Corresponding Author: Robert Blelloch, 513 Parnassus Avenue, HSE-1621, Box-0525, San Francisco, CA 94143. Phone: 415-476-2838; Fax:415-476-1635; E-mail: [email protected]
doi: 10.1158/0008-5472.CAN-10-1229
�2010 American Association for Cancer Research.
CancerResearch
Cancer Res; 71(2) January 15, 2011550
Research. on May 23, 2020. © 2011 American Association for Cancercancerres.aacrjournals.org Downloaded from
Published OnlineFirst November 22, 2010; DOI: 10.1158/0008-5472.CAN-10-1229
with advanced prostate cancer from healthy controls (14).Lodes et al. (15) screened 21 sera from 5 different cancerentities (colon, ovarian, breast, lung, and prostate). In total, 6prostate cancer patient samples were studied, of which 5 werefrom patients in advanced prostate cancer stages (3 and 4),and only 1 sample was from a nonadvanced stage. Four of thetotal 6 prostate cancer patients in this study had receivedsystemic chemotherapy (Taxotere or Lupron with/without thebisphosphonate Zometa). Therefore, it remains unclearwhether the altered serum miRNA levels are a result of thechemotherapy or reflect the actual advanced cancerous dis-ease (15).To establish a method for identifying miRNA signatures
that could provide diagnostic and prognostic information forprostate cancer patients prior to any treatment, we developeda novel multiplex quantitative reverse transcription PCR(qRT-PCR) method and tested 4 sets of patients (12 patientsin each set) with differing risk-stratifying "cancer of theprostate risk assessment" (CAPRA) scores. The method wasvalidated using wild-type mouse ES cells (mESC) and Dgcr8knockout and Dicer knockout mESC as negative controls,showing considerably improved accuracy relative to currentlypublished protocols. Using this technique on a microfluidicplatform, we screened patient serum samples for the expres-sion level of 384 miRNAs and uncovered miRNA signaturesthat diagnosed prostate cancer samples and correlated but didnot exactly match patient CAPRA scores, suggesting that thesesignatures may have the potential to separate patients withinthe risk groups and provide additional prognostic informa-tion. Many of the miRNAs found to correlate with groupingshave been shown to have oncogenic or tumor-suppressivefunctions in different cancer contexts and, therefore, alteredmiRNA levels in the serum may reflect functional roles withinthe tumors.
Materials and Methods
ES cell cultureWild-type, Dgcr8�/–, and Dicer�/– mESCs were made and
authenticated in the laboratory by Southern blots, mRNA, andmiRNA expression analysis, as described previously (5, 16).
Patient samplesHuman serum samples were obtained with informed
consent, and studies were done under the aegis of thecommittee on human research (CHR)–approved protocols.Normal serum (500 mL) was obtained from 12 healthy maleblood donors. Serum samples (500 mL) of UCSF prostatecancer patients representing different CAPRA scores werecollected from 36 patients before surgery. The CAPRA indexis a scoring scheme based on the patients’ age, PSA level,clinical tumor stage, Gleason score, and percentage ofbiopsy cores positive for cancer at diagnosis, which cur-rently provides the best prognostic insight (17). Patientswere distributed as follows: 12 low-risk (CAPRA score 1), 12intermediate-risk (CAPRA score 4), and 12 high-risk[CAPRA score > 5, Nþ (regional lymph nodes)] patients.At the time-point of blood collection, none of the patients
had received any therapeutic medication or surgical inter-vention. Samples were stored at �80�C until use.
RNA extractionmESC. Total RNA from wild-type, Dgcr8�/�, and Dicer�/�
mESC was extracted using TRIzol (Invitrogen), and RNAconcentration was quantified by the absorbance at 260 nm.
Human serum samples. RNA extraction followed a pre-viously described modified mirVana PARIS kit protocol (14).After extraction, the solution was concentrated (5�) using acentrifugal filter device (Microcon; Milipore).
miR-specific primerThe design of primers and probes was based on the pre-
viously published protocol of Tang et al., and details areprovided in supplementary data (Supplementary Fig. 1; ref.18). Libraries for the miRNA-specific reverse stem-loop (RSL-P) and forward primers (FP) as well as for the miRNA-specificprobes were designed based on the miRNA sequences fromthe miRBase database (Version 11; refs. 19, 20) and purchasedfrom IDT. The sequences for 677 different primers and probescan be found in supplementary data (Supplementary Table 1).
Reverse transcriptionmESC. For each sample, a multiplex RT reaction contain-
ing 96 RSL-P was done. One hundred nanograms of total RNAwas used for a 5-mL reaction. Final RSL-P concentration was1 nmol/L. Reaction conditions: 16�C for 30 minutes followedby 60 cycles at 20�C for 30 seconds, 42�C for 30 seconds, 50�Cfor 1 second, and finally 85�C for 5 minutes to inactivateMMLV-RT.
Human serum samples. For each sample, 4 independentmultiplex RT reactions, each containing 96 unique RSL-P,were done. Final RSL-P concentration was 2 nmol/L. Reactionconditions were the same as for mESC.
Pre-PCRmESC. For each sample, a multiplex pre-PCR containing
96 FP was done. All 5 mL of RT-Product was used as a templatefor 27.5 mL of pre-PCR. Final FP concentration was 50 nmol/L.Reaction conditions: 95�C for 10 minutes and 55�C for 2minutes, followed by 12 cycles of 95�C for 1 second, and65�C for 1 minute.
Human serum samples. For each sample, 4 independentmultiplex pre-PCR reactions, each containing 96 unique FP,were done. Final concentrations and reaction conditions werethe same as for mESC.
Purification of pre-PCR productGel purification. Each pre-PCR product was run through
a 10% native polyacrylamide gel. PCR product band was cutout and extracted in 0.3 mol/L NaCl. cDNA was precipitated inethanol, redissolved in nuclease-free water and stored at�80�C until use.
ExoSAP-IT purification. Five microliters of the pre-PCRproduct was mixed with 2 mL of ExoSAP-IT and incubated at37�C for 15 minutes. For inactivation, the mix was in a secondstep, incubated at 80�C for 15 minutes.
Serum miRNAs in Prostate Cancer
www.aacrjournals.org Cancer Res; 71(2) January 15, 2011 551
Research. on May 23, 2020. © 2011 American Association for Cancercancerres.aacrjournals.org Downloaded from
Published OnlineFirst November 22, 2010; DOI: 10.1158/0008-5472.CAN-10-1229
Column purification. Quiagen MinElute spin columnswere used to purify fragments ranging from 70 base pairs(bp) to 4 kb after pre-PCR, following the manufacturer'sprotocol.
ExoSAP-IT þ column purification. Column purificationwas done as described directly after the first step of ExoSAP-ITpurification, skipping the inactivation step.
384-well TaqMan qRT-PCR. One microliter of each pur-ified Pre-PCR product was used in a 10-mL single-plex reac-tion. All reactions were duplicated. Briefly 2� TaqManUniversal Master Mix (ABI), 1 mmol/L FP, 1 mmol/L UniversalReverse Primer, and 0.2 mmol/L TaqMan-Probe was used foreach real time PCR. All reactions were run and analyzed on anApplied Biosystems 7900 Real-Time PCR. Reaction conditions:55�C for 2 minutes and 95�C for 10 minutes, followed by 40cycles of 95�C for 15 seconds and 55�C for 1 minute.
miRNA expression screening using Fluidigmmicrofluidic high-throughput platform
Each chip profiled 48 samples in duplicate for the expres-sion level of 96 different miRNAs. Loading buffer was mixedwith 2.25 mL of each purified Pre-PCR product and 2� Taq-Man Universal Master Mix (ABI). For the assays, 1 mmol/L FP,1 mmol/L Universal Reverse Primer, and 0.2 mmol/L TaqMan-Probe were combined with loading reagent. Volume per inletwas 5 mL. Reaction conditions: 55�C for 2minutes and 95�C for10 minutes, followed by 40 cycles of 95�C for 15 seconds and55�C for 1 minute. The real-time qPCR analysis softwareprovides amplification curves, color-coded heat maps, andcycle threshold (Ct). Threshold and linear baseline correctionwere automatically calculated for the entire chip. Since experi-mental errors, such as inaccurate pipetting or contamination,can result in amplification curves that look very different froma typical amplification curve, all amplification plots werechecked both computationally and manually.
Statistical analysisThe initial data for statistical analysis were the DCt values
for each sample. Seventy of 384 miRNAs were positive in atleast 1 set of patients and, therefore, went into the finalanalysis. There were 38 samples analyzed since some sampleshad to be excluded because of technical problems and redblood cell lysis. Of these, 9 were healthy controls, 9 had a lowCAPRA score, 11 had an intermediate score, and 9 had a highscore. The remaining data were normalized for every sampleand multiplex by subtracting the corresponding median.Complete linkage hierarchical clustering with correlation asthe distance metric was done using Gene Cluster 3.0. Tocompare expression levels between groups, the t test wasused. To examine trends in expression across more than 2groups, linear regression was used. Then, 12 top candidatesfrom these analyses were validated using single-plex qRT-PCR.To adjust for multiple comparisons, P values were convertedto q values, using the method of Benjamini and Hochberg (21).The cutoff for statistical significance was a q value of less than0.05. Receiver operating characteristic (ROC) curves weregenerated using the binormal method and the web-basedcalculator for ROC curves. Area under the curves (AUC)
were automatically calculated and provided with individualROCs (22).
Results
Optimization of multiplex qRT-PCRTo identify miRNA signatures that diagnose and correlate
with prostate cancer prognosis, we set out to establish arobust profiling method that could be used on patient sera.Since the levels of small RNAs in serum are likely to be verylow, a multiplex RT-PCR–based quantification method wasevaluated. RSL-P, FP, and TaqMan probes were generated forall annotated human miRNAs (ref. 20; miRBase Version 11).The method involves RT and pre-PCR reactions carried out ina multiplex reaction, the dilution of pre-PCR reactions, andfinally, a uniplex qPCR (ref. 23; Fig. 1). To test the accuracy ofthe published method, we performed multiplex qRT-PCR for57 miRNAs of a 96-plex reaction that we, and others, haveshown by microarrays and/or deep sequencing to beexpressed in mESC (16, 24). Levels in wild-type ESC werecompared with levels in Dgcr8 knockout (lacking canonicalmiRNAs) and Dicer knockout (lacking canonical and nonca-nonical miRNAs) cells, serving as optimal negative controls.Surprisingly, although many miRNAs showed lower levels inknockout cells as expected, several expressed miRNAs werenot detected at all and some even showed increased levels inthe knockouts relative to wild-type ESC (Fig. 2A). This findingsuggested a lack of accuracy in the previously publishedmultiplex qRT-PCR technique.
We hypothesized that this lack of accuracy could be due tothe carry-over of the many primer sets from the multiplex pre-PCR step to the uniplex qPCR reactions. To test this hypoth-esis, pre-PCR products were purified away from primers,following pre-PCR, by size selection on native polyacrylamidegels (Fig. 1 and Supplementary Fig. 2). As expected, bands forthe expected product sizes were seen in the wild-type but notin the Dgcr8 or Dicer knockout ESC, and excessive primerswere seen in all backgrounds (Supplementary Fig. 2). Thepurified product was then subjected to uniplex qPCR reac-tions. The resulting quantitation revealed a remarkableimprovement in accuracy of the modified protocol over thestandard protocol. Of 53 canonical miRNAs, 16 miRNAs wereadditionally detected, showing substantially decreased levelsin Dgcr8 knockouts relative to wild-type cells. (Fig. 2A). FourmiRNAs were not detected independent of the technique used.No canonical miRNAs showed an increase in the Dgcr8 knock-out cells, unlike the standard protocol. All 3 Dgcr8-indepen-dent, Dicer-dependent, and noncanonical miRNAs (ref. 16;miR-320, -484, and -877) showed little change or evenincreases in the Dgcr8 knockout cells (Fig. 2B). The evaluationof the Dicer knockout ESCs showed a similar substantialdecrease in all canonical miRNAs, as seen in the Dgcr8 knock-out ESCs (Fig. 2C). Unlike the Dgcr8�, the Dicer knockoutESCs showed greater than 100-fold decrease in the noncano-nical miRNAs (Fig. 2C). The detection of more miRNAs, theloss of false-positive signals, and the ability for correct classi-fication of Dgcr8-independent and Dicer-dependent miRNAsshow that adding a purification step between pre-PCR and
Moltzahn et al.
Cancer Res; 71(2) January 15, 2011 Cancer Research552
Research. on May 23, 2020. © 2011 American Association for Cancercancerres.aacrjournals.org Downloaded from
Published OnlineFirst November 22, 2010; DOI: 10.1158/0008-5472.CAN-10-1229
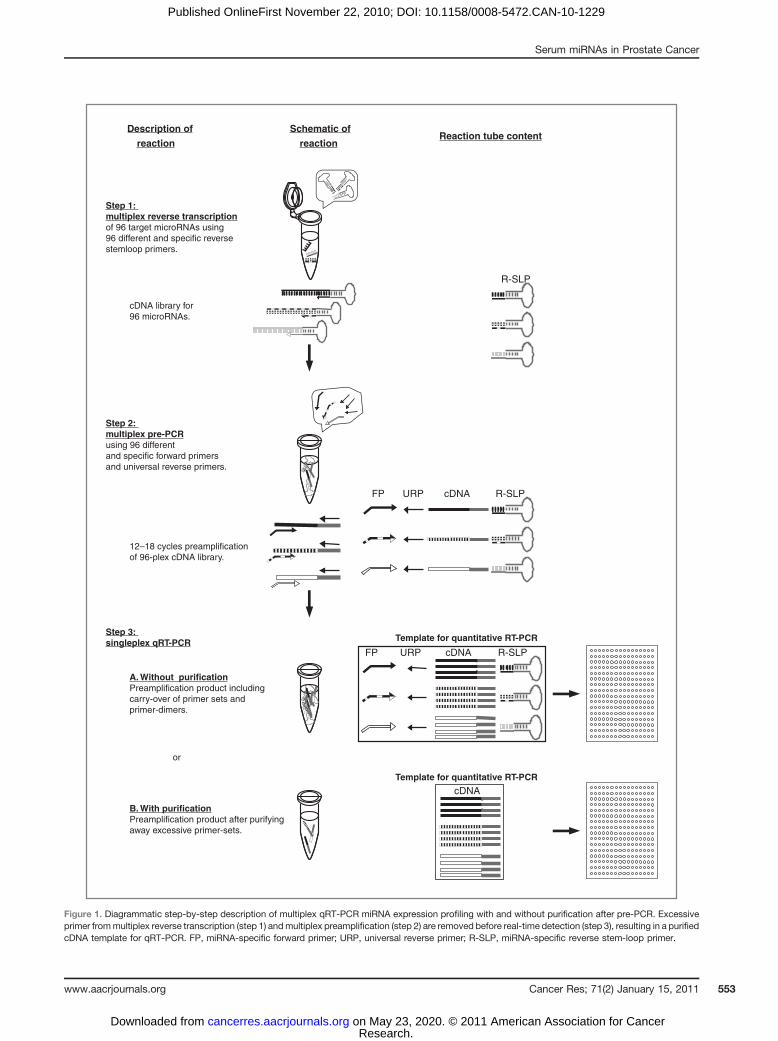
Step 1: multiplex reverse transcriptionof 96 target microRNAs using 96 different and specific reverse stemloop primers.
cDNA library for 96 microRNAs.
Step 2: multiplex pre-PCRusing 96 different and specific forward primers and universal reverse primers.
12–18 cycles preamplification of 96-plex cDNA library.
Reaction tube contentSchematic of
reaction
B. With purificationPreamplification product after purifying away excessive primer-sets.
A. Without purificationPreamplification product including carry-over of primer sets andprimer-dimers.
Step 3: singleplex qRT-PCR Template for quantitative RT-PCR
or
cDNAURPFP R-SLP
Description of
reaction
cDNAURPFP R-SLP
cDNATemplate for quantitative RT-PCR
R-SLP
Figure 1. Diagrammatic step-by-step description of multiplex qRT-PCR miRNA expression profiling with and without purification after pre-PCR. Excessiveprimer frommultiplex reverse transcription (step 1) andmultiplex preamplification (step 2) are removed before real-time detection (step 3), resulting in a purifiedcDNA template for qRT-PCR. FP, miRNA-specific forward primer; URP, universal reverse primer; R-SLP, miRNA-specific reverse stem-loop primer.
Serum miRNAs in Prostate Cancer
www.aacrjournals.org Cancer Res; 71(2) January 15, 2011 553
Research. on May 23, 2020. © 2011 American Association for Cancercancerres.aacrjournals.org Downloaded from
Published OnlineFirst November 22, 2010; DOI: 10.1158/0008-5472.CAN-10-1229
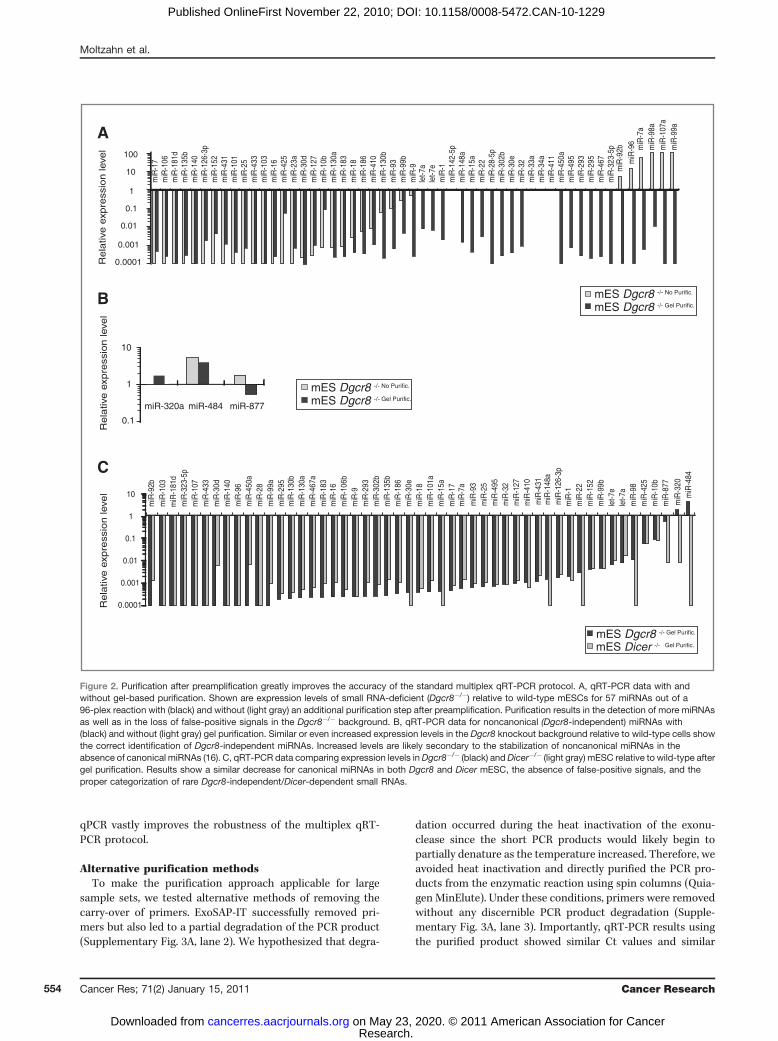
qPCR vastly improves the robustness of the multiplex qRT-PCR protocol.
Alternative purification methodsTo make the purification approach applicable for large
sample sets, we tested alternative methods of removing thecarry-over of primers. ExoSAP-IT successfully removed pri-mers but also led to a partial degradation of the PCR product(Supplementary Fig. 3A, lane 2). We hypothesized that degra-
dation occurred during the heat inactivation of the exonu-clease since the short PCR products would likely begin topartially denature as the temperature increased. Therefore, weavoided heat inactivation and directly purified the PCR pro-ducts from the enzymatic reaction using spin columns (Quia-gen MinElute). Under these conditions, primers were removedwithout any discernible PCR product degradation (Supple-mentary Fig. 3A, lane 3). Importantly, qRT-PCR results usingthe purified product showed similar Ct values and similar
Re
lativ
e e
xpre
ssio
n le
vel
C
0.1
1
10
0.001
0.01
0.0001
miR
-30d
miR
-140
miR
-96
miR
-450
am
iR-2
8m
iR-9
9am
iR-2
95m
iR-1
30b
miR
-130
am
iR-4
67a
miR
-183
miR
-16
miR
-106
bm
iR-9
miR
-293
miR
-302
bm
iR-1
35b
miR
-186
miR
-30e
miR
-18
miR
-101
am
iR-1
5am
iR-1
7m
iR-7
a
miR
-148
a
miR
-1m
iR-2
2m
iR-1
52m
iR-9
9ble
t-7e
let-7
am
iR-9
8m
iR-4
25m
iR-1
0b
miR
-320
miR
-484
miR
-92b
miR
-103
miR
-181
dm
iR-3
23-5
pm
iR-1
07m
iR-4
33
miR
-93
miR
-25
miR
-495
miR
-32
miR
-127
miR
-410
miR
-431
miR
-126
-3p
miR
-877
mES Dicer -/- Gel Purific.
mES Dgcr8 -/- Gel Purific.
mES Dgcr8 -/- Gel Purific.
mES Dgcr8 -/- No Purific.
0.1
1
10
miR-484 miR-877miR-320a
Re
lativ
e e
xpre
ssio
n le
vel
B
0.001
0.01
0.1
1
0.0001
10
100
miR
-152
miR
-431
miR
-101
miR
-25
miR
-433
miR
-103
miR
-16
miR
-425
miR
-23a
miR
-30d
miR
-127
miR
-10b
miR
-99b
miR
-410
miR
-130
b
miR
-186
miR
-183
miR
-9
miR
-18
let-7
a
miR
-1m
iR-1
42-5
pm
iR-1
48a
miR
-34a
miR
-450
am
iR-4
95m
iR-2
93m
iR-2
95m
iR-4
67
miR
-92b
miR
-96
miR
-7a
miR
-98a
miR
-107
a
miR
-17
miR
-106
miR
-181
dm
iR-1
35b
miR
-140
miR
-126
-3p
miR
-15a
miR
-22
miR
-28-
5pm
iR-3
02b
miR
-30e
miR
-32
miR
-33a
miR
-411
miR
-99a
miR
-130
a
miR
-93
let-7
e
miR
-323
-5p
mES Dgcr8 -/- Gel Purific.
mES Dgcr8 -/- No Purific.
Re
lativ
e e
xpre
ssio
n le
vel
A
Figure 2. Purification after preamplification greatly improves the accuracy of the standard multiplex qRT-PCR protocol. A, qRT-PCR data with andwithout gel-based purification. Shown are expression levels of small RNA-deficient (Dgcr8�/�) relative to wild-type mESCs for 57 miRNAs out of a96-plex reaction with (black) and without (light gray) an additional purification step after preamplification. Purification results in the detection of more miRNAsas well as in the loss of false-positive signals in the Dgcr8�/� background. B, qRT-PCR data for noncanonical (Dgcr8-independent) miRNAs with(black) and without (light gray) gel purification. Similar or even increased expression levels in the Dgcr8 knockout background relative to wild-type cells showthe correct identification of Dgcr8-independent miRNAs. Increased levels are likely secondary to the stabilization of noncanonical miRNAs in theabsence of canonical miRNAs (16). C, qRT-PCR data comparing expression levels inDgcr8�/� (black) andDicer�/� (light gray) mESC relative to wild-type aftergel purification. Results show a similar decrease for canonical miRNAs in both Dgcr8 and Dicer mESC, the absence of false-positive signals, and theproper categorization of rare Dgcr8-independent/Dicer-dependent small RNAs.
Moltzahn et al.
Cancer Res; 71(2) January 15, 2011 Cancer Research554
Research. on May 23, 2020. © 2011 American Association for Cancercancerres.aacrjournals.org Downloaded from
Published OnlineFirst November 22, 2010; DOI: 10.1158/0008-5472.CAN-10-1229
relative expression values of small RNA-deficient cells, as wellas the ability to correctly classify noncanonical miRNA as seenafter gel purification (Supplementary Fig. 3A and C), suggest-ing equal robustness of this simplified purification approach.
Global profiling of untreated prostate cancer patientswith differing prognostic riskHaving established a robust multiplex qRT-PCRmethod, we
initiated profiling experiments on patient sera representingdifferent risks of disease progression. All sera samples(healthy, low-, intermediate-, and high-risk patients) were
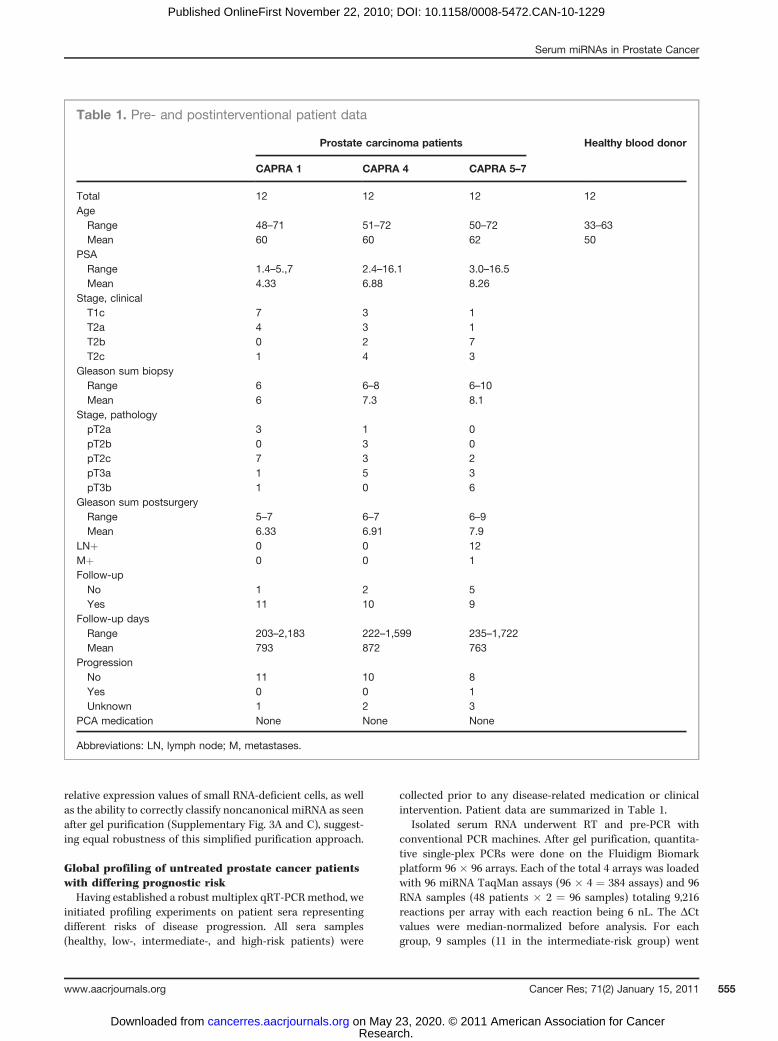
collected prior to any disease-related medication or clinicalintervention. Patient data are summarized in Table 1.
Isolated serum RNA underwent RT and pre-PCR withconventional PCR machines. After gel purification, quantita-tive single-plex PCRs were done on the Fluidigm Biomarkplatform 96 � 96 arrays. Each of the total 4 arrays was loadedwith 96 miRNA TaqMan assays (96 � 4 ¼ 384 assays) and 96RNA samples (48 patients � 2 ¼ 96 samples) totaling 9,216reactions per array with each reaction being 6 nL. The DCtvalues were median-normalized before analysis. For eachgroup, 9 samples (11 in the intermediate-risk group) went
Table 1. Pre- and postinterventional patient data
Prostate carcinoma patients Healthy blood donor
CAPRA 1 CAPRA 4 CAPRA 5–7
Total 12 12 12 12Age
Range 48–71 51–72 50–72 33–63Mean 60 60 62 50
PSARange 1.4–5.,7 2.4–16.1 3.0–16.5Mean 4.33 6.88 8.26
Stage, clinicalT1c 7 3 1T2a 4 3 1T2b 0 2 7T2c 1 4 3
Gleason sum biopsyRange 6 6–8 6–10Mean 6 7.3 8.1
Stage, pathologypT2a 3 1 0pT2b 0 3 0pT2c 7 3 2pT3a 1 5 3pT3b 1 0 6
Gleason sum postsurgeryRange 5–7 6–7 6–9Mean 6.33 6.91 7.9
LNþ 0 0 12Mþ 0 0 1Follow-up
No 1 2 5Yes 11 10 9
Follow-up daysRange 203–2,183 222–1,599 235–1,722Mean 793 872 763
ProgressionNo 11 10 8Yes 0 0 1Unknown 1 2 3
PCA medication None None None
Abbreviations: LN, lymph node; M, metastases.
Serum miRNAs in Prostate Cancer
www.aacrjournals.org Cancer Res; 71(2) January 15, 2011 555
Research. on May 23, 2020. © 2011 American Association for Cancercancerres.aacrjournals.org Downloaded from
Published OnlineFirst November 22, 2010; DOI: 10.1158/0008-5472.CAN-10-1229
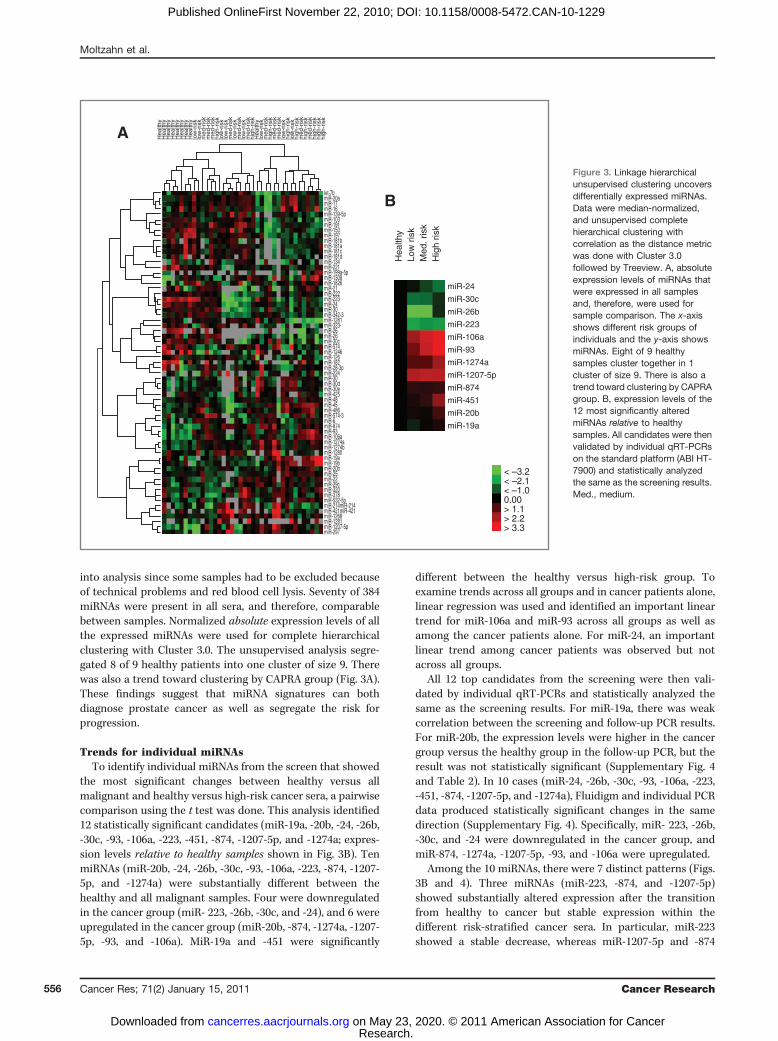
into analysis since some samples had to be excluded becauseof technical problems and red blood cell lysis. Seventy of 384miRNAs were present in all sera, and therefore, comparablebetween samples. Normalized absolute expression levels of allthe expressed miRNAs were used for complete hierarchicalclustering with Cluster 3.0. The unsupervised analysis segre-gated 8 of 9 healthy patients into one cluster of size 9. Therewas also a trend toward clustering by CAPRA group (Fig. 3A).These findings suggest that miRNA signatures can bothdiagnose prostate cancer as well as segregate the risk forprogression.
Trends for individual miRNAsTo identify individual miRNAs from the screen that showed
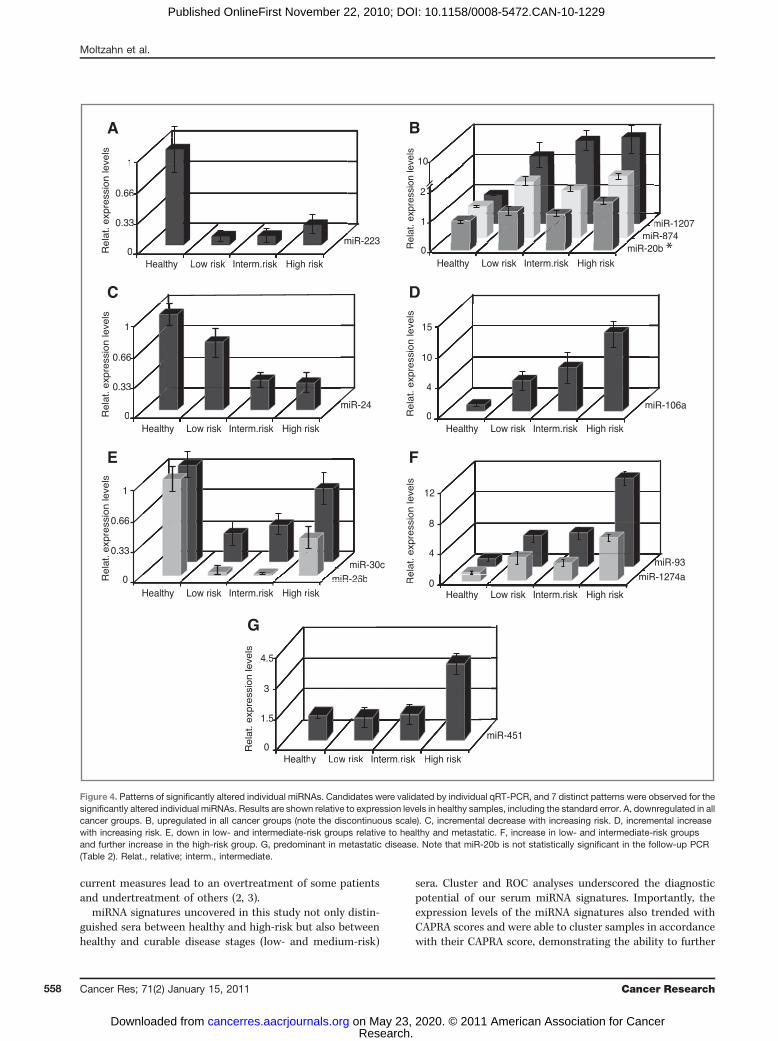
the most significant changes between healthy versus allmalignant and healthy versus high-risk cancer sera, a pairwisecomparison using the t test was done. This analysis identified12 statistically significant candidates (miR-19a, -20b, -24, -26b,-30c, -93, -106a, -223, -451, -874, -1207-5p, and -1274a; expres-sion levels relative to healthy samples shown in Fig. 3B). TenmiRNAs (miR-20b, -24, -26b, -30c, -93, -106a, -223, -874, -1207-5p, and -1274a) were substantially different between thehealthy and all malignant samples. Four were downregulatedin the cancer group (miR- 223, -26b, -30c, and -24), and 6 wereupregulated in the cancer group (miR-20b, -874, -1274a, -1207-5p, -93, and -106a). MiR-19a and -451 were significantly
different between the healthy versus high-risk group. Toexamine trends across all groups and in cancer patients alone,linear regression was used and identified an important lineartrend for miR-106a and miR-93 across all groups as well asamong the cancer patients alone. For miR-24, an importantlinear trend among cancer patients was observed but notacross all groups.
All 12 top candidates from the screening were then vali-dated by individual qRT-PCRs and statistically analyzed thesame as the screening results. For miR-19a, there was weakcorrelation between the screening and follow-up PCR results.For miR-20b, the expression levels were higher in the cancergroup versus the healthy group in the follow-up PCR, but theresult was not statistically significant (Supplementary Fig. 4and Table 2). In 10 cases (miR-24, -26b, -30c, -93, -106a, -223,-451, -874, -1207-5p, and -1274a), Fluidigm and individual PCRdata produced statistically significant changes in the samedirection (Supplementary Fig. 4). Specifically, miR- 223, -26b,-30c, and -24 were downregulated in the cancer group, andmiR-874, -1274a, -1207-5p, -93, and -106a were upregulated.
Among the 10 miRNAs, there were 7 distinct patterns (Figs.3B and 4). Three miRNAs (miR-223, -874, and -1207-5p)showed substantially altered expression after the transitionfrom healthy to cancer but stable expression within thedifferent risk-stratified cancer sera. In particular, miR-223showed a stable decrease, whereas miR-1207-5p and -874
B
miR-24
miR-30c
miR-26b
miR-223
miR-106a
miR-93
miR-1274a
miR-1207-5p
miR-874
miR-451
miR-20b
miR-19a
< –3.2 < –2.1 < –1.0 0.00 > 1.1 > 2.2 > 3.3
A
Hea
lthy
Low
ris
k M
ed. r
isk
Hig
h ris
k
Hea
lthy
Hea
lthy
Hea
lthy
Hea
lthy
Hea
lthy
Hea
lthy
Hea
lthy
Hea
lthy
low
-ris
k lo
w-r
isk
med
-ris
k m
ed-r
isk
med
-ris
k h
igh-
risk
low
-ris
k lo
w-r
isk
med
-ris
k lo
w-r
isk
med
-ris
k lo
w-r
isk
med
-ris
k h
igh-
risk
Hea
lthy
low
-ris
k m
ed-r
isk
hig
h-ris
k m
ed-r
isk
med
-ris
k lo
w-r
isk
hig
h-ris
k lo
w-r
isk
hig
h-ris
k m
ed-r
isk
hig
h-ris
k m
ed-r
isk
hig
h-ris
k h
igh-
risk
hig
h-ris
k
let-7b miR-20a miR-17 miR-16 miR-139-5p miR-103 miR-191 miR-150 miR-197 miR-181b miR-181a miR-181c miR-181d miR-134 miR-221 miR-199a-5p miR-1308 miR-1826 miR-21 miR-222 miR-223 miR-24 miR-30 miR-342-3 miR-1281 miR-323- miR-26 miR-26 miR-30c miR-574 miR-1246 miR-126 miR-182 miR-28-3p miR-224 miR-30 miR-30d miR-30e miR-425 miR-48 miR-45 miR-486 miR-574-3 miR-6 miR-874 miR-93 miR-106a miR-1274a miR-1274b miR-1280 miR-19a miR-19b miR-20b miR-25 miR-22 miR-29c miR-320 miR-378 miR-532-5p miR-214miR-214 miR-421miR-421 miR-1268 miR-1281 miR-1207-5p miR-297
Figure 3. Linkage hierarchicalunsupervised clustering uncoversdifferentially expressed miRNAs.Data were median-normalized,and unsupervised completehierarchical clustering withcorrelation as the distance metricwas done with Cluster 3.0followed by Treeview. A, absoluteexpression levels of miRNAs thatwere expressed in all samplesand, therefore, were used forsample comparison. The x-axisshows different risk groups ofindividuals and the y-axis showsmiRNAs. Eight of 9 healthysamples cluster together in 1cluster of size 9. There is also atrend toward clustering by CAPRAgroup. B, expression levels of the12 most significantly alteredmiRNAs relative to healthysamples. All candidates were thenvalidated by individual qRT-PCRson the standard platform (ABI HT-7900) and statistically analyzedthe same as the screening results.Med., medium.
Moltzahn et al.
Cancer Res; 71(2) January 15, 2011 Cancer Research556
Research. on May 23, 2020. © 2011 American Association for Cancercancerres.aacrjournals.org Downloaded from
Published OnlineFirst November 22, 2010; DOI: 10.1158/0008-5472.CAN-10-1229
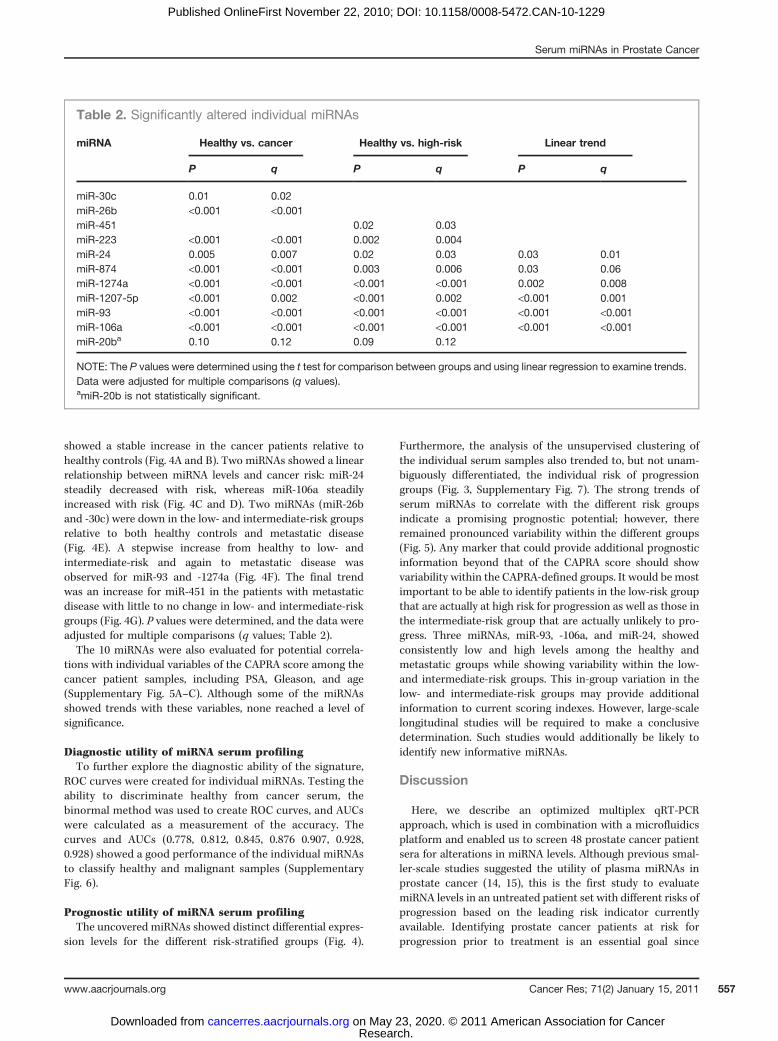
showed a stable increase in the cancer patients relative tohealthy controls (Fig. 4A and B). Two miRNAs showed a linearrelationship between miRNA levels and cancer risk: miR-24steadily decreased with risk, whereas miR-106a steadilyincreased with risk (Fig. 4C and D). Two miRNAs (miR-26band -30c) were down in the low- and intermediate-risk groupsrelative to both healthy controls and metastatic disease(Fig. 4E). A stepwise increase from healthy to low- andintermediate-risk and again to metastatic disease wasobserved for miR-93 and -1274a (Fig. 4F). The final trendwas an increase for miR-451 in the patients with metastaticdisease with little to no change in low- and intermediate-riskgroups (Fig. 4G). P values were determined, and the data wereadjusted for multiple comparisons (q values; Table 2).The 10 miRNAs were also evaluated for potential correla-
tions with individual variables of the CAPRA score among thecancer patient samples, including PSA, Gleason, and age(Supplementary Fig. 5A–C). Although some of the miRNAsshowed trends with these variables, none reached a level ofsignificance.
Diagnostic utility of miRNA serum profilingTo further explore the diagnostic ability of the signature,
ROC curves were created for individual miRNAs. Testing theability to discriminate healthy from cancer serum, thebinormal method was used to create ROC curves, and AUCswere calculated as a measurement of the accuracy. Thecurves and AUCs (0.778, 0.812, 0.845, 0.876 0.907, 0.928,0.928) showed a good performance of the individual miRNAsto classify healthy and malignant samples (SupplementaryFig. 6).
Prognostic utility of miRNA serum profilingThe uncovered miRNAs showed distinct differential expres-
sion levels for the different risk-stratified groups (Fig. 4).
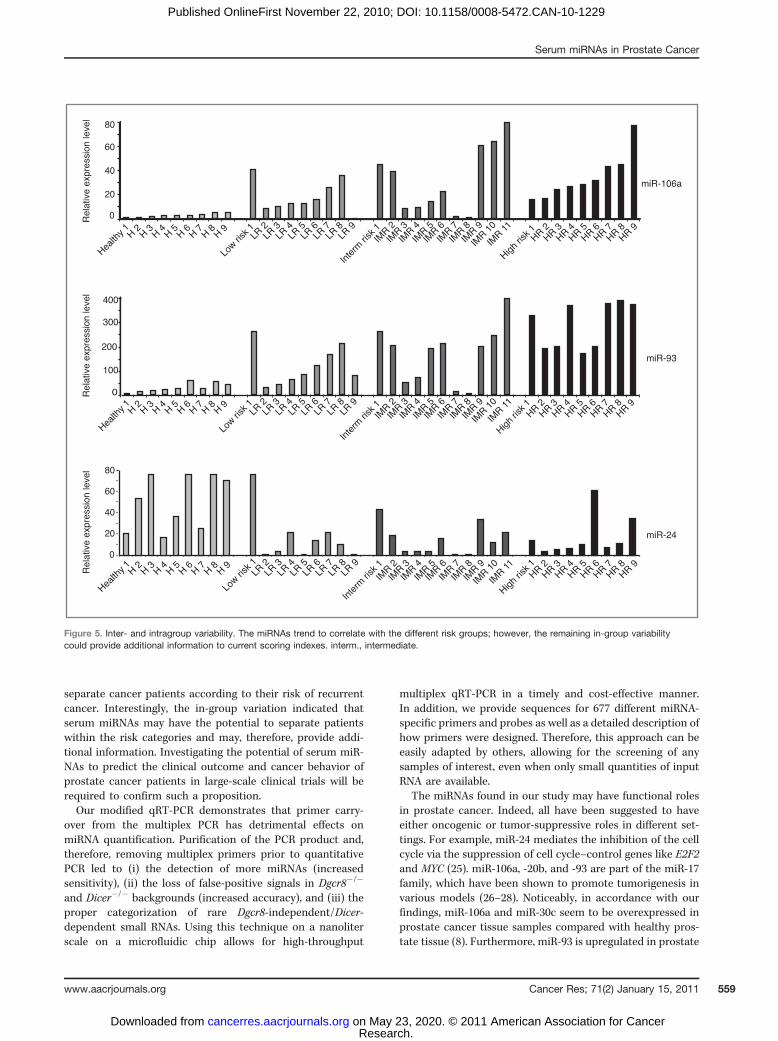
Furthermore, the analysis of the unsupervised clustering ofthe individual serum samples also trended to, but not unam-biguously differentiated, the individual risk of progressiongroups (Fig. 3, Supplementary Fig. 7). The strong trends ofserum miRNAs to correlate with the different risk groupsindicate a promising prognostic potential; however, thereremained pronounced variability within the different groups(Fig. 5). Any marker that could provide additional prognosticinformation beyond that of the CAPRA score should showvariability within the CAPRA-defined groups. It would be mostimportant to be able to identify patients in the low-risk groupthat are actually at high risk for progression as well as those inthe intermediate-risk group that are actually unlikely to pro-gress. Three miRNAs, miR-93, -106a, and miR-24, showedconsistently low and high levels among the healthy andmetastatic groups while showing variability within the low-and intermediate-risk groups. This in-group variation in thelow- and intermediate-risk groups may provide additionalinformation to current scoring indexes. However, large-scalelongitudinal studies will be required to make a conclusivedetermination. Such studies would additionally be likely toidentify new informative miRNAs.
Discussion
Here, we describe an optimized multiplex qRT-PCRapproach, which is used in combination with a microfluidicsplatform and enabled us to screen 48 prostate cancer patientsera for alterations in miRNA levels. Although previous smal-ler-scale studies suggested the utility of plasma miRNAs inprostate cancer (14, 15), this is the first study to evaluatemiRNA levels in an untreated patient set with different risks ofprogression based on the leading risk indicator currentlyavailable. Identifying prostate cancer patients at risk forprogression prior to treatment is an essential goal since
Table 2. Significantly altered individual miRNAs
miRNA Healthy vs. cancer Healthy vs. high-risk Linear trend
P q P q P q
miR-30c 0.01 0.02miR-26b <0.001 <0.001miR-451 0.02 0.03miR-223 <0.001 <0.001 0.002 0.004miR-24 0.005 0.007 0.02 0.03 0.03 0.01miR-874 <0.001 <0.001 0.003 0.006 0.03 0.06miR-1274a <0.001 <0.001 <0.001 <0.001 0.002 0.008miR-1207-5p <0.001 0.002 <0.001 0.002 <0.001 0.001miR-93 <0.001 <0.001 <0.001 <0.001 <0.001 <0.001miR-106a <0.001 <0.001 <0.001 <0.001 <0.001 <0.001miR-20ba 0.10 0.12 0.09 0.12
NOTE: The P values were determined using the t test for comparison between groups and using linear regression to examine trends.Data were adjusted for multiple comparisons (q values).amiR-20b is not statistically significant.
Serum miRNAs in Prostate Cancer
www.aacrjournals.org Cancer Res; 71(2) January 15, 2011 557
Research. on May 23, 2020. © 2011 American Association for Cancercancerres.aacrjournals.org Downloaded from
Published OnlineFirst November 22, 2010; DOI: 10.1158/0008-5472.CAN-10-1229
current measures lead to an overtreatment of some patientsand undertreatment of others (2, 3).
miRNA signatures uncovered in this study not only distin-guished sera between healthy and high-risk but also betweenhealthy and curable disease stages (low- and medium-risk)
sera. Cluster and ROC analyses underscored the diagnosticpotential of our serum miRNA signatures. Importantly, theexpression levels of the miRNA signatures also trended withCAPRA scores and were able to cluster samples in accordancewith their CAPRA score, demonstrating the ability to further
C
0
0.33
0.66
1
miR-24
Re
lat.
exp
ress
ion
leve
ls
0
33
66
1
E
0
0.33
0.66
1
miR-26bmiR-30c
Re
lat.
exp
ress
ion
leve
ls
mi
0
4
8
12
miR-93
F
Re
lat.
exp
ress
ion
leve
ls
miR-1274a
m
miR-
D
0
4
10
15
miR-106aR
ela
t. e
xpre
ssio
n le
vels
0
5
m
A
0
0.33
0.66
1
miR-223
Healthy Low risk Interm.risk High risk
Healthy Low risk Interm.risk High risk
Healthy Low risk Interm.risk High risk
Healthy Low risk Interm.risk High risk
Healthy Low risk Interm.risk High risk
Healthy Low risk Interm.risk High risk
Healthy Low risk Interm.risk High risk
Re
lat.
exp
ress
ion
leve
ls
0
3
6
1
m
Healthy Low risk Interm risk High risk
0
1.5
3
4.5
miR-451
G
Re
lat.
exp
ress
ion
leve
ls
Healthy Low risk Interm.risk High risk
miR-26bmiR-26 0Re
k High risk Healthy
55
55
m
B
Rel
at. e
xpre
ssio
n le
vels
miR-874miR-20b
miR-1207
0
1
2
10
R-8R-20b
miRmiR
m
miR *
Figure 4. Patterns of significantly altered individual miRNAs. Candidates were validated by individual qRT-PCR, and 7 distinct patterns were observed for thesignificantly altered individual miRNAs. Results are shown relative to expression levels in healthy samples, including the standard error. A, downregulated in allcancer groups. B, upregulated in all cancer groups (note the discontinuous scale). C, incremental decrease with increasing risk. D, incremental increasewith increasing risk. E, down in low- and intermediate-risk groups relative to healthy and metastatic. F, increase in low- and intermediate-risk groupsand further increase in the high-risk group. G, predominant in metastatic disease. Note that miR-20b is not statistically significant in the follow-up PCR(Table 2). Relat., relative; interm., intermediate.
Moltzahn et al.
Cancer Res; 71(2) January 15, 2011 Cancer Research558
Research. on May 23, 2020. © 2011 American Association for Cancercancerres.aacrjournals.org Downloaded from
Published OnlineFirst November 22, 2010; DOI: 10.1158/0008-5472.CAN-10-1229
separate cancer patients according to their risk of recurrentcancer. Interestingly, the in-group variation indicated thatserum miRNAs may have the potential to separate patientswithin the risk categories and may, therefore, provide addi-tional information. Investigating the potential of serum miR-NAs to predict the clinical outcome and cancer behavior ofprostate cancer patients in large-scale clinical trials will berequired to confirm such a proposition.Our modified qRT-PCR demonstrates that primer carry-
over from the multiplex PCR has detrimental effects onmiRNA quantification. Purification of the PCR product and,therefore, removing multiplex primers prior to quantitativePCR led to (i) the detection of more miRNAs (increasedsensitivity), (ii) the loss of false-positive signals in Dgcr8�/�
and Dicer�/� backgrounds (increased accuracy), and (iii) theproper categorization of rare Dgcr8-independent/Dicer-dependent small RNAs. Using this technique on a nanoliterscale on a microfluidic chip allows for high-throughput
multiplex qRT-PCR in a timely and cost-effective manner.In addition, we provide sequences for 677 different miRNA-specific primers and probes as well as a detailed description ofhow primers were designed. Therefore, this approach can beeasily adapted by others, allowing for the screening of anysamples of interest, even when only small quantities of inputRNA are available.
The miRNAs found in our study may have functional rolesin prostate cancer. Indeed, all have been suggested to haveeither oncogenic or tumor-suppressive roles in different set-tings. For example, miR-24 mediates the inhibition of the cellcycle via the suppression of cell cycle–control genes like E2F2and MYC (25). miR-106a, -20b, and -93 are part of the miR-17family, which have been shown to promote tumorigenesis invarious models (26–28). Noticeably, in accordance with ourfindings, miR-106a and miR-30c seem to be overexpressed inprostate cancer tissue samples compared with healthy pros-tate tissue (8). Furthermore, miR-93 is upregulated in prostate
miR-24
Rel
ativ
e ex
pres
sion
leve
l
Health
y 1 H 2 H 3 H 4 H 5 H 7H 6 H 8 H 9
Low ri
sk 1LR
2LR
8LR
7LR
9LR
6LR
3LR
5LR
4
High ri
sk 1HR 2
HR 8HR 7
HR 9HR 6
HR 3HR 5
HR 4
miR-106a
Health
y 1 H 2 H 3 H 4 H 5 H 7H 6 H 8 H 9
Low ri
sk 1LR
2LR
8LR
7LR
9LR
6LR
3LR
5LR
4
High ri
sk 1HR 2
HR 8HR 7
HR 9HR 6
HR 3HR 5
HR 4
Inte
rm ri
sk 1IM
R 2
IMR 8
IMR 7
IMR 9
IMR 6
IMR 3
IMR 5
IMR 4
IMR 11
IMR 1
0
20
80
0
40
60
Rel
ativ
e ex
pres
sion
leve
l
miR-93
Health
y 1 H 2 H 3 H 4 H 5 H 7H 6 H 8 H 9
Low ri
sk 1
LR 2
LR 8
LR 7
LR 9
LR 6
LR 3
LR 5
LR 4
High ri
sk 1HR 2
HR 8HR 7
HR 9HR 6
HR 3HR 5
HR 4
Rel
ativ
e ex
pres
sion
leve
l
0
100
300
400
200
80
20
0
40
60
Inte
rm ri
sk 1IM
R 2
IMR 8
IMR 7
IMR 9
IMR 6
IMR 3
IMR 5
IMR 4
IMR 11
IMR 1
0
Inte
rm ri
sk 1
IMR 2
IMR 8
IMR 7
IMR 9
IMR 6
IMR 3
IMR 5
IMR 4
IMR 11
IMR 1
0
Figure 5. Inter- and intragroup variability. The miRNAs trend to correlate with the different risk groups; however, the remaining in-group variabilitycould provide additional information to current scoring indexes. interm., intermediate.
Serum miRNAs in Prostate Cancer
www.aacrjournals.org Cancer Res; 71(2) January 15, 2011 559
Research. on May 23, 2020. © 2011 American Association for Cancercancerres.aacrjournals.org Downloaded from
Published OnlineFirst November 22, 2010; DOI: 10.1158/0008-5472.CAN-10-1229
cancer tissue along with its host geneMCM7 (29, 30). Based onthese associations, it will be important to determine the cellsource and function of the miRNAs that we find elevated anddepressed in the sera of prostate cancer patients of differentrisk for progression.
Disclosure of Potential Conflicts of Interest
No potential conflicts of interests were disclosed.
Acknowledgments
We thank the members of the Blelloch lab for critical reading; June Chan forhelp with patient samples and clinical data; Nathan Hunkapillar for advice on
preparing RNA from serum; Mark Ansel for suggestions with alternativepurification; and Alain Mir, Caroline Dando, and Griffen Lauer from Fluidigmfor providing technical assistance and machine access.
Grant Support
NIH/National Institutes of Neurologic Disease (K08 NS48118 and R01NS057221), California Institute of Regenerative Medicine (New Faculty AwardRN2-00906), and the Pew Charitable Trust (R. Blelloch). Cancer Center Supportgrant P30 CA82103 NIH-NCI (A.B. Olshen) and theWissenschaftlich UrologischeGesellschaft eV (F. Moltzahn).
The costs of publication of this article were defrayed in part by the paymentof page charges. This article must therefore be hereby marked advertisement inaccordance with 18 U.S.C. Section 1734 solely to indicate this fact.
Received April 9, 2010; revised November 8, 2010; accepted November 15,2010; published OnlineFirst November 22, 2010.
References1. van Leeuwen PJ, van Vugt HA, Bangma CH. The implementation of
screening for prostate cancer. Prostate Cancer Prostatic Dis 2010;13:218–27.
2. Schroder FH, Hugosson J, RoobolMJ, Tammela TL, Ciatto S, Nelen V,et al. Screening and prostate-cancer mortality in a randomized Eur-opean study. N Engl J Med 2009;360:1320–8.
3. Andriole GL, Crawford ED, Grubb RL III, Buys SS, Chia D, Church TR,et al. Mortality results from a randomized prostate-cancer screeningtrial. N Engl J Med 2009;360:1310–9.
4. Chen X, Ba Y, Ma L, Cai X, Yin Y, Wang K, et al. Characterization ofmicroRNAs in serum: a novel class of biomarkers for diagnosis ofcancer and other diseases. Cell Res 2008;18:997–1006.
5. Wang Y, Medvid R, Melton C, Jaenisch R, Blelloch R. DGCR8 isessential for microRNA biogenesis and silencing of embryonic stemcell self-renewal. Nat Genet 2007;39:380–5.
6. Hornstein E, Shomron N. Canalization of development by microRNAs.Nat Genet 2006;38Suppl:S20–4.
7. Kanellopoulou C, Muljo SA, Kung AL, Ganesan S, Drapkin R, Jenu-wein T, et al. Dicer-deficientmouse embryonic stem cells are defectivein differentiation and centromeric silencing. Genes Dev 2005;19:489–501.
8. Ambs S, Prueitt RL, Yi M, Hudson RS, Howe TM, Petrocca F, et al.Genomic profiling of microRNA and messenger RNA reveals deregu-lated microRNA expression in prostate cancer. Cancer Res2008;68:6162–70.
9. Ozen M, Creighton CJ, Ozdemir M, Ittmann M. Widespread dereg-ulation of microRNA expression in human prostate cancer. Oncogene2008;27:1788–93.
10. Porkka KP, Pfeiffer MJ, Waltering KK, Vessella RL, Tammela TL,Visakorpi T. MicroRNA expression profiling in prostate cancer. CancerRes 2007;67:6130–5.
11. Volinia S, Calin GA, Liu CG, Ambs S, Cimmino A, Petrocca F, et al. AmicroRNA expression signature of human solid tumors defines cancergene targets. Proc Natl Acad Sci U S A 2006;103:2257–61.
12. Schaefer A, Jung M, Kristiansen G, Lein M, Schrader M, Miller K, et al.MicroRNAs and cancer: current state and future perspectives inurologic oncology. Urol Oncol 2009;28:4–13.
13. Schaefer A, JungM, Mollenkopf HJ, Wagner I, Stephan C, Jentzmik F,et al. Diagnostic and prognostic implications of microRNA profiling inprostate carcinoma. Int J Cancer 2009;126:1166–76.
14. Mitchell PS, Parkin RK, Kroh EM, Fritz BR, Wyman SK, Pogosova-Agadjanyan EL, et al. Circulating microRNAs as stable blood-basedmarkers for cancer detection. Proc Natl Acad Sci U S A 2008;105:10513–8.
15. Lodes MJ, Caraballo M, Suciu D, Munro S, Kumar A, Anderson B.Detection of cancer with serum miRNAs on an oligonucleotide micro-array. PLoS One 2009;4:e6229.
16. Babiarz JE, Ruby JG, Wang Y, Bartel DP, Blelloch R. Mouse ES cellsexpress endogenous shRNAs, siRNAs, and other Microprocessor-independent, Dicer-dependent small RNAs. Genes Dev 2008;22:2773–85.
17. Cooperberg MR, Broering JM, Carroll PR. Risk assessment for pros-tate cancer metastasis and mortality at the time of diagnosis. J NatlCancer Inst 2009;101:878–87.
18. Tang F, Hajkova P, Barton SC, Lao K, Surani MA. MicroRNA expres-sion profiling of single whole embryonic stem cells. Nucleic Acids Res2006;34:e9.
19. miRBase [Internet]. Manchester (UK): University of Manchester andthe Wellcome Trust Sanger Institute. [cited 2010 May 10]. Availablefrom: http://www.mirbase.org/.
20. Griffiths-Jones S, Saini HK, van Dongen S, Enright AJ. miRBase: toolsfor microRNA genomics. Nucleic Acids Res 2008;36:D154–8.
21. Benjamini Y, Hochberg Y. Controlling the false discovery rate: apractical and powerful approach to multiple testing. J R Stat SocSer B (Methodol) 1995;57:289–300.
22. jrocfit.org. [Internet]. Baltimore, MD: Johns Hopkins University[cited2010 Jul 9]. Available from: http://www.jrocfit.org/.
23. Chen C, Ridzon DA, Broomer AJ, Zhou Z, Lee DH, Nguyen JT, et al.Real-time quantification of microRNAs by stem-loop RT-PCR. NucleicAcids Res 2005;33:e179.
24. Thomson JM, Parker J, Perou CM, Hammond SM. A custom micro-array platform for analysis of microRNA gene expression. Nat Meth-ods 2004;1:47–53.
25. Lal A, Navarro F, Maher CA, Maliszewski LE, Yan N, O'Day E, et al.miR-24 Inhibits cell proliferation by targeting E2F2, MYC, and othercell-cycle genes via binding to "seedless" 30UTR microRNA recogni-tion elements. Mol Cell 2009;35:610–25.
26. Guo J, Miao Y, Xiao B, Huan R, Jiang Z, Meng D, et al. Differentialexpression of microRNA species in human gastric cancer versus non-tumorous tissues. J Gastroenterol Hepatol 2009;24:652–7.
27. Matsubara H, Takeuchi T, Nishikawa E, Yanagisawa K, Hayashita Y,Ebi H, et al. Apoptosis induction by antisense oligonucleotides againstmiR-17-5p and miR-20a in lung cancers overexpressing miR-17-92.Oncogene 2007;26:6099–105.
28. Ventura A, Young AG, Winslow MM, Lintault L, Meissner A, ErkelandSJ, et al. Targeted deletion reveals essential and overlapping func-tions of the miR-17 through 92 family of miRNA clusters. Cell2008;132:875–86.
29. Petrocca F, Visone R, Onelli MR, ShahMH, NicolosoMS, de Martino I,etal.E2F1-regulatedmicroRNAs impairTGFbeta-dependentcell-cyclearrest and apoptosis in gastric cancer. Cancer Cell 2008;13:272–86.
30. Ren B, Yu G, Tseng GC, Cieply K, Gavel T, Nelson J, et al. MCM7amplification and overexpression are associated with prostate cancerprogression. Oncogene 2006;25:1090–8.
Moltzahn et al.
Cancer Res; 71(2) January 15, 2011 Cancer Research560
Research. on May 23, 2020. © 2011 American Association for Cancercancerres.aacrjournals.org Downloaded from
Published OnlineFirst November 22, 2010; DOI: 10.1158/0008-5472.CAN-10-1229
2011;71:550-560. Published OnlineFirst November 22, 2010.Cancer Res Felix Moltzahn, Adam B. Olshen, Lauren Baehner, et al. Cancer Patientsand Prognostic microRNA Signatures in the Sera of Prostate Microfluidic-Based Multiplex qRT-PCR Identifies Diagnostic
Updated version
10.1158/0008-5472.CAN-10-1229doi:
Access the most recent version of this article at:
Material
Supplementary
http://cancerres.aacrjournals.org/content/suppl/2010/11/22/0008-5472.CAN-10-1229.DC1
Access the most recent supplemental material at:
Cited articles
http://cancerres.aacrjournals.org/content/71/2/550.full#ref-list-1
This article cites 28 articles, 6 of which you can access for free at:
Citing articles
http://cancerres.aacrjournals.org/content/71/2/550.full#related-urls
This article has been cited by 13 HighWire-hosted articles. Access the articles at:
E-mail alerts related to this article or journal.Sign up to receive free email-alerts
SubscriptionsReprints and
To order reprints of this article or to subscribe to the journal, contact the AACR Publications
Permissions
Rightslink site. (CCC)Click on "Request Permissions" which will take you to the Copyright Clearance Center's
.http://cancerres.aacrjournals.org/content/71/2/550To request permission to re-use all or part of this article, use this link
Research. on May 23, 2020. © 2011 American Association for Cancercancerres.aacrjournals.org Downloaded from
Published OnlineFirst November 22, 2010; DOI: 10.1158/0008-5472.CAN-10-1229
Top Related