


Languages
Pages
Legal


Microbial Cell Structure and Function
01-20-15
I. Microscopy
• 2.1 Discovering Cell Structure: Light Microscopy
• 2.2 Improving Contrast in Light Microscopy
• 2.3 Imaging Cells in Three Dimensions
• 2.4 Probing Cell Structure: Electron Microscopy
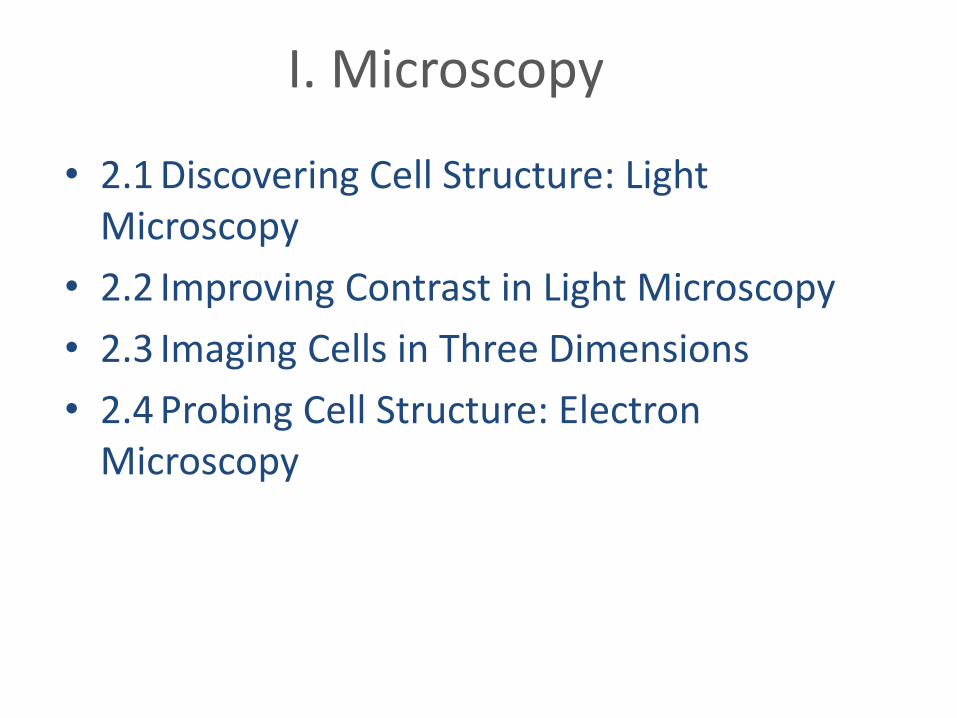
Microbial Size
http://learn.genetics.utah.edu/content/begin/cells/scale/
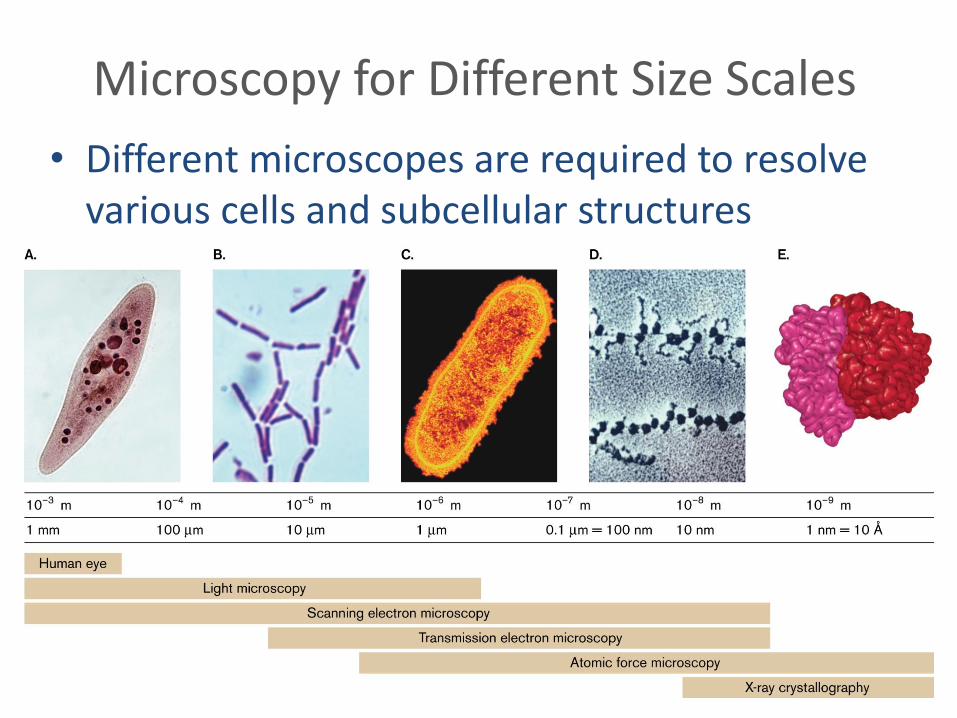
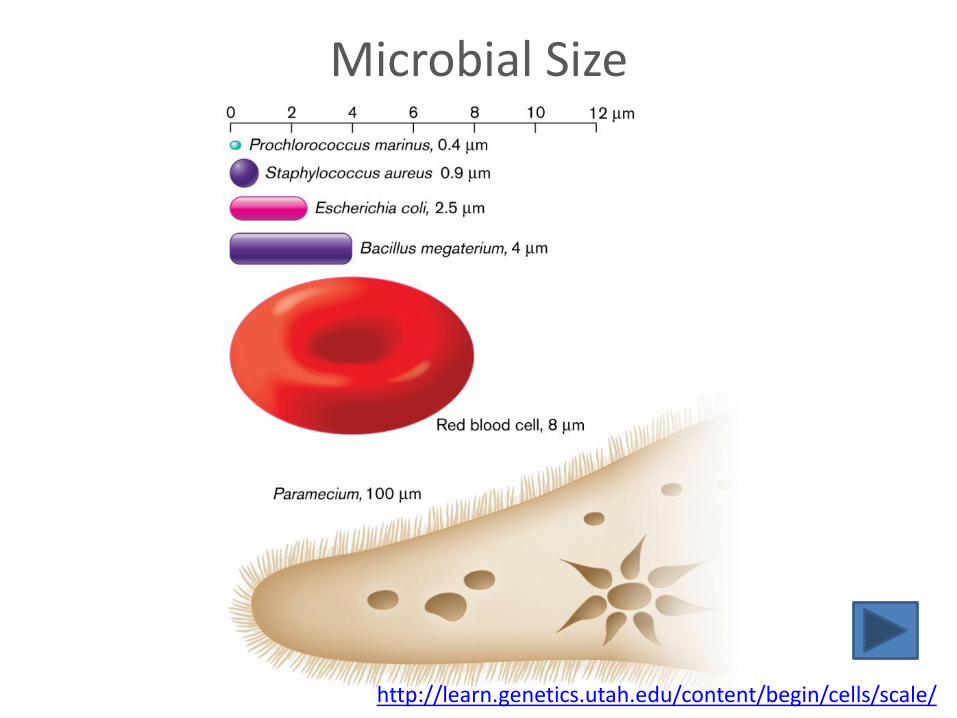
Microscopy for Different Size Scales
• Different microscopes are required to resolve various cells and subcellular structures
2.1 Discovering Cell Structure: Light Microscopy
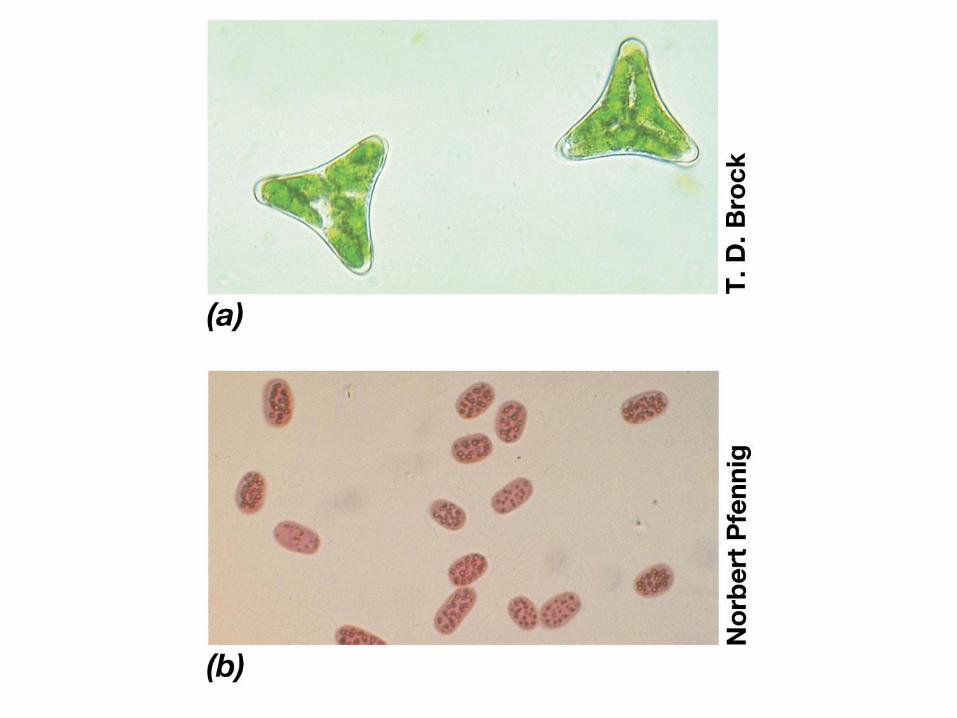
• Compound light microscope uses visible light to illuminate cells
• Many different types of light microscopy:
– Bright-field
– Phase-contrast
– Dark-field
– Fluorescence
Animation: Light Microscopy
2.1 Discovering Cell Structure: Light Microscopy
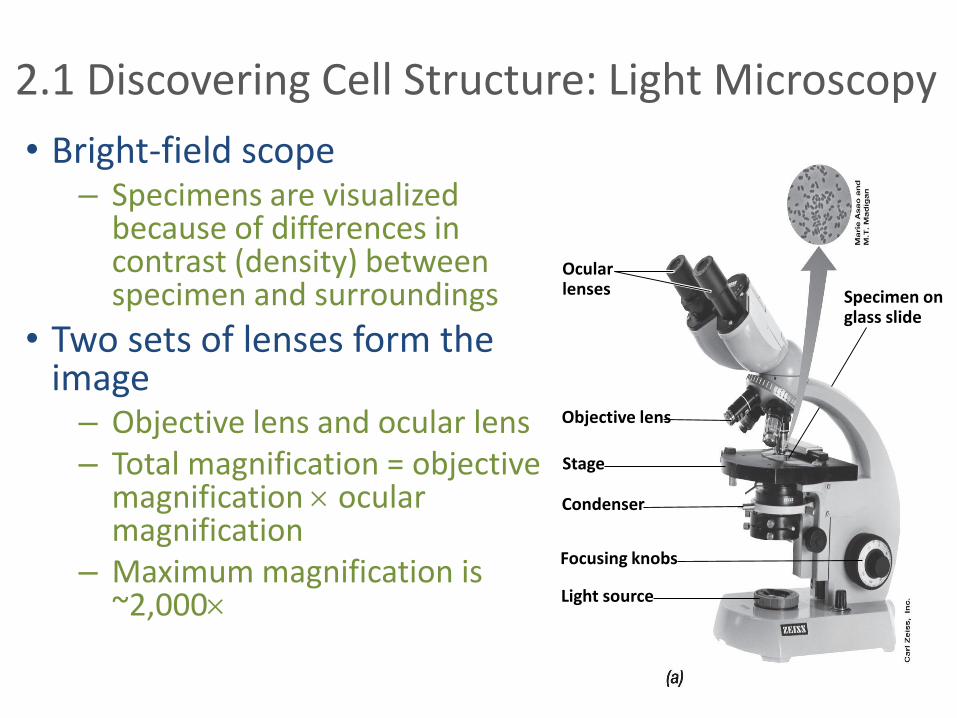
• Bright-field scope– Specimens are visualized
because of differences in contrast (density) between specimen and surroundings
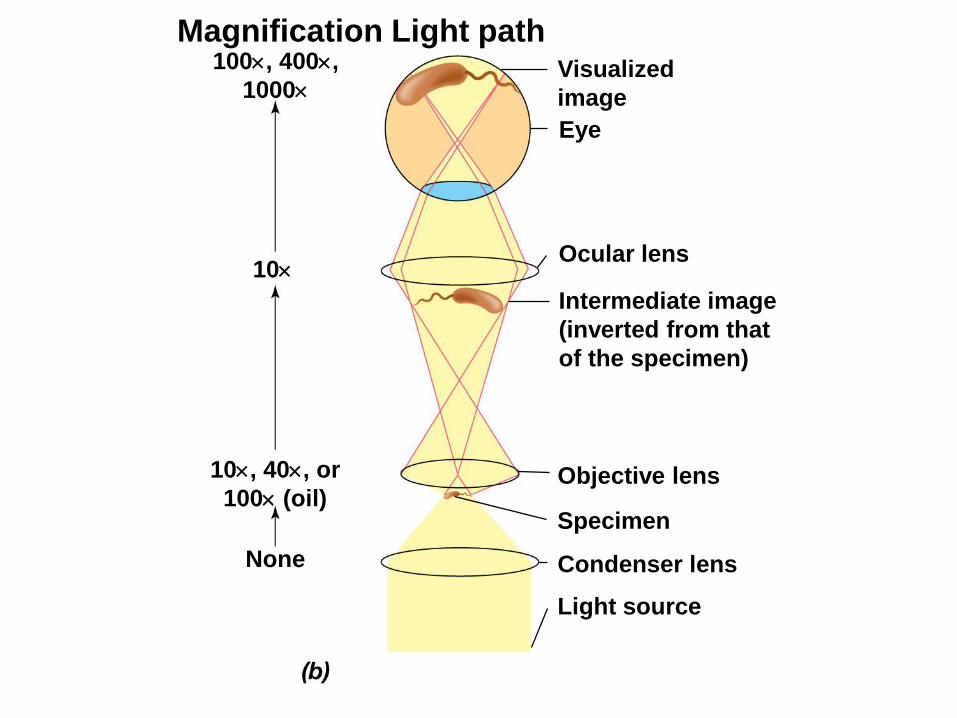
• Two sets of lenses form the image – Objective lens and ocular lens– Total magnification = objective
magnification ocular magnification
– Maximum magnification is ~2,000
Ocularlenses
Objective lens
Stage
Condenser
Focusing knobs
Light source
Specimen onglass slide
Visualized
image
Eye
Ocular lens
Intermediate image
(inverted from that
of the specimen)
Objective lens
Specimen
Condenser lens
Light source
None
100, 400,
1000
10
10, 40, or
100 (oil)
Magnification Light path
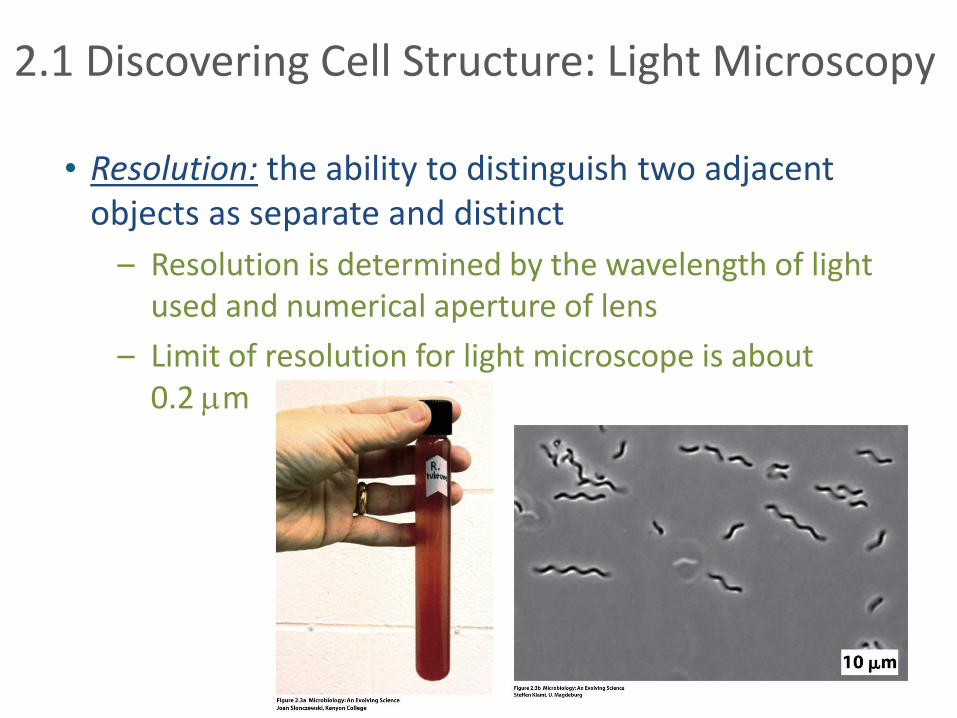
2.1 Discovering Cell Structure: Light Microscopy
• Resolution: the ability to distinguish two adjacent objects as separate and distinct
– Resolution is determined by the wavelength of light used and numerical aperture of lens
– Limit of resolution for light microscope is about 0.2 m
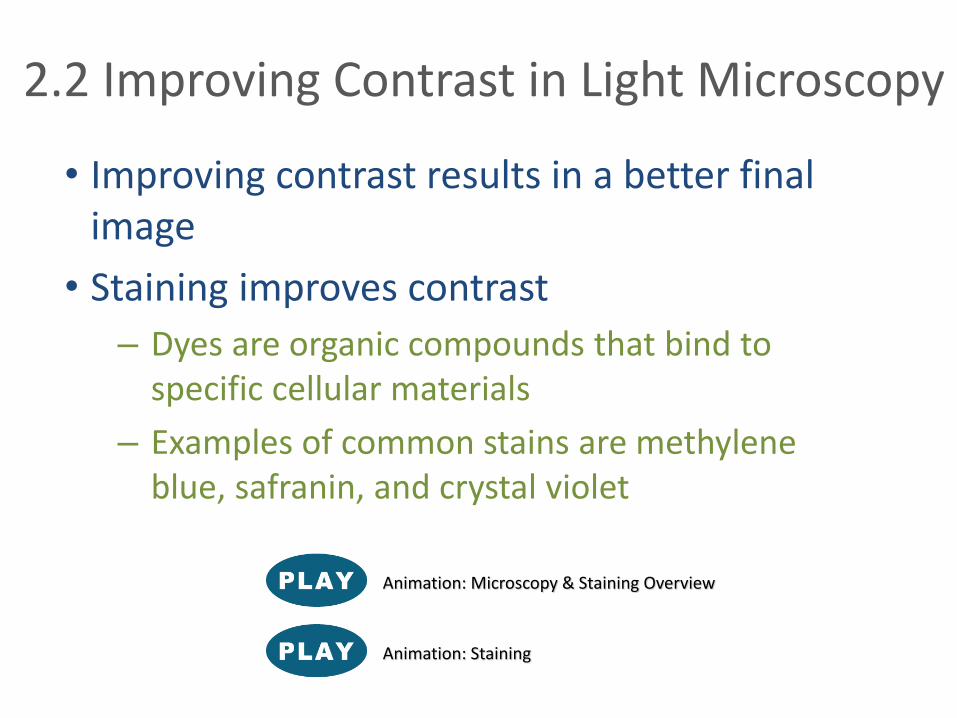
2.2 Improving Contrast in Light Microscopy
• Improving contrast results in a better final image
• Staining improves contrast
– Dyes are organic compounds that bind to specific cellular materials
– Examples of common stains are methylene blue, safranin, and crystal violet
Animation: Staining
Animation: Microscopy & Staining Overview
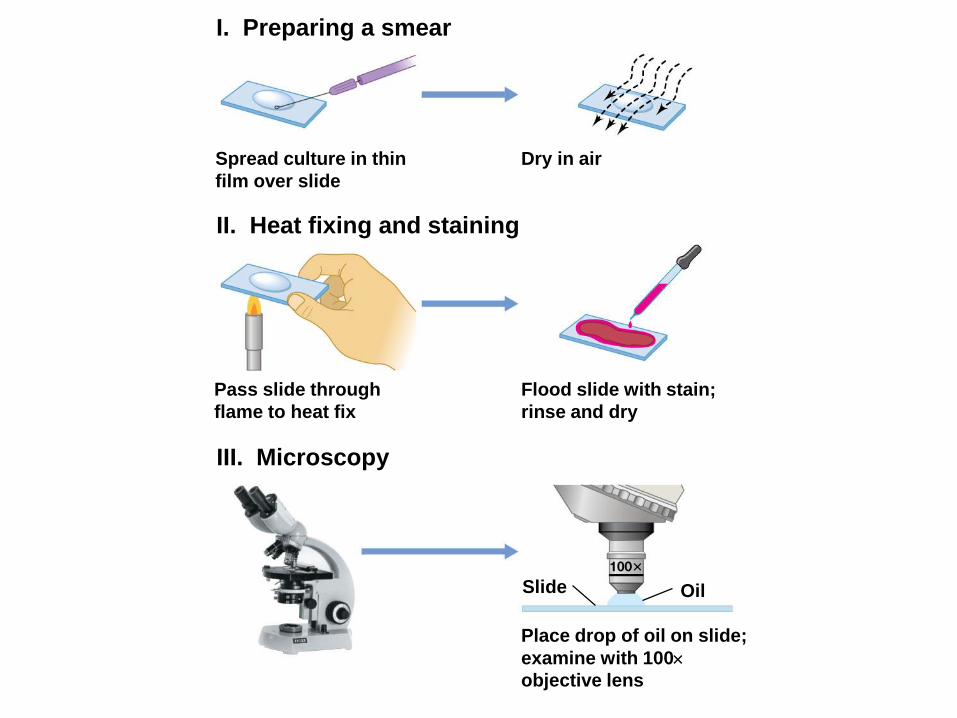
I. Preparing a smear
II. Heat fixing and staining
III. Microscopy
Spread culture in thin
film over slide
Pass slide through
flame to heat fix
Dry in air
Flood slide with stain;
rinse and dry
Place drop of oil on slide;
examine with 100
objective lens
Slide Oil
2.2 Improving Contrast in Light Microscopy
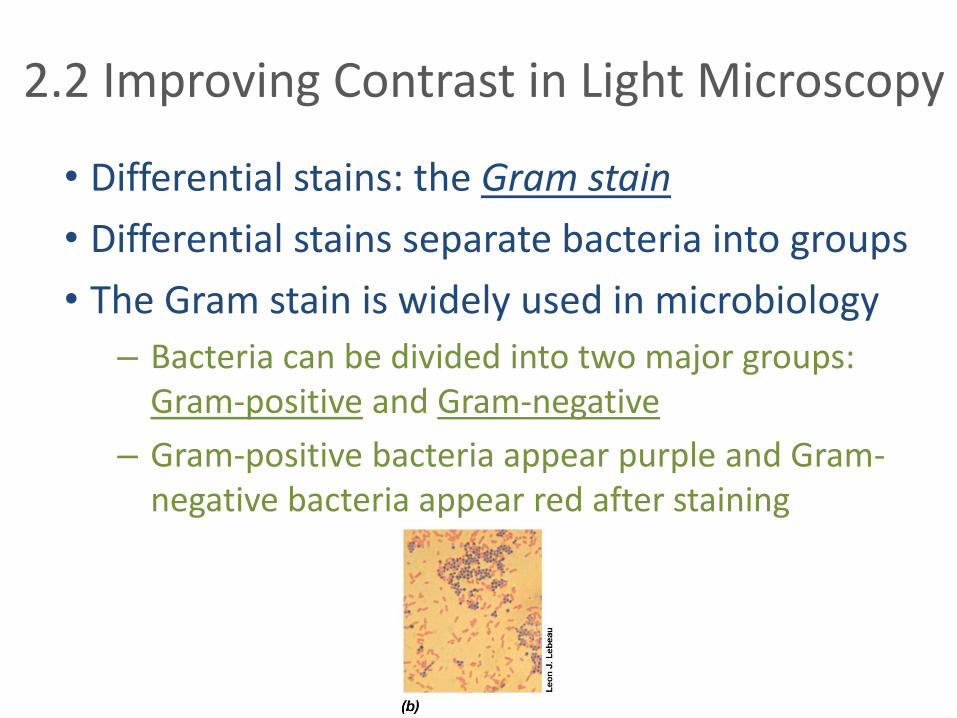
• Differential stains: the Gram stain
• Differential stains separate bacteria into groups
• The Gram stain is widely used in microbiology
– Bacteria can be divided into two major groups: Gram-positive and Gram-negative
– Gram-positive bacteria appear purple and Gram-negative bacteria appear red after staining
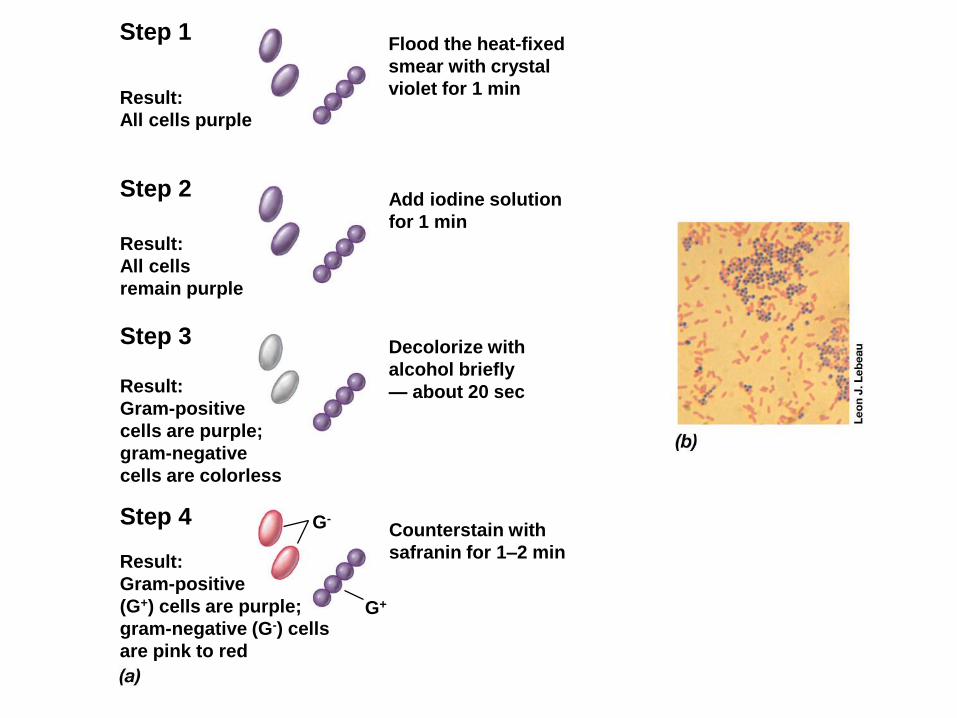
Step 1
Result:
All cells purple
Result:
All cells
remain purple
Result:
Gram-positive
cells are purple;
gram-negative
cells are colorless
Result:
Gram-positive
(G+) cells are purple;
gram-negative (G-) cells
are pink to red
Flood the heat-fixed
smear with crystal
violet for 1 min
Add iodine solution
for 1 min
Decolorize with
alcohol briefly
— about 20 sec
Counterstain with
safranin for 1–2 min
G+
G-
Step 2
Step 3
Step 4
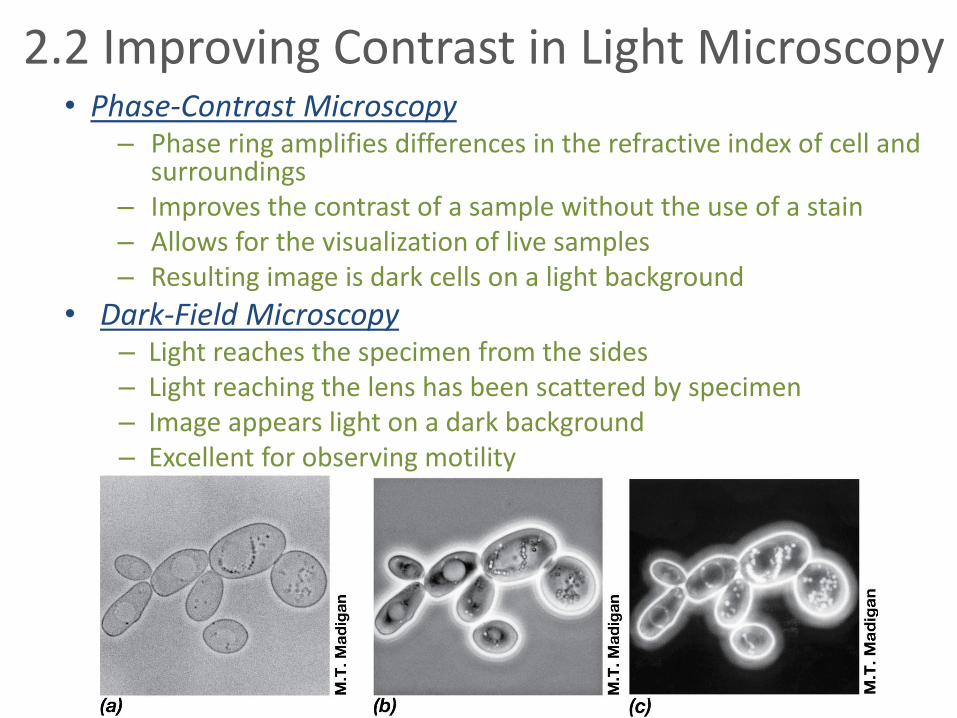
2.2 Improving Contrast in Light Microscopy• Phase-Contrast Microscopy
– Phase ring amplifies differences in the refractive index of cell and surroundings
– Improves the contrast of a sample without the use of a stain– Allows for the visualization of live samples– Resulting image is dark cells on a light background
• Dark-Field Microscopy– Light reaches the specimen from the sides– Light reaching the lens has been scattered by specimen– Image appears light on a dark background – Excellent for observing motility
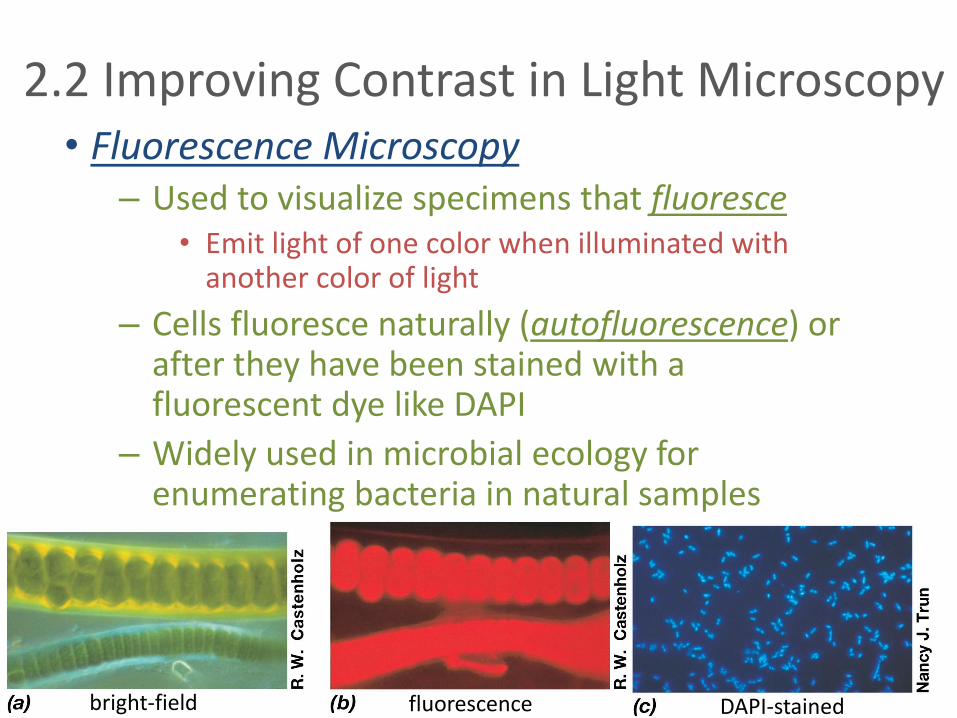
2.2 Improving Contrast in Light Microscopy• Fluorescence Microscopy
– Used to visualize specimens that fluoresce• Emit light of one color when illuminated with
another color of light
– Cells fluoresce naturally (autofluorescence) or after they have been stained with a fluorescent dye like DAPI
– Widely used in microbial ecology for enumerating bacteria in natural samples
bright-field fluorescence DAPI-stained
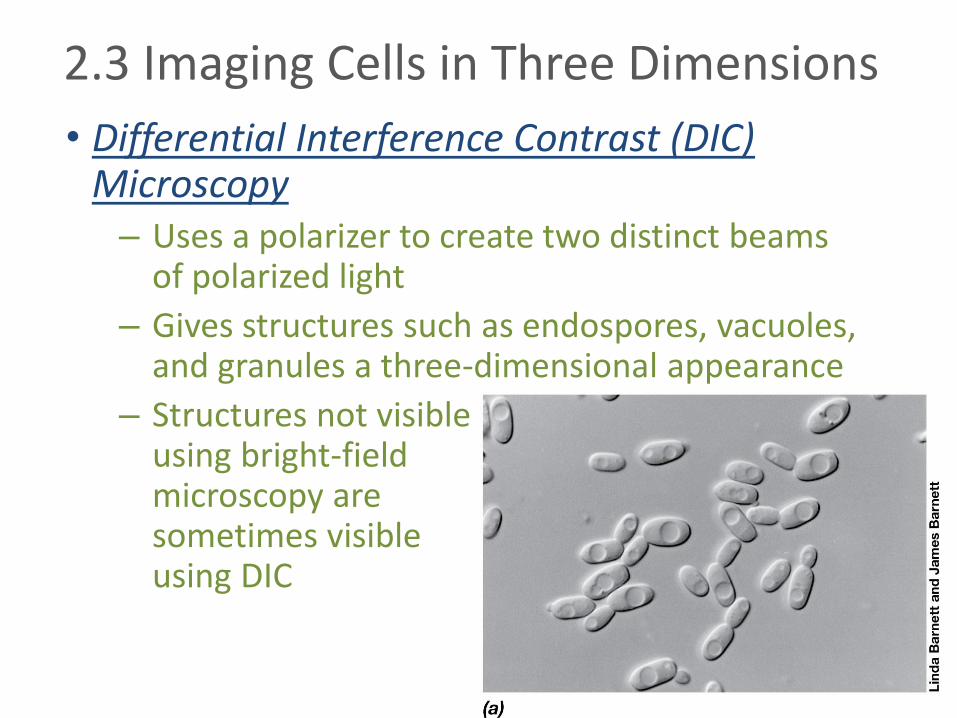
2.3 Imaging Cells in Three Dimensions
• Differential Interference Contrast (DIC) Microscopy– Uses a polarizer to create two distinct beams
of polarized light
– Gives structures such as endospores, vacuoles, and granules a three-dimensional appearance
– Structures not visible using bright-field microscopy are sometimes visible using DIC
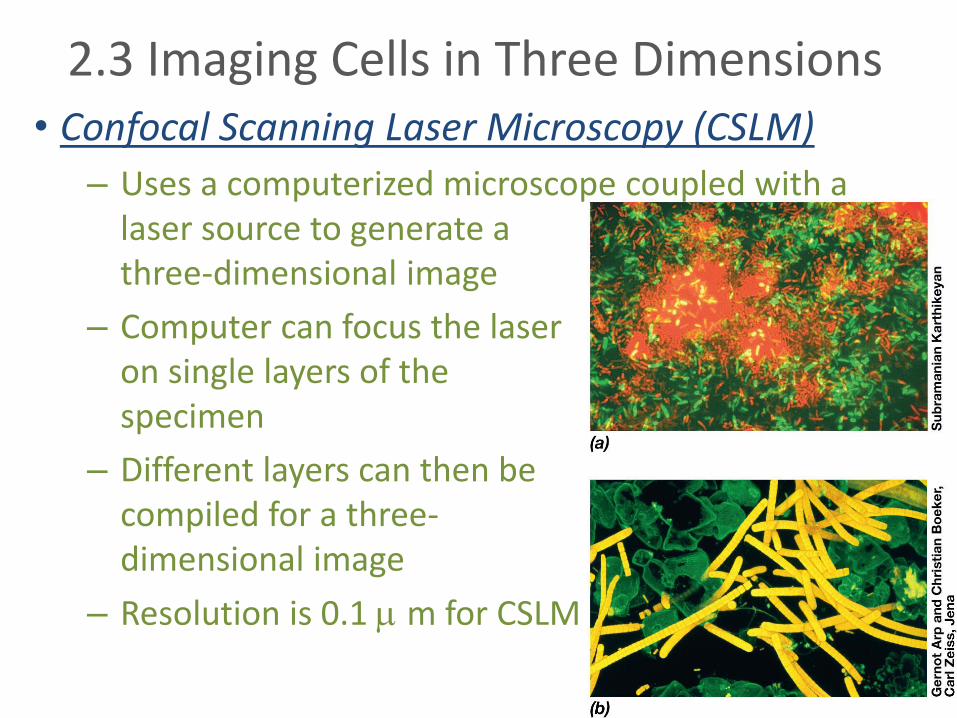
2.3 Imaging Cells in Three Dimensions• Confocal Scanning Laser Microscopy (CSLM)
– Uses a computerized microscope coupled with a laser source to generate a three-dimensional image
– Computer can focus the laser on single layers of the specimen
– Different layers can then be compiled for a three-dimensional image
– Resolution is 0.1 m for CSLM
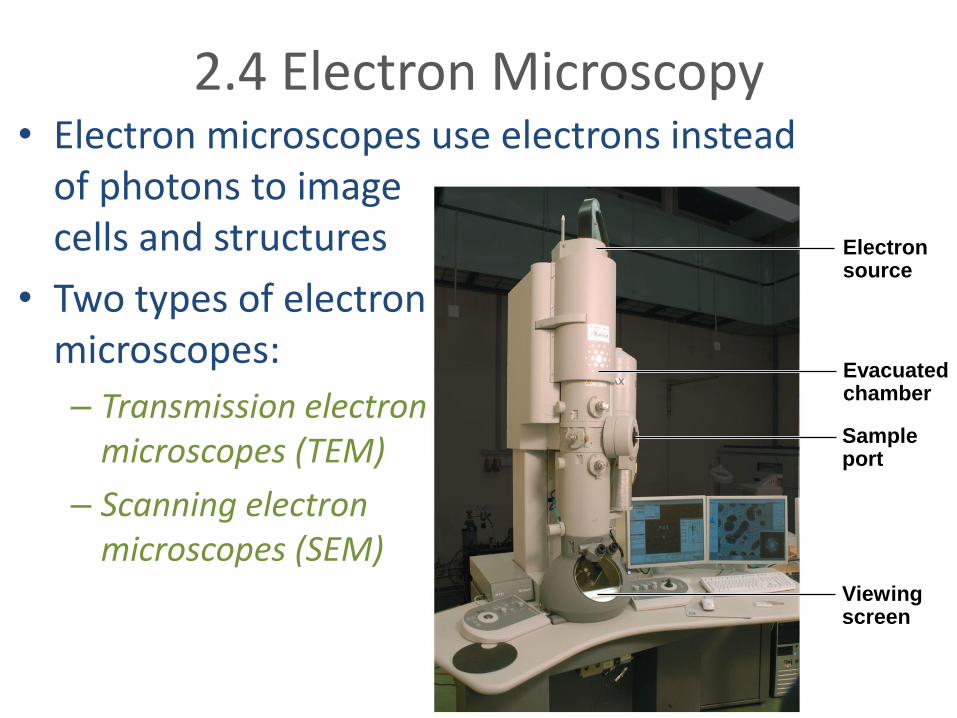
2.4 Electron Microscopy• Electron microscopes use electrons instead
of photons to image cells and structures
• Two types of electron microscopes:
– Transmission electron microscopes (TEM)
– Scanning electron microscopes (SEM)
Electronsource
Evacuatedchamber
Sampleport
Viewingscreen
Cytoplasmic membrane
DNA(nucleoid)
Septum Cell wall
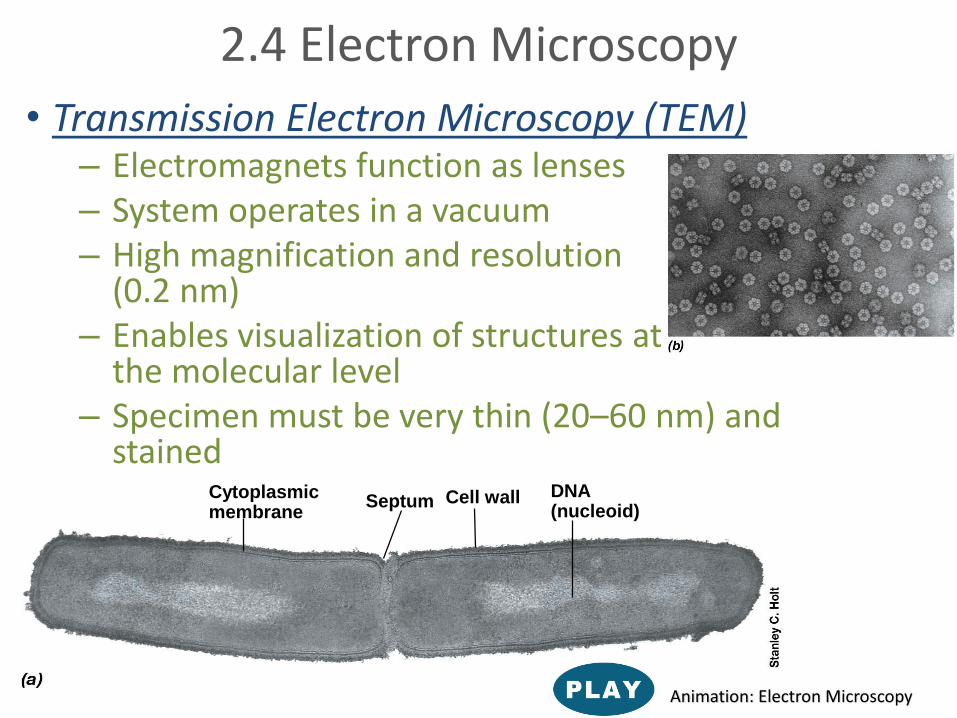
2.4 Electron Microscopy
• Transmission Electron Microscopy (TEM)– Electromagnets function as lenses– System operates in a vacuum– High magnification and resolution
(0.2 nm)– Enables visualization of structures at
the molecular level– Specimen must be very thin (20–60 nm) and
stained
Animation: Electron Microscopy
2.4 Electron Microscopy
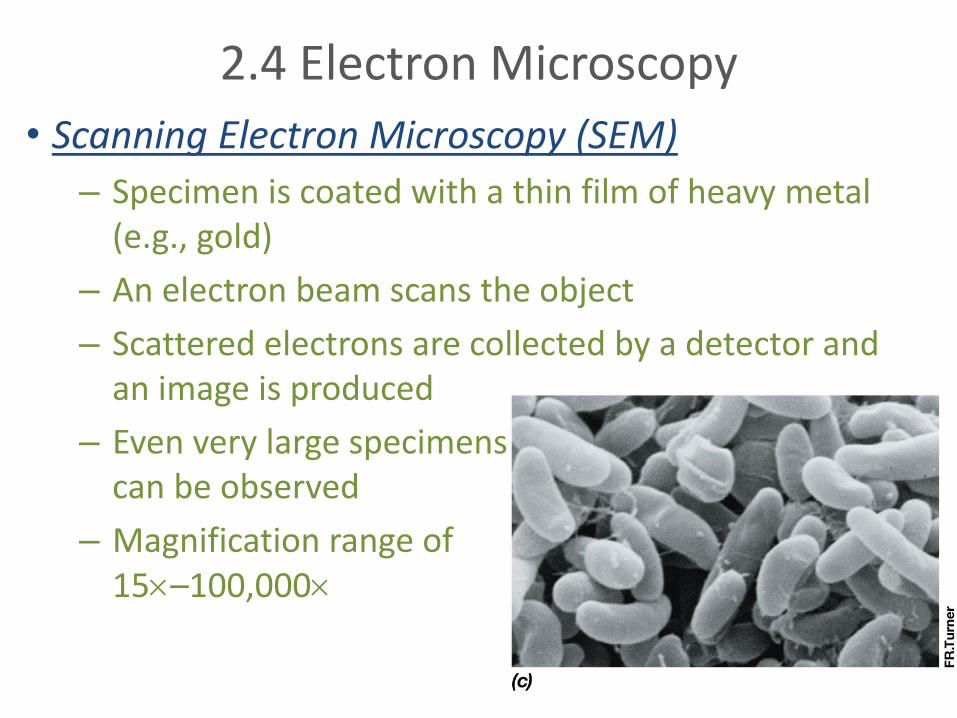
• Scanning Electron Microscopy (SEM)
– Specimen is coated with a thin film of heavy metal (e.g., gold)
– An electron beam scans the object
– Scattered electrons are collected by a detector and an image is produced
– Even very large specimens can be observed
– Magnification range of 15–100,000
II. Cells of Bacteria and Archaea
• 2.5 Cell Morphology
• 2.6 Cell Size and the Significance of Being Small
2.5 Cell Morphology
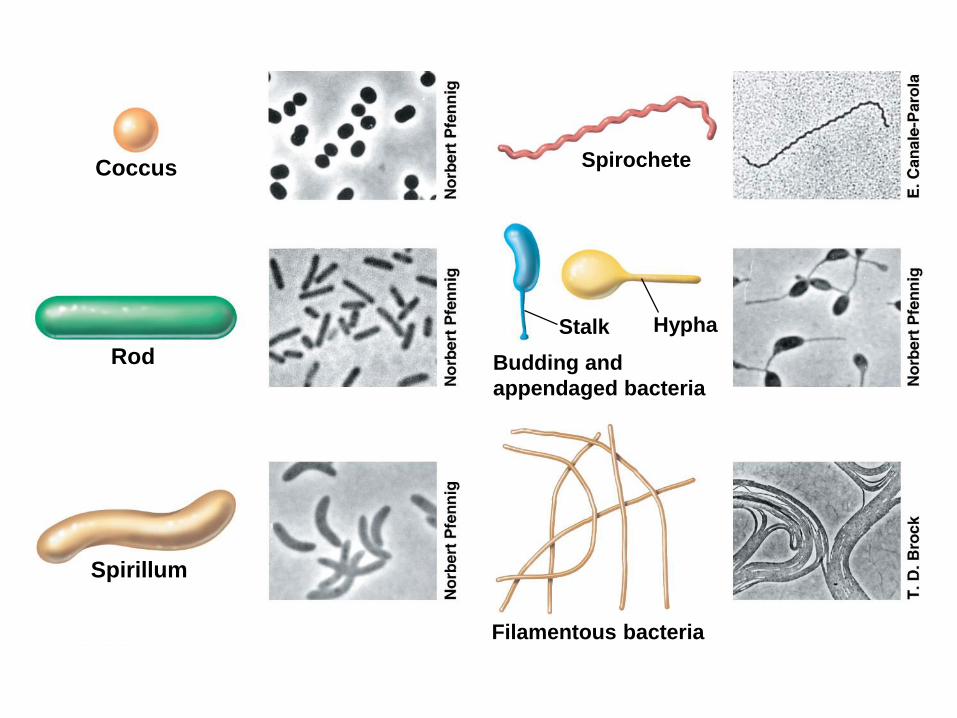
• Morphology = cell shape
• Major cell morphologies
– Coccus (pl. cocci): spherical or ovoid
– Rod: cylindrical shape
– Spirillum: spiral shape
• Cells with unusual shapes
– Spirochetes, appendaged bacteria, and filamentous bacteria
• Many variations on basic morphological types
Coccus
Rod
Spirillum
Spirochete
Stalk Hypha
Budding and
appendaged bacteria
Filamentous bacteria
2.5 Cell Morphology
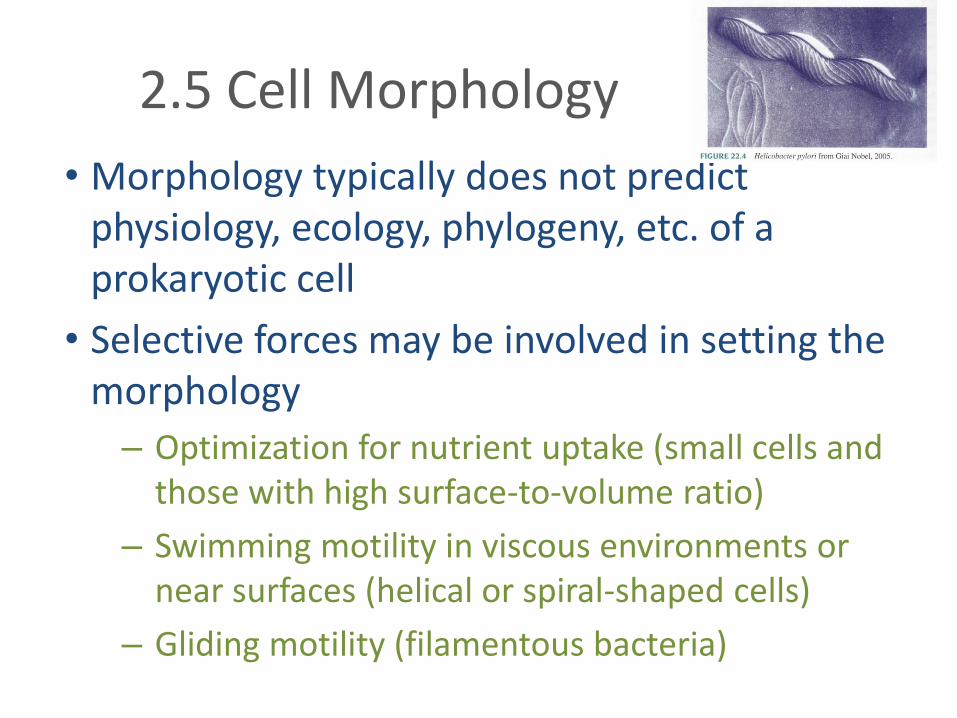
• Morphology typically does not predict physiology, ecology, phylogeny, etc. of a prokaryotic cell
• Selective forces may be involved in setting the morphology
– Optimization for nutrient uptake (small cells and those with high surface-to-volume ratio)
– Swimming motility in viscous environments or near surfaces (helical or spiral-shaped cells)
– Gliding motility (filamentous bacteria)
2.6 Cell Size and the Significance of Being Small
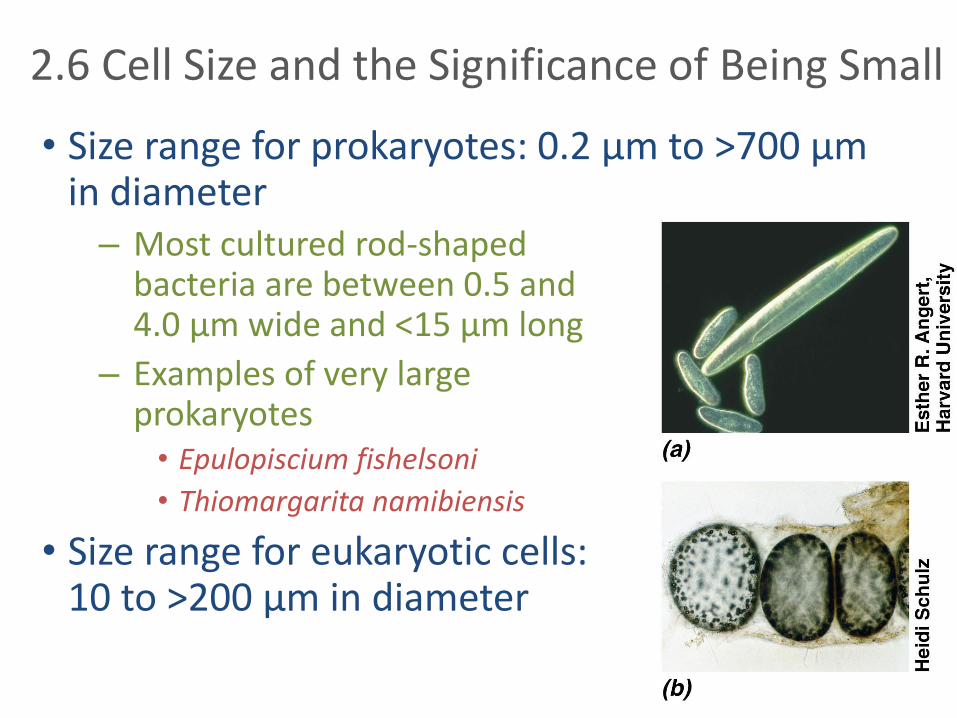
• Size range for prokaryotes: 0.2 µm to >700 µm in diameter– Most cultured rod-shaped
bacteria are between 0.5 and 4.0 µm wide and <15 µm long
– Examples of very large prokaryotes• Epulopiscium fishelsoni
• Thiomargarita namibiensis
• Size range for eukaryotic cells: 10 to >200 µm in diameter
r = 1 m
r = 2 m
r = 1 m
r = 2 m
Surface area (4r2) = 12.6 m2
Volume ( r3) = 4.2 m3
Surface area = 50.3 m2
Volume = 33.5 m3
34
SurfaceVolume
= 3
SurfaceVolume
= 1.5
2.6 Cell Size and the Significance of Being Small
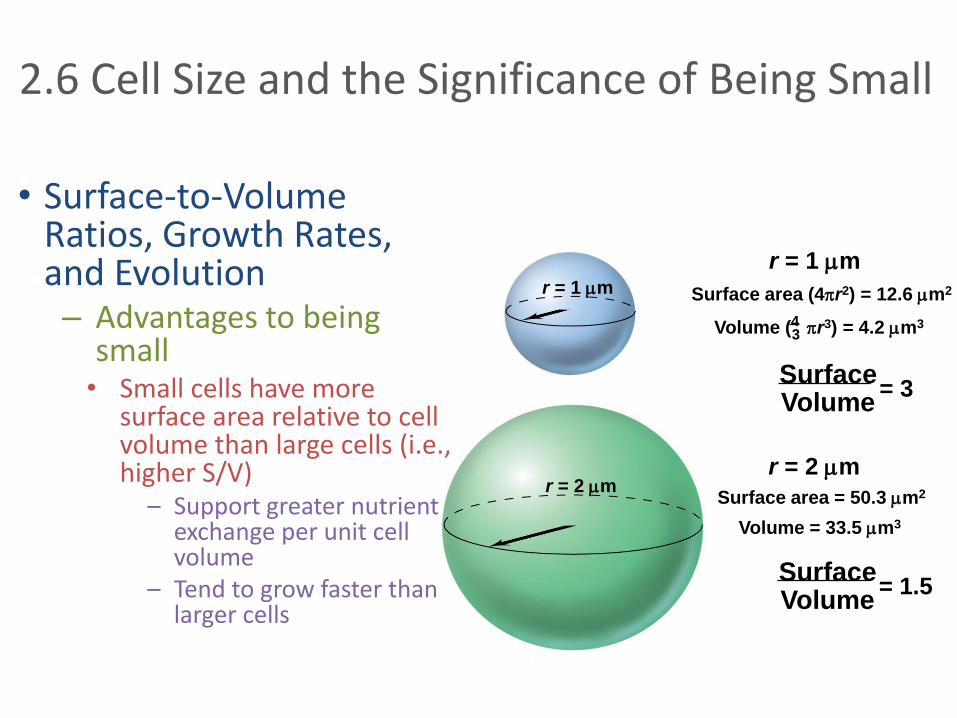
• Surface-to-Volume Ratios, Growth Rates, and Evolution – Advantages to being
small • Small cells have more
surface area relative to cell volume than large cells (i.e., higher S/V)
– Support greater nutrient exchange per unit cell volume
– Tend to grow faster than larger cells
2.6 Cell Size and the Significance of Being Small
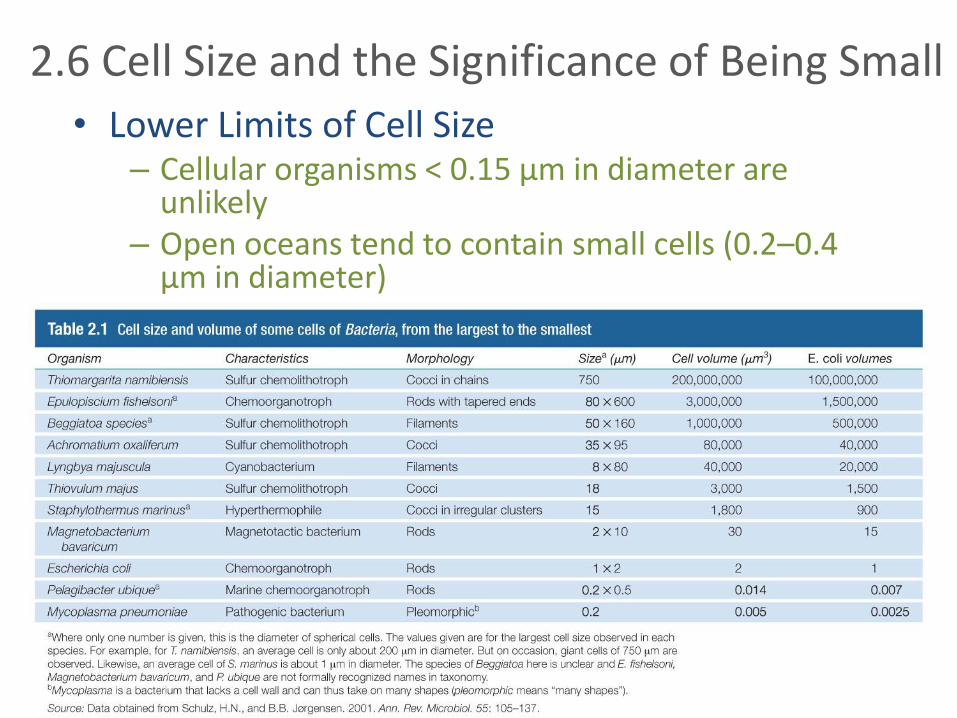
• Lower Limits of Cell Size– Cellular organisms < 0.15 µm in diameter are
unlikely– Open oceans tend to contain small cells (0.2–0.4
µm in diameter)
II. The Cytoplasmic Membrane and Transport
• 2.7 Membrane Structure
• 2.8 Membrane Functions
• 2.9 Nutrient Transport
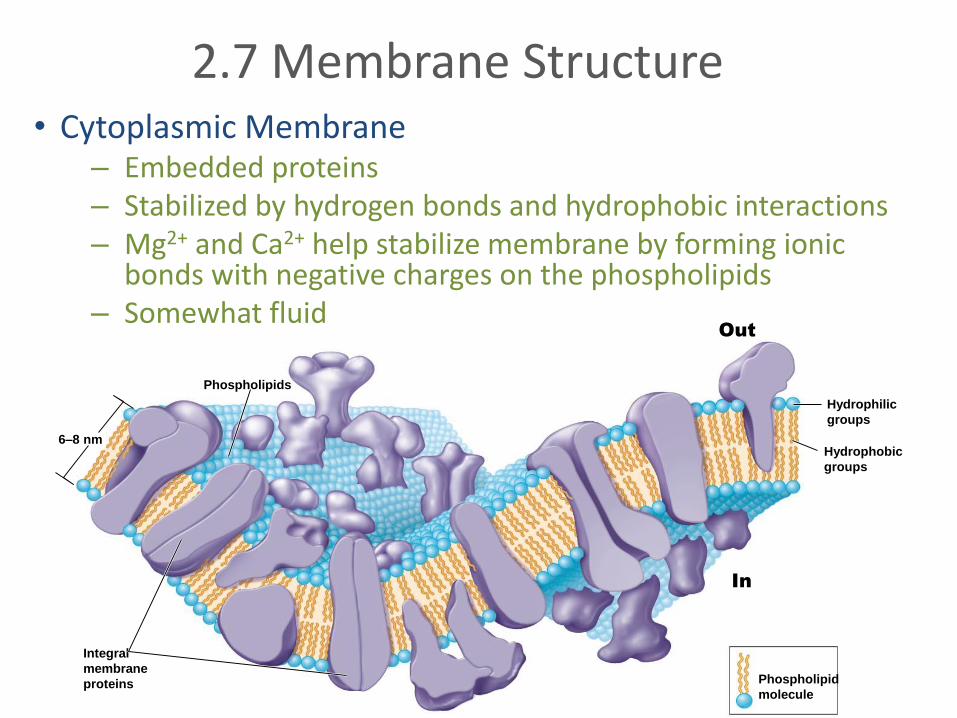
2.7 Membrane Structure
• Cytoplasmic membrane:
– Thin structure that surrounds the cell
– 6–8 nm thick
– Vital barrier that separates cytoplasm from environment
– Highly selective permeable barrier
• Allows concentration of specific metabolites
• Excretion of waste products
• Composition of Membranes– General structure is phospholipid bilayer
• Contain both hydrophobic and hydrophilic components
– Can exist in many different chemical forms as a result of variation in the groups attached to the glycerol backbone
– Hydrophobic fatty acids point inward
– Hydrophilic portions remain exposed to external environment or the cytoplasm
2.7 Membrane Structure
Animation: Membrane Structure
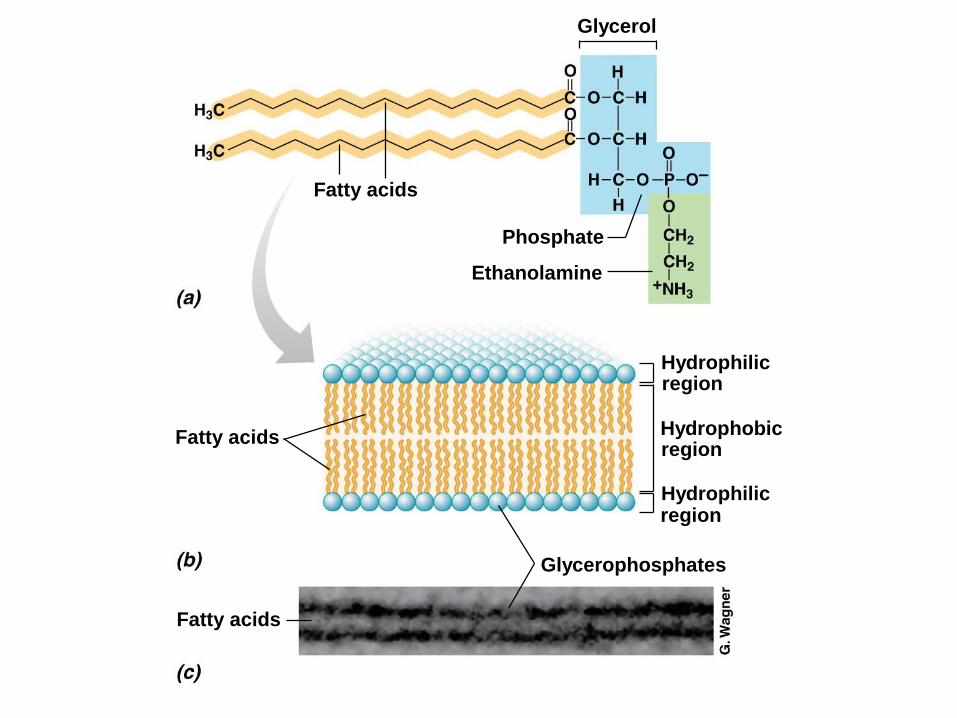
Fatty acids
Glycerol
Phosphate
Ethanolamine
Fatty acids
Glycerophosphates
Hydrophilicregion
region
region
Hydrophobic
Hydrophilic
Fatty acids
Phospholipids
6–8 nm
Integral
membrane
proteins
Hydrophilic
groups
Hydrophobic
groups
Phospholipid
molecule
Out
In
2.7 Membrane Structure• Cytoplasmic Membrane
– Embedded proteins– Stabilized by hydrogen bonds and hydrophobic interactions– Mg2+ and Ca2+ help stabilize membrane by forming ionic
bonds with negative charges on the phospholipids– Somewhat fluid
2.7 Membrane Structure
• Membrane Proteins
– Outer surface of cytoplasmic membrane can interact with a variety of proteins that bind substrates or process large molecules for transport
– Inner surface of cytoplasmic membrane interacts with proteins involved in energy-yielding reactions and other important cellular functions
– Integral membrane proteins
• Firmly embedded in the membrane
– Peripheral membrane proteins
• One portion anchored in the membrane
EsterEther
ArchaeaBacteriaEukarya
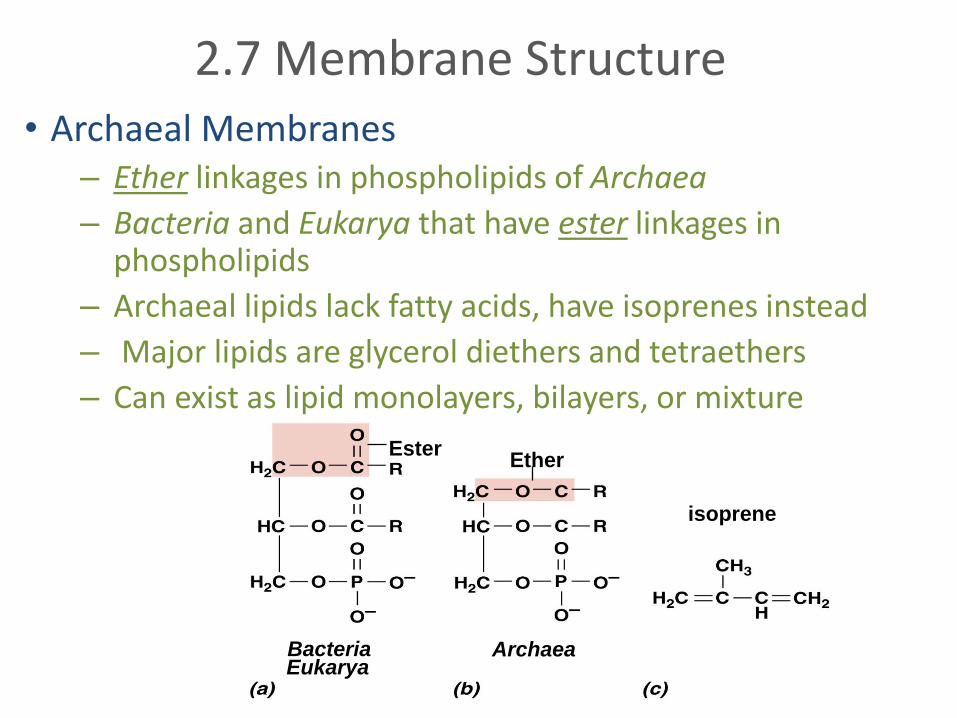
2.7 Membrane Structure • Archaeal Membranes
– Ether linkages in phospholipids of Archaea
– Bacteria and Eukarya that have ester linkages in phospholipids
– Archaeal lipids lack fatty acids, have isoprenes instead
– Major lipids are glycerol diethers and tetraethers
– Can exist as lipid monolayers, bilayers, or mixture
isoprene
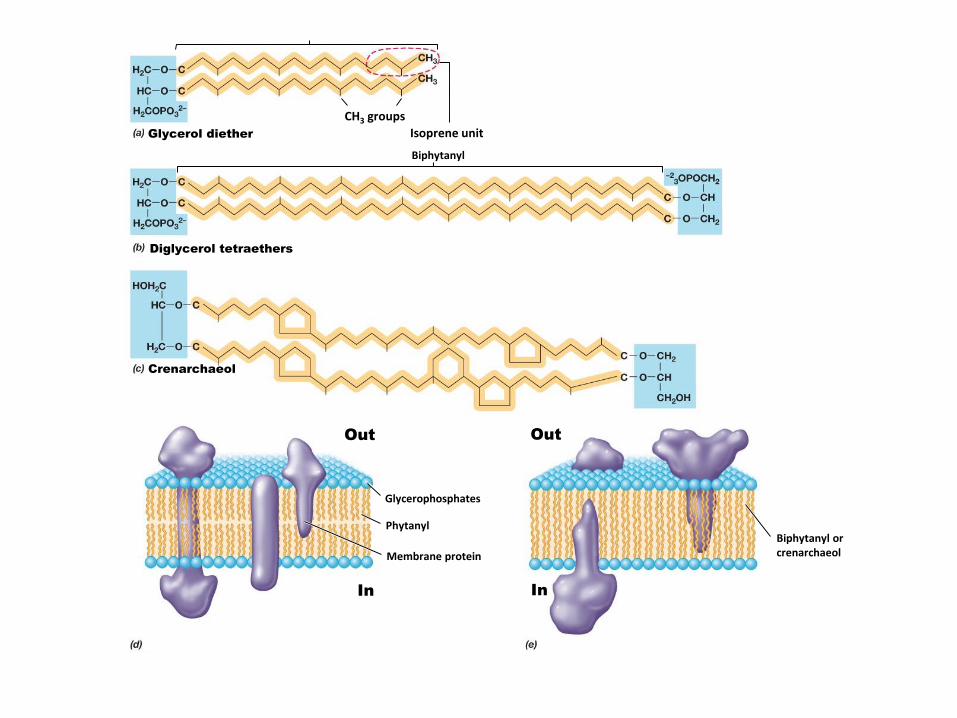
Glycerol diether
CH3 groups
Isoprene unit
Biphytanyl
Diglycerol tetraethers
Crenarchaeol
Out Out
In In
Glycerophosphates
Phytanyl
Membrane protein
Biphytanyl orcrenarchaeol
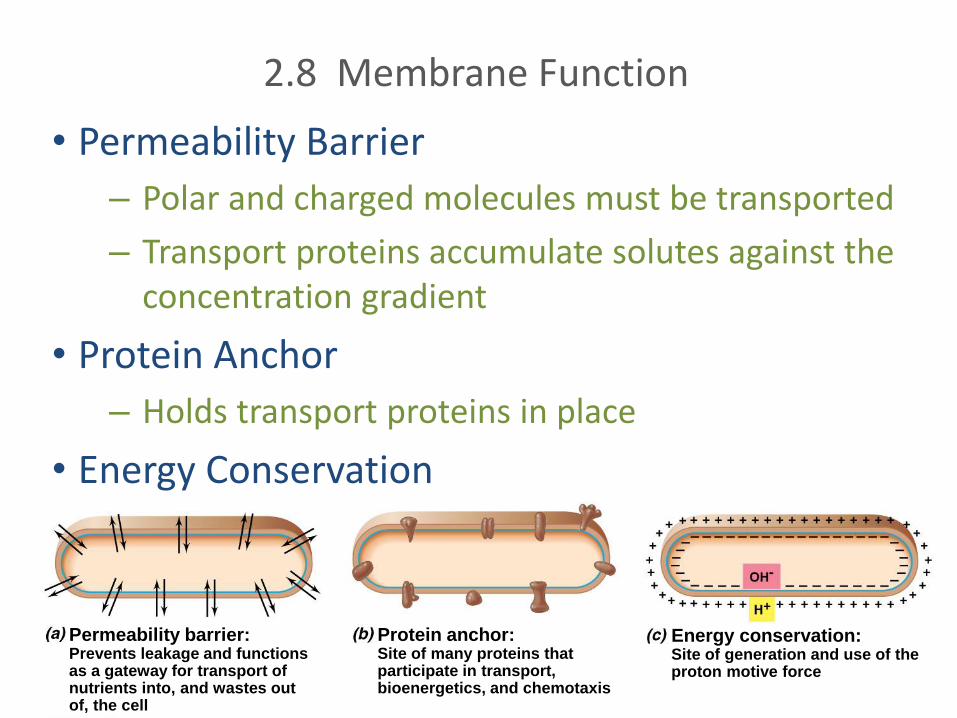
2.8 Membrane Function
• Permeability Barrier
– Polar and charged molecules must be transported
– Transport proteins accumulate solutes against the concentration gradient
• Protein Anchor
– Holds transport proteins in place
• Energy Conservation
Permeability barrier:Prevents leakage and functionsas a gateway for transport ofnutrients into, and wastes outof, the cell
Protein anchor:Site of many proteins thatparticipate in transport, bioenergetics, and chemotaxis
Energy conservation:Site of generation and use of theproton motive force
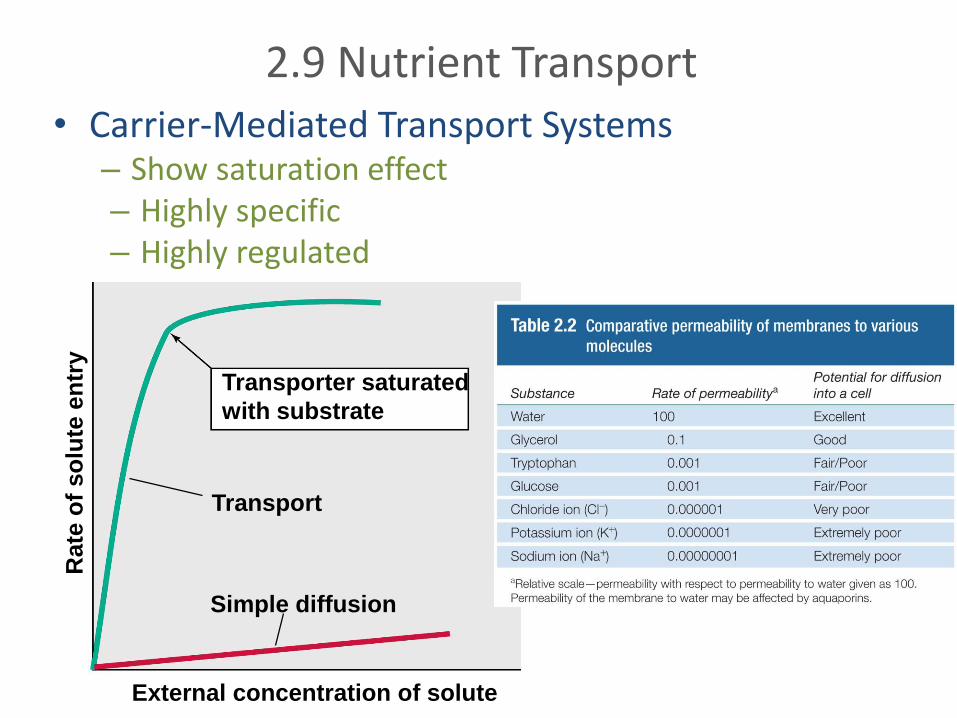
2.9 Nutrient Transport
• Carrier-Mediated Transport Systems – Show saturation effect – Highly specific– Highly regulated
Rate
of
so
lute
en
try
Transporter saturated
with substrate
Transport
Simple diffusion
External concentration of solute
Out In
Transportedsubstance
1
2
3
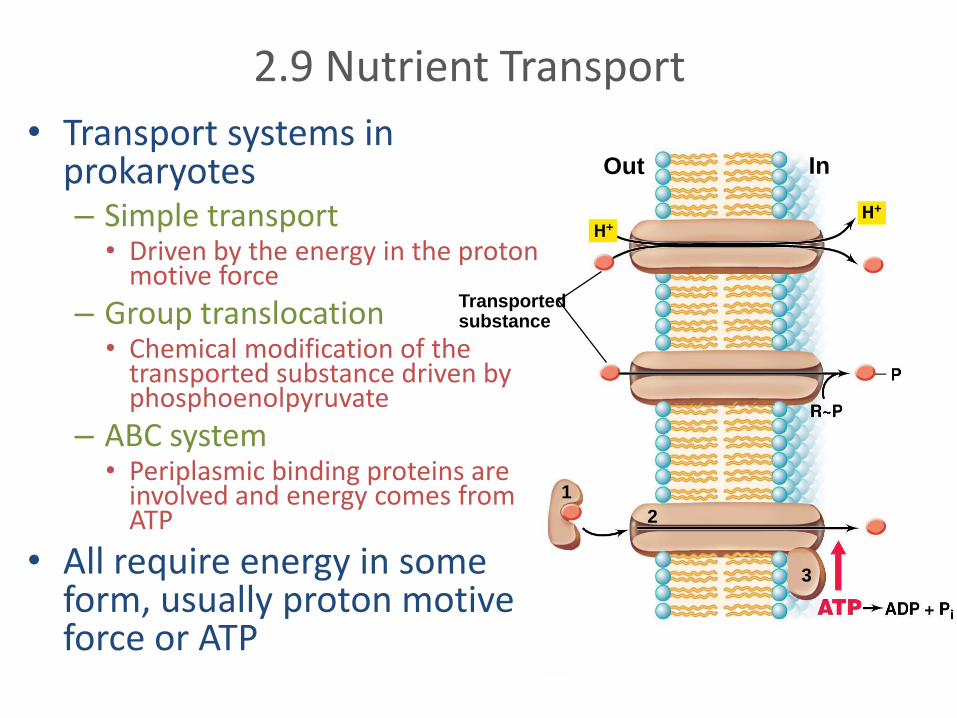
2.9 Nutrient Transport
• Transport systems in prokaryotes– Simple transport• Driven by the energy in the proton
motive force
– Group translocation• Chemical modification of the
transported substance driven by phosphoenolpyruvate
– ABC system• Periplasmic binding proteins are
involved and energy comes from ATP
• All require energy in some form, usually proton motive force or ATP
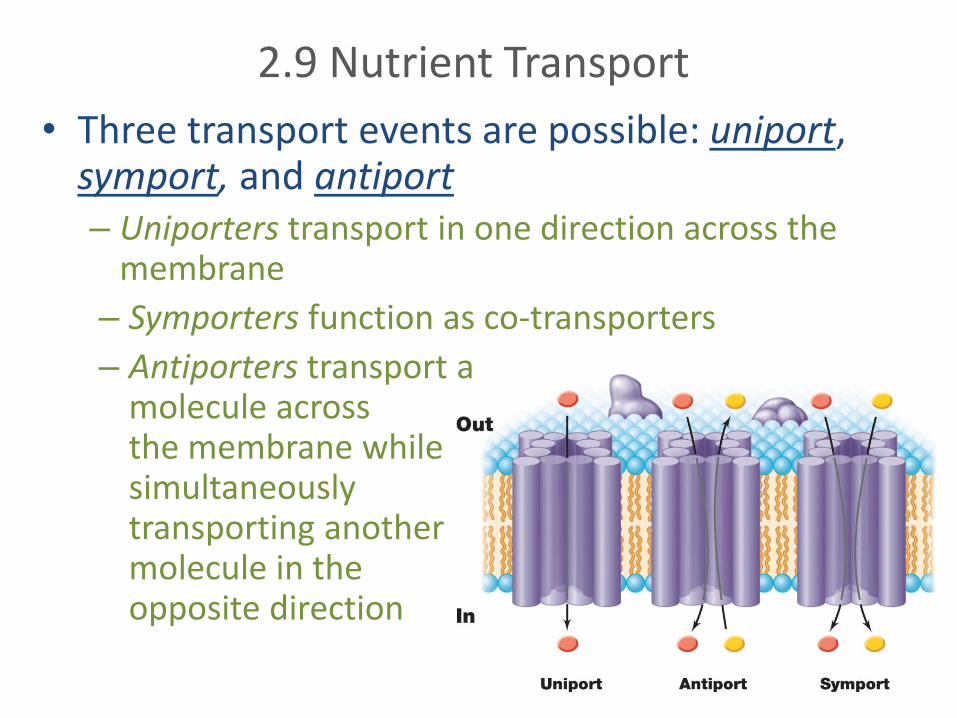
2.9 Nutrient Transport
• Three transport events are possible: uniport, symport, and antiport– Uniporters transport in one direction across the
membrane
– Symporters function as co-transporters
– Antiporters transport a molecule across the membrane while simultaneously transporting another molecule in the opposite direction
2.9 Nutrient Transport
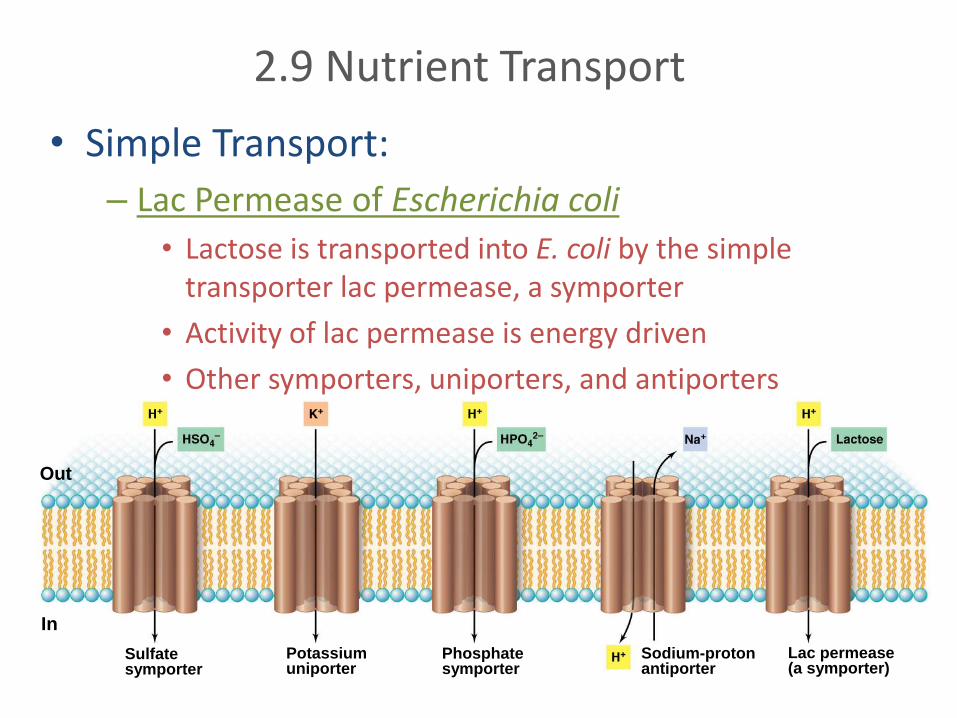
• Simple Transport:
– Lac Permease of Escherichia coli
• Lactose is transported into E. coli by the simple transporter lac permease, a symporter
• Activity of lac permease is energy driven
• Other symporters, uniporters, and antiporters
Out
In
Sulfatesymporter
Potassiumuniporter
Phosphatesymporter
Sodium-protonantiporter
Lac permease(a symporter)
PE
Direction of P transfer
Enz HPr
Nonspecific components
Enz
IIa
Enz
IIb
Specific components
Cytoplasmic
membrane
Enz
IIC
Out
In
Glucose 6–P
Directionof glucosetransport
Glucose
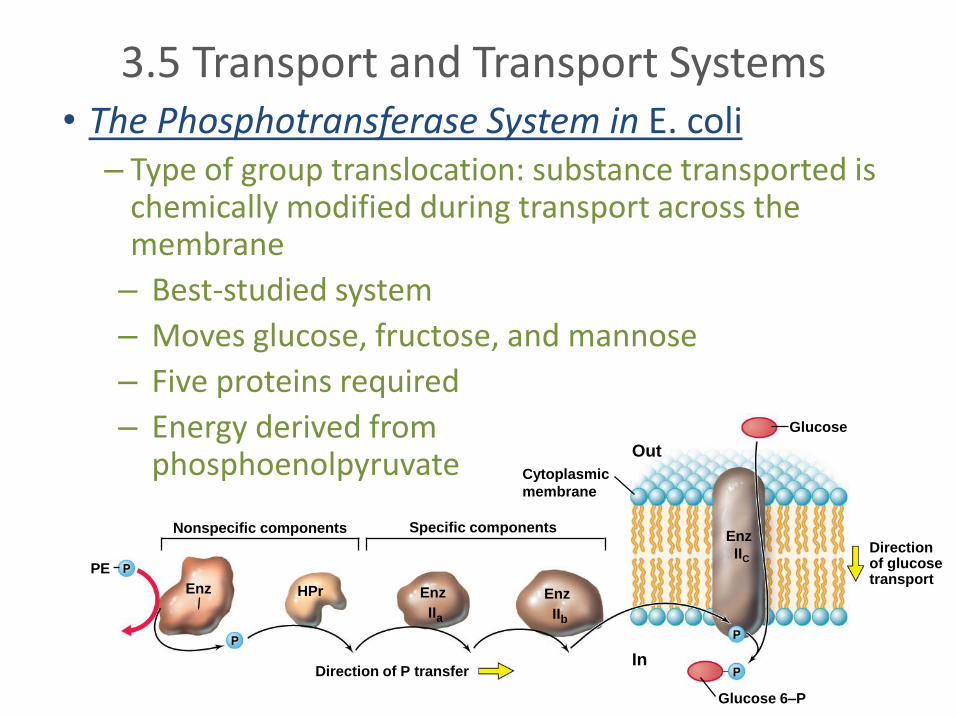
3.5 Transport and Transport Systems• The Phosphotransferase System in E. coli
– Type of group translocation: substance transported is chemically modified during transport across the membrane
– Best-studied system
– Moves glucose, fructose, and mannose
– Five proteins required
– Energy derived from phosphoenolpyruvate
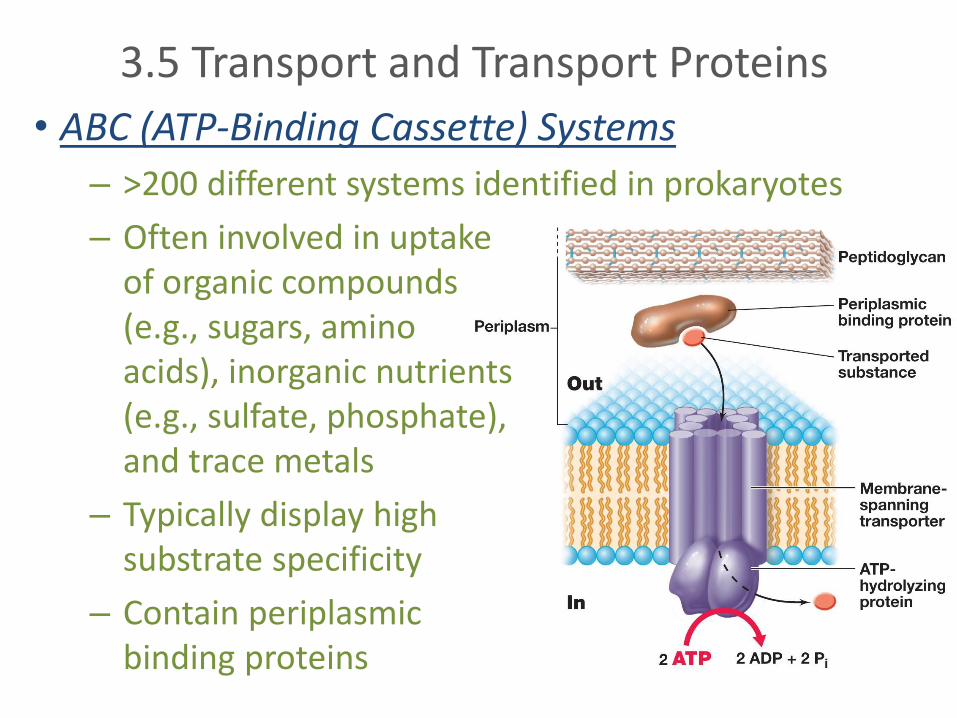
3.5 Transport and Transport Proteins
• ABC (ATP-Binding Cassette) Systems
– >200 different systems identified in prokaryotes
– Often involved in uptake of organic compounds (e.g., sugars, amino acids), inorganic nutrients (e.g., sulfate, phosphate), and trace metals
– Typically display high substrate specificity
– Contain periplasmicbinding proteins
IV. Cell Walls of Bacteria and Archaea
• 2.10 Peptidoglycan
• 2.11 LPS: The Outer Membrane
• 2.12 Archaeal Cell Walls
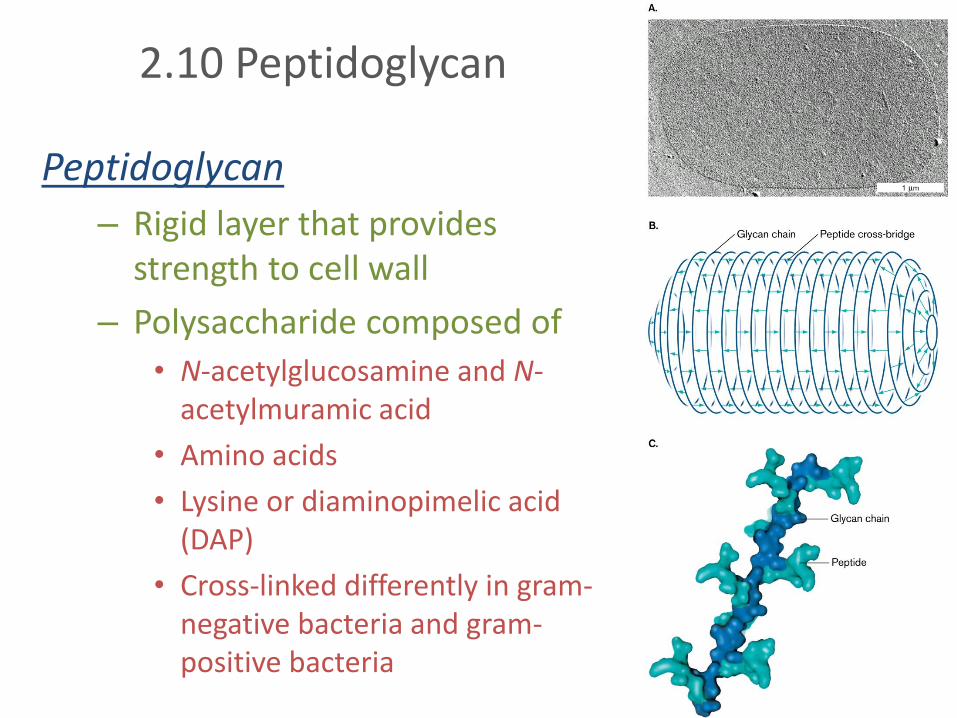
2.10 Peptidoglycan
Peptidoglycan
– Rigid layer that provides strength to cell wall
– Polysaccharide composed of
• N-acetylglucosamine and N-acetylmuramic acid
• Amino acids
• Lysine or diaminopimelic acid (DAP)
• Cross-linked differently in gram-negative bacteria and gram-positive bacteria
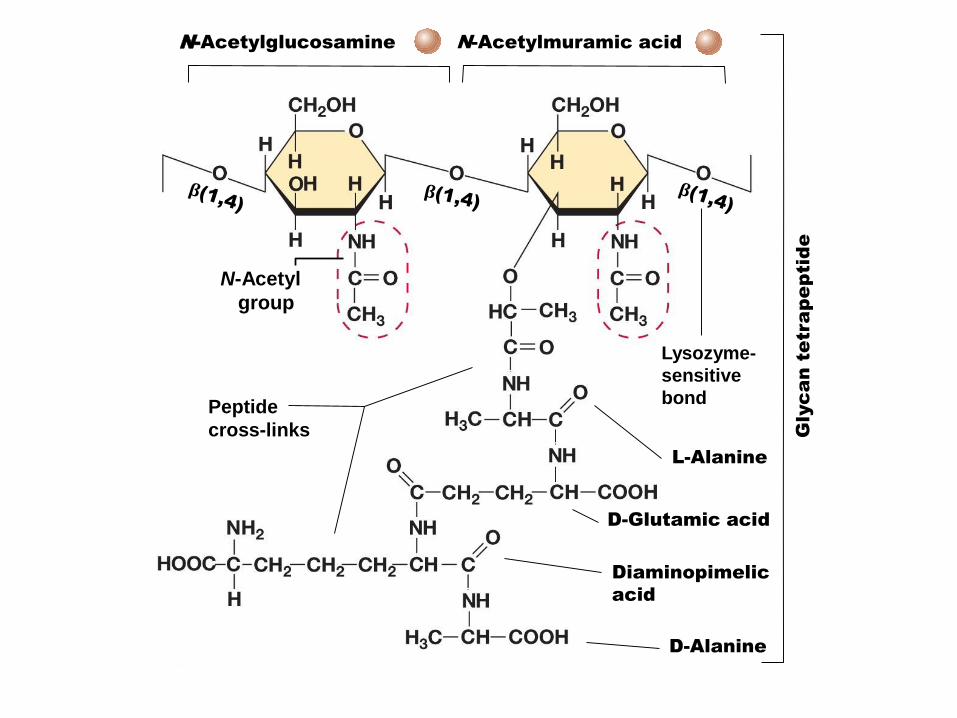
N-Acetylglucosamine N-Acetylmuramic acid
N-Acetyl
group
Lysozyme-
sensitive
bondPeptide
cross-links
L-Alanine
D-Glutamic acid
Diaminopimelic
acid
D-Alanine
Glyc
an
te
tra
pe
ptid
e
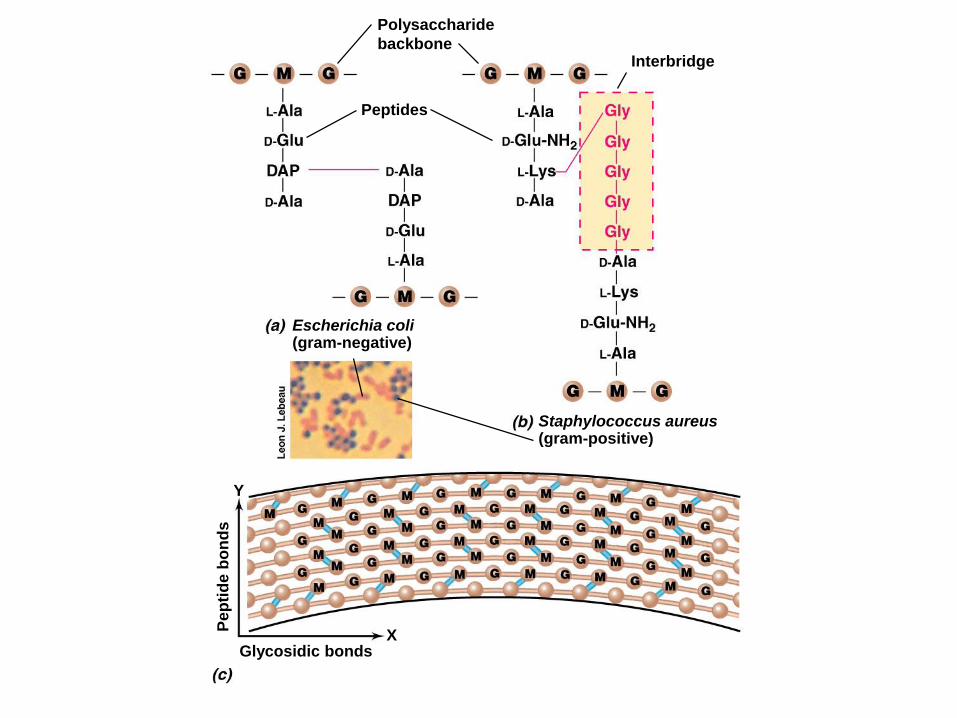
Polysaccharide
backbone
Peptides
Escherichia coli(gram-negative)
Staphylococcus aureus(gram-positive)
Interbridge
Pe
pti
de
bo
nd
s
Glycosidic bondsX
Y
2.10 Peptidoglycan
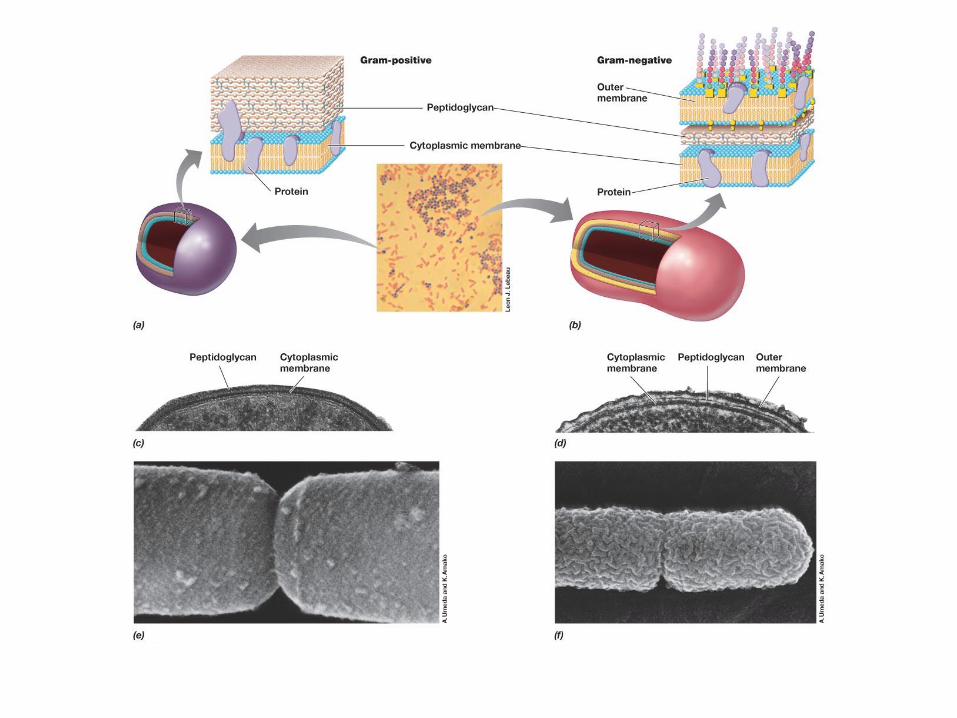
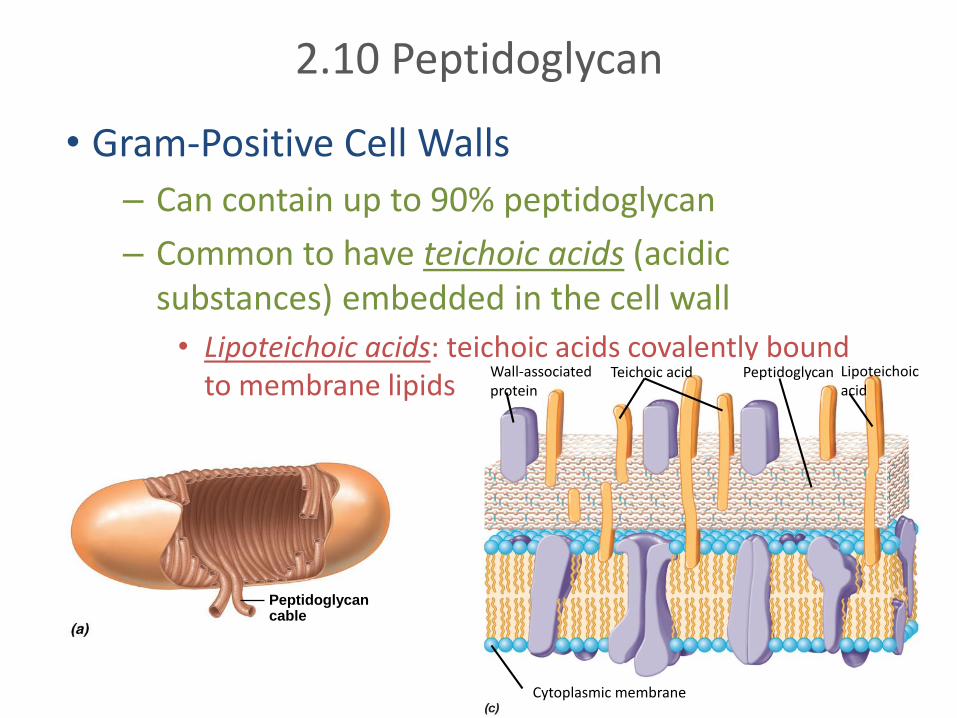
• Gram-Positive Cell Walls
– Can contain up to 90% peptidoglycan
– Common to have teichoic acids (acidic substances) embedded in the cell wall
• Lipoteichoic acids: teichoic acids covalently bound to membrane lipids
Peptidoglycancable
Teichoic acid Peptidoglycan Lipoteichoicacid
Cytoplasmic membrane
Wall-associatedprotein
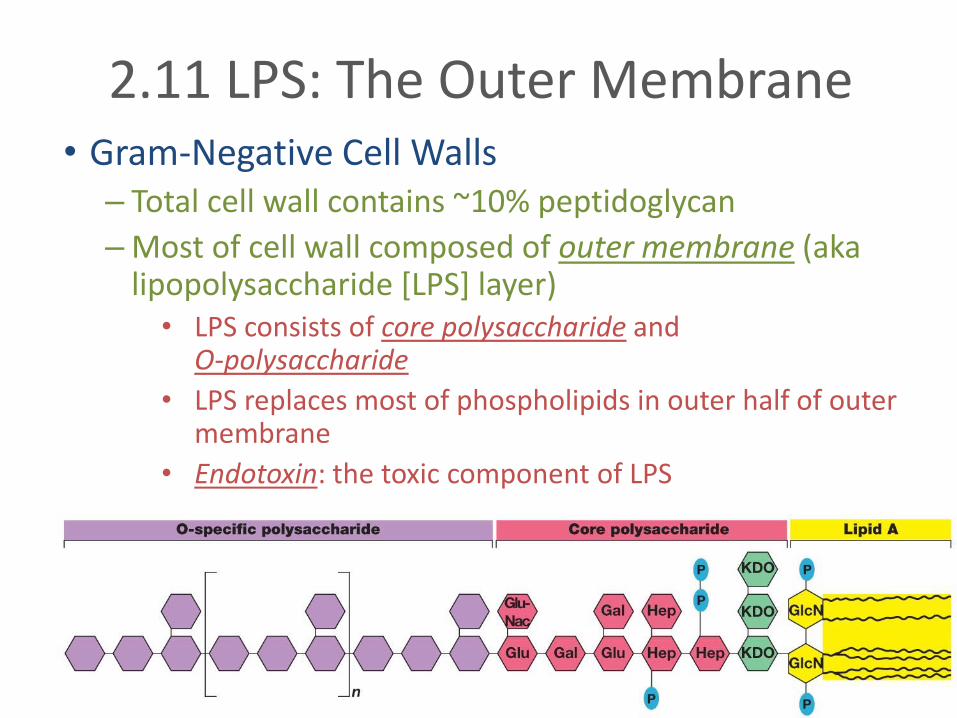
2.11 LPS: The Outer Membrane• Gram-Negative Cell Walls
– Total cell wall contains ~10% peptidoglycan
– Most of cell wall composed of outer membrane (aka lipopolysaccharide [LPS] layer)• LPS consists of core polysaccharide and
O-polysaccharide
• LPS replaces most of phospholipids in outer half of outer membrane
• Endotoxin: the toxic component of LPS
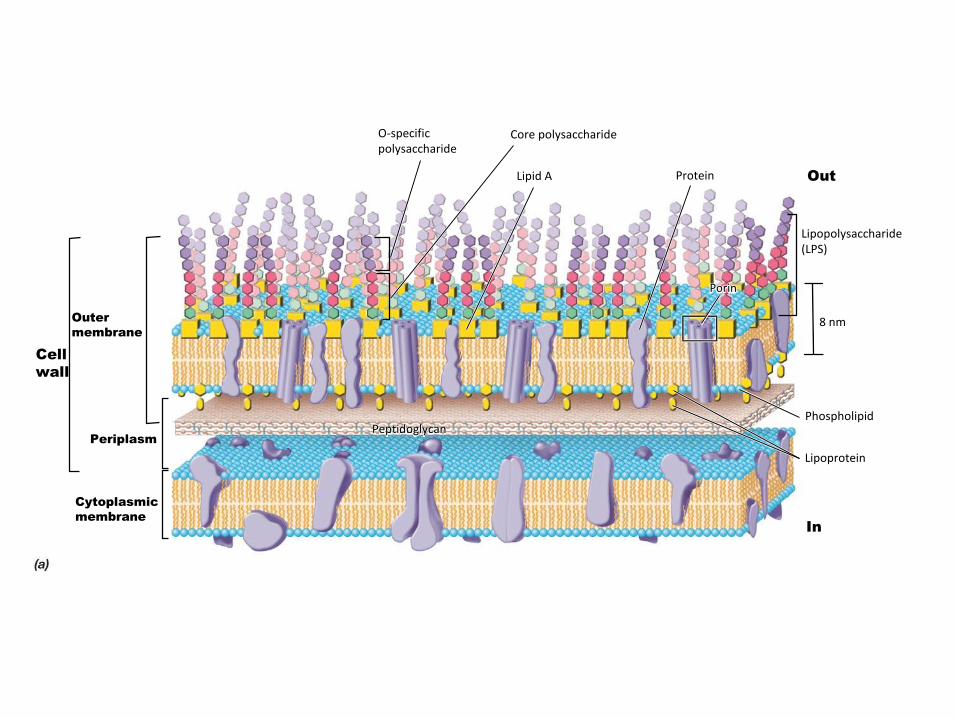
O-specificpolysaccharide
Core polysaccharide
Lipid A Protein
Lipopolysaccharide (LPS)
Phospholipid
Lipoprotein
8 nm
Out
Cell
wall
Outer
membrane
Periplasm
Cytoplasmic
membrane
In
Porin
Peptidoglycan
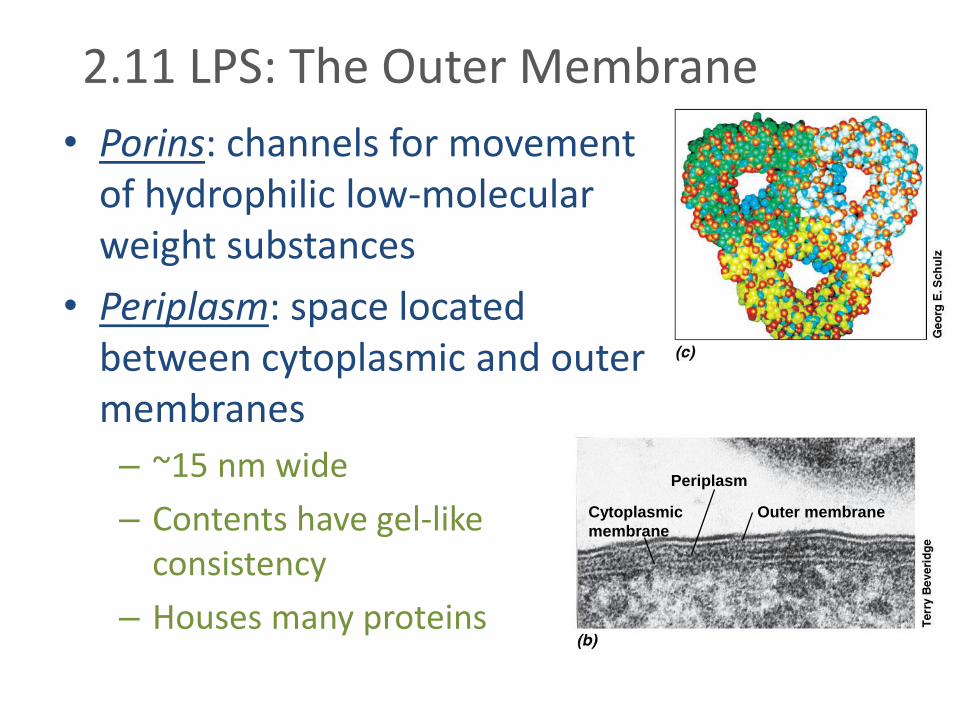
2.11 LPS: The Outer Membrane
• Porins: channels for movement of hydrophilic low-molecular weight substances
• Periplasm: space located between cytoplasmic and outer membranes
– ~15 nm wide
– Contents have gel-like consistency
– Houses many proteins
Periplasm
Cytoplasmic
membrane
Outer membrane
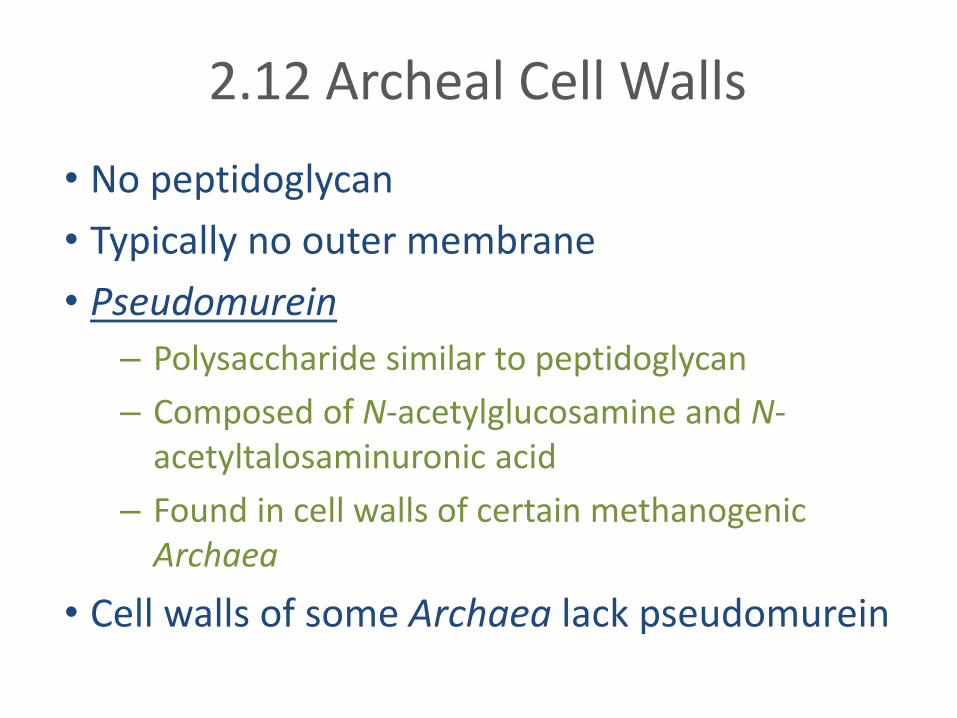
2.12 Archeal Cell Walls
• No peptidoglycan
• Typically no outer membrane
• Pseudomurein
– Polysaccharide similar to peptidoglycan
– Composed of N-acetylglucosamine and N-acetyltalosaminuronic acid
– Found in cell walls of certain methanogenicArchaea
• Cell walls of some Archaea lack pseudomurein
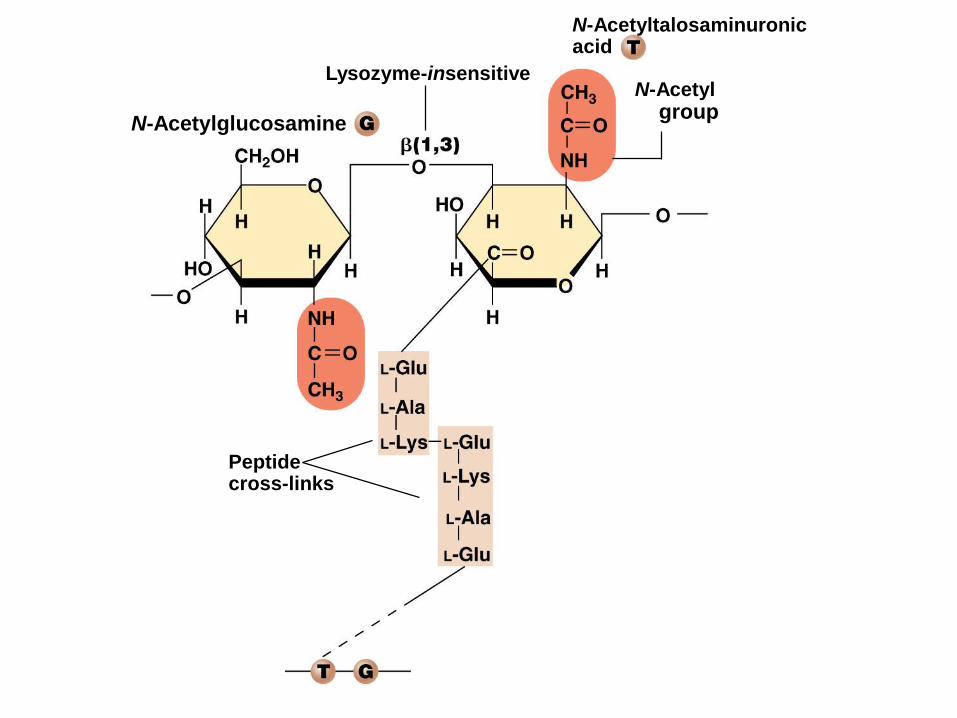
Lysozyme-insensitive
N-Acetylglucosamine
N-Acetyltalosaminuronicacid
N-Acetylgroup
Peptidecross-links
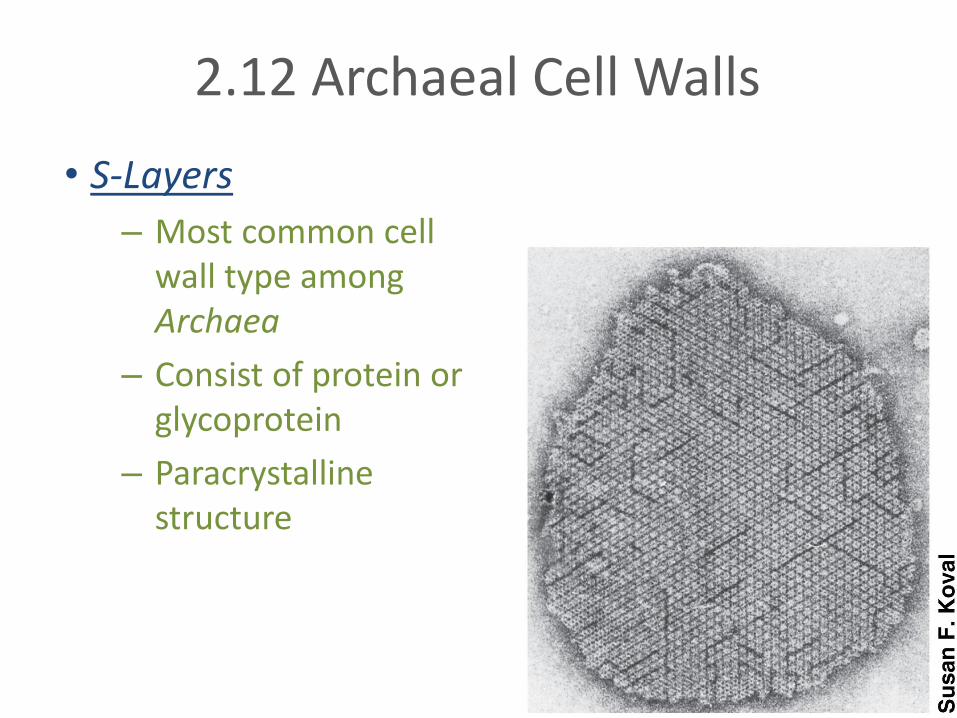
2.12 Archaeal Cell Walls
• S-Layers
– Most common cell wall type among Archaea
– Consist of protein or glycoprotein
– Paracrystallinestructure
V. Other Cell Surface Structures and Inclusions
• 2.13 Cell Surface Structures
• 2.14 Cell Inclusions
• 2.15 Gas Vesicles
• 2.16 Endospores
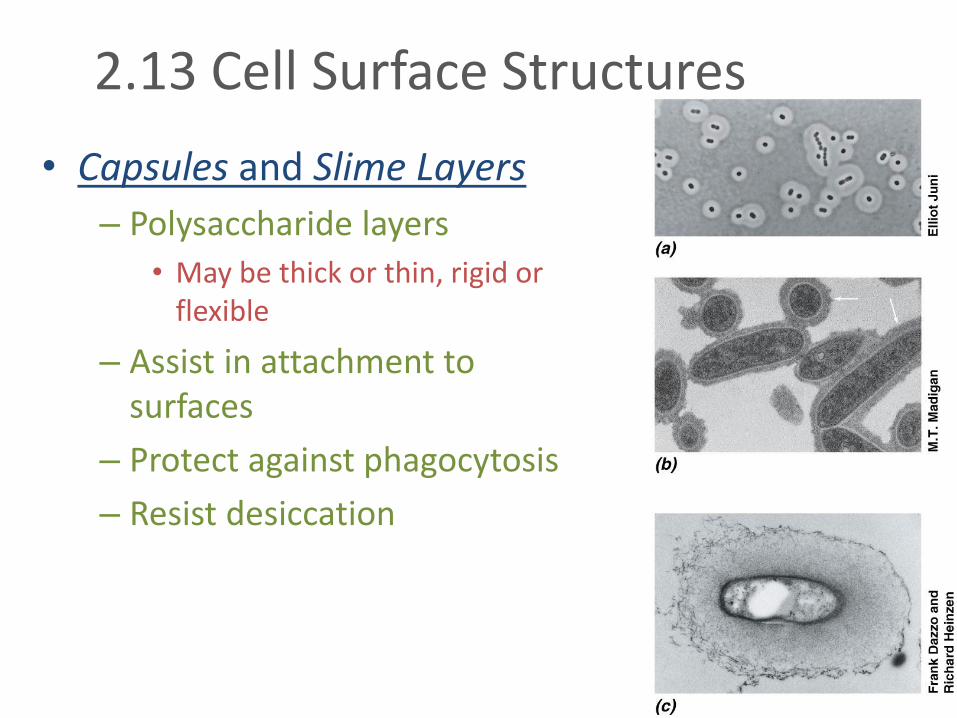
2.13 Cell Surface Structures
• Capsules and Slime Layers
– Polysaccharide layers
• May be thick or thin, rigid or flexible
– Assist in attachment to surfaces
– Protect against phagocytosis
– Resist desiccation
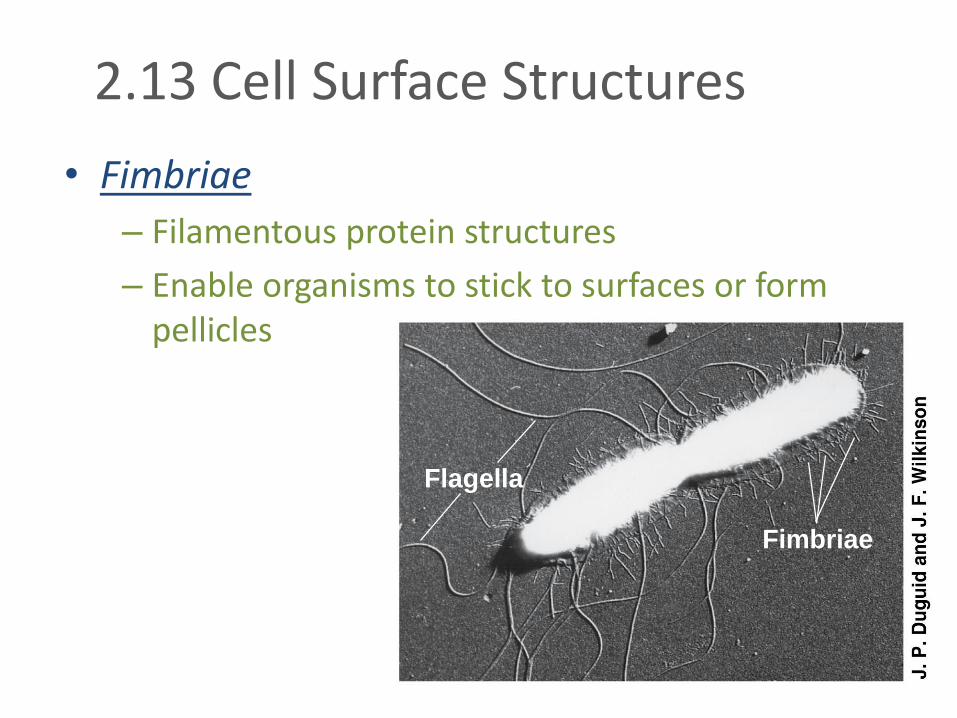
2.13 Cell Surface Structures
• Fimbriae
– Filamentous protein structures
– Enable organisms to stick to surfaces or form pellicles
Flagella
Fimbriae
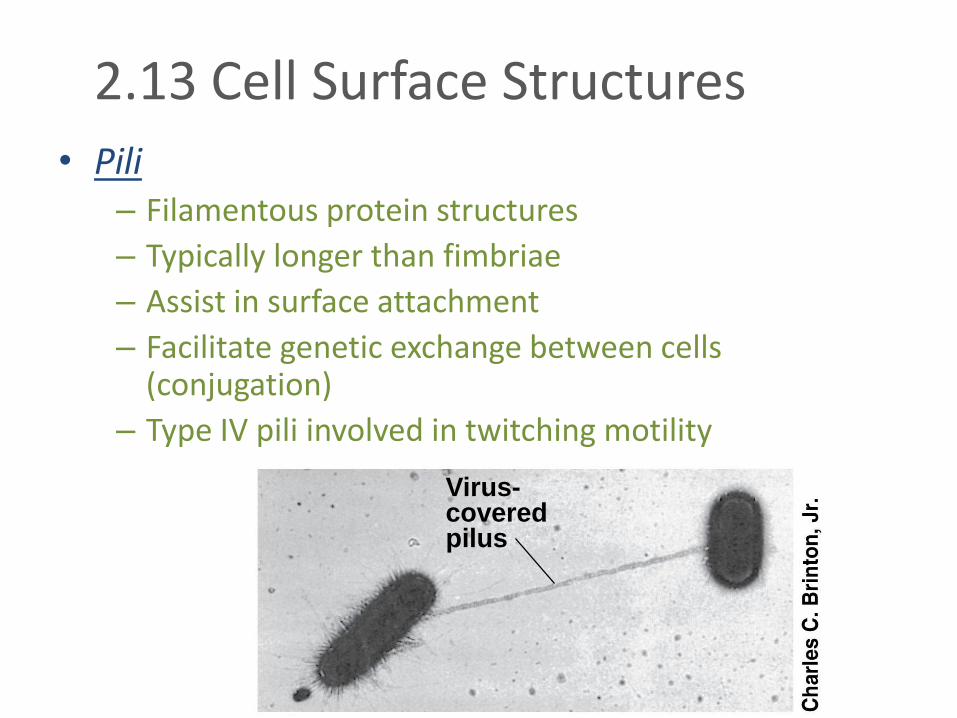
2.13 Cell Surface Structures
• Pili– Filamentous protein structures
– Typically longer than fimbriae
– Assist in surface attachment
– Facilitate genetic exchange between cells (conjugation)
– Type IV pili involved in twitching motility
Virus-coveredpilus
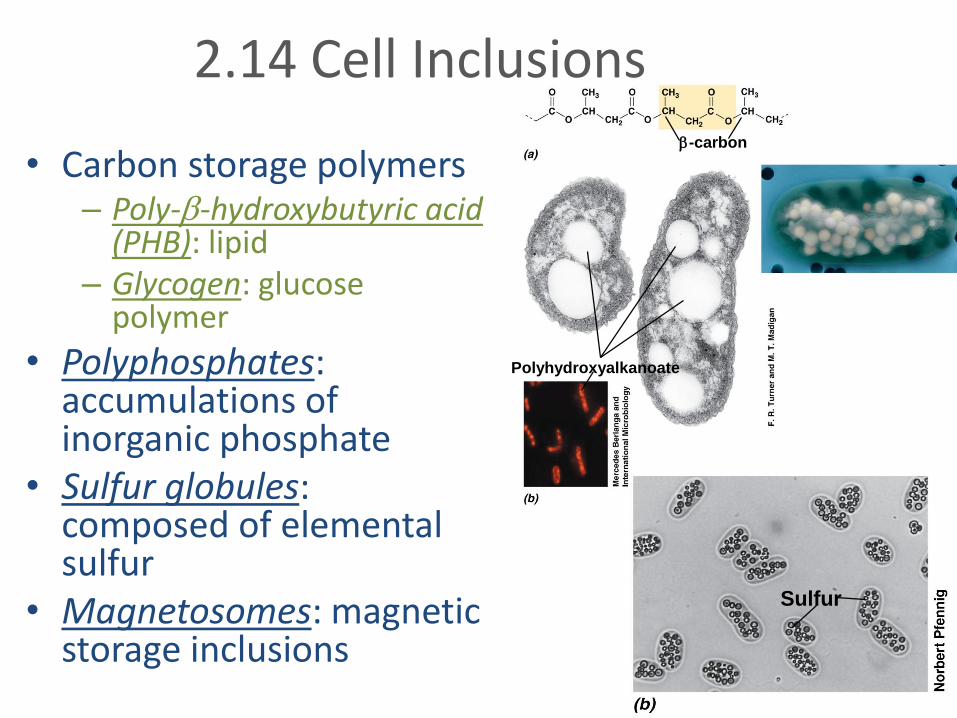
-carbon
Polyhydroxyalkanoate
2.14 Cell Inclusions
• Carbon storage polymers– Poly--hydroxybutyric acid
(PHB): lipid – Glycogen: glucose
polymer
• Polyphosphates: accumulations of inorganic phosphate
• Sulfur globules: composed of elemental sulfur
• Magnetosomes: magnetic storage inclusions
Sulfur
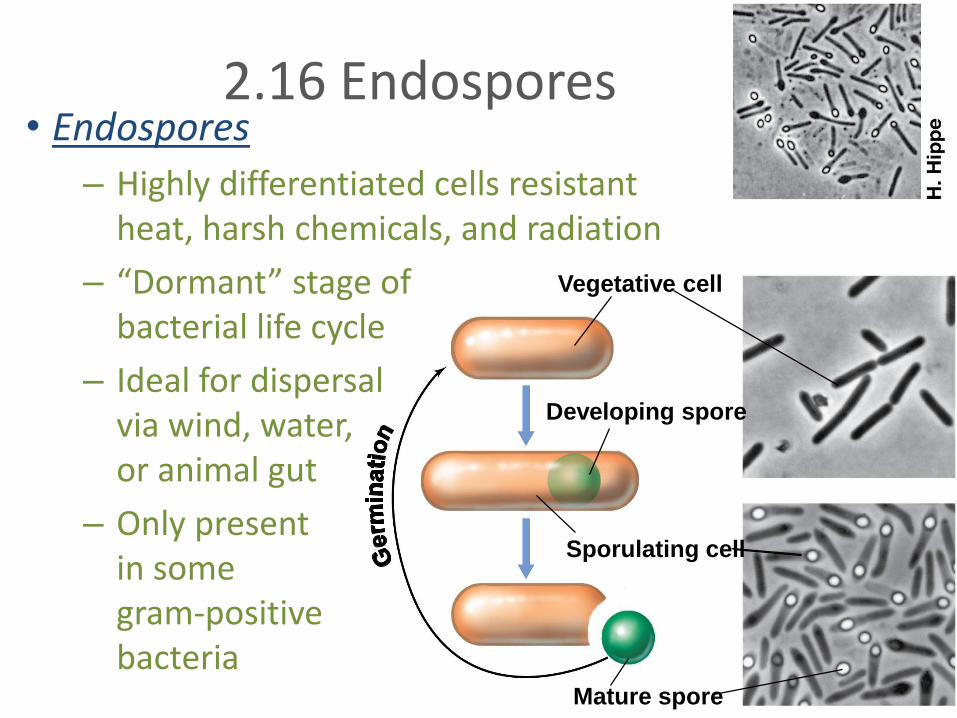
Vegetative cell
Developing spore
Sporulating cell
Mature spore
2.16 Endospores• Endospores
– Highly differentiated cells resistant to heat, harsh chemicals, and radiation
– “Dormant” stage of bacterial life cycle
– Ideal for dispersal via wind, water, or animal gut
– Only present in some gram-positive bacteria
VI. Microbial Locomotion
• 2.17 Flagella and Motility
• 2.18 Gliding Motility
• 2.19 Microbial Taxes
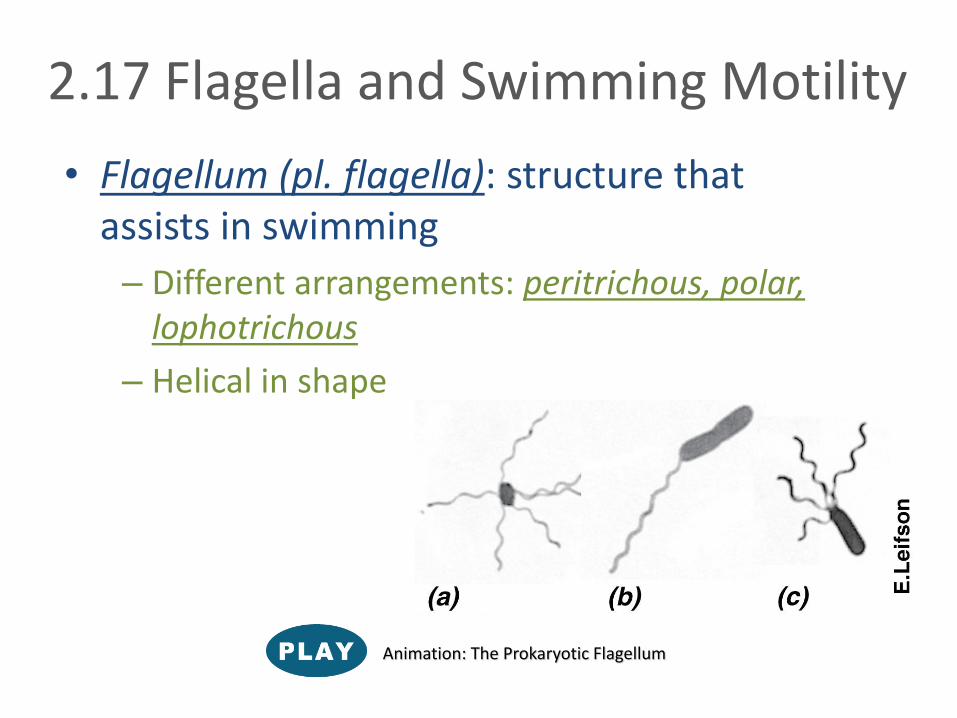
2.17 Flagella and Swimming Motility
• Flagellum (pl. flagella): structure that assists in swimming
– Different arrangements: peritrichous, polar, lophotrichous
– Helical in shape
Animation: The Prokaryotic Flagellum
Rod
C Ring
MS Ring
Motprotein
Mot proteinMot protein Fli proteins(motor switch)
45 nm
Cytoplasmicmembrane
Basalbody
Rod
C Ring
MS Ring
P Ring
Periplasm Peptidoglycan
L Ring
HookOutermembrane(LPS)
Flagellin
Filament
MS
L
P
15—20 nm
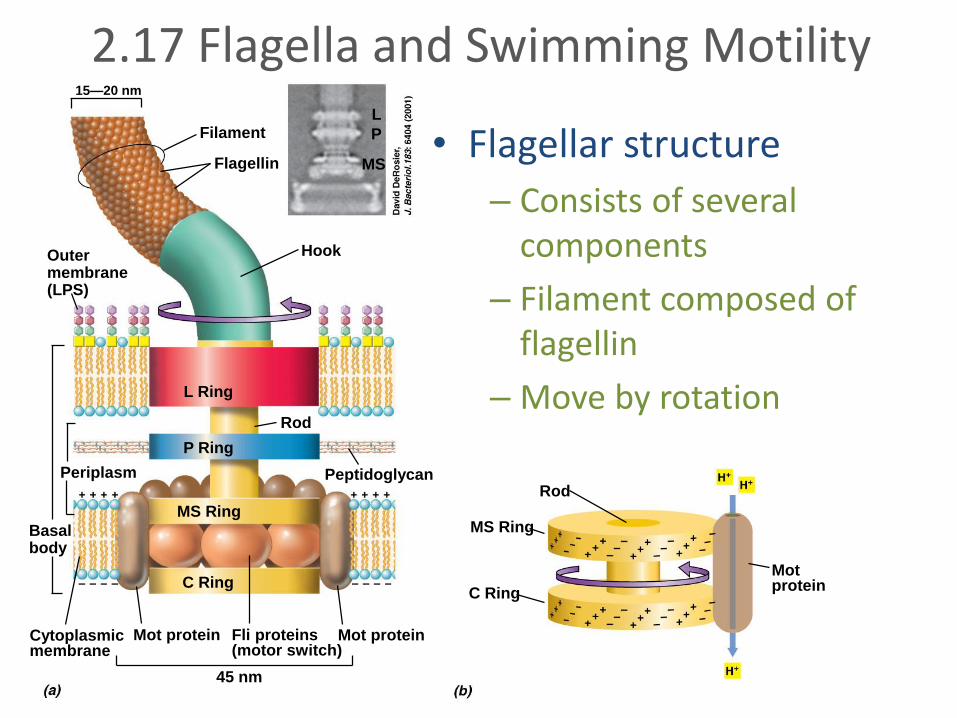
2.17 Flagella and Swimming Motility
• Flagellar structure
– Consists of several components
– Filament composed of flagellin
– Move by rotation
Polar
Peritrichous
CW rotation
CCW rotation
Unidirectional flagella
Cellstops,reorients
Reversible flagella
Bundledflagella(CCW rotation)
Tumble—flagellapushed apart(CW rotation)
Flagella bundled(CCW rotation)
CW rotation
CW rotation
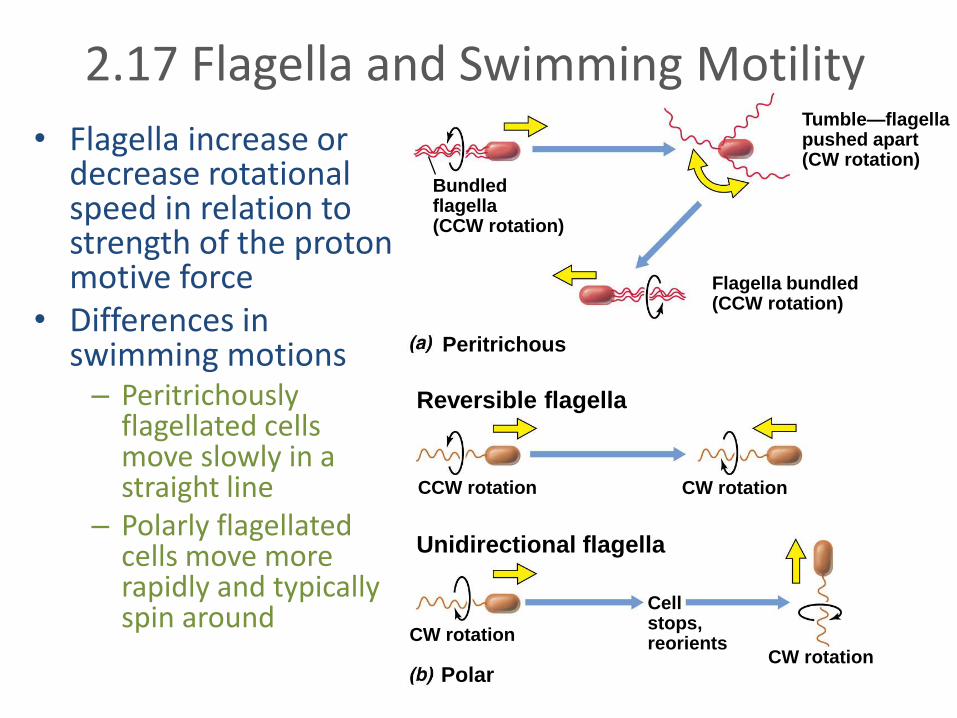
2.17 Flagella and Swimming Motility
• Flagella increase or decrease rotational speed in relation to strength of the proton motive force
• Differences in swimming motions– Peritrichously
flagellated cells move slowly in a straight line
– Polarly flagellated cells move more rapidly and typically spin around
No attractant present:Random movement
Attractant present:Directed movement
Tumble
Run
Tumble
Run
Attractant
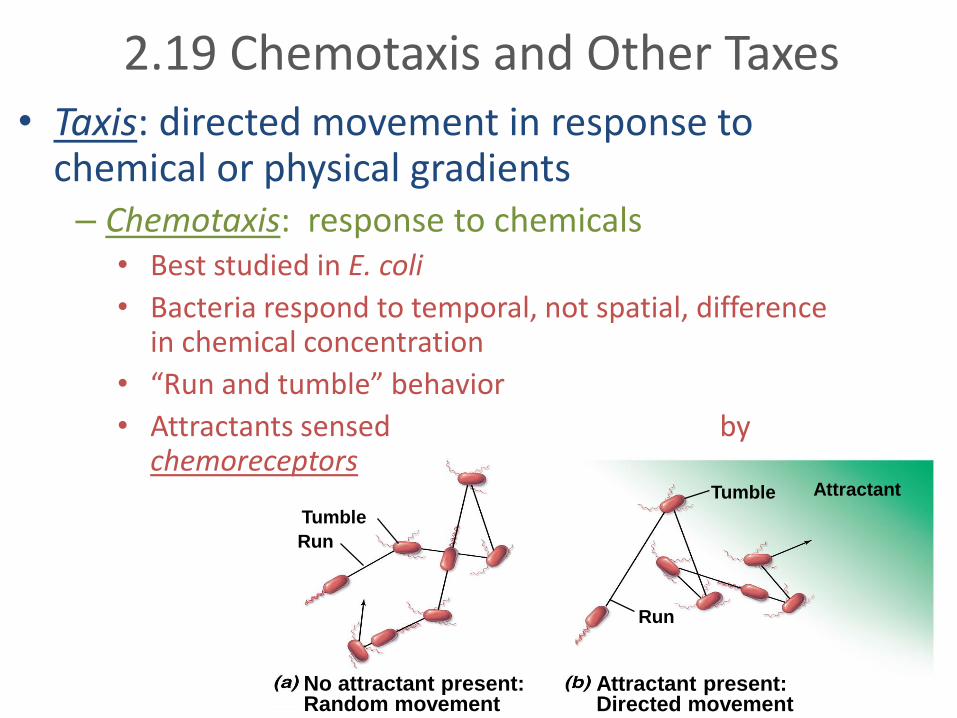
2.19 Chemotaxis and Other Taxes• Taxis: directed movement in response to
chemical or physical gradients– Chemotaxis: response to chemicals
• Best studied in E. coli
• Bacteria respond to temporal, not spatial, difference in chemical concentration
• “Run and tumble” behavior
• Attractants sensed by chemoreceptors
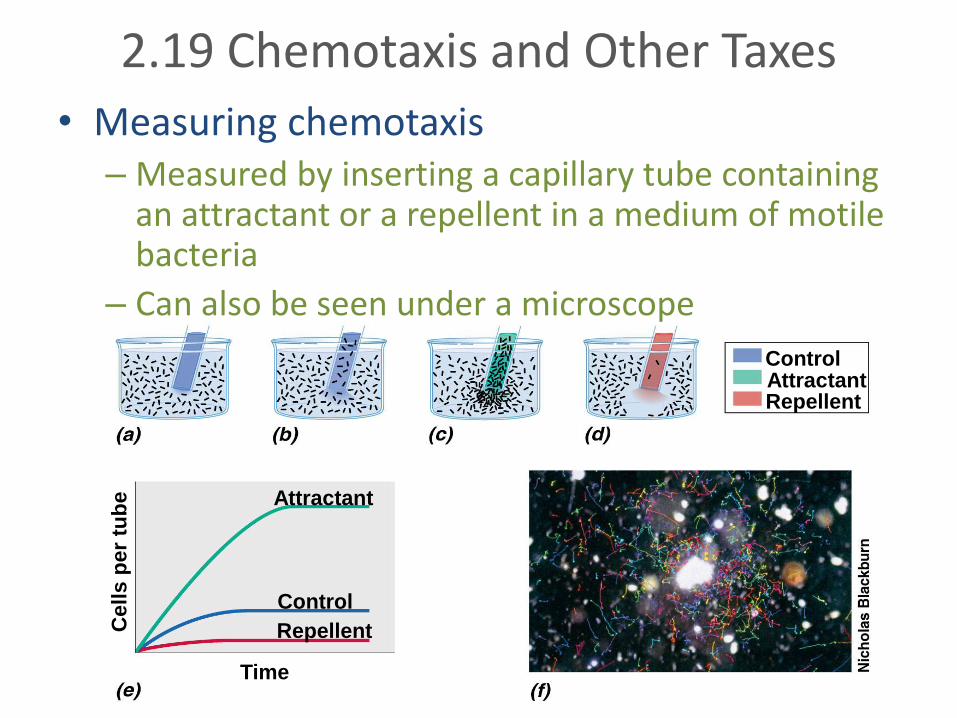
2.19 Chemotaxis and Other Taxes
• Measuring chemotaxis– Measured by inserting a capillary tube containing
an attractant or a repellent in a medium of motile bacteria
– Can also be seen under a microscope
Time
Repellent
Control
Attractant
Repellent
Control Attractant
Cells p
er
tub
e
Top Related